Understanding Economic Complexity: An Application to the MER Sector - DPRU Working Paper 202105 May 2021 - South-South Global ...
←
→
Page content transcription
If your browser does not render page correctly, please read the page content below
Understanding Economic Complexity:
An Application to the MER Sector

By Caitlin Allen Whitehead and Haroon Bhorat

DPRU Working Paper 202105
 May 2021

Understanding Economic Complexity:
 An Application to the MER Sector

 DEVELOPMENT POLICY RESEARCH UNIT

 CAITLIN ALLEN WHITEHEAD
 caitlin.allenwhitehead@uct.ac.za

 HAROON BHORAT
 haroon.bhorat@uct.ac.za

 Working Paper 202105

 ISBN 978-1-920633-87-5

 May 2021

 © DPRU, University of Cape Town 2021
This work is licensed under the Creative Commons Attribution-Non-Commercial-Share Alike 2.5 South Africa License. To view a copy of this licence,
visit http://creativecommons.org/licenses/by-nc-sa/2.5/za or send a letter to Creative Commons, 171 Second Street, Suite 300, San Francisco,
California 94105, USA.
Abstract

This paper develops a relatively novel method for identifying opportunities for diversification in the
South African Manufacturing, Engineering, and Related Services (MER) Sector. The central tenet of this
analysis is the economic complexity framework, which states that countries are able to increase their
complexity through the diversification of their economies toward increasingly complex products. By
constructing a measure of economic complexity based on a dataset of traded MER sector products, it
is shown that the most complex economies have shifted export activities toward highly complex,
manufactured goods, specifically those in the MER sector. This manufacturing-led process of structural
transformation centered around the MER sector is shown to be advantageous for both a country’s level
of economic development and its long-run prosperity. Using network analysis, a MER sector product
space, along the lines of Hidalgo et al. (2007) is used to identify optimal complexity-enhancing
diversification opportunities in the sector. South Africa is sparsely represented in this product space.
However, there is a core of automotive, rubber, and metal products, representing current productive
capabilities from which future diversification opportunities within the MER sector can emerge. These
opportunities, termed frontier products, are largely situated adjacent to the automotive sector.

Keywords:
Economic complexity; manufacturing; industrial relatedness; product space; structural
transformation; diversification

JEL codes: O13; O14; O25

Acknowledgements
This report is funded by the Manufacturing and Related Services Sector Education and Training
Authority (merSETA) and is commissioned under the “Research study for the Manufacturing
Engineering and Related Service Sectors: Understanding Economic Complexity in the merSETA Space
with a Focus on SMMEs” project. The project aims to understand the economic complexity of the MER
sector, identify complexity building industrialisation opportunities within the sector, determine
capabilities that would enable firms within the sector to exploit these industrial opportunities, and
thereby inform industrial policy.

Working Papers can be downloaded in PDF (Adobe Acrobat) format from www.dpru.uct.ac.za. A limited number
of printed copies are available from the Communications Manager: DPRU, University of Cape Town, Private Bag
X3, Rondebosch, Cape Town, 7700, South Africa. Tel: +27 (0)21 650 5701, email: sarah.marriott@uct.ac.za.

Corresponding author

Prof. Haroon Bhorat (DPRU Director)
email: haroon.bhorat@uct.ac.za

Recommended citation

Allen Whitehead, C. and Bhorat, H. (2021). Understanding Economic Complexity: An Application to the MER
Sector. Development Policy Research Unit Working Paper 202105. DPRU, University of Cape Town.

Disclaimer

The Working Paper series is intended to catalyse policy debate. They express the views of their respective authors
and not necessarily those of the Development Policy Research Unit (DPRU).

Table of Contents

Introduction ............................................................................................................................... 2

1. Structural Transformation In South Africa.............................................................................. 3

2. Understanding Economic Complexity .................................................................................... 6
 2.1 Capabilities And Complexity .......................................................................................................... 6

 2.2 Measuring Economic Complexity .................................................................................................. 8

 2.3 Economic Complexity And Economic Development ................................................................... 13

3. Analysing The Economic Complexity Of The Mer Sector...................................................... 15
 3.1 Mer Sectors And Economic Complexity: A Mapping Exercise ..................................................... 16

 3.2 The Mer Sector Complexity Index ............................................................................................... 21

 3.3 Mer Sector Product Complexity .................................................................................................. 27

4. Product Space Analysis Of The Mer Sector .......................................................................... 32
 4.1 Creating The Product Space ........................................................................................................ 32

 4.2 South Africa’s Product Space ...................................................................................................... 37

 4.3 The Mer Sector Product Space.................................................................................................... 40

5. Identifying Opportunities For Building Economic Complexity In The Mer Sector ................ 45

6. Conclusions........................................................................................................................... 51

References................................................................................................................................ 53

Appendix .................................................................................................................................. 57

 1
DPRU WP202105

INTRODUCTION

It is well known that South Africa is stuck in a long-run economic growth trap, resulting in an ongoing
policy debate on how to kick-start economic growth and development in the country. International
evidence has shown that developing countries are able to generate sustained economic growth,
thereby shifting to higher levels of national income, through following a path of rapid and intense
industrialisation. This process is often referred to as one of growth-enhancing structural
transformation, whereby productive resources shift from low- to high-productivity sectors (McMillan
& Rodrik, 2011; Herrendorf, Rogerson & Valentinyi, 2013). In the case of recent industrialisers such as
Japan, China, and South Korea, this shift has been from low-productivity agricultural activities to high-
productivity manufacturing (McMillan & Rodrik, 2011). In these Asian economies, the manufacturing
sector has remained central to the process of economic growth and structural transformation.

In contrast, the South African economy remains semi-industrialised. Between 1960 and 1970 the
manufacturing sector experienced an expansion, which Nattrass (2014) attributed to a large rise in
capital stock, accompanied by a positive growth in the manufacturing labour force. In the mid-1980s
South Africa still had a relatively large manufacturing base. However, this was undone to an extent with
the advent of trade liberalisation in the 1990s resulting in both a deterioration in employment and
manufacturing output (Kaplinsky, 1995; Edwards, 2001; Fedderke & Szalontai, 2009; Erten, Leight &
Tregenna, 2019). , South Africa exhibits characteristics of premature deindustrialisation, whereby a
boom in the services sector has overtaken the growth experienced in the manufacturing sector (Rodrik,
2016).

In this paper, a relatively novel approach of understanding South Africa’s structural transformation is
taken, by viewing this premature deindustrialisation through the lens of economic complexity. The
mechanism underlying economic complexity, as explained by Hidalgo and Hausmann (2009), states that
countries are able to increase their complexity through the accumulation of capabilities. In doing so,
countries are able to produce and diversify into increasingly sophisticated products. These are typically
manufactured products. As such, a key manufacturing sector in the South African economy – the
Manufacturing, Engineering, and Related Services sector – is examined. 1

1 The merSETA, established in terms of the skills development legislation of 1998, includes a variety of
 manufacturing activities
as well as some service and retail activities (merSETA, 2019). In this report the non-manufacturing, service and retail activities
are excluded as the analysis focuses on manufactured products and the data does not include reliable information on service
activities.

 2
Understanding Economic Complexity:
 An Application to the MER Sector

The main objectives of this are threefold. Firstly, to apply the method of economic complexity to
economic complexity of the MER sector. Secondly, to map the MER sector to the product space. Thirdly,
to use network analytics to identify a set of frontier products, or growth opportunities, within the MER
sector

Using the method outlined by Mealy and Teytelboym (2018), an index for economic complexity is
developed for the MER sector, allowing for the tracking of economic complexity relative to
manufacturing as a whole. MER sector products are then positioned in a network termed the product
space which is created based on the export structure of the particular country under consideration
(Hidalgo et al., 2007). This product space allows for the visualisation of the paths that a country can
take to diversify its MER sector product exports. To conclude this analysis, a set of products – termed
frontier products – are identified based on the paths for diversification represented by the product
space. These products offer the best opportunities to enhance complexity given the country’s current
set of capabilities (Hausmann & Chauvin, 2015; Bhorat et al., 2019). 2

1. STRUCTURAL TRANSFORMATION IN SOUTH AFRICA

Structural transformation describes the process of reallocating labour and other resources across
agriculture, manufacturing, and services (Herrendorf, Rogerson & Valentinyi, 2013). As shown by
McMillian, Rodrik and Verduzco-Gallo (2014), when resource flows are from low- to high-productivity
sectors, structural transformation can be growth-enhancing. This has been the widely documented
case of recently industrialised East Asian countries such as Japan, China, and Korea, where there has
been an aggregate shift from low-productivity agricultural activities, toward high-productivity
manufacturing (McMillan & Rodrik, 2011). This is a prime example of manufacturing-led structural
change.

However, there can be structural change which is growth-reducing, as is the case in South Africa.
Contrary to the East Asian model, South Africa is a semi-industrialised country which has started to
undergo a process termed by Rodrik (2016) as premature deindustrialisation. This is a pattern of
structural transformation whereby the manufacturing sector does not reach its full potential, with

2 The term `MER sector products’ refers to the products produced in the five MER sector chambers alone, which is not the

same thing as the manufacturing sample of products as a whole. Therefore, when the `MER economy’ is discussed, this refers
to these five chambers of product categories.

 3
DPRU WP202105

labour and other resources shifting resources from low-productivity agriculture to relatively
unproductive services instead.

Following the approach outlined in McMillian, Rodrik and Verduzco-Gallo (2014) the extent of
aggregate structural transformation in South Africa between 1995 and 2019 is examined. Figure 1
shows the correlation between the natural log of relative productivity (vertical axis) and the change of
employment by industry (horizontal). The bubbles are sized according to the sector’s share of
employment in 2019.

South Africa shows somewhat of a mixed picture. While there was a clear shrinkage in employment in
the high-productivity manufacturing sector, this collapse was offset to an extent by an even larger
reduction in employment in the agriculture sector, which exhibited the second lowest relative
productivity. 3 However, the most rapidly growing industries were relatively unproductive non-tradable
sectors such as wholesale and retail trade and construction. A notable exception was the increase in
employment in tertiary services such as transport and communications, and finance which offset some
of these negative effects.

The linear regression line in Figure 1 can be interpreted as follows: an upward sloping line means that
productive resources were shifted away from low-productivity sectors, such as agriculture, toward
higher productivity industries, like manufacturing. This is termed growth-inducing structural
transformation. Conversely, a downward trend, or one that is not statistically significant, indicates that
structural transformation has not been growth-enhancing.

In the South African case, the push-and-pull effects on the relationship between resource reallocation
and productivity result in a slightly upward sloping regression line. However, though this slope is
positive with an estimated coefficient of 0.02, this value is insignificant (p-value = 0.72), suggesting that
there is no evidence of growth-led structural transformation.

3A large contributor to the decrease in employment in the South African agricultural sector is the introduction of a minimum
wage (Bhorat, Kanbur & Stanwix, 2014). This a partly due to the shedding of part-time jobs (Bhorat, Kanbur & Stanwix, 2014).

 4
Understanding Economic Complexity:
 An Application to the MER Sector

Figure 1. Correlation between sectoral productivity and change in employment in South Africa, 1995 - 2019

Source: author’s own calculations using DataFirst (2020) and Statistics South Africa (2020).
Notes: 1. Size of circle indicates employment share in 2019. 2. β=0.02 (t-stat=0.37; p-value=0.72).
2. AGR = Agriculture; MIN = Mining; MAN = Manufacturing; PU = Utilities; CON = Construction; WRT = Wholesale & Retail
Trade; TRA = Transport Services; FIN = Financial Services; and CSP = Community, Social and Personal Services.

Manufacturing has become more capital-intensive and skill-intensive, resulting in an erosion of
unskilled employment (Edwards, 2001). Based on the high proportion of workers in South Africa which
fall into the low-skilled cohort, this shift has resulted in steadily rising unemployment. 4

There is a shift of labour resources, as represented by the employment growth in Figure 1, to the high
productivity financial services sector which is typically characterised by high proportions of skilled
workers. However, this increase in labour is overstated in the sense that a large share of this
employment growth is of Temporary Employment Service Workers who fall under the ‘Business
Services’ industry category and not finance and insurance (Bhorat, Cassim & Yu, 2016). These workers
include cleaners, support workers, and security guards – not the high-skilled workers one would expect
to find in the financial services industry (Bhorat, Cassim & Yu, 2016). From the perspective of being
labour absorbing of low-skilled workers, the issue is that the service sector is, firstly, not that big and,
secondly, it cannot act as a large source of employment like manufacturing as countries industrialise.

4 Low-skilled workers are defined as elementary occupations using the Organising Framework for Occupations. This is the
standard definition used in Statistics South Africa’s labour force surveys. Examples of workers in this category include cleaners
and helpers; labourers in mining, construction, manufacturing, and transport; and refuse workers.

 5
DPRU WP202105

Ultimately, the post-apartheid period has witnessed a manufacturing sector in South Africa which
stalled, giving way to a process of premature deindustrialisation. As a consequence, growth in the
economy has been driven and shaped by the services sector. It is not surprising then that today, South
Africa can be classified as a services-based economy, as the latter constitutes 70 percent of GDP
(Statistics South Africa, 2020).

2. UNDERSTANDING ECONOMIC COMPLEXITY

The concept of economic complexity, which is used to explain divergent patterns of economic
development and growth, is relatively new in the economic literature. This novel theory is based on the
central idea that countries which have accumulated more capabilities are able to produce a diverse
range of sophisticated products, thereby pointing to their economic complexity. This section contains
an overview of the economic complexity literature: Firstly, a conceptual understanding of economic
complexity is provided. Secondly, the various approaches that have been used to measure economic
complexity are detailed. Finally, it is shown how economic complexity explains cross-country variation
in levels of economic development, and how this can aid in an understanding of the process of
structural transformation.

 2.1 CAPABILITIES AND COMPLEXITY

The theory of economic complexity postulates that countries which are able to accumulate vast stores
of diverse capabilities enjoy higher levels of economic development and growth (Hidalgo & Hausmann,
2009; Hausmann & Hidalgo, 2011; Hausmann et al., 2014). Capabilities are more diverse and
multidimensional when compared to standard factors of production such as labour, capital, and
technology. For example, embedded within the production of high complexity ranked motor vehicles
are capabilities in mechanical engineering; automation and robotics; production of plastic composites;
development of tooling; as well as services such as logistics and supply chain management. The
emphasis of this paper is the importance of skills as a subset of capabilities which are an important
component in determining the success of building economic complexity, and in doing so, growing the
economy.

The nature of growth-enhancing capabilities requires gains in knowhow to be in tacit rather than explicit
abilities. While explicit knowledge can be obtained by reading or listening, tacit knowledge is timely and
costly to transfer (Hausmann et al., 2014). As explicit knowledge is easily transferred it allows
developing countries to potentially converge to industrialised country income levels. On the other
hand, tacit knowledge allows well-resourced countries to achieve differential growth in capabilities.

 6
Understanding Economic Complexity:
 An Application to the MER Sector

The attainment of explicit knowledge is largely the product of a country’s population developing
specialised skills, with the amount of knowledge acquired by each person being referred to as a
personbyte. The co-ordination these personbytes by way of institutions or markets creates a vast
network of diverse capabilities (Hausmann et al., 2014).

As there is no straightforward way to quantify the capabilities that a country has, these capabilities
have to be inferred indirectly. One approach to doing this is backward-engineering a measure of a
country’s available capabilities based on the portfolio of goods that it is able to export competitively.
Hausmann et al. (2014) postulate that if a country is able to export a given product competitively, it can
be inferred that the country has the capabilities required to do so. 5 Further, products requiring a large
amount of specialised knowledge to produce can only be produced in those few countries which have
the requisite capabilities.

It follows that countries which possess a wide range of capabilities are able to export a greater diversity
of goods competitively. These countries are deemed to be complex (Hidalgo & Hausmann, 2009;
Hausmann & Hidalgo, 2011; Hausmann et al., 2014). Analogously, products are said to be complex if
few countries have enough of the specialised capabilities required to export them competitively
(Hidalgo & Hausmann, 2009; Hausmann & Hidalgo, 2011; Hausmann et al., 2014).

Taken together, these observations show that countries are able to build complexity by accumulating
capabilities, allowing them to shift production away from simple products toward a large range of
complex products. While it is typically the case that these rudimentary products are often mining or
agricultural commodities, a shift in production toward more sophisticated manufactured products,
which is complexity building, is tantamount to a process of manufacturing-led structural
transformation.

The following section details the approach followed by Hidalgo and Hausmann (2009), Hausmann and
Hidalgo (2011), and Hausmann et al. (2014) to measure the complexity based on the basket of exports
that a country is able to export competitively, relative to the products traded by other countries.

5 Hausmann et al. (2014) used Balassa’s (1965) measure of Revealed Comparative Advantage (RCA) to make countries and
products comparable. For a given product, it is expected that the volume of exports of a larger country are greater than that
for a smaller country. Further, it is expected that products that comprise a large share of global exports should in turn account
for a large share of the exports for producing countries.

 7
DPRU WP202105

 2.2 MEASURING ECONOMIC COMPLEXITY

We define here, two measures of complexity – the Economic Complexity Index (ECI) – which measures
the complexity of a country, and the Product Complexity Index (PCI) – which estimates the complexity
of a product. The importance of these indices becomes clear in subsequent sections, where these
metrics are used to justify why economic complexity is relevant to the study of economic development.

The process of measuring economic complexity is data-centric, with the existence of a set of capabilities
being proxied by the ability of a country to export a related set of products competitively. In this way,
it is possible to compare the accumulated capabilities across countries using relative comparisons of
these traded products for different countries (Hidalgo & Hausmann, 2009; Hausmann & Hidalgo, 2011;
Hausmann et al., 2014).

The approach followed by Hidalgo and Hausmann (2009), Hausmann and Hidalgo (2011), and
Hausmann et al. (2014) uses international trade data to identify what products countries make, using
this information to infer their productive capabilities. 6 Two measures of complexity are derived as
follows 7: Firstly, the number of products that a country produces and exports competitively is a
measure of that country’s diversity. A country which has residents and organisations with a wide range
of different capabilities is well-equipped to produce a large variety of products. Thus, more complex
countries are those with higher diversity. This opposes longstanding economic theory, such as the
Ricardian and Heckscher-Ohlin models, which postulate that a country should specialise in the
production of a select set of products in order to gain a competitive advantage (Inoua, 2018). Secondly,
the number of countries that are able to produce a given product is that product’s ubiquity. Products
that require large volumes of capabilities can only be produced in highly complex countries where the
requisite capabilities are available. It follows that lower ubiquity is indicative of higher economic
complexity.

If the global economy is considered to be a network linking products and countries, then the diversity
of a country ( , ) is the number of products that it links to, while the ubiquity of a product ( , ) is the

6 Trade date is used in complexity analysis as it allows for the comparison across a wide cross-section of countries over long

time periods, while using a consistent set of products. Although export data is used, Hausmann et al. (2014) argue that this is
a reasonable reflection of a country’s productive structure.
7 The complexity measures used in this paper are calculated using the Python ecomplexity package developed by The Centre

for International Development at Harvard University (CID, 2019).

 8
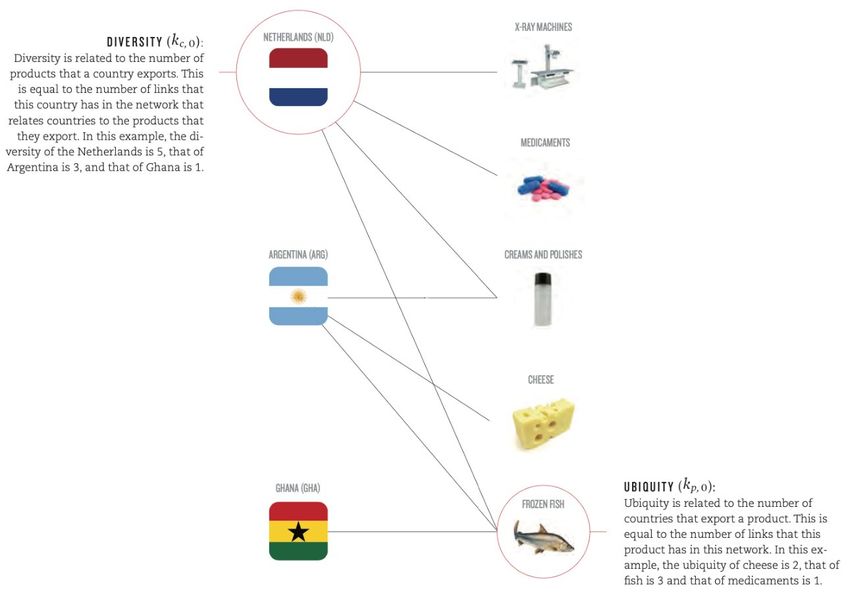
Understanding Economic Complexity:
 An Application to the MER Sector

number of countries that it is linked to. Technical Box 1 provides an illustrative example of such a
network for three countries and five products.

 Technical Box 1. Example of Ubiquity and Diversity

 Source: adapted from Hausmann et al. (2014).

 In the above example, the Netherlands has the highest complexity as it produces all five products
 (diversity=5), with two of these, X-ray machines and pharmaceuticals, only being produced by itself
 (ubiquity=1). Argentina produces creams and polishes, cheese, and frozen fish resulting in a diversity
 of 3. Taken together these products are, on average, more ubiquitous than those produced by the
 Netherlands, rendering Argentina a less complex country than the Netherlands. Ghana has the
 lowest complexity of the three countries, producing only frozen fish (diversity =1) which is also
 produced by the other two countries (ubiquity=3).

 In terms of the complexity of each product, X-ray machines and medicaments are the most complex
 as they have the lowest ubiquity (ubiquity=1) and are produced by the country with the highest
 diversity. Frozen fish has the highest ubiquity (ubiquity=3) making it the least complex product.
 Creams and polishes, and cheese have the same ubiquity (ubiquity=2), so in order to differentiate
 between the two it is necessary to consider the diversities of the countries that produce each
 product. This is done by refining the ubiquity measure of creams and polishes, and cheese by taking

 9
DPRU WP202105

 into account the average diversities of the countries that produce them (3.5 and 2.5 respectively).
 Creams and polishes are revealed to be more complex as they are produced by a set of countries
 with higher average diversity than those producing cheese.

This illustration shows that the complexity of a product, as measured by its ubiquity, can be refined by
using a measure of the average diversity of the countries that produce it. Further, precision can be
obtained by correcting this refined ubiquity measure by the average ubiquity of the countries producing
the product in question. Analogously, this adjustment process can be carried out for country
complexity, with the original diversity being corrected using the average ubiquities of the products
being produced and so forth (Hausmann et al., 2014). Formally, the incorporation of these higher order
differences into the calculation of complexity can be done using an iterative mathematical approach
call the Method of Reflections, which can be used to show that these manipulations of diversity and
ubiquity will converge at a point. The method by Mealy, Farmer, and Teytelboym (2019) circumvents
this iterative process using matrix algebra to reach the same point of convergence (we detail this
approach in Technical Box 2).

The resultant measures are the Economic Complexity Index (ECI) and the Product Complexity Index
(PCI). The ECI captures a country’s complexity by analysing patterns of similarity in the types of products
exported by other countries. Countries with similarly high ECI values tend to export highly sophisticated
products, with the opposite being true of low ECI countries, which export similarly less technical
products (Mealy & Teytelboym, 2018). Analogously, the PCI provides the same ranking for the
complexity of different products based on the similarity of the countries that export them. Therefore,
high PCI products tend to be exported by similar countries, as well as being more sophisticated (Mealy
& Teytelboym , 2018). The mathematical definitions of these two metrics are given in Technical Box 2.

 10
Understanding Economic Complexity:
 An Application to the MER Sector

Technical Box 2. Measuring Economic Complexity

As a starting point, the matrix is defined, with elements , which are 1 if country produces (1)
product with relative comparative advantage (RCA≥1), and 0 otherwise as follows:
 = 1 = 2 = 3 = 4

 = 1
 = 2
M= � �
 = 3
 = 4

Diversity ( , ) and ubiquity ( , ) are measured by summing over the rows and columns of the matrix
respectively. Diversity vector ( ) is the sum of all diversities ( , ) for all countries ( � ). Ubiquity
 � ). To show summation in the form of a
vector ( ) is the sum of all ubiquities ( , ) for all products (
 �), with the transpose being a row vector of ones
matrix equation we use a column vector of ones (
 �′ ). Formally this is defined as:
(

 , = ∑ �
 = × (2)

 , = ∑ �′ ×
 = (3)

Based on Hausmann et al. (2014) it is shown that a country’s complexity, as measured by the diversity
of the products that it produces, can be refined using the average ubiquity of the products that it
produces. Similarly, a product’s complexity, as measured by its ubiquity, can be refined using the
diversity of the country’s which produce it.

Therefore, complexity for all countries can be shown by matrix and the complexity for all products
can be shown by matrix as follows:

 (4)
 = −
 (5)
 = − ′

where, is the diagonal matrix whose elements are those of the column vector , and is defined
as the diagonal matrix whose elements are those of the row vector .

Substituting (5) into (4) and rearranging we get:

 11
DPRU WP202105

 = − − ′
 (6)
 � = − − ′ being a row-stochastic matrix (its rows sum to one), its entries can also
 With
 be interpreted as conditional transition probabilities in a Markov transition matrix. When applied to
 � as a diversity-weighted (or normalized) similarity matrix,
 country trade data, one can think of
 = − ′, reflecting how similar two countries’ export baskets are. This is shown as follows.

 � = −

 (7)

 ��⃗) associated with the second largest
 The Economic Complexity Index (ECI) is the eigenvector (
 � . 8,9 This is the eigenvector that captures the greatest amount of variance in the
 eigenvalue of
 system making it the selected measure of economic complexity. Therefore, the ECI is defined as:

 ��⃗−
 =
 � ��⃗
 � (8)

 where ��⃗
 is normalised using and , representing the average and standard deviation,
 respectively. Analogously the Product Complexity Index (PCI) is defined in terms of the eigenvector
 ��⃗) associated with the second largest eigenvalue of
 ( � as:

 ��⃗−
 = (9)
 � ��⃗
 �

 Source: author’s own calculations based on the methods of Hausmann et al. (2014), Inoua (2018), and Mealy, Farmer &
 Teytelboym (2019).

In addition to these measures, Hausmann et al. (2014) used Balassa’s (1965) measure of Revealed
Comparative Advantage (RCA) to make countries and products comparable. Technical Box 3 presents
the definition of the RCA more formally.

8 The largest eigenvalue is associated with a vector of 1’s, therefore, it does not provide much information (Hausmann et al.,
2014).
9 The correlation coefficients between �K
 ⃗ and diversity matrix, D, are used to adjust the signs for both the ECI and PCI values
so that they make sense as per the method followed in (Hausmann et al., 2014).

 12
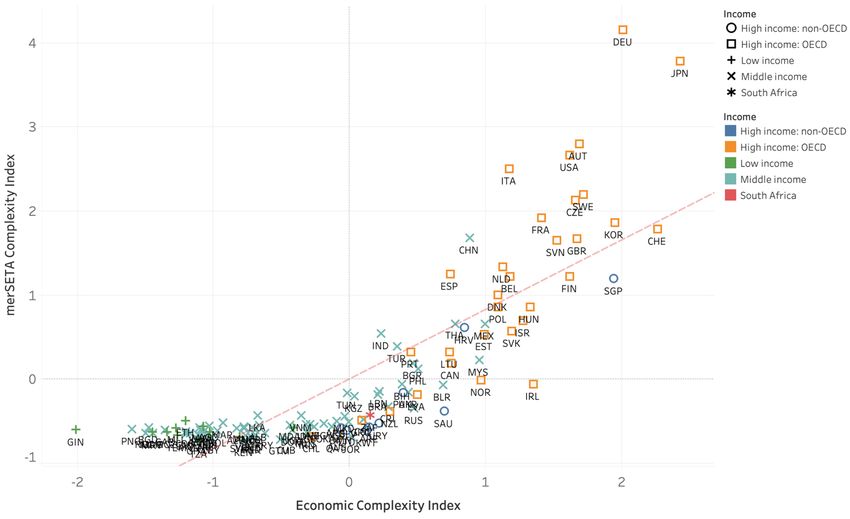
Understanding Economic Complexity:
 An Application to the MER Sector

 Technical Box 3. Revealed Comparative Advantage

 Using Balassa’s (1965) definition of Revealed Comparative Advantage (RCA), a country is shown to
 export a product competitively if the measure of RCA for that country-product combination is greater
 than or equal to 1. This rule avoids marginal exports from entering the analysis. Formally is used
 to denote the exports of country in product where the Revealed Comparative Advantage that
 country has in product is shown as:

 , ∑ ,
 = � (10)
 ∑ , ∑ , ,

 The RCA reveals the share of product in a country ’s total exports relative to the share of product
 in total global exports.

 2.3 ECONOMIC COMPLEXITY AND ECONOMIC DEVELOPMENT

The following section is concerned with the contribution of economic complexity to the economic
development literature, in other words – why complexity matters.

As shown in Hidalgo and Hausmann (2009) and Hausmann et al. (2014), the relationship between
economic complexity and economic development is positive and statistically significant. Figure 2
illustrates this positive correlation using the relationship between the ECI and real GDP per capita for
122 countries. Further, this relationship is relatively strong as evidenced by a statistically significant
correlation coefficient of 0.81. As such, countries engaging in complexity building activities stand to
experience real economic gains.

Complex countries also appear to be more prosperous, with the highest complexity economies being
from the high-income OECD cohort. The income levels of each economy are represented by different
shaped markers, with the large group of high-income countries, denoted by orange squares, being
located in the upper-right quadrant. Notable examples of high-income-complexity pairs are Germany
(DEU), Switzerland (CHE), and Sweden (SWE).

 13
DPRU WP202105

Figure 2. Relationship between GDP per capita and ECI, 2016

Source: author’s own calculations based on World Bank (2019) and The Growth Lab at Harvard University (2019).
Note: 1. Red dashed line is line of best fit (correlation=0.808, p-value=0.000). 2. The Syrian Arab Republic is excluded as no
GDP per capita information was available for the period.

At the opposite end of the spectrum, the majority of low- and middle-income countries populate the
bottom-left quadrant, for example, Guinea (GIN) and Mozambique (MOZ). Further, as anticipated,
these countries have low levels of economic development, consistent with their low economic
complexity indices.

South Africa (ZAF), denoted by the red star, is classified as a middle-income country and, as expected,
lies approximately halfway along the complexity distribution. The country’s ECI is approximately 0.15
showing that it performs favourably in comparison with all sub-Saharan African countries. In fact South
Africa is the best performer in terms of complexity on the continent, with the mean ECI in Africa being
-0.96 (Allen et al., 2019). While complexity rankings in Africa are consistently low, there is heterogeneity
across the continent with low-income countries, such as Madagascar (MDG) and Ethiopia (ETH), having
lower levels of complexity than middle-income African countries, such as Senegal (SEN) and Egypt
(EGY).

On closer inspection, while this correlation is strong and statistically significant, it is not perfect, as
shown by the addition of the regression line in Figure 2. It is shown in Hidalgo and Hausmann (2009)
that deviations from the regression line are predictive of future economic growth.

 14
Understanding Economic Complexity:
 An Application to the MER Sector

For example countries such as the India (IND), South Africa, and Greece (GRC) have approximately the
same level of complexity. However, India, lying below the regression line, is not achieving the economic
complexity that is expected given its capabilities. India’s recent rapid economic growth could be
rationalised as the country exploiting the knowledge that it already possess to become wealthier
(Hausmann et al., 2014). Conversely, Greece lies above the trend, meaning that it is more developed
than is expected based on its knowledge. Another example would be the positioning of many research-
rich economies above the regression line, achieving high levels of economic development despite the
simplicity of the few products that they produce. Examples include Kuwait (KWT), Qatar (QAT), and
Oman (OMN). The position of these countries around the trend can be interpreted as those under the
regression line having more developed structures in place to support a trajectory of rapid economic
growth, whereas those above the trend are expected to experience slower rates of economic
development (Hausmann et al., 2014).

As South Africa is situated on the regression line it can be said that its level of economic development
is aligned with the complexity of its export basket. Despite this equilibrium, in order for the country to
achieve higher levels of economic growth, it is imperative that it targets the accumulation of capabilities
that can shift the economy higher on the regression line.

3. ANALYSING THE ECONOMIC COMPLEXITY OF THE MER SECTOR

In broad terms it has been established that economic complexity may be a useful measure in order to
appreciate and understand a country’s current prosperity and future growth potential. This section
determines whether these relationships hold when considering the five MER sector chambers in
isolation – metal and engineering; automotive manufacturing; automotive components; new tyre
manufacturing; and plastics. 10 Owing to this narrow focus it is possible to determine whether there are
sector-specific factors underlying any potential linkages.

There are three components to this analysis. First, the MER sector and its constituent chambers will be
mapped to the economic complexity data to create MER sector groupings within the dataset. Second,
following Mealy and Teytelboym (2018), a complexity index is to be calculated for each chamber, as
well as for the aggregate MER sector. Using a corresponding pseudo MER sector for comparator

10 It is important to note that economic complexity data is constructed using global trade data, which pertains to merchandise

trade and not services trade. As such, we are not able to measure the complexity of the motor retail chamber. The
methodology does allow for the measuring of the complexity of the metal and engineering, automotive, automotive
component, new tyre, and plastics manufacturing sectors.

 15
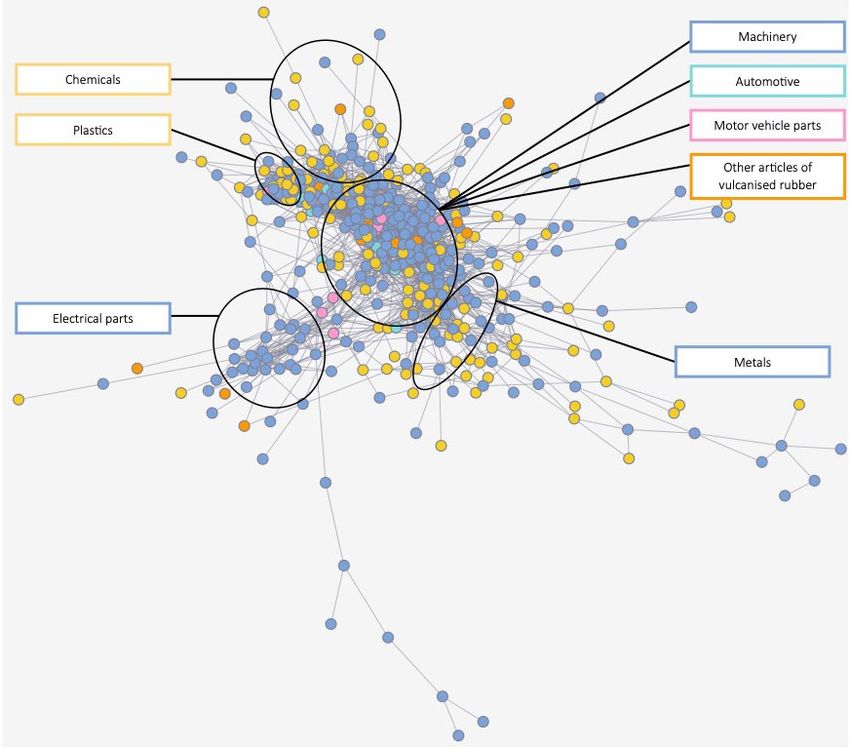
DPRU WP202105

countries, MER sector complexity levels can be compared across countries. Third, using these MER
sector complexity indices, the relative trends in economic complexity for each of these sectors are
analysed over time.

 3.1 MER SECTORS AND ECONOMIC COMPLEXITY: A MAPPING EXERCISE

The dataset required for this report is one which includes a universe of exported products along with
their export values, by country over time. In this paper a cleaned version of the UN COMTRADE
database, made available by The Growth Lab at Harvard University (2019), is used. 11 The available
variables include: the reporting country; its trade partner; the product’s Harmonised System (HS) code
and description at the 6-digit and 4-digit levels; the year; the direction of the trade (export or import);
and the value in US dollar terms.

Hausmann et al. (2014) highlighted the most limiting constraints of the UN COMTRADE data; the first
of which is the lack of data on trade in services. This is a real constraint, given ever-increasing service-
based trade, and in particular the outsourcing of services by developed countries to developing
countries (Hallward-Driemeier & Nayyar, 2018). Another limitation is the lack of data about the volume
of production of products that are not exported. On the one hand countries may produce items that
they do not export, whereas on the other hand they may re-export products that they have not
produced.

The identification of MER sector products in the trade data is made challenging by differences in the
coding of industry groupings across datasets. While trade data is collected and compiled using the
internationally accepted HS codes, the MER sector products are categorised and identified using a
South Africa-specific convention of the Standard Industrial Classification (SIC) nomenclature. Identifying
MER sector products in the trade data thus necessitates the creation of a SIC-to-HS crosswalk. The
development of this cross-walk is described in detail in Technical Box 4.

11 The Bustos & Yildirim method is used to clean the data.

 16
Understanding Economic Complexity:
 An Application to the MER Sector

 Technical Box 4. Developing a HS-SIC crosswalk

 The MER sector products are identified by their Standard Industry Classification (SIC) codes. SIC codes
 are used by Statistics South Africa (StatsSA) and based on the International Standardised Industrial
 Classification Codes 3rd revision (ISIC). The more detailed each code, the more in-depth the
 description of the product. The MER sector products were identified in the merSETA Sector Skills Plan
 (MERSETA, 2019) at the 3-digit SIC level, including an allocation of these codes to specific MER sector
 chambers. For example, the 3-digit SIC code for ‘manufacture of basic chemicals’ is 334, with the 4-
 digit SIC code within this grouping of 3343 relating to ‘manufacture of fertilizers and nitrogen
 compounds’.

 Country-level trade data, used to generate the economic complexity indices, is available from The
 Growth Lab at Harvard University (2019). These data are available for the period 1995 to 2017, when
 products are coded using the 6-digit level of the HS 1992 revision. Therefore, in order to identify MER
 sector products in the trade data, it is necessary to create a crosswalk between the trade data, coded
 using the HS classification, and the SIC classification, which is used to identify MER sector
 products/industries.

 A first step is to map the 3-digit SIC codes provided by merSETA to their 4-digit SIC counterparts. As
 the SIC code base is based on the more commonly used ISIC definitions, a conversion was performed
 making minor adjustments for cross-country differences. Following this process, a correspondence
 table between ISIC codes and 6-digit HS codes, made available from World Integrated Trade Solution
 (2019), provided the final piece of the puzzle. Due to sparse data for certain products at the 6-digit
 level, the 4-digit level of the HS system is employed. For example, the 4-digit HS code `compounded
 unvulcanised rubber’, which includes four 6-digit HS codes: compounded unvulcanised rubber;
 compounded unvulcanised rubber, plate, etc.; compounded unvulcanised rubber, primary, not
 elsewhere specified; and rubber solutions, not elsewhere specified.

Using this crosswalk, each product in the trade data is categorised as either non-MER sector or MER
sector, with the latter being further categorised into the constituent MER sector chambers – metal and
engineering, automotive manufacturing, automotive component manufacturing, new tyre
manufacturing, and plastics. For countries outside of South Africa, the allocation of products in this
manner is equivalent to creating a pseudo MER sector for each country.

Table 1 describes this dataset in terms of both global exports and those products exported by South
Africa competitively (RCA ≥ 1). Total product exports amount to 1 239 products, of which South Africa

 17
DPRU WP202105

exports 223 products – representing 18 percent of the total global non-services export basket. Within
this, MER sector export products numbering 476 with South Africa exporting 72 of these competitively,
or 15 percent of total global MER sector exports. In value terms, South Africa’s competitive exports
constitute less than 1 percent of total non-services export value globally in 2016. South Africa’s export
volumes in turn are 0.3 percent of total MER sector exports globally.

In both cases, exports are dominated by the manufacturing sector, in which MER sector products play
a vital role. Of the 1 239 products defined at the 4-digit level of the HS classification, approximately 85
percent are manufactured, with 476 products fitting within the MER sector product universe. The
relative importance of MER sector products, in a global context, is evident in the fact that products
classified as MER sector products contribute over half of total global exports (USD 8.1 trillion). Similarly,
the dominant MER sector chamber is metals, accounting for approximately two-fifths of global trade
(USD 5.5 trillion), with the next highest contributions being considerably lower at 7.1 and 6.2 percent
for plastics and automotive exports, respectively.

When breaking down South Africa’s exports by category, as in Table 1, the highest contributors to the
value of MER sector exports are the automotive and metal chambers. Each of these chamber’s account
for approximately 11 percent of South Africa’s total competitive exports. An important feature of the
metals chamber is the variety of products produced, which is a hallmark of economic complexity. In
total, approximately 17 percent of all of South Africa’s competitively exported products are metals
products. Another high contributor to the number of products which are in South Africa’s export basket
is the plastics chamber, accounting for just over one-tenth of local exported products. However, these
products are relatively low in export value – nine have an export value less than USD 10 million – and
are mostly chemical products.

It should be noted that, contrary to the rest of the world, approximately two-thirds (USD 47.4 billion)
of South Africa’s exports in terms of value are classified as primary products. 12 This is consistent with
the quantity of high value products, such as gold and platinum, which comprise approximately one-
third of the country’s competitive exports. Another interesting feature of South Africa’s competitive
exports is that non-MER sector manufactured products contribute a disproportionately smaller share
of total exports. This may be partially explained by the fact that these products are predominately low-

12 The categorisation of products as being primary products is based on Lall’s (2000) classification system of exports. In this

model, indictors of technological activity in manufacturing are used to assign products to different groupings. In the case of
primary products, goods such as fresh fruit, meal, rice, cocoa, tea, coffee, wood, coal, and other unrefined mineral resources
are included. These are the most technologically simple exports. The classification of exports as primary in this analysis has
been done to ensure that metals in their unwrought, or unrefined form, are excluded from the metals chamber.

 18
Understanding Economic Complexity:
 An Application to the MER Sector

value agro-processed products. This is evidenced by the 8.6 percent share of export value from non-
MER sector manufacturing, relative to its 39 percent share of total products exported (in count terms).
Of these products, nearly a quarter have export values of less than USD 10 million, including agro-
processing products such as bone, wool, feathers, and yarn from animal hair.

 19
DPRU WP202105

Table 1. Count and export value of products, 2016

 Number Export Value (Current US$)
 Chamber Global SA RCA % of Global % of SA RCA Global products SA RCA % of Global % of SA RCA
 products products products products (US$ M) products (US$ products products
 M)

 Primary 196 64 15.82 28.7 2 319 442 47 439 15.66 65.06
 Non-MER sector,
 567 87 45.76 39.01 4 395 091 6 239 29.68 8.56
 manufacturing

 New tyre 15 1 1.21 0.45 127 567 36 0.86 0.05

 Plastics 133 31 10.73 13.90 1 049 852 2 239 7.09 3.07

 Automotive components 9 1 0.73 0.45 487 333 138 3.29 0.19

 Metals 312 37 25.18 16.59 5 505 910 8 102 37.18 11.11

 Automotive 7 2 0.56 0.90 922 888 8 723 6.23 11.96

 Total MER sector 476 72 38.42 32.29 8 093 550 19 238 54.66 26.38

 All products 1 239 223 100 100 14 808 080 72 917 100 100
Source: author’s own calculations based on The Growth Lab at Harvard University (2019).

 20
Understanding Economic Complexity:
 An Application to the MER Sector

Having broken down the trade data used to calculate economic complexity into its constituent sectors,
it was shown that MER sector exports account for a large share of both global and domestic exports.
This finding warrants further investigation into the complexity of individual countries when considering
only MER sector products. In the following section this is operationalised by computing a relative
complexity ranking for each country in the sample using only values for MER sector exports.

 3.2 THE MER SECTOR COMPLEXITY INDEX

Following the method set out by Mealy and Teytelboym (2018), which is used to measure complexity
in the green economy, a MER sector Complexity Index (MCI) is developed. The method allows one to
compare the complexity of the MER sector, and its constituent chambers, to that of the economy as a
whole. As per the method described above, a pseudo-MER sector is created for all countries in the
trade data sample, thus allowing for a ranking of these economies based on the relative complexity of
their MER sectors.

Unlike the ECI calculated by Hausmann et al. (2014) which is estimated on the basis of the entire set of
1 239 traded products, the MCI focuses on the universe of 476 MER sector products exclusively.
Further, while the ECI is equivalent to the mean PCI of all traded products in which the country is
competitive, the MCI is the weighted average of these already calculated PCI values limited to those
MER sector products that are traded competitively.

This measure increases with both the diversity and complexity of the MER sector products that a
country is able to export competitively (Mealy & Teytelboym, 2018). 13 The method for calculating this
 for country is as follows:

 �
 = ∑ (11)

According to this definition, is a binary vector indicating whether a country has a comparative
advantage (i.e. RCA≥1) in MER sector product , then =1, otherwise it is 0. Intuitively, the
index for country can be understood as a weighted average of the PCI for all MER sector products
that a country exports competitively (RCA≥1).

13 While it is noted that a number of papers have analysed the economic complexity by specific subsets of products, examples

being green products (Huberty & Zachmann, 2011; Mealy & Teytelboym, 2018), and agricultural products (Isdardi, van
Schalkwyk & Viviers, 2015), and fibrous products (Allen et al., 2019), this research is, to our knowledge, the first of its kind to
focus on the mer sector.

 21
DPRU WP202105

 � is the PCI value for product , normalised to be between 0 and 1 as follows:
Further,

 � = −
 (12)
 −

where and are the minimum and maximum observed PCI values in the data,
respectively. This measure undergoes a final step of normalisation by subtracting the mean and
dividing by the standard deviation, consistent with the process of normalisation used to compute the
ECI.

Higher income countries have greater MCIs when compared to low- to middle-income countries. As
shown in Table 2, the lowest ten ranked countries fall into the lowest income cohort, of which four are
in sub-Saharan Africa and four in Latin America. Table 2 shows that the top ranked countries include
Germany (DEU), Sweden (SWE), and Italy (ITA), with these economies having an average MCI
approximately 1.5 times greater than their corresponding ECI. South Africa is ranked number 51 in
terms of MCI, with its MCI being 0.6 points lower than its economy-wide complexity.

 22
Understanding Economic Complexity:
 An Application to the MER Sector

Table 2. Top- and bottom-ranked countries by MCI, 2016

 MCI rank Country MCI Mean MCI ECI Mean ECI Income group
 1 Germany 4.154 2.013 High-income: OECD
 2 Japan 3.778 2.432 High-income: OECD
 3 Austria 2.796 1.688 High-income: OECD
 4 United States 2.664 1.621 High-income: OECD
 5 Italy 2.500 2.577 1.173 1.794 High-income: OECD
 6 Sweden 2.190 1.723 High-income: OECD
 7 Czech Republic 2.128 1.662 High-income: OECD
 8 France 1.917 1.413 High-income: OECD
 9 South Korea 1.858 1.950 High-income: OECD
 10 Switzerland 1.788 2.264 High-income: OECD
 ⋮ ⋮ ⋮ ⋮ ⋮
 51 South Africa -0.430 0.151 South Africa
 ⋮ ⋮ ⋮ ⋮ ⋮
 112 Jordan -0.692 0.018 Middle-income
 113 Cote d'Ivoire -0.697 -1.057 Middle-income
 114 Honduras -0.697 -0.716 Middle-income
 115 Cuba -0.698 -0.461 Middle-income
 116 Peru -0.699 -0.709 -0.709 -0.743 Middle-income
 117 Libya -0.702 -1.012 Middle-income
 118 Ghana -0.711 -1.116 Middle-income
 119 Guatemala -0.716 -0.508 Middle-income
 120 Kenya -0.733 -0.771 Middle-income
 121 Tanzania -0.748 -1.102 Low-income

Source: author’s own calculations based on The Growth Lab at Harvard University (2019).

When plotting the relationship between log GDP per capita and MCI in 2016, as in Figure 3, the
prevalence of low complexity manufacturing within the low- to middle-income income cohort is
illustrated by the large clump of countries in the bottom-left quadrant of the graph. This phenomenon
can be partly explained by a boom in services in these economies over the last decade, specifically in
sub-Saharan and Latin America. This is an example of negative structural transformation, whereby a
large share of the labour force shifts from more productive to less productive activities, such as services
and informal businesses (McMillan & Rodrik, 2011).

 23
DPRU WP202105

Figure 3. Relationship between GDP and MCI, 2016

Source: author’s own calculations based on World Bank (2019) and The Growth Lab at Harvard University (2019).
Note: 1. Correlation=0.605, p-value=0.000. 2. Red dashed line is line of best fit. 3. The Syrian Arab Republic is excluded as no
GDP per capita information was available for the period.

The dampening effect on manufacturing complexity as a product of service-led growth is most
observable in the group of low-income African countries at the bottom of the distribution including
Uganda (UGA), Mozambique (MOZ), Ethiopia (ETH), and Tanzania (TZA). China (CHN) is an outlier, with
the inclusion of high complexity products such as electronics in its export basket inflating the MCI above
that of other middle-income countries.

Where high-income economies have undergone industrialisation, the complexity of their MER sector
can exceed that of the economy as a whole, suggesting a manufacturing-led path to building
complexity. Table 2 shows the top ranked countries include early industrialisers, such as Germany
(DEU), Sweden (SWE), and Italy (ITA). Included in this group are also more recent Asian industrialisers,
such as Japan (JPN) and South Korea (KOR), with their highest value exports being electronic
components and motor vehicles. These findings reveal a positive link between a country’s shift toward
manufacturing-led production – or its structural transformation – and its economic complexity.

High-income countries that do not exhibit high levels of complexity in their MER sector exports are
predominantly those with resource-based economies, which have not prioritised industrialisation.
These countries are specialised in resource-based products, which require specialised assets and skills

 24
Understanding Economic Complexity:
 An Application to the MER Sector

to produce, rendering the country unprepared to diversify into less resource-based products. This
heterogeneity at the upper end of the income distribution means that of the 42 high-income countries
in the sample, one-third have negative MCIs, including largely resource-based countries such as Chile
(CHL), Qatar (QAT), Australia (AUS), Kuwait (KWT), and United Arab Emirates (UAE). 14 Looking at Figure
3, the failing of the linear trend to capture these dynamics could be overcome by controlling for natural
resources as was the procedure followed by Hausmann et al. (2014) for economy-wide complexity.

The dampening effect of resource-dependency is also observed in South Africa. Taken in conjunction
with the failure of the economy to fully industrialise, it is unsurprising that the country’s portfolio of
competitively exported MER sector products is considerably less complex than the equivalent measure
for the economy as a whole. Further, South Africa’s MER sector complexity is lower than is estimated
for its level of economic development and income group, as shown by the country’s position below the
regression line in Figure 3. This gap is suggestive of an underinvestment by South Africa in the MER
sector specifically, and manufacturing in general.

There is a positive relationship between economy-wide economic complexity and the complexity of the
MER sector, with similar benefits – such as higher levels of economic development and income –
accruing to high complexity countries. This is evidenced by the positive linear trend included in Figure
4, which plots the MCI against the ECI. This relationship is found to be both strong and significant with
a correlation coefficient of 0.82. This finding is important as it suggests that there is potential to build
overall economic complexity by investing resources into developing the MER sector.

14 The classification of products as resource-based is in accordance with Lall’s (2000) classification.

 25
You can also read