South Florida Comprehensive Economic Development Strategy - 2017-2022 CEDS; Draft to the South Florida Regional Planning Council, November, 2017
←
→
Page content transcription
If your browser does not render page correctly, please read the page content below
South Florida Comprehensive Economic Development
Strategy
2017-2022 CEDS; Draft to the South Florida Regional
                                              0|Page
                                                    Planning Council, November, 2017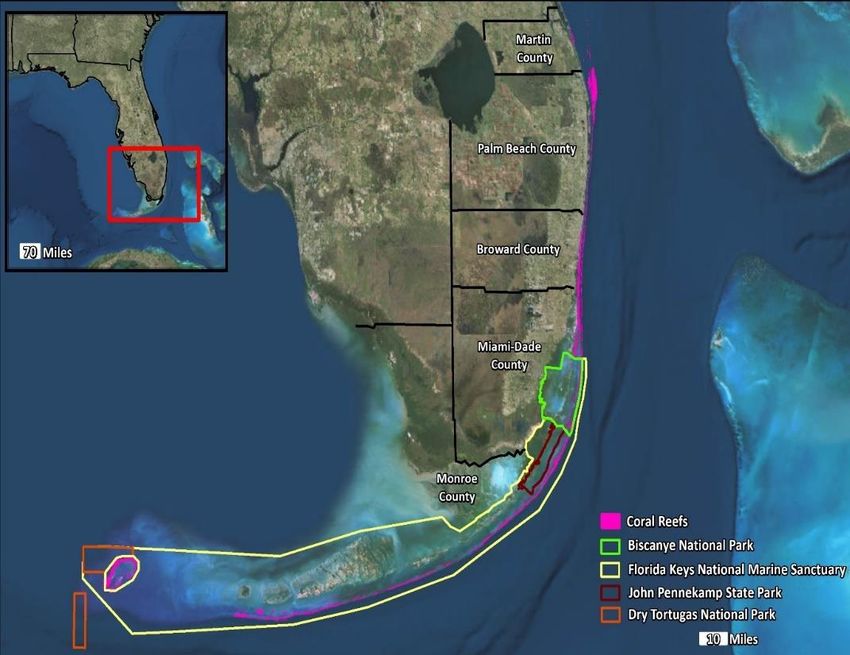
South Florida Comprehensive Economic Development Strategy: 2017–2022 1

CONTENTS                                                                                                                                 Educational Attainment .................................................................................. 23
SUMMARY BACKGROUND .......................................................................................3                              Institutions of Higher Learning .................................................................... 23
  Economic Development District .........................................................................3                             Industry Location Quotient and Brain Drain ................................................24
  Comprehensive Economic Development Strategy (CEDS) ........................3                                                         Employment............................................................................................................ 25
  Defining the Region ................................................................................................3                Equity ........................................................................................................................ 26
  Geography .................................................................................................................3           Income ................................................................................................................. 26
  South Florida CEDS: Visualized ...........................................................................4                            Poverty ................................................................................................................. 28
SWOT ANALYSIS ..........................................................................................................9              Housing and Vehicle Access.............................................................................. 29
ACTION PLAN ............................................................................................................. 10           ALICE Index ............................................................................................................. 30
  STRATEGIC DIRECTION ........................................................................................11                         Health Insurance ............................................................................................... 31
    Florida Chamber Six Pillars Matrix of Congruence .................................11                                                 County Health Rankings ................................................................................. 31
  Innovation & Competitiveness .......................................................................... 13                           Development and Density ................................................................................. 31
    Goals ..................................................................................................................... 13     Economic Conditions ........................................................................................... 32
    Objectives ............................................................................................................ 13           Energy .................................................................................................................. 33
  Performance Measures ........................................................................................ 13                     Regional Industry Clusters .................................................................................34
  Opportunity & Prosperity ................................................................................... 14                      Innovation and Technology ............................................................................... 35
    Goals ..................................................................................................................... 14       Innovation Index 2.0 – Innovation Index for US Regions .................... 35
    Objectives ............................................................................................................ 14           Bloomberg US Innovation Index ................................................................. 36
    Performance Measures ................................................................................... 14                          The Kauffman Index of Startup Activity .................................................... 36
  Vitality & Sustainability ........................................................................................ 15                Transportation Networks .................................................................................... 37
    Goals ..................................................................................................................... 15       Commuting in South Florida ........................................................................ 37
    Objectives ............................................................................................................ 15           Tri-Rail .................................................................................................................. 38
    Performance Measures ................................................................................... 15                          Ridership.............................................................................................................. 38
EVALUATION FRAMEWORK ................................................................................... 15                              Tri-Rail Coastal Link ......................................................................................... 38
ECONOMIC RESILENCE............................................................................................ 17                      Trade and Travel.................................................................................................... 39
  RESILIENCY IN SOUTH FLORIDA ...................................................................... 19                                Foreign Trade ......................................................................................................... 39
  Population Trends ................................................................................................ 20                   Seaports ............................................................................................................. 39
    Continued Growth ........................................................................................... 20                      Import and Export Trade Value ...................................................................40
    Diversity and Mobility ...................................................................................... 21                   Environmental Profile...........................................................................................40
    Place of Birth ...................................................................................................... 21         Community Participation: The CEDS Steering Committee .......................... 41
    Age & Diversity ................................................................................................. 22
  Education ................................................................................................................ 23

South Florida Comprehensive Economic Development Strategy: 2017–2022                                                                                                                                                                                                 2
SUMMARY BACKGROUND
Economic Development District
The South Florida Regional Planning Council (Council) is one of ten regional councils within Florida created to address issues and plan solutions that are
greater than local scope, as well as providing input into state policy development, the Council also serves as the only multipurpose regional entity that is
in position to plan for intergovernmental solutions to growth related problems, and meet other needs of communities in each region. The Council serves
as the Economic Development District (EDD) for three counties: Broward, Miami-Dade, and Monroe Counties residents. EDDs serve as geographic
districts for the US Economic Development Administration (EDA) to deploy various programs.
Comprehensive Economic Development Strategy (CEDS)
EDA directs each designated Economic Development District to develop and maintain a Comprehensive Economic Development Strategy (CEDS) with
the assistance of public involvement. A CEDS is a strategy-driven plan for regional economic development. A CEDS is the result of a regionally-owned
planning process designed to build capacity and guide the economic prosperity and resiliency of an area or region. Economic Development Districts
are required to fully update the CEDS every five years and can update the CEDS on an annual basis. This update includes five main sections:
• Summary Background of the economic conditions in the region;
• SWOT Analysis to identify strengths, weaknesses, opportunities, and threats;
• Strategic Action Plan incorporating tactics identified through the planning process, other regional plans, and stakeholder feedback to develop
priority strategies for the region;
• Evaluation Framework to identify and monitor performance measures associated with the plan;
• and Economic Resilience.
Defining the Region
The South Florida EDD Region is comprised of Broward, Miami-Dade and Monroe Counties. “South
Florida” often refers to the Metropolitan Statistical Area of Miami, Broward, and Palm Beach Counties or
“Miami-Fort Lauderdale-West Palm Beach.” Palm Beach County is part of the Treasure Coast Regional
Planning Council.
South Florida may also be defined by commuting patterns as the Greater Miami Area or the Miami-Fort
Lauderdale-Port St Lucie Combined Statistical Area.
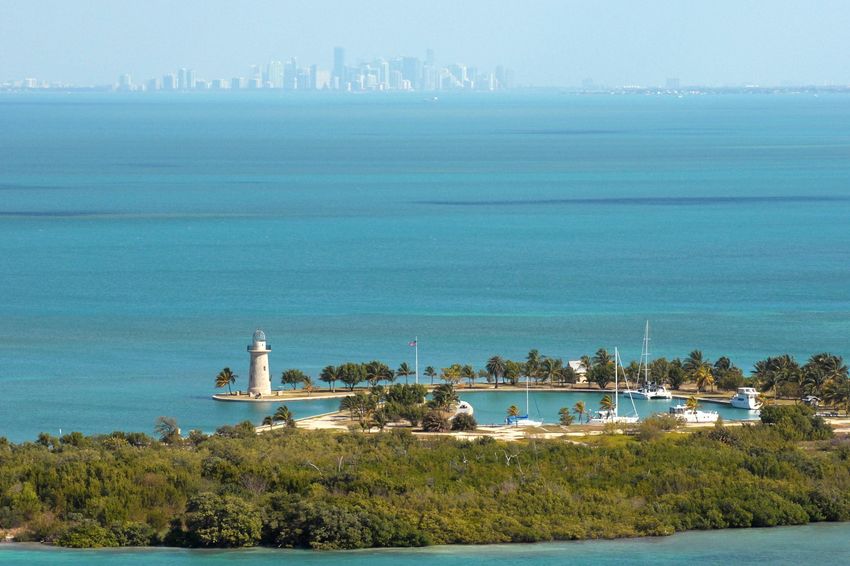
Geography
The South Florida Region is approximately 7,500 square miles, of which approximately 45% (3,338
square miles) is water.1 The region is bordered by the Atlantic Ocean to the east, the Everglades and the
Gulf of Mexico to the west, and Florida Bay and the convergence of the Atlantic Ocean and the Gulf of
Mexico to the south.
1 https://factfinder.census.gov/
South Florida Comprehensive Economic Development Strategy: 2017–2022 3
The Region is characterized by a relatively flat topography with elevations trending
downwards from the east and along the Atlantic Coastal Ridge to the west. Elevation is
generally under 10 feet above sea level, excluding the Coastal ridge where it reaches 20
feet above sea level in select areas.2

Most of South Florida’s landscape is composed of karst landforms, created through the
dissolution of the limestone bedrock by groundwater. This creates honeycombed
underground formations, subterranean tunnels, and cavities filled with freshwater,
collectively termed the Floridian Aquifer overlaid by the Biscayne Aquifer. The water table is
also very close to the surface.3

South Florida experiences a tropical climate year-round with average temperature of 77° F.
The region receives an average annual rainfall of 60 inches, mostly during the wet season
of summer and early fall.

The combination of low topography, karst substrate, and coastal proximity creates unique
environmental vulnerabilities for South Florida, exacerbated by hurricanes between June
and November every year.

    For additional information and maps,
                                               South Florida CEDS: Visualized
      please visit our CEDS: Visualized
      page, which can be found here:           For more information about many of the topics
                                               discussed in this report, please visit us online at
                                               www.sfregionalcouncil.org/CEDS_Visualized. Look
                                               for the blue text boxes throughout this report;
                                               they indicate that interactive maps are available
                                               for exploration on our website, allowing users to
                                               pan around the region and inspect a variety of
                                               spatial trends that may exist.
    sfregionalcouncil.org/CEDS_Visualized

2   https://pubs.usgs.gov/sim/3047/downloads/SIM3047.pdf
3   https://pubs.usgs.gov/ha/ha730/ch_g/G-text6.html

South Florida Comprehensive Economic Development Strategy: 2017–2022                                 4
POPULATION                                        SYSTEMS                                   HOUSING
3 COUNTIES, 71 MUNICIPALITIES                     3 PUBLIC SCHOOL SYSTEMS                   HOUSING UNITS
2010/2016 ESTIMATE                                2 PUBLIC UNIVERSITIES/3 STATE COLLEGES    2010/2016
4.32/4.63 MILLION                                 3 RELIGIOUS AND MAJOR PRIVATE             1.85/1.90
                                                  UNIVERSITIES
2030 ESTIMATE
                                                  3 INTERNATIONAL AIRPORTS                  MILLION
5.41 MILLION                                      2 SEAPORTS                                HOMEOWNER RATE
GROWTH RATE 2000-2015/2015-2030                   2 COUNTY TRANSIT SYSTEMS                  56%
15.14%/18.85%                                     1 REGIONAL RAIL                           RENTER OCCUPIED
                                                  7 MAJOR HIGHWAYS
MEDIAN AGE                                                                                  44%
                                                  3 PERFORMING ARTS CENTERS
40                                                16 STATE PARKS/3 NATIONAL PARKS
                                                                                            HOUSEHOLDS LIVING
                                                                                            BELOW ALICE
                                                                                            THRESHOLD
MALE FEMALE                             AGE
49% 51%
                   21%     17%          5-19      ECONOMIC                                  >50%
                                        20-34
                                                  GROSS DOMESTIC PRODUCT- GDP
                               21%
                                        35-64     $226 BILLION
                    41%                           THAT IS
                                        Over 65
                                                  26%
                                                  OF THE STATE OF FLORIDA’S OUTPUT AND
WHITE NON-         HISPANIC/                      1.4%
HISPANIC           LATINO
                                                  OF US’S GDP IN 2014
                                                  SOUTH FLORIDA’S EMPLOYMENT EXPECTED
                                                  GROWTH (2014-2022)
          BLACK           MULTIRACIAL
                          AND OTHER
                                                  1.4%
 OUT OF                                           UNEMPLOYMENT RATE

 2.35                    US BORN                  5.5%
 MILLION                 37.9 %
 HISPANIC/               FOREIGN BORN
 LATINO                  62.1%
 POPULATION

                  EDUCATIONAL ATTAINMENT, POPULATION OVER 25
                                                                                                   The region’s eleven private non-farm sectors with the highest levels of employment
                                                      LESS THAN HIGH SCHOOL DIPLOMA: 15.5%
                                                                                                   in 2014 accounted for 80% of regional employment.
                                                      HIGH SCHOOL DIPLOMA OR SOME COLLEGE: 54.7%   Other Industries: Mining, Forestry, Fishing, Utilities, Manufacturing, Information
                                                      BACHELOR’S DEGREE OR HIGHER: 29.7%           Management of Co, Enterprises, Educational Services, Arts and Entertainment.
POPULATION                                    SYSTEMS                                      HOUSING
 31 MUNICIPALITIES                             BROWARD COUNTY SCHOOL BOARD                  HOUSING UNITS
 2016 ESTIMATE                                 BROWARD COLLEGE, FLORIDA ATLANTIC            2010/2016
 1.85 MILLION                                  UNIVERSITY, NOVA SOUTHEASTERN                810/823
                                               UNIVERSITY
 2030 ESTIMATE                                                                              THOUSAND
                                               HOLLYWOOD/FT LAUDERDALE
 2.1 MILLION                                   INTERNATIONAL AIRPORT                        OWNER OCCUPIED
 GROWTH RATE 2000-2015/2015-2030               PORT EVERGLADES                              63.5%
 12.6%/15.9%                                   BROWARD COUNTY TRANSIT, TRI-RAIL             RENTER OCCUPIED
 MEDIAN AGE                                    SAWGRASS EXPRESSWAY
                                               INTERSTATE 75, INTERSTATE 595
                                                                                            36.5%
 40.3                                          BROWARD CENTER FOR THE PERFORMING
                                                                                            HOUSEHOLDS LIVING
MALE FEMALE                                                                                 BELOW ALICE
                                               ARTS, HOLLYWOOD CENTRAL PERFORMING
49% 51%                              AGE       ARTS CENTER
                                                                                            THRESHOLD

                     15%
                           24%
                                     ≤ 19      HUGH TAYLOR BIRCH & DR. VON D.               44%
                                     20-34     MIZELL-EULA JOHNSON STATE PARKS

                 41%       20%       35-64

                                     Over 65
                                               ECONOMIC
                                               GROSS DOMESTIC PRODUCT- GDP                                    INDUSTRY STRUCTURE %, 2015
                                               $89 BILLION
                                               THAT IS
                                               10.3%
                                               OF THE STATE OF FLORIDA’S OUTPUT AND
                                               39.2%
OUT OF                                         OF THE REGION’S OUTPUT IN 2014
                                               PER CAPITA INCOME IN 2015
497                   US BORN
THOUSAND              49.1 %                   $28,381
HISPANIC/             FOREIGN BORN             UNEMPLOYMENT RATE, JUNE 2017
LATINO                50.9%                    4.0%
POPULATION
             EDUCATIONAL ATTAINMENT, POPULATION OVER 25
                                               LESS THAN HIGH SCHOOL DIPLOMA: 11.8%
                                               HIGH SCHOOL DIPLOMA OR SOME COLLEGE: 57.4%
                                               BACHELOR’S DEGREE OR HIGHER: 30.8%
POPULATION                                         SYSTEMS                                       HOUSING
35 MUNICIPALITIES                                  MIAMI-DADE COUNTY SCHOOL BOARD                HOUSING UNITS
2016 ESTIMATE                                      FLORIDA INTERNATIONAL UNIVERSITY,             2010/2016
2.7 MILLION                                        MIAMI-DADE COLLEGE                            989
2030 ESTIMATE                                      UNIVERSITY OF MIAMI, BARRY UNIVERSITY,        THOUSAND/1.02
                                                   ST THOMAS UNIVERSITY, MIAMI                   MILLION
3.2 MILLION                                        INTERNATIONAL AIRPORT, PORT MIAMI
GROWTH RATE 2000-2015/2015-2030                                                                  OWNER OCCUPIED
                                                   MIAMI-DADE COUNTY TRANSIT, TRI-RAIL
17.7%/21.3%                                        DOLPHIN EXPRESSWAY, INTERSTATE 95,
                                                                                                 53.8%
MEDIAN AGE                                         INTERSTATE 195, PALMETTO EXPRESSWAY           RENTER OCCUPIED

39.9                                               ADRIENNE ARSHT CENTER FOR THE                 46.2%
                                                   PERFORMING ARTS, NEW WORLD CENTER,            HOUSEHOLDS LIVING
                                     AGE           AND MANY MORE                                 BELOW ALICE
MALE FEMALE
                     15%
                             23%
                                         ≤ 19      OLETA RIVER, BILL BAGGS CAPE FLORIDA,         THRESHOLD
48% 52%
                                         20-34     THE BARNACLE STATE PARKS                      55-61%
                                                   BISCAYNE & EVERGLADES NATIONAL PARKS
                    41%       21%        35-64

                                         Over 65
                                                   ECONOMIC
                                                   GROSS DOMESTIC PRODUCT- GDP                               INDUSTRY STRUCTURE %, 2015
                                                   $133 BILLION
                                                   THAT IS
                                                   15.4%
                                                   OF THE STATE OF FLORIDA’S OUTPUT AND
                                                   59.0%
 OUT OF                                            OF THE REGION’S OUTPUT IN 2014
                                                   PER CAPITA INCOME IN 2015
 1.73                     US BORN
 MILLION                  35.0 %                   $23,850
 HISPANIC/                FOREIGN BORN             UNEMPLOYMENT RATE, JUNE 2017
 LATINO                   65.0%                    4.9%
 POPULATION
           EDUCATIONAL ATTAINMENT, POPULATION OVER 25
                                                    LESS THAN HIGH SCHOOL DIPLOMA: 19.9%
                                                    HIGH SCHOOL DIPLOMA OR SOME COLLEGE: 53.2%
                                                    BACHELOR’S DEGREE OR HIGHER: 26.9%
POPULATION                                   SYSTEMS                                         HOUSING
5 MUNICIPALITIES                             MONROE COUNTY SCHOOL BOARD                      HOUSING UNITS
2016 ESTIMATE                                FLORIDA KEYS COMMUNITY COLLEGE                  2010/2016
76 THOUSAND                                  KEY WEST INTERNATIONAL AIRPORT                  52.7/53.1
2030 ESTIMATE                                MONROE COUNTY TRANSIT
                                             US1                                             THOUSAND
77 THOUSAND                                  THE KEY WEST THEATER, MARATHON COMMUNITY        OWNER OCCUPIED
GROWTH RATE 2000-2015/2015-2030              THEATRE AND MANY MORE                           61.0%
-6.8%/3.6%                                   FORT ZACHARY TAYLOR, JOHN PENNEKAMP CORAL       RENTER OCCUPIED
MEDIAN AGE                                   REEF, BAHIA HONDA, LIGNUMVITAE KEY
                                             BOTANICAL, INDIAN KEY HISTORIC, FLORIDA KEYS
                                                                                             39.0%
47.2                                         OVERSEAS HERITAGE TRAIL, WINDLEY KEY FOSSIL
                                                                                             HOUSEHOLDS LIVING
                                                                                             BELOW ALICE
                                             REEF, DAGNEY JOHNSON KEY LARGO HAMMOCK
MALE FEMALE                        AGE       BOTANICAL, SAN PEDRO UNDERWATER
                                                                                             THRESHOLD
53% 47%            20%    17%      ≤ 19      ARCHAEOLOGICAL PRESERVE, AND CURRY              46%
                                   20-34     HAMMOCK STATE PARKS
                            17%
                                   35-64     DRY TORTUGAS NATIONAL PARK
                   46%
                                   Over 65
                                             ECONOMIC
                                             GROSS DOMESTIC PRODUCT- GDP
                                                                                                         INDUSTRY STRUCTURE %, 2015
                                             $4 BILLION
                                             THAT IS
                                             0.5%
                                             OF THE STATE OF FLORIDA’S OUTPUT AND
 OUT OF                                      1.75%
 16.7                    US BORN             OF THE REGION’S OUTPUT IN 2014
 THOUSAND                52.6 %              PER CAPITA INCOME IN 2015
 HISPANIC/               FOREIGN BORN        $36,208
 LATINO                  47.4%               UNEMPLOYMENT RATE, JUNE 2017
 POPULATION
                                2.8%
            EDUCATIONAL ATTAINMENT, POPULATION OVER 25
                                                LESS THAN HIGH SCHOOL DIPLOMA: 9.1%
                                                HIGH SCHOOL DIPLOMA OR SOME COLLEGE: 59.5%
                                                BACHELOR’S DEGREE OR HIGHER: 31.4%
SWOT ANALYSIS
In August 2017, the South Florida Regional Planning Council conducted a SWOT analysis of the region –strengths, weaknesses, opportunities, and
threats- the analysis identifies what local government staff, elected officials, and community stakeholders believe to be important in each category. This
helps guide the process to identify regional priorities for economic and community development. The 2017 SWOT Analysis had 21 respondents among
the three counties of Broward, Miami-Dade, and Monroe. The results of the SWOT are shown below.
                                    STRENGTHS                                                                      WEAKNESSES
  • Higher Education student population                                              • Housing affordability (affects ability to attract/ retain talent)
  • #1 in startups                                                                   • High inequality
  • Number of STEM degrees awarded and STEM pipeline starting at youth               • Perception that the region is not a business destination
  • Gateway to Latin America                                                         • Perception that K-12 education is inadequate
  • Good weather                                                                     • Mass transit infrastructure and networks
  • Diversity of languages spoken diversity                                          • Lack of access to capital (patient, venture, other)
  • Airports and seaports                                                            • Limited number of tech startups (no leadership commitment)
  • NAP (Network Access Point)                                                       • no commitment to coordinated environmental sustainability efforts
  • Technology-friendly ecosystem                                                    • Lack of coordination to address interconnected issues
  • Regional natural resources                                                       • How do houses built/ purchased compare with occupancy rates?
  • Global/international cultural acceptance (“glocal”)                              • Intergenerational job competition
  • Healthcare Partnerships (e.g. UMiami and Cleveland Clinic)                       • Number of STEM degrees awarded is less than the number of STEM
  • Tech/life science/aviation space                                                   jobs available
                                 OPPORTUNITIES                                                                        THREATS
  • Anticipating and supporting millennials’ needs                                   • Weather
  • Leadership in climate resiliency                                                 • Examine development standards to meet emerging challenges
  • Universities, use them to develop creative, problem-solving graduates            • Brain drain
  • Partnerships with business community to create internships                       • Number of STEM degrees is less than the number of STEM jobs
  • Use certificates/vocational training to create jobs                                available
  • Create blended four-year degree and trade/vocational/hands-on                    • Housing affordability/mass transit cost burden
    programs                                                                         • Funding sources
  • Marine research hubs (R&D): four institutions in the region                      • Small businesses are not positioned to survive catastrophic events
  • Regionalism                                                                          • Economic diversification - currently very small business reliant
  • Systems are in place to assist students in completing various                        • Lack of fair share of federal and leveraged investment
    certifications                                                                       • Mindset changes needed, a more regional approach
  • Linking education to relevant regional issues                                        • Lack of infrastructure investment
  • Options that create income jobs without requiring degrees,                           • Corruption, transparency, accountability
    encouragement of entrepreneurship
  • Small business resiliency plans
  • Resiliency officers – 100 Resilient Cities

South Florida Comprehensive Economic Development Strategy: 2017–2022                                                                                      9
ACTION PLAN
Goal #1: Innovation and Competitiveness
• To support programs and strategies, including international trade, which assist in the attraction, retention, and expansion of businesses, and
improve the capacity of small businesses to participate fully in South Florida’s economic activities.
• To support complementary data collection and dissemination efforts among local jurisdictions, combining data on available “ready” sites and
workforce characteristics. Encourage the development of a complete “ecosystem” of workforce training throughout the region
• To enhance the resilience of the South Florida economy in the face of natural disasters and changes to the national and state economies through
increased awareness and preparation by businesses for environmental risks.
Goal #2: Opportunity and Prosperity
• To support the development of a diversified economy by expanding the quantity and quality of job opportunities.
• To prepare a skilled workforce that supports the business community through programs and tools that address education, training and the
attraction/retention of qualified workers.
• To promote the retention and continued improvement of existing partnerships (intergovernmental, public-private, interagency, etc.), and the
creation of new partnerships to meet South Florida's economic challenges.
• To ensure that there is a superior network of public infrastructure with supportive land use regulations to maintain the region as a competitive
location for targeted industries and to provide for public safety and homeland security.
• To educate government and businesses on continuity and recovery plans and to support plan implementation in the event of natural or man-
made disasters.
• To promote a regional perspective on multi-modal transportation system for people, goods, and services that includes transit, highway, seaport,
airport, rail, broadband, and multi-use trail planning and development.
Goal #3: Vitality and Sustainability
• To promote a high quality of life and ensure a sustainable community offering an array of affordable housing, quality education and healthcare
systems, historical and cultural facilities, tourist attractions and beaches, special events, festivals, and sports.
• To promote the sustainable use of the natural resources (especially water resources and green building through sound economic development
activities consistent with environmental management goals.
South Florida Comprehensive Economic Development Strategy: 2017–2022 10STRATEGIC DIRECTION As South Florida continues to emerge as a globally connected metropolitan area, the EDD continues to develop robust goals with implementation action tactics that address the CEDS goals for the next five years. While some of these threats cannot be changed -ie. hurricanes or annual king tides-- current weaknesses threat the quality of life of residents and business owners. These same weaknesses and threats impact the ability of these to bounce back if catastrophic events occur or a single South Florida-reliant industry falls into decline. , the South Florida CEDS provides a strategy for resilient regional development through the lens of the State of Florida’s Six-Pillars framework, which includes Talent Supply and Education, Innovation and Economic Development, Infrastructure and Growth Leadership, Business Climate and Competitiveness, Civic and Governance Systems, and Quality of Life and Quality of Place. By using this framework and incorporating each of the three counties’ comprehensive plans, the South Florida CEDS successfully identifies existing vulnerabilities—such as critical infrastructure in flood-prone areas along the coast—and provides a plan of action for lessening the regional economy’s exposure to hazards. Florida Chamber Six Pillars Matrix of Congruence Innovation & Economic Development – Economic Leadership Business Climate & Competitiveness - Smart, Quality Growth South Florida’s prosperous economy continues to grow because of its trade infrastructure, access to global markets, business tax environment, culture and diversity, and its entrepreneurial and talented workforce. Even so, many of the region’s residents are not fully employed or connected to the larger economy. The region has a long tradition of entrepreneurship and small business success. What are the benefits of attracting and retaining larger businesses and increasing interest and spending in sectors such as research and technological development? How do we define business size and what local characteristics attract larger businesses? How do we make sure that we continue to concurrently support smaller businesses in these efforts? Talent Supply & Education – Education Education serves as a firm foundation on which to expand access to opportunity for all members of our community. It provides a pathway to employment and economic opportunity, and allows individuals to explore their interests, potential, and purpose to create a higher quality of life. In addition to strong traditional primary, secondary, institutions of higher learning, and technical and vocational schools, the opportunity for continued education at all ages is critical in the development of quality communities and robust economies. As a major business and tourist destination, South Florida is home to residents from all over the world who bring with them diverse skills, educational backgrounds, culture, and experiences that contribute to the regional economy. This diversity of culture and experience can be fully tapped when educational attainment and community engagement are priorities. Infrastructure & Growth Leadership – Environment Maintaining affordable housing and smart land use planning in South Florida’s communities is essential in fostering thriving families and neighborhoods. As a primary building block of prosperity, these factors impact the entire population, from very low-income and middle-class residents, to upper-middle class and wealthy individuals and families, especially during times of unemployment to economic downturn. Affordable housing is particularly needed for families who pay more than 30 percent of their income for housing. In Palm Beach, Broward and Miami-Dade counties, 25 percent of households South Florida Comprehensive Economic Development Strategy: 2017–2022 11
spend more than half of their incomes on housing costs, giving the region the second highest cost burden in the country 4. To cater to the array of needs
within our communities, we must strive to provide a diverse mix of housing styles, locations, and costs.

Land use describes the ways in which we utilize, manage, and modify our built and natural environments, including urban development, agriculture,
parks, and natural ecosystems, and has an overwhelming impact on a region’s economy, sustainable growth, preservation of natural habitat, and quality
of life. Through careful examination of existing conditions and thoughtful planning for the future, South Florida can continue to prosper without
sacrificing natural resources or wastefully utilizing developed space.

Quality of Life & Quality of Place
Advancing the quality of life in South Florida’s communities is paramount in maintaining the vibrancy and vitality of the region; with proper attention to
this indicator, the region will flourish with exceptional economic development and growth opportunities. Quality of life is a broad category with many
indicators; examples include access to parks and natural areas, walkability of communities, and presence of cultural attractions, among others.
The health of our residents is equally important; recognizing the correlation between how we plan and build and the health of our communities is vital.
Ensuring access to healthcare, recreation, and healthy food are all components of planning quality metropolitan areas. Recognizing and evaluating these
factors can also assist in developing vulnerability assessments to determine areas that may need additional attention or funding.

Civic & Governance System – Fragmented Region
Demographics are statistical data about the characteristics of a population or segment of a larger population, including age, income, race, gender, etc.
These metrics provide general information about a region or community that can then be used to answer more complex questions about a population.
This section of the CEDS will serve to provide some baseline information about the communities in South Florida in generalized terms, allowing the user
to apply the information as specifically needed.

The Greater Miami Metropolitan Area is one of the largest economic hubs in the country, and as a result, significant demand is put on the region’s
transportation networks. Unlike some metropolitan regions that emanate outwards from one or more central business districts, South Florida is bordered
by the Everglades to the west and the Atlantic Ocean to the east. Interstate 95 and Florida’s Turnpike are the two major north-south arteries, like legs of
a ladder. Historically, development began along the coast and grown west over time. As population and developed areas grow, greater strain is put
upon our transportation networks and there is a need for more connections.

At present, the Tri-Rail commuter line runs regularly between West Palm Beach and Miami, and county and municipal bus lines serve communities
throughout the region. However, these systems are presently struggling to keep pace with increased population growth, traffic congestion, and a desire
for alternative methods of transit.

4
    http://www.sun-sentinel.com/business/realestate/fl-housing-cost-burden-20160621-story.html

South Florida Comprehensive Economic Development Strategy: 2017–2022                                                                                    12
Innovation & Competitiveness
Goals
• To support programs and strategies, including international trade, which assist in the retention, expansion and the attraction of businesses, and
improve the capacity of small businesses to participate fully in South Florida’s economic activities.
• To support complementary data collection and dissemination efforts among local jurisdictions, combining data on available “ready” sites and
workforce characteristics. Encourage the development of a complete “ecosystem” of workforce training throughout the region
• To enhance the resilience of the South Florida economy in the face of natural disasters and changes to the national and state economies through
increased awareness and preparation by businesses for environmental risks.
Objectives
• Support organizations that increase international trade, achieve a positive trade balance with partners
o Provide technical assistance to organizations such as MIA, FLL, Key West Airport and Port Miami, Port Everglades, Port Miami.
• Invest in small business training and incubators
o Support efforts by higher education institutions and others by providing technical support and support grant opportunities and the
development of venture capital.
• Coordinate activities regarding all Goals to enhance the workforce and employment opportunities
o Coordinate data sharing, communication with partners regularly to ensure that data needs are met
• Train government staff and disseminate information to the public on recovery plans and contingency actions before, during and after disasters
o Maintain informational programs, update data and prepare studies to update future information
Performance Measures
Goal Metrics 6 Pillars Correspondence Source
Goal #1: Innovation and Competitiveness
Average wages per Job Business Climate and Competitiveness US Bureau of Economic Analysis
Gross Domestic Product Business Climate and Competitiveness REMI PI+
Employment by Industry Business Climate and Competitiveness REMI PI+
Employment by Sector or Occupation Business Climate and Competitiveness REMI PI+
Average Annual Wages by Industry Business Climate and Competitiveness REMI PI+
Tourism Development Tax Collections Innovation and Economic Development FL Department of Revenue, Local Govt Tax Receipts by
County
Trade Imports and Exports Innovation and Economic Development REMI PI+
Regional Purchase Coefficient Innovation and Economic Development REMI PI+
Shift-Share Innovation and Economic Development REMI PI+
Location Quotients Innovation and Economic Development REMI PI+
Innovation Index Innovation and Economic Development http://statsamerica.org/ii2/overview.aspx
South Florida Comprehensive Economic Development Strategy: 2017–2022 13Opportunity & Prosperity
Goals
• To support the development of a diversified economy by expanding the quantity and quality of job opportunities.
• To prepare a skilled workforce that supports the business community through programs and tools that address education, training and the
attraction/retention of qualified workers.
• To promote the retention and continued improvement of existing partnerships (intergovernmental, public-private, interagency, etc.), and the
creation of new partnerships to meet South Florida's economic challenges.
• To ensure that there is a superior network of public infrastructure with supportive land use regulations to maintain the region as a competitive
location for targeted industries and to provide for public safety and homeland security.
• To educate government and businesses on continuity and recovery plans and to support plan implementation in the event of natural or man-
made disasters.
• To promote a regional perspective on multi-modal transportation system for people, goods, and services that includes transit, highway, seaport,
airport, rail, broadband, and multi-use trail planning and development. (Pillar 3)
Objectives
• Invest in STEM education, showing gains in total graduates in each higher education class
o Recruit top-notch faculty to higher education institutions, market the region to relocating firms
• Invest in apprenticeship programs to enhance the workforce
o Support organizations such as AmSkills in identifying the program’s impacts on the workforce
• Strengthen partnerships with existing regional organizations, look for opportunities for joint projects
o Host regional roundtables around topics of mutual interest
• Invest in public infrastructure and retain industrial and developable parcels
o Conduct regional land use inventories
• Train government staff and disseminate information on plans and contingency actions before, during and after disasters
o Maintain informational programs, update data and prepare studies to update future information
• Consider alternatives to projects that discourage multi-modalism, accounting for all users of the system
o Encourage widespread use of design charrettes and other venues for public input into project development
Performance Measures
Goal #2: Opportunity and Prosperity
High School Graduation Rates Talent Supply and Education FL Dept. of Education, Data Publications and Reports:
Students
Population Counts, Estimates, and Projections Talent Supply and Education BEBR, FL Statistical Abstract
Annual Building Permits Infrastructure and Growth Leadership
Daily Vehicle Miles Traveled Infrastructure and Growth Leadership FDOT, FL Highway Mileage and Travel Report, Summary
since 1990
Average Annual Unemployment Rates Talent Supply and Education Florida Department of Economic Opportunity Local Area
Unemployment Statistics
Employment by Industry Talent Supply and Education REMI PI+
South Florida Comprehensive Economic Development Strategy: 2017–2022 14Employment by Sector or Occupation Talent Supply and Education REMI PI+
Average Annual Wages by Industry Talent Supply and Education REMI PI+
Vitality & Sustainability
Goals
• To promote a high quality of life and ensure a sustainable community offering an array of affordable housing, quality education and health care
systems, historical and cultural facilities, tourist attractions and beaches, special events, festivals, and sports. (Pillar 6)
• To promote the sustainable use of the natural resources (especially water resources and green building through sound economic development
activities consistent with environmental management goals. (Pillar 6)
Objectives
• Support local decision makers with regular data updates
o Prepare annual data updates of the CEDS document, assist other organizations with data as needed
• Maintain best practices regarding the natural environment and its interactions with the built environment
o Maintain ongoing monitoring programs and prepare studies that shed light on ongoing activities on regional natural resources
Performance Measures
Goal #3: Vitality and Sustainability
Registered 501©3 Organizations Public and Private Civic and Governance System Internal Revenue Service, Exempt Business Master File,
Foundation Charities Quality of Life and Quality of Places 501c3 Charities, The Urban Institute, National Center
for Charitable Statistics
Real Personal Pet Capita Income Quality of Life and Quality of Places REMI PI+
Relative Housing Price Quality of Life and Quality of Places REMI PI+
Percent of persons Living in Poverty Quality of Life and Quality of Places US Census
EVALUATION FRAMEWORK
Innovation and Competitiveness The evaluation framework identifies the metrics used and which
pillar the metric is related to. These metrics will be updated
•Innovation and Economic Development, Business Climate and Competitiveness periodically to monitor progress on the goals and objectives
Opportunity and Prosperity they intend to ensure are being achieved.
•Talent Supply and Education, Infrastructure and Growth Leadership
Vitality and Sustainability
•Quality of Life and Quality of Places' Civic and Governance System
South Florida Comprehensive Economic Development Strategy: 2017–2022 15Goal Metrics 6 Pillars Correspondence Source
Goal #1: Innovation and Competitiveness
Average wages per Job Business Climate and Competitiveness US Bureau of Economic Analysis
Gross Domestic Product Business Climate and Competitiveness REMI PI+
Employment by Industry Business Climate and Competitiveness REMI PI+
Employment by Sector or Occupation Business Climate and Competitiveness REMI PI+
Average Annual Wages by Industry Business Climate and Competitiveness REMI PI+
Tourism Development Tax Collections Innovation and Economic Development FL Department of Revenue, Local Govt Tax Receipts by
County
Trade Imports and Exports Innovation and Economic Development REMI PI+
Regional Purchase Coefficient Innovation and Economic Development REMI PI+
Shift-Share Innovation and Economic Development REMI PI+
Location Quotients Innovation and Economic Development REMI PI+
Innovation Index Innovation and Economic Development http://statsamerica.org/ii2/overview.aspx
Goal #2: Opportunity and Prosperity
High School Graduation Rates Talent Supply and Education FL Dept. of Education, Data Publications and Reports:
Students
Population Counts, Estimates, and Projections Talent Supply and Education BEBR, FL Statistical Abstract
Annual Building Permits Infrastructure and Growth Leadership
Daily Vehicle Miles Traveled Infrastructure and Growth Leadership FDOT, FL Highway Mileage and Travel Report, Summary
since 1990
Average Annual Unemployment Rates Talent Supply and Education Florida Department of Economic Opportunity Local Area
Unemployment Statistics
Employment by Industry Talent Supply and Education REMI PI+
Employment by Sector or Occupation Talent Supply and Education REMI PI+
Average Annual Wages by Industry Talent Supply and Education REMI PI+
Goal #3: Vitality and Sustainability
Registered 501©3 Organizations Public and Civic and Governance System Internal Revenue Service, Exempt Business Master File,
Private Foundation Charities Quality of Life and Quality of Places 501c3 Charities, The Urban Institute, National Center for
Charitable Statistics
Real Personal Pet Capita Income Quality of Life and Quality of Places REMI PI+
Relative Housing Price Quality of Life and Quality of Places REMI PI+
Percent of persons Living in Poverty Quality of Life and Quality of Places US Census
South Florida Comprehensive Economic Development Strategy: 2017–2022 16ECONOMIC RESILENCE EDA has expanded the range of topics that Districts must consider in their CEDS to include resiliency in the economy. Resiliency takes on many forms but its critical definition entails how flexible and ‘tough’ a region’s economy is under adverse conditions. As with the relatively quick recovery from the 2008 recession, the South Florida economy produces a wide enough range of services and goods that any one event is unlikely to inflict unrecoverable damage in the event of an environmental disaster. However, there many potential risks that require more attention to the issue in the South Florida CEDS. What is Economic Resiliency? A resilient economy is one where pre-existing economic conditions or vulnerability to natural disasters does not create a situation where a major adverse event can cause irreversible damage. For example, New Orleans is a city that has not yet recovered from Hurricane Katrina and. The reasons why New Orleans has not returned to its pre-hurricane population are manifold, but an economy that is over-dependent upon tourism, where a significant share of its displaced population lacked transportation access, skills and personal resources to return to the city and rebuild are fundamental causes in the city’s overall population decline since 2006. More recently, South Florida will take time to recover from Hurricane Irma. They Florida Keys are also heavily reliant on the tourism industry, therefore any displaced workforce with little or no safety net or resources will take time to return. Facing the Atlantic Ocean and susceptible to hurricanes and flooding events, the South Florida Area shares some of the characteristics of an environmentally vulnerable region. As such, the region could face devastating damage should a powerful hurricane score a direct hit on the area. Regions reliant on a single industry are vulnerable to high stress when faced with changes. A resilient economy is one that is based upon well managed infrastructure, functioning insurance markets and capable emergency response measures as key elements of a region’s ability to recover from natural disaster. But there are specifically economic characteristics of resiliency. A resilient economy is one which can withstand long-term changes to industry, can manage the impacts of disaster through a combination of self-supply of key goods and with access to key goods when self-supply sources are limited by circumstances. Generally, EDA identifies three primary attributes of a resilient economy: the ability to recover quickly from a shock, the ability to withstand a shock, and the ability to avoid the shock altogether. As such, economic resiliency should be characterized by: • Widespread knowledge of how to respond to emergency situations • A flexible intellectual and creative economic base that can respond to long term economic trends • A highly-trained workforce that can retrain to other industries • A broad range of robust industries that are independent of each other • Adequate transportation and communication infrastructure that can adapt to temporary changes in the supply chain South Florida Comprehensive Economic Development Strategy: 2017–2022 17
Supporting economic resiliency in a CEDS context
The CEDS establishes a process to bring public and private stakeholders together to plan for economic resilience by identifying the issues, setting goals
and actionable responses. As EDA notes on its website5, these actionable responses include (regional responses are in blue):

      1.   Undertaking efforts to broaden the industrial base with diversification initiatives, such as targeting the development of emerging clusters or
           industries that (a) build on the region’s unique assets and competitive strengths; and (b) provide stability during downturns that
           disproportionately impact any single cluster or industry;
               a. Undertaken by South Florida Economic Development Organizations
      2.   Adapting business retention and expansion programs (e.g., economic gardening or other enterprise supports) to assist firms with economic
           recovery post-disruption;
               a. Undertaken by South Florida Economic Development Organizations
      3.   Building a resilient workforce that can better shift between jobs or industries when their core employment is threatened through job-driven skills
           strategies and support organizations;
               a. Undertaken by South Florida Economic Development Organizations
      4.   Maintaining geographic information systems (GIS) that link with municipal business licenses, tax information, and other business establishment
           data bases to track local and regional “churn” and available development sites. GIS can also be integrated with hazard information to make rapid
           post-incident impact assessments;
               a. Partly undertaken by South Florida Economic Development Organizations and the South Florida Regional Planning Council
      5.   Ensuring redundancy in telecommunications and broadband networks to protect commerce and public safety in the event of natural or
           manmade disasters;
               a. Emergency Services
      6.   Promoting business continuity and preparedness (i.e., ensuring businesses understand their vulnerabilities—including supply chains—in the face
           of disruptions and are prepared to take actions to resume operations after an event);
               a. Promoted by utilities and the South Florida Regional Planning Council
      7.   Employing safe development practices in business districts and surrounding communities. Strategies may include locating structures outside of
           floodplains, preserving natural lands that act as buffers from storms, and protecting downtowns and other existing development from the
           impacts of extreme weather.
               a. Local government responsibility, varying levels of success
      8.   Conducting pre-disaster recovery planning to define key stakeholders, roles, responsibilities, and key actions;
               a. South Florida Regional Planning Council

5
    https://www.eda.gov/ceds/content/economic-resilience.htm

South Florida Comprehensive Economic Development Strategy: 2017–2022                                                                                      18
RESILIENCY IN SOUTH FLORIDA
Key Strategies for Success:
• Continue to engage with local, state, and federal entities to advance regional adaptive capacity through climate change and sea-level rise
planning initiatives, including the use of funding prioritization tools, vulnerability assessment trainings, and inter-agency and inter-governmental
coordination.
• Improve communication and outreach with the general public and business communities via coordinated education campaigns that focus on
environmental conservation, natural disaster emergency preparedness, and local sustainability initiatives.
• 3)Dissemination of current data, support for ongoing local monitoring, and incorporation of up-to-date projections
Climate Change and Natural Disasters: South Florida Regional Planning Council (South Florida Economic Development District)
Recognizing their heightened vulnerability to natural hazards and economic downturns, the South Florida Regional Planning Council (SFRPC) was one of
the first organizations to effectively and comprehensively integrate resilience into their Comprehensive Economic Development Strategy (CEDS). For the
three counties within the SFRPC region—Monroe, Miami-Dade, and Broward—long-term economic competitiveness is directly tied to their ability to
balance growth and development with the opportunities and limitations posed by both natural and manmade hazards.
Southeast Florida is expected to experience 3–7 inches of sea level
rise by 2030 and 9–24 inches by 2060.6 With an increasing
frequency of flooding at high tide and salt water intrusion into the
Biscayne Aquifer during droughts, the effects of rising sea levels are
already being felt throughout the region.7 In addition to this
looming threat, the danger of hurricanes also holds the potential
for substantial economic disruption on an annual basis. When
combined with the fact that the regional economy has been
historically reliant on tourism and growth-related industries that are
more susceptible to economic instability, there is a clear need to
diversify the region’s economy and institutionalize the concept of
resiliency.
Figure 1: USACE relative sea-level change projections, Miami Beach. 1992 as baseline year.
To ease the burden that these risks place on residents, business
owners, and potential private investors, the South Florida CEDS provides a strategy for resilient regional development through the lens of the State of
Florida’s Six-Pillars framework, which includes Talent Supply and Education, Innovation and Economic Development, Infrastructure and Growth
Leadership, Business Climate and Competitiveness, Civic and Governance Systems, and Quality of Life and Quality of Place. By using this framework and
incorporating each of the three counties’ comprehensive plans, the South Florida CEDS successfully identifies existing vulnerabilities—such as critical
infrastructure in flood-prone areas along the coast—and provides a plan of action for lessening the regional economy’s exposure to hazards. Examples
6
http://www.nado.org/wp-content/uploads/2014/08/FL-South-Florida-Regional-Planning-Council-2012-2017.pdf p. 58
7
http://www.nado.org/wp-content/uploads/2014/08/FL-South-Florida-Regional-Planning-Council-2012-2017.pdf p. 58
South Florida Comprehensive Economic Development Strategy: 2017–2022 19of these recommendations include ensuring that public infrastructure investments are made in locations that are most likely to be viable for at least the
expected life of the project, fostering economic diversity by nurturing emerging industries and entrepreneurial ventures, and supporting comprehensive
emergency management planning to enhance preparedness and continuity in the face of disruptions.8
DATA TABLES AND REGIONAL FACTS
Population Trends
Continued Growth
The Region is home to 4.67 million people, a population larger than 26 individual states. 9 This is an 8.05% increase represents from 4.32 million in 2010.
This growth in population can be attributed to net international migration, natural growth, and domestic migration.
South Florida’s population is highly mobile, combining a large influx of
Population Projections by Geography: 2010–2045
international migration with large intra-regional shifts and a significant
number of domestic migrants. Although the Region’s population is still 7,000
Thousands
slightly older than the rest of the nation, having been a popular 6,000
retirement destination for decades, it is getting older more slowly now
because of a reduction in the number of new retirees arriving, a higher 5,000
rate of natural increase of the population (births minus deaths), and
Population
4,000
continued international migration.
3,000
Population growth rates fell significantly in South Florida during the
2,000
first decade of this century (only 9.1% for the entire decade, down from
21.0% in the decade before), mostly in response to the global recession, 1,000
beginning in 2007. During the first half of the current decade, South
Florida resumed growth, at almost twice the pace of the nation as a 0
2010 2015 2020 2025 2030 2035 2040 2045
whole—the Region’s population grew by 8.1%, compared to 7.8% for Broward 1,748,0 1,854,5 1,940,7 2,038,4 2,117,2 2,182,2 2,237,8 2,290,8
the State of Florida and only 4.1% for the U.S. Between 2015 and 2030, Miami Dade 2,496,4 2,700,7 2,861,3 3,048,6 3,220,0 3,374,2 3,515,7 3,642,7
South Florida is projected to add a net ~140 residents per day, which Monroe County 73,090 76,047 76,223 76,458 76,943 77,227 77,122 76,968
would represent an increase of over 780,000 people (see Figure 1). For SF Region 4,317,6 4,631,3 4,878,3 5,163,5 5,414,1 5,633,7 5,830,7 6,010,5
the Region, that represents an increase of ~18.5%, compared to the
State of Florida’s projected growth of 21.5% and the U.S. pace of 11.6%.
Miami-Dade County is expected to lead South Florida’s growth, with an Figure 2: Population projections by geography in South Florida, 2010 U.S. Census Bureau, 2015 5-
year ACS Estimates, and BEBR Projections June 2016
~21% increase between 2015 and 2030, followed by Broward County
(~16%); Monroe County’s permanent resident population is projected to remain essentially unchanged (~0.5%).
8
http://www.nado.org/wp-content/uploads/2014/08/FL-South-Florida-Regional-Planning-Council-2012-2017.pdf p 11 and p?
9 ACS data is published every year. 2016 U.S. Census data shows the region is home to 4.6 million people.
South Florida Comprehensive Economic Development Strategy: 2017–2022 20South Florida's population is slightly older than the rest of the nation, but 100%
younger than the rest of the State of Florida. The Region’s median age in Foreign born
90%
2015 was 40.1, compared to 41.8 in the State of Florida and the national Native, born outside the US
average of 37.8. The median was higher in Monroe (47.2), but lower in 80% Born in other state in the US
Miami-Dade (39.9) and Broward (40.3). 70%
Born in state of residence
60%
Diversity and Mobility
International migration, domestic migration and natural increase all 50%
contribute to population growth in South Florida. During the first half of the 40%
current decade, the Region absorbed almost 348,000 new residents, of which
over 80% arrived as international migrants10. Natural increase (the excess of
30%
births over deaths) contributed 100,000 new residents. In contrast, the Region 20%
lost approximately 47,000 residents to net domestic out-migration (includes 10%
foreign-born and native). In 2015, 44% of the Region’s residents were born
abroad, up from 26% in 1980 (see Figure 2). The flow of migrants in and out 0%
Monroe Miami-Dade Broward South Florida Florida US
of the Region contributes to the exceptional diversity in the cultural, as well Figure 4: Place of origin by geography, 2015 5-year ACS estimates.
as ethnic and
racial, composition of South Florida's population.
Place of Birth
Native 55.76% and Foreign Born 44.23%. Of the native population, 59% were born Florida,
35% born in another state, and 6% born abroad. Median age of residents born in the Florida
is 20. Of those born in other state the median age is 51. For foreign born the median age is
48.
Of foreign born, 75% are from Latin America (Central and South America, Mexico, and the
Caribbean), and increase from 66% in 1990. Most of those from Latin American hail from the
Caribbean.11 Of foreign born South Florida residents, ~55% entered the country prior to the
year 2000.
Figure 3: Florida in-migration, 2010-2014. Source: Wang and Rayer, 2016.
10 U.S. Bureau of the Census, Population Estimates, July 1, 2015 (March 2016; http://www.census.gov/programs-surveys/popest/data/data-sets.2015.html)
11 http://www.migrationpolicy.org/data/state-profiles/state/demographics/FL
South Florida Comprehensive Economic Development Strategy: 2017–2022 21You can also read