Does Broadband Boost Local Economic Development? - Jed Kolko with research support from Davin Reed
←
→
Page content transcription
If your browser does not render page correctly, please read the page content below
Does Broadband Boost
Local Economic Development?

January 2010

Jed Kolko
with research support from Davin Reed

Supported with funding from The David A. Coulter Family Foundation
Summary
          “Broadband” refers to high-speed Internet service that—unlike dial-up modem service—is always “on.” This
          technology has become widely available throughout the United States. It is essential for businesses, and well
          over half of American households have broadband access at home.

          In recognition of its importance, public investment in broadband is surging. The American Recovery and
          Reinvestment Act (ARRA) of 2009 allocated $7.2 billion for broadband investment and commissioned a
          National Broadband Plan to promote universal access, foster economic development, and achieve additional
          potential benefits through this technology. Several California programs also support the expansion of
          broadband access, especially in areas where availability is lagging.

          This report assesses whether policies to raise broadband availability will contribute, as hoped, to local
          economic development. Our analysis relies on the fact that broadband technology has diffused unevenly
          throughout the United States, thus allowing us to compare economic indicators between areas with greater
          and less growth in broadband availability. Using broadband data from the Federal Communications
          Commission and economic data from several government and proprietary sources, we examine broadband
          availability and economic activity throughout the nation between 1999 and 2006.

          Our analysis indicates a positive relationship between broadband expansion and economic growth. This
          relationship is stronger in industries that rely more on information technology and in areas with lower
          population densities. Although the evidence leans in the direction of a causal relationship, the data and
          methods do not definitively indicate that broadband caused this economic growth.

          The economic benefits to residents appear to be limited. Our analysis indicates that broadband expansion is
          also associated with population growth and that both the average wage and the employment rate—the share
          of working-age adults that is employed—are unaffected by broadband expansion. The economic benefits to
          households are thus more ambiguous than they would be if employment growth also led to an increase in
          wages or the employment rate. We also found that expanding broadband availability does not change the
          prevalence of telecommuting or other home-based work. Of course, local employment growth might still
          raise property values and the local tax base, but in the absence of more direct benefits for residents in the
          form of higher wages or improved access to jobs, we can only say that the local economic development
          benefits of broadband are mixed.

          Broadband expansion may of course offer other social or economic benefits, such as improved health care
          delivery. Although our study does not examine such effects, we briefly review the limited evidence of other
          benefits in the conclusion of the report.

http://www.ppic.org/main/home.asp                                      Does Broadband Boost Local Economic Development?   2
Contents Summary 2 Tables 4 Figures 5 Introduction 6 Broadband Policies and Goals 8 The Federal Economic Stimulus and the National Broadband Plan 8 Broadband Policy in California 9 Broadband Availability and the Digital Divide 11 Unserved and Underserved Areas 11 Limitations of Available Broadband Data 14 What We Know about Broadband Availability 14 Why There Is a Digital Divide in Broadband Availability 15 Research Questions and Approach 17 Questions Addressed in This Report 17 Research Strategy 19 Questions This Report Does Not Address 21 Research Findings 22 Broadband and Local Overall Employment Growth 22 Broadband and Employment Growth across Industries and Places 23 Does Broadband Expansion Cause Employment Growth? 24 Broadband and Household Outcomes 25 Implications and Conclusion 28 What the Results Mean for Broadband as Local Economic Development Policy 28 Other Possible Benefits of Broadband 30 Broadband: The Next Generation 31 References 32 About the Author 34 Acknowledgements 34 All technical appendices to this paper are available on the PPIC website: http://www.ppic.org/content/pubs/other/110JKR_appendix.pdf
Tables
          Table 1. Broadband speed illustration                                                               12
          Table 2. Number of broadband providers by ZCTA                                                      15
          Table 3. Broadband and economic outcomes, 1999–2006                                                 22
          Table 4. Broadband and industry employment growth, 1999–2006                                        23
          Table 5. Summary of findings                                                                        28

http://www.ppic.org/main/home.asp                          Does Broadband Boost Local Economic Development?    4
Figures
Figure 1. Broadband Availability in California, August 2009 13
http://www.ppic.org/main/home.asp Does Broadband Boost Local Economic Development? 5Introduction
Since the mid-1990s, when businesses and households began to use the Internet, observers have been trying
to predict—and more recently to assess—the effects of this relatively new mode of communication. Some of
the early predictions about the Internet and related technologies, such as causing the “death of cities,” have
clearly not materialized. 1 But we still know very little about the economic effects of these technologies.
The Internet has transformed many areas of life, providing individuals and businesses with easy and instant
access to communication, information, and entertainment. But it may take years before the Internet—like
many other new technologies—exerts a quantifiable effect on business productivity. It takes considerable
time to develop applications and adjust business processes and organizations to take full advantage of new
technologies. 2
Nonetheless, governments need to assess whether new technologies are likely to offer benefits in the public
interest and whether the private sector will make the technology available and affordable enough to support
public policy goals. Occasionally, governments will deem a new technology essential for achieving these
goals and will support universal access, even in areas that are expensive to serve.
The federal government and the state of California, as well as other state and local governments, have
made universal access to broadband service a public policy goal—the specific objective is to close the
digital divide in broadband availability. 3 The phrase “digital divide” can refer to geographic inequalities
in availability or to gaps in broadband adoption owing to income, race/ethnicity, education, or other
inequalities in access or skills that affect the ability of individuals or businesses to take advantage of
broadband’s capabilities. 4 To help promote the goal of universal access, the federal government allocated
$7.2 billion for broadband investment and also commissioned a National Broadband Plan as part of its
2009 American Recovery and Reinvestment Act (ARRA). These federal “stimulus” funds provided a large
addition to existing state and local efforts to support broadband access.
The federal and state broadband initiatives presume multiple economic and social benefits will accrue from
increasing broadband access. Local economic development ranks high among these benefits. Other benefits
include improvements in health care delivery, access to education, energy efficiency, civic participation, and
public safety. To date, the evidence on the extent to which broadband provides any of these benefits has
been quite limited.
In this report, we are particularly interested in the relationship between broadband and economic development.
Previous research has not assessed whether broadband expansion causes economic development, nor has it
examined who benefits from increased economic activity; there has been little research on the effect of broadband
on outcomes other than employment, output, and income. Our analysis relies on the fact that broadband
technology has diffused unevenly throughout the United States, thus enabling us to compare economic indicators
between areas with greater and less growth in broadband availability. In this report, we examine broadband
availability throughout the nation between 1999 and 2006. Our parameters are partly determined by our
1 George Gilder, Forbes ASAP, February 27, 1995. Quoted in Mitchell Moss, “Technology and Cities,” Cityscape 3:3.
2 “The Broadband Myth,” The Economist, May 23, 2008.
3 While broadband can include satellite and high-speed mobile data services, the vast majority of households and businesses that subscribe to
broadband receive their service over cable, digital subscriber line (DSL), or other technologies that use physical wires or cables to connect end-
users to the Internet. Discussions about broadband availability usually refer to wireline technologies.
4 “Digital divide” can refer to inequalities in the availability or adoption of other technologies as well. See Gunkel (2003).
http://www.ppic.org/main/home.asp Does Broadband Boost Local Economic Development? 6data: Federal Communications Commission (FCC) data on broadband are available beginning in 1999, and
our source for detailed employment data ends in 2006. We answer four questions:
1. Does employment grow faster in areas with greater broadband expansion?
2. Does the relationship between broadband and employment differ by industry or across places? For
example, is it stronger for industries that are more reliant on technology or that use workers who are
more technically knowledgeable? Is it stronger in places that are more isolated or in those with more
amenities?
3. If there is a positive relationship between broadband and employment growth? Does broadband
expansion cause employment growth?
4. If broadband does boost employment, who benefits? Is employment growth accompanied by a
greater likelihood of employment, higher pay, increased income, or greater flexibility to be able to
work from home?
Although other studies have examined broadband and economic growth, this report offers more definitive
answers by using richer data and more-refined methods. We also examine questions left unanswered in
previous work, such as whether broadband actually causes economic growth, who benefits from this growth,
and whether broadband increases telecommuting and other forms of home-based work. Of course, economic
development is only one of many policy concerns that must be considered when targeting broadband
investments, and in our concluding chapter we briefly review the limited evidence available on other
potential benefits of this technology, including improved health care delivery and overall consumer welfare.
We begin our discussion in the next chapter with a description of the national and California policies
designed to increase broadband availability. We then describe the extent of broadband availability, explain
why some places have better broadband access than others, and discuss the limitations of the available data.
We then present our research questions, the methods we use to answer them, and the main findings of our
study. We conclude with a discussion of the policy implications of our findings and then briefly review other
possible effects of broadband that are outside the scope of our analysis. A technical appendix offers further
details about related research and our data, methods, and results.
http://www.ppic.org/main/home.asp Does Broadband Boost Local Economic Development? 7Broadband Policies and Goals
Broadband policy at both the national level and in California is designed to achieve multiple goals, most
prominently economic development. The federal government, through Congress, the executive branch, and
the Supreme Court, has shaped broadband policy through important regulatory decisions. 5 And today,
federal public investment in broadband is surging. ARRA, the $787 billion economic stimulus package
passed in 2009, allocated $7.2 billion to broadband investments, with a particular focus on increasing
broadband availability in targeted areas to improve economic development. 6 ARRA also requires the
development of a National Broadband Plan to guide broadband policy beyond the federal stimulus funds.
This plan is supposed to be wide-ranging, covering numerous technologies, policy options, and goals.
Well before the current federal investment in broadband, state and local governments have subsidized and
in some cases directly provided broadband services. California has several programs in place that subsidize
the demand and supply of broadband. The stated goals of these policies—described in detail below—include
job creation and economic growth, civic participation, public safety, education, health care, and access to
government services. Like federal policies, some California initiatives are more narrowly targeted toward
underserved areas and economic development goals, while other programs are focused on a wider set of
concerns, such as health care and education.
In sum, broadband policy at the federal level and in California aims to achieve a wide range of goals, with
a particular emphasis—especially in the federal broadband stimulus—on raising broadband availability in
unserved and underserved communities in an effort to create jobs and stimulate economic growth.
The Federal Economic Stimulus and the
National Broadband Plan
Signed into law in February 2009, ARRA directs two federal agencies, the Department of Agriculture’s Rural
Utilities Service (RUS) and the Department of Commerce’s National Telecommunications and Infrastructure
Administration (NTIA), to grant or lend $7.2 billion for broadband deployment and other broadband projects. 7
ARRA directs both agencies to consider the effect on economic development when awarding funds. RUS will
offer grants, loans, and loan guarantees worth $2.5 billion for broadband infrastructure projects in rural areas
that lack “sufficient access to high speed broadband service to facilitate rural economic development.” 8
NTIA will award grants worth $4.7 billion to states, non-profits, and broadband providers for a wider set of
broadband projects—not just infrastructure projects and not just in rural areas. While economic growth and
job creation are explicit goals of NTIA’s funds, as is raising broadband access in unserved and underserved
areas, so is improved broadband access for schools, medical facilities, other community institutions, and
5 The 1996 Telecommunications Act, the 2005 Supreme Court decision in National Cable & Telecommunications Association et al. v. Brand X
Internet Services et al., and related FCC rulings helped create the national regulatory framework in effect today. Under this framework,
telephone, wireless, television, and Internet providers are able to compete in any market against each other, but broadband providers are not
required to give competitors wholesale access to their infrastructures that would enable competitors to resell services to consumers.
6 Of the $4 billion to be allocated in the first round of funding, 75 percent has been targeted toward infrastructure projects.
7 Applications for broadband stimulus funds are being accepted and reviewed in multiple rounds. First round applications were due in August
2009; up to $2.4 billion of the RUS funds and $1.6 billion of NTIA funds will be awarded in this round. Subsequent rounds will award the
remainder of the $7.2 billion by September 2010. Stimulus funds will be allocated by RUS through the Broadband Initiatives Program (BIP) and
by NTIA through the Broadband Technology Opportunities Program (BTOP).
8 ARRA, (H.R. 1) Title I, p. 4.
http://www.ppic.org/main/home.asp Does Broadband Boost Local Economic Development? 8public safety agencies. Together, these two components illustrate the prominence of economic development
and job creation as goals for the broadband stimulus funds, among other goals.
ARRA also requires the FCC, the national telecommunications regulator, to present a National Broadband
Plan to Congress in February 2010 to guide future broadband policy. The Plan is supposed to “seek to ensure
that all people of the United States have access to broadband capability” and is an acknowledgement that the
broadband stimulus funds alone are “insufficient to support national broadband deployment.” 9 The Plan
should recommend goals and benchmarks for a national broadband strategy and for achieving eleven
enumerated policy goals, including job creation and economic growth, entrepreneurial activity, and other
specific targets such as consumer welfare, civic participation, public safety, education, and health care
delivery. 10 The plan will thus cover a wider range of interests and technologies than the broadband stimulus
funds, which are geared toward infrastructure, technology mapping, and related activities.
Broadband Policy in California
Well before the passage of ARRA, states and localities—including the state of California and some of its
cities and counties—have made broadband investments through subsidies and direct provision. 11 As with
federal broadband initiatives, California’s broadband policy is focused on numerous goals, with economic
development prominent among them. 12
For many years, the state’s primary broadband subsidy program has been the Teleconnect Fund, established in
1996, which pays half the cost of Internet access for qualified schools, libraries, community organizations, and
other nonprofits, funded through a statewide fee on telephone service. The program has grown from $33 million
in FY 2008–2009 to $47 million (proposed) in FY 2009–2010 and $67 million (proposed) in FY 2010–2011. 13
Two newer programs have expanded the state’s involvement in broadband infrastructure deployment.
In 2006, the California Public Utilities Commission (CPUC) created the California Emerging Technology
Fund (CETF), an independent nonprofit foundation. CETF has received funding for its first five years
through a $60 million contribution from AT&T and Verizon, a condition of their respective mergers
with telecommunications companies SBC and MCI. CETF’s mission is to achieve “ubiquitous access
to broadband and advanced services in California, particularly in underserved communities.” The
foundation seeks to promote broadband availability in rural areas, affordability and adoption in urban
poor and other disadvantaged areas, and accessible technology for people with disabilities. CETF hopes
to disburse $240 million over five years, supplementing its own seed money with matching funds. As of
December 2008, it had awarded $20 million in grants. The largest award helped support the California
Telehealth Network (CTN), which electronically connects hundreds of clinics and hospitals—primarily
in rural areas and tribal lands—to medical centers. CETF’s support also helped CTN win a larger grant
from the FCC’s Rural Health Care Pilot Program.
9 ARRA (H.R. 1), Section 6001 (k)(2), p. 402; FCC Notice of Inquiry 09-31, 2009, paragraph 6.
10 The FCC’s Notice of Inquiry reviews these and other current FCC activities that relate to broadband.
11 Although the major current initiatives are sponsored at the federal and state levels, some localities in recent years have provided broadband
directly through public municipal Wi-Fi (wireless) networks, fiber-optic networks, or other broadband technologies. Kolko (2007) discusses local
initiatives in California.
12 In addition to the subsidy and investment programs described in this section, California has set broadband policies through the final report of
the California Broadband Task Force, created by Executive Order S-23-06 in 2006, and the 2006 Digital Video and Infrastructure Competition Act
(AB 2987), which created statewide video franchises and established the CPUC’s responsibility for collecting and mapping broadband data.
13 Actual and proposed budgets are available at the CTF website, www.cpuc.ca.gov/PUC/Telco/Public+Programs/CTF/CTFList.htm.
http://www.ppic.org/main/home.asp Does Broadband Boost Local Economic Development? 9The second new state program is the California Advanced Services Fund (CASF), which is providing $100
million over two years to subsidize broadband deployment in unserved and underserved areas; successful
applicants are awarded 40 percent of total project costs for broadband infrastructure in these areas. CASF
was authorized by the CPUC in 2007 and implemented in 2008 under SB 1193 (Padilla); the first projects
were funded in November 2008. Whereas CETF has a broad strategy that includes infrastructure availability,
adoption, applications, and technology literacy, CASF is more narrowly focused on promoting infrastructure
availability in the largely rural parts of the state that lack adequate broadband. Thus, the main goal of CASF
is quite similar to the objectives of the portion of the broadband stimulus funds targeted toward broadband
availability in rural areas.
The funds currently available through state programs—the Teleconnect Fund, CETF, and CASF—are small
relative to the sums California might expect to receive under the federal broadband stimulus program. While
the state programs have budgets or plans to disburse tens of millions of dollars annually, California’s share
of the federal broadband funds would be over $900 million. 14 Thus, an essential element in California’s
current broadband strategy is to win federal broadband stimulus funds. Numerous cities, counties,
nonprofits, and companies in California were among the first-round applicants for federal funds: Their grant
and loan requests totaled $1.4 billion. 15 CPUC was a winner in the first round of the separate broadband
mapping funds competition, receiving a $2.3 million grant in October 2009. 16
California’s expectations, like those of the federal government, are that broadband will contribute to
economic development. The final report of the California Broadband Task Force, for example, lists
“economic and community development” first among the ways that broadband is likely to affect California,
citing the potential effect of broadband on job creation in high-tech and other industries as well as on
employment in rural areas. 17 The state also expects broadband to lead to increased telecommuting and
environmental benefits. In establishing its definition for “underserved” areas for CASF grant eligibility, the
CPUC chose the minimum speed that would support telecommuting. 18 In turn, the California Air Resources
Board cites telecommuting as one way the state government can encourage its own employees to “decrease
their individual carbon impact.” 19
14 CETF’s “Summary of ARRA Proposals” estimates California’s “fair share” to be 13 percent of the federal total, proportional to the state’s share
of the national population.
15 These applications have been submitted for the first round of $4 billion in federal funds, of which California’s 13 percent “fair share” would be
$520 million—roughly one-third of the amount that California-based organizations have applied for. Applicants are listed at
www.ntia.doc.gov/broadbandgrants/applications/search.cfm (viewed on October 12, 2009). The total request in California-based applications
was reported in CETF’s “Summary of ARRA Proposals.”
16 The NTIA grant comes through the State Broadband Data and Development Grant Program, the program authorized by the 2008 Broadband
Data Improvement Act and funded with up to $350 million from ARRA.
17 California Broadband Task Force, “The State of Connectivity,” 2008. Viewed on October 14, 2008, at
www.calink.ca.gov/pdf/CBTF_FINAL_Report.pdf . Governor Schwarzenegger’s official response to the request for comments on the broadband
stimulus also notes the importance of economic development: “… without any broadband service, [an area’s] residents are excluded from the
economic development and social-economic benefits of broadband, including tele-education, telemedicine, access to health care information,
access to government services and benefits, and more.” See California response to BIP/BTOP request for comment,
www.recovery.ca.gov/Content/Documents/California_Response_to_NTIA_on_BB_Stimulus_Grants_4-13-09.pdf, p. 12.
18CASF chose minimum speeds of 3 megabits per second downstream and 1 megabit per second upstream, arguing that at these speeds
telecommuting becomes feasible, and lacking rapid enough connections to work from home qualified an area as “underserved.” See Table 1 and
California’s response to BIP/BTOP request for comment,
www.recovery.ca.gov/Content/Documents/California_Response_to_NTIA_on_BB_Stimulus_Grants_4-13-09.pdf.
19 California Air Resources Board, Climate Change Draft Scoping Plan, June 2008, page 12.
http://www.ppic.org/main/home.asp Does Broadband Boost Local Economic Development? 10Broadband Availability and the
Digital Divide
California and federal policies seek to close the digital divide in broadband availability, placing a particular
emphasis on unserved and underserved areas. ARRA and CASF define unserved and underserved in terms
of whether broadband service is available and, if so, at what speed. CETF also mentions “ubiquitous access”
and supporting “underserved communities” in its mission statement.
Targeting “unserved” and “underserved” areas requires defining these terms and identifying which areas
qualify. Recent improvements in data collection, and planned improvements funded by ARRA, will provide
policymakers with much better information on broadband availability. However, for analyzing past trends
in broadband availability and the relationship between broadband and local economic development, we
must rely on the less detailed data collected historically by the FCC.
Unserved and Underserved Areas
”Unserved” and “underserved,” as defined for the federal stimulus funds, are an important policy statement
about what constitutes adequate broadband availability. “Unserved” areas lack broadband service offering
downstream speeds of at least 768 kilobits per second (kbps) and upstream speeds of 200 kbps. 20 These
minimum speeds are lower than typical digital subscriber line (DSL) and cable broadband service today, which
often advertise top downstream speeds of 1.5 to 6 megabits per second (mbps) and top upstream speeds of at
least 768 kbps (Table 1). “Underserved” areas have either only partial service coverage at those speeds, no
service at a higher speed threshold of 3 mbps downstream and 1 mbps upstream, or low adoption rates. 21
To assess the extent of the digital divide and to help identify unserved and underserved areas, the FCC
recently improved its data collection efforts, and ARRA is allocating funds for additional mapping and
surveying efforts. Since December 2008, broadband providers have been required to report subscribership
levels by Census tract at different speeds of service through the FCC’s “Form 477” data collection process.
(Form 477 data is about subscribership, and availability is inferred, based on the location of subscribers.
This could result in an undercount of availability in areas where a provider has infrastructure allowing it
to provide broadband service, but no subscribers.) As noted above, ARRA also seeks to provide information
on unserved and underserved areas. It provides funding for the development of maps showing broadband
availability and calls for the development of “a comprehensive nationwide inventory map of existing
broadband service capability and availability” by February 2011. Finally, the 2008 Broadband Data
Improvement Act requires the FCC to conduct consumer surveys on pricing, speed, adoption, and online
behaviors, and to collect international data on broadband speeds and prices.
20 “Downstream” refers to data sent “down” from the Internet to an end-user, such as a downloaded file or a received email. “Upstream” refers
to data sent “up” to the Internet from an end-user, such as an uploaded file or a sent email.
21 Unserved areas consist of contiguous Census blocks where at least 90 percent of households lack access to terrestrial (i.e., not satellite or mobile
phone) broadband service offering speeds of at least 768 kbps downstream and 200 kbps upstream. Underserved areas consist of contiguous
Census blocks where either (1) 50 percent of households or fewer have access to terrestrial broadband service of at least 768 kbps downstream
and 200 kbps upstream; (2) no broadband service offers speeds of at least 3 mbps downstream and 1 mbps upstream; or (3) 40 percent of
households or fewer subscribe to broadband. Note that the standard of 3 mbps downstream / 1 mbps upstream is the level that CASF believes is
necessary to support telecommuting, as mentioned in the previous section.
http://www.ppic.org/main/home.asp Does Broadband Boost Local Economic Development? 11TABLE 1
Broadband speed illustration
Approximate time to download
Downstream speed Relevance
3 megabyte pop song
56 kilobits/second
Top speed of dial-up modem service 7 minutes
(kbps)
Minimum speed to qualify as “high-speed” (broadband)
200 kbps 2 minutes
under historical FCC definition
Minimum speed for an area not to be “unserved”
768 kbps 30 seconds
according to ARRA
1.5 megabits/second Lower speed tier advertised for many broadband
15 seconds
(mbps) (DSL or cable) services
Minimum speed for an area not to be “underserved”
3 mbps according to ARRA, and minimum speed CASF 8 seconds
considers necessary for telecommuting
Upper speed tier advertised for many broadband
6 mbps 4 seconds
(DSL or cable) services
Speed of advanced services available in some areas,
10 mbps 2 seconds
including much of metropolitan southern California
Speed of advanced services available in very limited
100 mbps ¼ second
areas, including parts of metropolitan Sacramento
NOTE: 1 byte equals 8 bits.
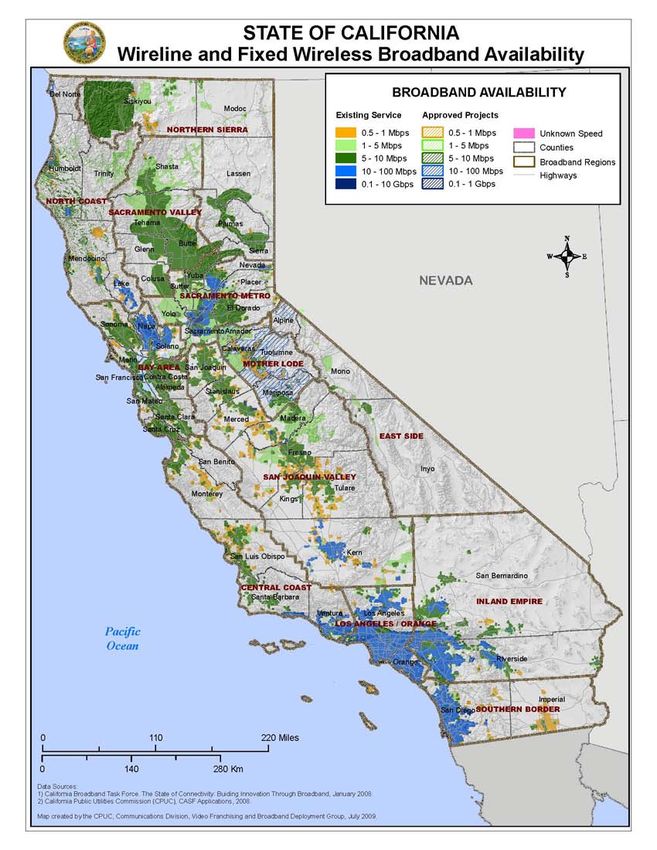
Some states, including California, have already undertaken their own mapping initiatives. Based on
infrastructure data collected from providers, California publishes maps of broadband availability
throughout the state, disaggregated into several speed tiers. 22 Maps dated August 10, 2009, show large rural
and mountainous areas in the state without broadband access. The fastest service—more than 100 mbps—
is available in parts of the Sacramento metropolitan area; service at speeds of 10–100 mbps is available
throughout much of urban southern California, as well as Bakersfield and Napa and Solano Counties; and
speeds of 5–10 mbps are offered in most of the Bay Area, including Silicon Valley (Figure 1). These
differences demonstrate that even among places with broadband availability, speeds can vary considerably.
And much of the state appears to have no service at speeds of at least 500 kbps, thus meeting the definition
of unserved or underserved. 23
22See maps at www.cpuc.ca.gov/PUC/Telco/Information+for+providing+service/Broadband+Availability+Maps.htm.
23The speed categories presented in the CPUC map (Figure 1) do not accord with the speeds that define unserved and underserved areas
(Table 1), making it difficult to determine which areas qualify for federal stimulus funds based on the map.
http://www.ppic.org/main/home.asp Does Broadband Boost Local Economic Development? 12FIGURE 1
Broadband Availability in California, August 2009
SOURCE: California Public Utilities Commission, Communications Division, Video Franchising and Broadband
Deployment Group.
NOTE: Map used with permission of CPUC.
http://www.ppic.org/main/home.asp Does Broadband Boost Local Economic Development? 13Limitations of Available Broadband Data
FCC data collected prior to the December 2008 improvements represent the best public historical information
on broadband availability, and policymakers and academics have relied on these data to analyze the extent
of broadband deployment and the relationship between broadband and economic and social outcomes. 24
These historical data consist of the number of subscribers at the state level, disaggregated by advertised
speed of service and type of technology (cable, DSL, etc.), as well as a list of ZIP codes where the provider
has at least one subscriber to “high-speed Internet service,” defined as at least 200 kbps in at least one
direction. Thus, the only sub-state information was the number of providers in a ZIP code with at least one
subscriber, which has been published in semiannual reports back to 1999. 25
Some caution must be exercised in interpreting these data, because many ZIP codes cover large geographic
areas, and providers with a subscriber in a ZIP code might not offer service throughout the entire ZIP code.
That said, these ZIP code provider-count data have two strengths for assessing policies designed to raise
broadband availability. First, broadband policies are often enabled by adding providers to an area—
sometimes directly through public provision and sometimes indirectly through subsidization or regulation;
thus, using the number of providers as a proxy for broadband availability is meaningful in a policy context.
Second, there is a reliable relationship between the number of providers in a ZIP code and the estimated
extent of residential broadband availability, even though the data are imperfect. As explained in the
technical appendix, the publicly available FCC data do not distinguish between providers that own the wires
and cables that constitute broadband’s infrastructure and those that lease and resell space on these lines to
offer service; nor do FCC data indicate how much of the ZIP code each provider serves, nor at what speed.
Nevertheless, related research has shown that estimated broadband availability in a ZIP code does increase
when the number of providers increases, especially when the ZIP code has fewer providers to begin with. 26
What We Know about
Broadband Availability
Broadband is widely available. By December 2006, essentially all ZIP Code Tabulation Areas (ZCTAs) in the
United States, including those in rural areas, had at least one provider offering service (Table 2). 27 This simple
metric overstates broadband availability because providers do not always offer service throughout an entire ZIP
code. Using an improved methodology that infers availability based on adoption patterns and FCC provider
counts, we estimate that broadband was available to 85 percent of U.S. households and 92 percent of California
households in December 2005 (Kolko, forthcoming). Looking at the number of providers, broadband availability
continued to increase between 1999 and 2006, relative to its level in 1999. The average number of providers per
24 National broadband data collected prior to December 2008 cannot show which areas qualify as unserved or underserved, as defined for
ARRA. Historically, the FCC has reported the number of providers in a ZIP code with service at speeds of at least 200 kbps in at least one
direction, whereas an area qualifies as unserved if it lacks service of 768 kbps downstream and 200 kbps upstream. Thus, areas with “high-speed
access” according to the historical FCC definition could still be unserved or underserved according to definitions for current broadband
programs.
25 These semiannual reports and provider count lists are available at www.fcc.gov/wcb/iatd/comp.html. Two reporting changes occurred starting
in December 2005: First, providers with fewer than 250 high-speed connections were required to submit data through Form 477, whereas
previously they were exempt; second, providers had to start reporting state-level subscribership by technology (GAO, 2009).
26 Kolko (forthcoming) demonstrates the relationship between provider count and availability. This relationship suggests that the logarithm of
the number of providers better approximates availability than either a linear measure or an assumption that availability reaches a maximum with
one or a few providers. The appendix of this report discusses other shortcomings with FCC Form 477 data in more detail, as does GAO (2006).
27 ZCTAs are U.S. Census Bureau approximations of U.S. Postal Service ZIP codes. ZCTAs are better suited to data analysis than ZIP codes. See
the appendix for more detail about how ZCTAs and ZIP codes compare and how we converted ZIP code data to ZCTAs. “Rural” means outside
a metropolitan area and accounts for roughly 20 percent of the U.S. population.
http://www.ppic.org/main/home.asp Does Broadband Boost Local Economic Development? 14ZIP code in the nation grew from 3.4 in 1999 to 11.2 in 2006, weighted by employment. The comparable figures for
California were slightly higher (5.0) in 1999 and similar (11.5) in 2006.
TABLE 2
Number of broadband providers by ZCTA
All areas Rural only
U.S. California U.S. California
1999
Average broadband provider count 1.6 2.9* 0.8 0.9
Average broadband provider count (employment-weighted) 3.4 5.0* 1.7 1.6
Percent of ZCTAs with one or more providers 63% 77%* 42% 43%
Percent of ZCTAs with one or more providers (employment-
96% 98%* 83% 81%
weighted)
2006
Average broadband provider count 6.9 8.6* 5.0 4.9
Average broadband provider count (employment-weighted) 11.2 11.5 8.3 7.4*
Percent of ZCTAs with one or more providers 99.6% 99.93%* 99.4% 99.5%
Percent of ZCTAs with one or more providers (employment- 99.97% >99.99%* 99.94% 99.99%
weighted)
NOTES: Asterisks indicate California value is different from rest of U.S. at 5% statistical significance level. “Rural” means not
in a metropolitan area. See technical appendix for further definitions and details.
Since broadband appears, by these data, to be widespread, we may ask why federal and California broad-
band policy is focused on unserved and underserved areas. The answer is that ARRA, CASF, and other
current initiatives use higher speed thresholds than the historical FCC definition of high-speed access (see
Table 1). It is very likely that many areas are unserved or underserved relative to these thresholds, even if
they have one or more broadband providers according to the historical FCC definition.
Thus, even though historical data on broadband availability do not show which areas qualify as unserved or
underserved for the purposes of current broadband initiatives, they do reveal that broadband became available at
different times throughout the country. These historical data allow us to identify areas with more and less
broadband availability and whether broadband expansion was associated with economic development outcomes.
Why There Is a Digital Divide in
Broadband Availability
Why might broadband be more widely available in some places than others? The primary reason is that the
costs and benefits of providing broadband depend on local factors. Broadband provision requires fixed costs
to extend service to an area: Much of the cost to install or upgrade telecommunications infrastructure is
required “up front,” regardless of the number of eventual subscribers served by that infrastructure. Thus, in
order to spread the fixed costs across more subscribers, providers are more likely to serve areas with high
demand for broadband. In addition, infrastructure is more expensive to deploy in some areas, such as those
with steep terrain or fewer roads, as broadband lines often follow existing transportation rights-of-way.
Finally, broadband availability can vary because most areas in the United States are served by a dominant
telephone provider and a dominant cable television provider, and each can make different strategic decisions
http://www.ppic.org/main/home.asp Does Broadband Boost Local Economic Development? 15about when to introduce broadband service to their regions. State policies about regulating or subsidizing
broadband could also affect the level of availability. 28
As expected, ZCTAs with higher population density, higher income, and flatter terrain had more broadband
providers in 2006, holding other factors constant (Technical Appendix Table A1). Roughly half of the
difference between the number of providers in California and the nation in 1999 (see Table 2) was due to
differences in density, income, education, and terrain; the remainder was due to unmeasured factors, which
could include state policies or the particular broadband strategies of the telephone and cable companies
serving California. By 2006, the gap in availability between California and the United States had closed to a
statistically insignificant difference.
The extent and reasons for the digital divide in Internet availability also depend on technology. Compared
with today’s main broadband technologies, cable and DSL dial-up Internet service involves lower fixed costs
and did not lead to persistent geographic disparities in availability. Fiber-to-the-home, which offers speeds
much faster that DSL or cable, has high fixed costs of deployment and is therefore likely to lead to a more
persistent digital divide than cable and DSL (Kolko, 2007). Even if today’s broadband technologies become
available everywhere, digital divides in future technologies will probably appear, and “closing the digital
divide” will remain a policy goal.
28We do not attempt to measure the effect of state policies on broadband availability because telecommunications regulations are difficult to
quantify in a consistent way across states.
http://www.ppic.org/main/home.asp Does Broadband Boost Local Economic Development? 16Research Questions and Approach
In this chapter we first discuss the questions this report addresses, explaining the underlying hypotheses and
why the questions are important. We then present the empirical strategy that we use in answering these
questions. We conclude the chapter with a discussion of other important questions about broadband’s effects
that lie beyond both the scope of our analysis and the main concerns of current federal and state policy
initiatives.
Questions Addressed in This Report
Our analysis answers four questions about broadband expansion and economic growth:
1. Does employment grow faster in areas with greater broadband expansion?
2. Does the relationship between broadband and employment differ by industry or across places? For
instance, is it stronger for industries that are more reliant on technology or that use workers who are
more technically knowledgeable? Is it stronger in places that are more isolated or that have higher
amenities?
3. If there is a positive relationship between broadband expansion and employment growth, does
broadband expansion cause this growth?
4. If broadband does boost employment growth, who benefits? Is employment growth accompanied
by a greater likelihood of employment, higher income, or greater flexibility to be able to work from
home?
To answer our first question—whether the availability of broadband is associated with local employment
growth—it is helpful to consider why broadband might contribute to this type of local economic
development. Obviously, broadband and other information and communications technologies lower the cost
of sending and receiving many forms of data, including documents and audio and video content. According
to standard economic theory, lowering the cost of one input to a profit-maximizing firm has two possible
effects: First, the firm raises its output; second, the firm shifts its mix of inputs toward the input whose cost
went down. When the spread of broadband lowers the cost of communication, the net result of these two
effects on hiring is theoretically ambiguous. The first effect—raising output—would lead most businesses to
hire more labor. But the second effect—shifting toward the inputs that just got cheaper—could cause
businesses to use new technology in lieu of labor for some tasks.
Our second question explores how the relationship between broadband and employment varies across
industries, types of workers, and places. Again, it is useful to think about why there might be differences.
Turning to industries first: Businesses reliant on information technology might increase their employment
of workers skilled in using new technology and possibly even reduce their employment of others—shifting,
in other words, toward labor that is “complementary” with broadband technology. Broadband would
therefore have a larger positive effect on employment in industries whose workers are more skilled in using
information technology. Furthermore, even if broadband expansion caused individual firms to reduce
employment, economic activity could shift to locations where broadband is more widely available, raising
aggregate employment there relative to other areas. Locational shifts in economic activity would be more
pronounced in more “footloose” industries—those whose location is not tied to local markets or inputs.
http://www.ppic.org/main/home.asp Does Broadband Boost Local Economic Development? 17The relationship between broadband expansion and economic growth could also vary across places.
Broadband might offer greater benefit for places that are smaller or more isolated, helping local
businesses or households to connect with larger markets: This line of thinking lies behind predictions
that rural areas might benefit disproportionately from Internet technology. Other examples include
areas that have access to a more highly educated labor market (if the more educated workers are better
able to use advanced information technologies) and areas with more favorable climates and recreational
opportunities (if broadband access allows firms to move further away from suppliers and customers
toward locations appealing to employers and workers). 29
At the same time, broadband expansion could lead to declines in both employment and economic output
in local businesses that begin to face competition from online businesses located elsewhere. For example,
broadband expansion might encourage households to purchase goods online instead of in local stores, or to
download movies rather than visit their local theaters. As with the other possible links between broadband
and local economic activity, the effects will vary by industry: Those businesses most dependent upon local
demand, such as retailers or entertainment, are more likely to be hurt by broadband expansion, depending
on how easily their customers can switch from local businesses to their online counterparts.
Turning to our third question, it is important to acknowledge that a positive empirical relationship between
broadband expansion and economic growth does not, in itself, mean that broadband expansion causes
economic growth. The reverse might actually be true if broadband providers choose to offer or expand
service in areas that are growing faster. Alternatively, population growth could cause both broadband
expansion and employment growth. Broadband expansion might follow population growth since more than
60 percent of broadband subscribers are households, according to the most recent FCC broadband report.
Once again, this effect could vary by industry: Population growth would lead to employment growth in
industries whose customers are local residents. Assessing causality is, of course, essential for predicting
whether broadband policies will lead to economic development. Looking at broadband expansion and
employment growth in individual industries might help clarify the relationship between broadband
expansion and overall employment growth.
Our final question asks who benefits if, indeed, broadband expansion does cause economic growth. The
answer depends, in part, on what happens to the population. If population growth accompanies employment
growth because people follow jobs, then the likelihood of residents being employed—the employment rate—
might not rise much. The effect on average pay and household incomes is unclear as well: Increased labor
demand might raise wages, but if labor supply also increases, this would push wages down. Employment
growth that raises the employment rate, average pay, or household incomes benefits residents; employment
growth that does not might still contribute to property owners’ land values or local governments’ tax base,
benefitting some residents but not others. 30
It is quite plausible that targeting unserved and underserved areas for broadband expansion could raise local
employment yet offer ambiguous economic returns for residents. Economists are often skeptical about
“place-based” policies, which provide geographically targeted infrastructure investments; the broadband
29 “Why Wall Street Is Losing Out To 40 Acres and a Modem,” New York Times, December 27, 1998, highlights the relocation of some financial
operations to idyllic recreation areas like Jackson Hole and Nantucket.
30 We do not assess the relationship between broadband expansion and property values because the time period we study (1999–2006) coincides
with the large and varying house price bubbles in many local housing markets. The geographic variation in price changes during this time is
probably too noisy to be a reliable measure of the geographic variation in the capitalization into land values of potential local productivity
enhancements such as broadband expansion.
http://www.ppic.org/main/home.asp Does Broadband Boost Local Economic Development? 18stimulus funds are an example of such policies. According to Louis Winnick (1966), an economist and urban
development expert, “Federal programs to change the geography of output are a kind of welfare device to
redistribute personal income. But at best it is a clumsy, expensive, and often inequitable device. Not only
are the gains to one locality offset by losses to another, but even in the locality of gain the added income
frequently goes to the wrong people. … A disproportionately large share of the increased purchasing power
goes to the owners of immobile resources [e.g. property owners] other than labor.” 31 Furthermore, place-
based policies may end up encouraging economic activity in places where that activity might not otherwise
be economically sustainable: Many of the places that are unserved and underserved by broadband are so
because terrain, remoteness, or low population density raises the cost of broadband provision. 32 Yet, in
defense of place-based policies, not all people can or want to leave disadvantaged places, and governments
are committed to offering basic services to residents in all places.
Research Strategy
The relationship between broadband and economic outcomes at the local level is relevant for assessing
policy that targets specific locations for broadband investments. As described above, broadband availability
has varied across the nation, and this report takes advantage of these geographic differences to assess how
the expansion of local broadband availability relates to changes in many economic outcomes.
Several other studies have also looked at the relationship between broadband and economic development.
They have generally found a positive relationship between broadband expansion and employment growth
and a mixed relationship between broadband expansion and income (or wage) growth. By using richer data,
better measurement, and a wider range of methods, this report offers more definitive answers about the
relationship between broadband and economic growth, which are generally consistent with previous work. 33
This report also examines questions left unanswered in previous work, such as causality, the effect on
population, and the effect on telecommuting and other forms of home-based work.
Our research strategy consists of comparing changes in several economic outcomes with the extent of
broadband expansion. To measure the expansion of broadband availability, we use the FCC’s Form 477 data
on the number of broadband providers in a ZIP code, as described in the previous section and the technical
appendix. We match these data with economic outcomes from several other data sources:
The change in employment provided in the National Establishment Time-Series (NETS) database,
which reports employment for nearly all businesses in the United States from 1992 to 2006 and
includes detailed industry and geographic information. The NETS is based on the Dun & Bradstreet
business register.
The change in employed residents, total and working-age population, average pay, and median
household income, all at the county level, from the U.S. Census and other government data sources.
The change in the likelihood of telecommuting, bringing work home, and operating a home-based
business, as reported in surveys conducted by Forrester Research, a technology consultancy.
Forrester surveys households annually about technology adoption and related behaviors.
31 Ladd (1994), in a review of research on enterprise zones, also notes that the benefits of place-based policies to non-landowning local residents
are uncertain.
32 One prominent urban economist (Edward Glaeser) argues that disaster-struck New Orleans (Glaeser, 2005) and economically depressed
Buffalo (Glaeser, 2007) should be allowed to shrink, with support given directly to residents rather than to places.
33 The appendix offers more detail on related academic and policy research.
http://www.ppic.org/main/home.asp Does Broadband Boost Local Economic Development? 19The FCC, NETS, and Forrester all report information at the ZIP code level. ZIP code areas are small relative
to counties and offer rich detail on local broadband availability and economic outcomes. But official ZIP
codes, as defined by the U.S. Postal Service (USPS), change frequently over time and do not accord precisely
with county boundaries, Census tracts, or other areas for which data are typically available. Furthermore,
while the NETS and Forrester report actual USPS ZIP codes for businesses and households, respectively, the
FCC uses its own approximation of ZIP codes. And the Census uses its own ZIP code approximation, the
ZCTA (ZIP code tabulation area), for reporting selected demographic and economic measures. We converted
data from all these sources to the Census ZCTA definitions to create consistent geographic boundaries across
datasets and over time. Most previous research has examined the relationship between broadband and
employment growth at larger geographic levels (e.g., counties or states). However, using smaller units of
geography is more desirable because broadband availability can vary block-by-block. ZIP codes are the
smallest geographic area for which both broadband and employment data are publicly available. 34
We focus on broadband expansion and outcomes between 1999 and 2006. Although broadband diffusion
began earlier, most growth in the number of providers occurred during this period (the FCC began reporting
provider count data in 1999). These years are also most relevant as a guide to what future broadband
expansion—through ARRA or other programs—might mean for economic development. The relationship
between broadband (or any technology) and economic outcomes might change over the course of the
technology’s diffusion. 35 Policies designed to bring broadband to still-underserved areas are at the end of the
broadband diffusion process (at current broadband speeds, anyway), so more recent experience is a better
guide than earlier experience to what might happen in the future. 36 To further refine these insights, our
analysis highlights the relationship over the period 1999–2006 in ZCTAs with the least broadband provision
in 1999. Although data do not yet exist to assess whether the locations that lagged in 1999 are the same
locations that remain unserved or underserved by today’s policy definitions, this analysis may offer
guidance for the effects of policies targeting today’s unserved and underserved areas.
The first step, then, is to assess the overall relationship between broadband expansion and employment
growth. We then look at whether the relationship varies by industry or type of place. Next, we try to assess
causality by examining the industry-specific effects and by also using an “instrumental variable” strategy. 37
And finally, we examine other outcomes: population growth, changes in the likelihood of being employed,
average pay, and household income, as well as the changing prevalence of three types of home-based work:
telecommuting, bringing work home occasionally, and operating a home-based business. These additional
outcomes reveal how broadband expansion relates to outcomes that households experience.
34 To assess the relationship between broadband expansion and employment growth, the ideal level of geography would be the exact street
address because a business can have broadband access only if it is available at its exact location. The ZCTA is the smallest geography for which
data are available and is therefore the level of analysis we use for employment growth. In contrast, counties are more appropriate than ZCTAs
for examining household labor market outcomes because counties better approximate the size of labor markets and broadband could affect
households that are in the same labor market as businesses that adopt broadband.
35 It is ambiguous whether the economic effects, theoretically, might be larger earlier or later in the diffusion process. Early users, by taking
advantage of a technology first, might grow to a scale that later users would find difficult to compete with. However, the cost of adopting a new
technology can fall over time with technological improvements and knowledge from lessons learned by earlier users, which might increase the
economic benefits for later users.
36 Focusing on the 1999–2006 period also allows us to adjust for earlier trends in employment growth, because the NETS data start in 1992.
Adjusting for prior trends is important because it accounts for the possibility that earlier employment growth encouraged later broadband
expansion, and later employment growth might simply be the continuation of the earlier growth trend rather than the effect of broadband
expansion.
37 The instrumental variable strategy identifies a factor – in this case, slope of terrain – that affects broadband expansion without independently
affecting employment growth, holding other factors constant. The relationship between employment growth and the variation in broadband
expansion that is predicted by slope identifies the causal portion of the effect of broadband on growth, at least for the areas in which slope is a
good predictor of broadband expansion. The appendix offers detail on this approach and the results.
http://www.ppic.org/main/home.asp Does Broadband Boost Local Economic Development? 20You can also read