HDFC MF Yearbook 2020 - This is HDFC MF Files Bucket
←
→
Page content transcription
If your browser does not render page correctly, please read the page content below
HDFC MF Yearbook 2020

                                Contents
                                1. Global Economy and Markets
                                2. Key Future Trends
                                3. Indian Economy
                                4. Equity Markets & Sector Overview
                                5. Fixed Income Markets

Refer disclaimers on slide 56
Global Economy and Markets
In 2019, Global Economy is estimated to be USD 86 trillion. It has grown at a CAGR of 5.4% since 1980
% 1980-90 1990-00 2000-10 2010-20E
Decadal Growth rate 7.7 3.7 6.9 3.2
US share of Global growth 25.1 41.5 14.7 30.0
China share of global growth 0.8 7.9 15.1 37.6
Source: IMF
Refer disclaimers on slide 56Range bound global growth continues
Global growth
5.0
• In 2019, trade uncertainty and slower growth across major economies led Real Global GDP Growth (YoY,%)
to lower growth 4.0
• US Presidential elections, trade negotiations and China growth are key
monitorables in 2020 3.0
United States (US) 2.0
2012 2013 2014 2015 2016 2017 2018 2019E 2020E 2021E
• Growth in 2018 was above normal; 2019 growth has to be seen in that
context and hence, is healthy
Growth in GDP (%) 2008-17 2018 2019E 2020E 2021E
• US Fed cut policy rates thrice on back of benign inflation, as against Global 3.4 3.7 3.0 3.2 3.5
G10 1.2 2.2 1.7 1.3 1.5
expectation of hikes at the beginning of 2019
United States 1.5 2.9 2.3 1.8 1.9
• Driven by culture of innovation & risk taking, immigration of quality talent, Euro Area 0.6 1.9 1.2 0.9 1.2
Japan 0.5 0.8 0.9 0.0 0.7
vast natural resources and reserve currency status of USD, US economy
United Kingdom 1.1 1.4 1.2 1.4 2.0
continues to grow at a healthy pace
Emerging Markets 5.1 4.8 3.9 4.4 4.7
Euro Area
Brazil 1.6 1.1 0.8 2.2 3.1
Russia 1.3 2.3 1.2 1.7 2.0
• Slowdown could be structural given the shrinking total population and
India 7.2 6.8 5.0 6.5 6.9
working age population China 8.3 6.6 6.1 6.0 5.9
South Africa 1.8 0.8 0.1 0.8 1.2
• Triggered by weak growth and low inflation, European Central Bank (ECB)
reduced the policy rate to -0.5% and restarted Quantitative Easing (QE)
during the year
For the decade ending (%) 1990 2000 2010 2020E
China
China GDP as % of World GDP (YE) 1.7 3.6 9.2 16.9
• Growth is stabilising at lower levels, albeit on a large base (USD ~14 trillion)
China GDP 10Yr CAGR (Real) 9.3 10.4 10.6 7.1
• Continues to increase its share of global GDP
• Share of consumption is rising after bottoming out in 2010 Share of World GDP growth (nominal) 0.8 7.9 15.1 37.6
Share of consumption in China’s GDP 49 47 36 39*
* share in 2018
Sources: IMF, Morgan Stanley
3
Refer disclaimers on slide 56Global unemployment at historic lows – Advantage India ?
• Unemployment rates in major economies (US, China, Japan and Euro Area) are
near all time lows after peaking around Global Financial Crisis (GFC)
‒ These 4 economies account for ~62% of global GDP and ~ 35% of global
population
• It is estimated that the working age population in China has peaked and is likely
to decline in % and in absolute terms by 2020 (compared to 2015)
• Income in China has risen significantly over the past two decades
‒ Till early 1990’s, China’s per capita income was similar to India’s.
Presently it is 5 times !
• India will displace China as the largest working age population globally by 2030
‒ This and lower wages present an opportunity for India
Sources: United Nations, World bank
4
Refer disclaimers on slide 56Yields, Policy Rates and Inflation – All trending downward
• Globally yields continue to soften.
US yields are trending lower for last 40 years !
Yields in Germany and Japan are also softening for three decades
• CPI has been range bound for a long period with low volatility, especially
post global financial crisis (GFC)
Million dollar question - Is inflation dead? Post GFC, weak inflation despite
unconventional monetary easing remains a puzzle for economists and
Central banks
• Central banks continue to lower rates driven by comfort of continued low
inflation and to support growth
Did you know ?
US Yields were 15% in 1980s , which coincides with early years of PIMCO, co-founded by Bill Gross in
1971; Under his leadership, PIMCO’s AUM rose to USD 2 trillion in 2013 from a beginning of USD 12 mn
Sources: Bloomberg; publicly available information. All charts are updated till December 27, 2019
5
Refer disclaimers on slide 562019 marked an unexpected reversal by Central Banks
• At the beginning of 2019, majority opinion was that global liquidity is set to
tighten and policy rates will rise
• Trade war uncertainty, low inflation, and slowdown in growth drove the global
central banks to do the opposite !
“Short-term market forecasts are poison and should be kept locked up in a safe
place, away from children and also from grown-ups who behave in the market
like children.” – Warren Buffet
Source: Kotak Institutional Equities
• Actions of major central Banks during 2019
‒ US Fed reduced rates by 75 bps after hiking 100 bps in 2018 and
started expanding its balance sheet again
‒ ECB reduced policy rate to -0.5% and restarted QE program
‒ Bank of Japan (BoJ) continued with QE
Source: Kotak Institutional Equities
• With global liquidity easing, 10 year sovereign bond yields of many EU * Change in total balance sheet size of 3 central banks
countries including Germany, turned negative in 2019
‒ Share of negative bond yields as % of total rose to ~35% during the
year, though declined to ~22% by Dec19
• With negative interest rates, we are now in an unchartered territory;
“Interest rates are like gravity in valuation. If interest rates are nothing, values
can be almost infinite. If interest rates are extremely high, that’s a huge
gravitational pull on value” - Warren Buffet
Did you know ?
Sources: Bloomberg, Kotak Institutional Equities, BofAML, Data updated till December 27, 2019; E-Estimates Interest rates are at near 5000 years lows
66
Refer disclaimers on slide 56Global Equities
CAGR (%) 2019* 3 years 5 years 10 years CAGR (%) 2019* 3 years 5 years 10 years
• Supported by low interest rates & ample liquidity, most global equity US 29.2 13.1 9.5 11.3 Brazil 32.3 25.68 18.35 5.59
markets were positive in 2019 Germany 26.1 5.15 6.08 8.38 Taiwan 24.1 9.9 5.58 4.25
France 27.6 7.59 7.03 4.43 China 20.3 -1.19 -0.98 -0.44
Japan 18.9 7.1 5.99 8.54 India 12.7 15.09 8.34 8.98
UK 13.6 2.64 2.95 3.53 Indonesia 2.2 7.44 4.13 9.83
Singapore 5.1 3.79 -0.77 1.29 Malaysia -4.7 -0.19 -1.81 2.45
%
• World market cap to GDP is above long term average
6
S&P 500 Dividend Yield - US 10 Year Bond Yield
FTSE 100 Dividend 12 Month Yld Gross - UK 10 Year Bond Yield
4
DAX Dividend 12 Month Yld - Gross - Germany 10 Year Bond Yield
2
• Dividend yields in many advanced economies are higher than their
0
respective 10Y Gsec yields
-2
-4
-6
89 91 93 95 97 99 00 02 04 06 08 10 11 13 15 17 19
How long can dividend yields higher than 10Y Gsec yields sustain ?
Sources: MFI explorer, Bloomberg, *Data updated till December 27, 2019
7
Refer disclaimers on slide 56US Equities: Low yields supportive of valuations
• US valuations and market cap to GDP are near life time highs
• Valuations are supported by
‒ Lower bond yields and ample liquidity
‒ Record buybacks (2018: US$ ~$ 800 bn; 2019E: ~US$ 700 bn)
• US corporate profits to GDP is also at life time high
• Bubble or Value ? – Opinions are sharply divided
An environment of low interest rates has set off a search for yield and created
stretched valuations in risk assets, including the U.S. equity market.
- IMF Report, Oct’19
“People complain that the market is overvalued but … with these interest rates,
the market is really below fair value,”
- Byron Wien, Vice Chairman, Blackstone
• In 2019, the spread between US 2Y and 10Y Gsec yields turned negative i.e.
Yield curve inverted, for a brief period. Over past 3 decades, Yield curve
inversion has been followed by sharp slowdown in US
“Reversion to the mean is the iron rule of the financial markets”
– John C. Bogle
Sources: Bloomberg, Morgan Stanley
8
Refer disclaimers on slide 56Value vs Growth Investing – Will the tide reverse ?
1.9 MSCI World Value Index as
• Simply put, Value Investing is investing in stocks / assets that are currently underpriced
proportion of MSCI World
1.7 Growth Index (Since
relative to their true intrinsic value. Conversely, Growth Investing is investing in stocks /
Inception in 1975)
assets that have potential for higher business growth in future 1.5
1.3
• MSCI World Value Index as a proportion to MSCI World Growth Index is currently at all time
1.1
low 0.9
74 77 80 83 86 89 92 95 98 01 04 07 10 13 16 19
MSCI Growth MSCI Value Difference
Period (% Return (% Return (B-A)
• Alternating outperformance by Value & Growth stocks CAGR) – A CAGR) – B % CAGR
1974-97 10.6 12.3 1.7
‒ MSCI Value index outperformed MSCI Growth index by 1.7% CAGR between 1997-99 31.9 14.4 -17.5
1999-07 -1.3 3.8 5.1
1974-97
2007-19 8.1 1.7 -6.4
1974-2019 7.88 7.82 -0.06
‒ Subsequently, Growth index outperformed between 1997-99 by 17.5% CAGR
during tech bubble 10%
5Y return MSCI Value minus
MSCI Growth
‒ Value again outperformed Growth between 1999-2007 by 5.1% CAGR 5%
‒ From 2007 till present, Growth has outperformed Value by 6.4% CAGR. This is the 0%
longest period of Growth outperforming Value !
-5%
“The intelligent investor is likely to need considerable will power to keep from following
-10%
the crowd” - Benjamin Graham 79 84 89 94 99 04 09 14 19
Sources: Bloomberg, MSCI, Data updated till December 27, 2019
9
Refer disclaimers on slide 56Global Commodities & Currency movements
Table 1
• Impacted by trade tensions and slowing growth in China, most CAGR (%)
Market price
2019* 3 Year 5 Year 10 Year
(USD)*
industrial commodity prices declined in 2019 (Table 1) Brent Crude (Per barrel) 68 26.7 6.3 3.5 -1.3
Gold (per ounce) 1,511 17.8 9.6 5.0 3.3
• Crude prices increased due to production cuts by OPEC & Russia
Steel (per tonne) 549 1.3 0.7 2.7 -0.4
• Driven by risk aversion & low / negative interest rates, gold prices Zinc (per tonne) 2,312 -8.2 -3.3 1.3 -0.9
increased sharply in 2019 after being range bound for past few years Copper (per tonne) 6,188 4.0 3.9 -0.6 -1.7
Aluminium (per tonne) 1,799 -3.4 1.8 -0.3 -2.0
Lead (per tonne) 1,910 -4.9 -1.3 0.6 -2.2
Bloomberg agri index NA 8.8 0.6 -0.6 -0.5
NA – Not applicable
Table 2
Cumulative
vs USD \ CAGR (%)* 2019* 3 Year 5 Year 10 Year
in 10 years
• In 2019, currencies showed a mixed trend against USD (Table 2)
Pound 2.5% 1.9% -3.6% -2.1% -23.6%
• However, over last decade, major currencies have depreciated Canadian Dollar 4.1% 0.9% -2.4% -2.2% -24.2%
against USD Japanese Yen 0.2% 2.2% 1.8% -1.6% -17.6%
Australian Dollar -1.0% -1.1% -3.2% -2.5% -28.6%
Euro -2.6% 2.0% -1.6% -2.5% -28.1%
South Korean Won -4.5% 1.2% -1.3% 0.0% 0.2%
Russian Ruble 10.4% -0.3% -1.3% -7.5% -107.0%
Mexican Peso 4.1% 3.1% -5.0% -3.7% -44.0%
Indonesian Rupiah 3.0% -1.2% -2.4% -4.0% -48.4%
South African Rand 2.2% -0.7% -3.9% -6.6% -89.7%
Chinese Yuan -1.9% -0.3% -2.5% -0.3% -2.6%
Indian Rupee -2.3% -1.7% -2.5% -4.4% -53.4%
Brazilian Real -4.4% -7.5% -8.8% -8.8% -132.0%
Turkish Lira -12.5% -19.1% -20.6% -14.8% -297.0%
Sources: Bloomberg. MFI Explorer; * +/- means appreciation / depreciation respectively against USD; *All figures updated till December 27, 2019
10
Refer disclaimers on slide 56USD: Can the dominance sustain?
• USD (DXY Index) has strengthened significantly over the past
decade (~25%) despite high and sustained current account
deficits; this is primarily due to USD being the global reserve
currency
Data updated till 27th Dec, 2019, Data updated till Sep’19,
• However, this was not always the case; Over the last few centuries, various currencies have acquired the status of reserve currency based on the
economic power, importance in world trade and global acceptability of the respective countries
• Interestingly, each such phase lasted between 75 to 125 years. USD’s dominance has completed ~ 100 years
Approximate timelines of change in global reserve currency in the past*
US
Portugal Spain Netherlands France Britain
1920 – till ?
1450-1530 1530-1611 1642-1720 1720-1815 1815-1920
now
• Opinions are divided about prospects of USD
Longer term, I’m obviously not optimistic about the U.S. dollar. You just have The bottom line is that the more instability and uncertainty in the era
to look at the U.S. administration and their economic policies that will not be ….. the more likely the greenback remains the world’s pre-eminent
very conducive for dollar strength in the long run – Marc Faber reserve currency – John Lee, Senior Fellow at Hudson Institute
Sources: Bloomberg, * https://thistimeitisdifferent.com/reserve-currency-may-2018
11
Refer disclaimers on slide 56Key Future Trends
1. Climate change and its impact
2. Renewables and their progress in India
3. Liquefied Natural Gas
4. Demand Outlook of crude oil
5. Electric vehicles
12
Refer disclaimers on slide 56Climate Change –Increasingly in focus
415
• It is widely believed that rising greenhouse gases (GHGs) are responsible for rise
0.9 Annual Avg. Temperature
Temperature Anomaly
Anamoly (LHS)
Concentration in Parts
in average global temperature
CO2 Concentration (RHS)
per MIllion (ppm)
365
0.4
(°C)
• As per EU commission, GHGs concentration was 45% above the pre-industrial
levels. Global growth rate of CO2 has nearly quadrupled since the early 1960s -0.1
315
• To limit the rise in global temperature to below 2°C, as per the Paris Climate -0.6 Source: Morgan Stanley 265
1880 1903 1926 1949 1972 1995 2018
Agreement, annual CO2 emission will have to reduce by 60% by 2050 over 2010
Table:1 - Primary energy mix
• Most of the CO2 emissions are due to combustion of fossil fuels 1965 1985 2005 2018 2040* 2040**
Mmtoe@ 3,703 7,168 10,888 13,865 17,866 16,390
‒ Power sector contributes ~25% and other energy-related sectors Share of (in %):
Oil 42 41 37 34 27 23
(transport, industries etc.) contribute ~35% to CO2 emissions
Gas 15 20 22 24 26 26
Coal 38 29 29 27 20 7
• Rising temperature is believed to be causing irregular weather patterns. Nuclear 0 5 6 4 4 6
Hydro 6 6 6 7 7 9
Countries are pledging to increase focus on renewable energy and reducing RE 0 0 1 4 15 29
carbon emissions (Table 1) @ - million metric tonnes of oil equivalent * Evolving transition ** Rapid transition
Table:2 - Targeted annual GHG emission to meet Paris objective
• As per a report by JP Morgan, US, Europe and China will have to reduce CO2
in Gigatonne (Gt) 2010 2020 2030 2050
emissions by more than 70% while India by ~60% over 2020-50 to meet the Total GHG emission 47.5 53.0 42.2 17.9
Paris Climate targets (Table 2) CO2 emission 30.7 35.4 29.7 12.1
Power generation/heating 11.6 13.5 9.4 2.0
Climate Change is the defining issue of our time and we are at a defining Transport 7.1 8.6 7.9 4.0
moment. From shifting weather patterns that threaten food production, to rising Industry 6.1 6.4 6.0 2.3
sea levels that increase the risk of catastrophic flooding, the impacts of climate Building 2.9 2.9 2.4 1.4
change are global in scope and unprecedented in scale. Without drastic action Agri/others 3.0 4.0 4.0 2.4
today, adapting to these impacts in the future will be more difficult and costly.
- United Nations on Climate Change Sources: BP, JP Morgan
13
Refer disclaimers on slide 56Renewable energy – Rapidly gaining traction
0.40
• Solar and wind energy is rapidly gaining traction due to falling costs Tariffs - USD/kWh (2018)
0.30 Solar PV
Importance of Sun is well documented in Ancient Indian texts; e.g. a hymn from
Samba Puran Wind Onshore
0.20
0.10
You are a massively Enlarged Mass of Fiery Energy, which pervades 0.00
everywhere like Air and Sky, You are the Lord of all the Worlds, I salute You, O 10 11 12 13 14 15 16 17 18
Sun-God
2000 2010 2018
Global Electricity generation - TWh 15,548 21,574 26,615
• Share of Renewable energy (RE) (ex-hydro) in global electricity generation Renewable - TWh 218 754 2,480
has increased from ~1% in 2000 to ~9% in 2018. As % of incremental Renewable as % of total 1.4 3.5 9.3
RE as % of incremental 2.9 9.0 33.5
generation, RE was more than 30% in 2018
Cumulative capacity – MW
• IEA expects doubling of investment in low-carbon power to ~USD 700b Solar 651 39,532 487,829
Addition 227 17,059 95,566
p.a. to achieve the Paris Agreement targets over 2025-30
Wind 17,304 180,941 564,347
Addition 3,877 30,760 49,172
300
• RE annual additions are expected to double over the next decade Renewable addition - GW
250 Onshore Wind
Offshore Wind
‒ It is to be noted, as PLF of solar and wind is lower (18-40%) than 200 Solar
Hydro
thermal (70-90%), hence capacity addition does not represent 150
actual power generation 100
Note: The comparison of renewable energy is in terms of generation and not capacity. This is 50
to consider for the lower utilization factor of renewable energy sources like solar and wind vs.
0
the conventional generation plants.
01 03 05 07 09 11 13 15 17 19 21 23 25 27 29
IEA - International Energy Agency; PLF – Plant load factor
Sources: Morgan Stanley, Irena, BP
14
Refer disclaimers on slide 56Solar energy in India – increasing role
• Share of RE in India’s power generation increased from ~6% in FY14 to ~9% in
Solar installed capacity in India - GW
FY19, primarily driven by solar (‘nil’ to ~3% during this period)
120
100
100
* 100GW targeted solar capacity by
• India has a target of 100GW of solar capacity by 2022. Key drivers of solar 80 2022-end (including off-grid)
power are falling solar panel costs, easy implementation and low inflation risk 60
37
40 28 32
22
20 12
• While tariffs are similar for solar and wind, solar is more scalable 3 4 7
0
FY14
FY15
FY16
FY17
FY18
FY19
8MFY20
FY20E
FY22*
• Challenges to Solar energy
1 GW (Gigawatt) = 1000 MW (Megawatt)
‒ Transmission costs are higher as supply is intermittent
20.0 17.9
18.0
Solar tariff (min bid)
‒ Solar displaces conventional generation but not conventional capacity 16.0
14.0 Wind tariff (min bid) in INR /kWh
(which is required for the peak load during evening in India). The under- 12.0
12.0
utilization of conventional capacities is an indirect cost of solar 10.0 8.4
8.0 7.0 6.5
6.0 5.1
4.3
3.3 2.7
4.0 2.4 2.5
‒ Without energy storage solutions, solar power generation could face
2.0
grid balancing limits. Solar power with battery backup, adds ~INR 7- 0.0
FY10
FY11
FY12
FY13
FY14
FY15
FY16
FY17
FY18
FY19
Last bid
10/kWh to the cost of solar power. Economical battery solutions are not
available currently
Sources: ICICI Securities. IDFC Securities
15
Refer disclaimers on slide 56LNG: Rising supply & falling costs should increase share of LNG
• Liquefied Natural Gas (LNG) is natural gas which is liquefied for transportation and
then converted back to gas for use. It is used as a substitute for oil and coal. As
natural gas transportation costs are high, consumption is generally local
• Liquefaction projects are on the rise globally. Global LNG supply has increased by
~ 0.7 mmbpd i.e. ~50% of incremental oil demand over 2016-18
‒ LNG supply is projected to rise from 7.6 in 2018 to 9.7 mmbpd p.a. by 2023
‒ Thus, the average incremental LNG supply per annum will be equal to ~1/3rd
of the incremental oil demand each year (Total global oil consumption is ~100
mmbpd growing at 1-1.5% p.a.)
• LNG prices have been trending lower on back of higher supplies
• Advantages of LNG
‒ Worldwide proven reserves of natural gas are ~85% of oil reserves
‒ Natural gas has lower emissions than coal and liquid fuels
‒ Beneficial for Current account deficit countries like India as higher value is
captured in the country of import compared to oil
*BOE = barrel of oil equivalent; Prices updated till Nov 1, 2019
Did you know ?
Globally, total natural gas flared in 2017 is equal to
2.6 times of India's annual consumption
Sources: BP Energy Outlook, Bloomberg, Global Gas Flaring Reduction Partnership (GGFR), a World Bank-managed organization
16
Refer disclaimers on slide 56Oil – Changing Demand - Supply Dynamics
US becomes the largest oil producer Oil demand to peak by 2030 as per BP^
• Rising shale oil production makes US the largest oil producer • Demand has peaked in developed markets like US, EU and Japan
• US share in world oil supply increased from 9% in 2009 to 14% in 2017 • EV push, increasing mileage, slowing demand growth in India /
China should lead to global oil demand peaking by 2030
Million
United
Barrels Per EU China India World
States
16 Day
US
1990 17 14 2 1 66
15 Russian Federation
1995 18 14 3 2 70
14 Saudi Arabia
2000 20 15 5 2 77
million barrels per
13 2005 21 15 7 3 84
12 2010 18 14 9 3 87
11 2017 19 13 13 5 96
2020E 19 12 14 5 99
10
2025E 18 11 16 6 103
9
2030E 18 10 16 8 106
8 2035E 16 9 17 9 106
7 2040E 15 8 15 9 104
2009 2011 2013 2015 2017 1990-2017
0.4% -0.3% 7.1% 5.9% 1.4%
(CAGR)
Includes crude oil, shale oil, oil sands and NGLs (natural gas liquids)
2017-2040
-0.8% -2.0% 0.7% 3.1% 0.3%
(CAGR)
Rising shale oil production, peaking global demand driven by EVs and LNG
increasingly substituting oil indicate moderate long term demand outlook for oil
Source: ^British Petroleum (BP)
17
Refer disclaimers on slide 56Electric Vehicles (EVs), fully charged
• EVs continue to progress rapidly globally
USD / KWH
• Tesla dominates the EV-PV market with an installed capacity of 440,000
pa in USA and a new 150,000 vehicles pa factory in Shanghai. Declining battery price outlook
• Tesla unveiled its Pickup truck (Cyber truck) aimed at US market. Other
carmakers have also launched EVs in pickup and other segments.
Source: UBS
‒ Amazon has ordered 100,000 EV vans from Rivian.
• Heavy duty truck makers Daimler and Navistar announced plans to start Table:1 - % of new car sales
2015 2017 2018 2020E 2025E
production of heavy duty EVs from 2021.
China 1.0 2.3 4.5 7.1 31.3
• Major auto OEs announced USD2.3bn investment along with LG Chem
US 0.7 1.2 2.1 2.8 5.3
for manufacture of EV batteries in USA. Europe 1.0 1.4 1.9 4.2 28.0
• China is taking the lead in Evs. EV’s share in PV sales in China is likely World 0.6 0.8 2.1 3.4 16.6
Source: UBS
to reach 7% in 2020 (Table 1) and surge to 31% by 2025.
• Adoption of EVs in India is improving. Evolution of EVs is likely to be 3 Wheeler
2 Wheeler Cars CVs
from public transports like 3W/Buses to 2W to Cars and then to CVs / Buses
Toyota is now faced with a higher-than-expected demand for We will offer 25 electrified vehicles already in 2023 – two years Our new overall plan for 1.5 electric cars in 2025 shows
cars that use batteries, rather than gasoline. - earlier than originally planned. We expect to see a steep that people want climate-friendly individual mobility – and
Toyota EVP Shigeki Terashi + growth curve towards 2025: Sales of our electrified vehicles we are making it affordable for millions of people. -
should increase by an average of 30 percent every year. Thomas Ulbrich, Member of the Volkswagen brand
-Harald Krüger, CEO of BMW^ Board of Management responsible for E-Mobility*
Success of EVs is positive for India. Net oil Imports in India are 4% of GDP and CAD is 2%. As EV share rises, oil imports should
moderate in long term; Global growth in EVs should also keep oil prices in check
Sources: UBS; PV – Passenger vehicle, ICE - Internal combustion engine, ^dated June 25, 2019, *dated Dec 27, 2019, + dated June 6, 2019; CAD – Current account deficit
18
Refer disclaimers on slide 56Indian Economy
A 1000 year trend of declining share of India’s GDP of world’s GDP reversed in 1993 !
India's share of 1000 1500 1600 1700 1820 1870 1913 1950 1973 2001 2018
1. Since 1700, post colonization by British, India share of global GDP (in PPP
World GDP (%)* in terms) declined significantly to 3% in 1973 and has since risen to ~8%
29 24 22 24 16 12 7 4 3 5.4 8**
PPP terms
World GDP in 2. In nominal terms (USD), India’s share of global GDP bottomed out in 1992-93
NA 2 1.5 3.2 at 1.1% and has since risen to over 3% in 2018
nominal terms** (%)
World population
27 18 18 27 20 20 17 14 15 17 18
(%)*
Source: * GDP based on 1990 international Geary-Khamis dollars (PPP based) - The World Economy: Historical
Statistics, published in 2003 by Angus Maddisson published by OECD Publications. **Source: World bank
19
Refer disclaimers on slide 56Indian Economy – Growth moderates, other parameters stable
Table 1
• Over the past few years, most macro economic parameters are improving Improving macros FY15 FY17 FY19 FY20E FY21E
or are stable; however growth has slowed down in FY20 (Table 1) Real GDP at market price (% YoY) 7.4 8.2 6.8 4.7 5.5
Centre's fiscal deficit (% GDP) 4.1 3.5 3.4 3.8 3.7
Current Account Deficit (CAD) (% GDP) 1.3 0.7 2.1 1.5 1.6
• Both consumption (58% of GDP) and investments (29% of GDP) slowed down Balance of Payment (% of GDP) 3.0 0.9 -0.1 1.2 0.9
significantly in H1 FY20 (Chart 1) Consumer Price Inflation (CPI) (Average) 6 4.5 3.4 4.2 4.5
Foreign Exchange Reserves (USD bn) 341 370 412 454^ NA
• Auto sector, especially Passenger vehicles (PV), despite low penetration, Source: Kotak Institutional Equities, E-Estimates, ^ as of 13th Dec 19. na – not available
slowed down sharply in 2019. Sharp de-growth of production in auto sector
(~3-4% of GDP) was a key contributor to slowdown (slides 21-22)
Chart 1
• Slowdown was also observed across other segments like cement, air
travel, consumer durables, etc. (charts 2 to 4)
• Slides 21-22 explain the key reasons for slowdown, what was sustaining
consumption till now and growth outlook for FY21
Chart 2 Chart 3 Chart 4
Sources: CMIE, Kotak Institutional Equities
20
Refer disclaimers on slide 56Slowdown demystified
A leading IT Company (INR Real
• Core issue is degrowth in white collar private sector wages in real terms millions per annum)
FY04 FY19 CAGR (%)
growth
Typical Entry level (approx.) 0.2 0.4 4.7 -2.1
‒ White collar wages, in real terms, have de-grown by 27% in 15 Average salary 1.15 1.77 2.9 -3.9
years (as measured by entry level IT salary) Average inflation 6.8
‒ Average wage bill (salary per person) of a leading IT company has
grown at CAGR of 2.9% only over FY04-FY19
‒ While real wages were weak for 10-15 years, consumption
sustained in this period, probably due to falling savings and debt led
consumption
Sources: Kotak Institutional Equities, Morgan Stanley
• Sharp increase in bankruptcy cases over last few years impacted wages / jobs for many#
‒ Over 2,500 companies were admitted under IBC till Sep’19, ~600 were closed by liquidation and ~1,500 are still under process
‒ Just the 22 companies / groups in IBC had ~60,000 employees
• Weak private investment. Large number of companies in capital intensive sectors like steel, power and Infrastructure are under IBC. This has resulted
in supply of ready assets below replacement cost; hence new asset creation was discouraged
• Slowdown, in our opinion, was also exaggerated due to sharper decline in wholesale volumes in auto sector due to high inventory with dealers in FY19
and transition to BS VI norms from April 2020, that necessitated an inventory correction of old stock
• Challenges faced by NBFCs and erosion of wealth due to sharp correction in midcap/small caps also had an adverse impact
Sources: # IBBI.gov.in, Capitaline, Kotak Institutional Equities, Morgan Stanley
21
Refer disclaimers on slide 56Why do we think Economic growth has bottomed ?
Chart 1
• Link between Auto sector and GDP slowdown – 2 sides of the same coin
‒ Auto sector accounts for ~3-4% of GDP; thus volume de-growth of ~15%-20%
shaves off 0.5% - 0.8% of GDP growth
‒ With inventory correction over, even if auto volumes are flat next year, GDP growth
should be higher by 0.5-0.8% in FY21, on this count alone
• Lower corporate tax cuts for new manufacturing units
‒ In a path breaking decision, government reduced the corporate tax rate to 15% for
all new manufacturing units that commence production before Mar-23 Chart 2#
‒ In our view, given the general time to set up new unit is 2 - 4 years and deadline of
Mar-23 to avail tax benefit, private capex should improve in FY21, especially by
MNCs
• Measures taken by Government & RBI
‒ Reduction in corporate tax rates & policy rates (135 bps in 2019);
‒ Multiple steps taken to resolve liquidity issues in NBFCs and Real estate;
‒ Focus on improving ease of doing business; India’s rank improved to 63 from 77 in
2018 & 100 in 2017
• Post verdict on Essar steel case, most large assets in Power, steel, infrastructure etc. are Table 1
likely to be resolved under IBC in FY20. This should improve capex in FY21 as
2 years ago Currently Saving
‒ New owners of IBC assets are likely to incur incremental capex to optimise Home Loan (INR) 4,000,000 3,800,000^
efficiency etc. E.g.- Arcelor Mittal indicated capex of INR 80 bn in Essar
Tenor (In years) 20 20
‒ For growth, now new units will have to be planned as no existing units are available Interest rate 9.2% 8.3%
• With decline in interest rates (Table 1) and real estate prices (Chart 2), EMIs of home loans EMI for home loan (36,376) (32,498) 10.7%
have reduced, thus improving affordability ^assuming 5% decline in real estate prices
Sources: CMIE, ICICI Securities, PIB, # -Real estate prices are indexed starting Sep17
22
Refer disclaimers on slide 56Corporate Tax Rate Cut – Addressing the weak link
Chart 1 Chart 2
• India lagged China & other Asian countries in manufacturing (Chart 1)
‒ In 2018, China’s manufactured exports were ~8 times of India’s;
Even Vietnam’s manufactured exports, which is 1/10th the size of
India, are comparable with India’s manufactured exports (Chart 2)
Chart 3 Chart 4
Manufacturing – Opportunity knocks again for India
• Global companies are now looking to shift and diversify their supply
chain from China. This is driven by
‒ China’s edge of low costs has diminished with rising labor costs
‒ Cost of real estate has risen significantly in China
‒ Stringent environmental standards
‒ Increasing trade tensions with the US
• India was not a preferred destination compared to Asian countries
despite a large domestic market, improving ease of doing business, Chart 5
similar labour costs, availability of skilled resources etc. mainly due to
higher tax rates
• With the recent corporate tax rate cut (from 30% to 15%) for new
manufacturing units, India’s tax rate is now amongst the lowest in the
region. With this, manufacturing in India should get a boost (Chart 5)
Sources: Kotak Institutional Equities, JM Financials, Bloomberg, JETRO
23
Refer disclaimers on slide 56Road to US$ 5 trillion economy gets a Rs 100 trillion (US$ 1.4tn) Infra spending boost !
• On 31st Dec, 2019, Government announced a massive thrust on Infra with 23
19.5 19.0
doubling of planned project pipeline (National Infrastructure Pipeline - NIP) to Rs Total Infra spend (Rs tn)
18
13.6 13.8
102 trillion (tn) over next 6 years vs Rs 56 tn spent in last 6 years ! 12.8
13 10.2 10.0 11.1
8.5 9.2
6.3 7.0
• The list of projects is part of a report prepared by a task force under the 8 5.3
chairmanship of the Economic Affairs Secretary 3
13 14 15 16 17 18E 19E 20E 21E 22E 23E 24E 25E
Source: National Infrastructure pipeline, GOI
• Planned spending will be frontloaded between FY20-22E with focus on roads,
railways and urban infra while renewables will gain traction in later phases.
• Spending to be funded by Center 39%, States 39%, & Private sector 22%
• Out of Rs 102tn , projects worth Rs 43tn are already under implementation, Rs
20tn are under development & another Rs 32tn are at conceptual stage
• Focus on Roads (19%), Urban & Rural infrastructure / housing (20%), railways
(13%) & renewable energy (9%)
Source: Antique Stock Broking
• Revival in real estate & manufacturing to drive GFCF CAGR of 15% between
FY19-24E compared to 10% between FY11-19 (Antique estimate)
• Infra spending boost along with Corporate tax rate cut (slide 23) announced earlier
will aid competitive edge to Indian manufacturing
Source: Antique Stock Broking
24
Refer disclaimers on slide 56Equity Markets
“Compound interest is the eighth wonder of the world. He who understands it, earns it …
he who doesn't … pays it.” - Albert Einstein
25
Refer disclaimers on slide 56Slowing growth, rising markets – A Five point explanation for this
Table 1
• One year of slowdown does not impact long term growth estimates for a country
Decade 1990-00 2001-10 2011-19E
like India which is a secular long term growth story
Average GDP growth 5.5% 6.4% 6.9%
‒ 3% lower growth in a year has minimal impact on DCF value of NIFTY50
Number of Years of sub 5% growth 3 4 1
‒ Periods of high growth invariably have years of weak growth. Just like a
good batsman who performs poorly in some matches. Infact, in each of
the last 3 decades there have been years of sub 5% growth (Table 1) Table 2
NIFTY 50
Sector Comments
Weight %
• 10 year NIFTY50 returns (9% CAGR) have lagged nominal GDP growth (13%
Market share gains from NBFCs, sharp fall in
CAGR) for 10 years ! This has resulted in low Marketcap to GDP (slide 28) Banks 30
provisioning costs is offsetting impact of slow growth
FMCG (ex
Consumer Discretionary experiencing sharp
Tobacco), 13
• Gap between Bond Yields (10Y Gsec) and Earnings yield (1Y-Forward NIFTY50) is Auto, Retail
slowdown; Consumer Staples growth moderating
low; Lower Interest rates have made up for the slow growth ! (slide 28) Being Export oriented, necessity nature (pharma),
IT, Pharma 15
impact of slowdown is minimal
Oil & Gas, Demand / Profitability is a function of global
16
Metals commodity prices. Marginal Impact of slowdown.
• Consumption slowdown impacts around 15% of NIFTY50 only (Table 2)
NBFCs / While slowdown impact growth adversely, lower
10
HFCs credit spreads for strong NBFCs is positive.
• NIFTY Profit Growth is improving despite slow GDP growth driven by corporate Engineering Healthy order backlog, moderate growth continues.
4
/ Capex Incremental impact of slowdown is low.
banks, metals & utilities sector (slide 29)
Tobacco Tobacco – Low impact of slowdown 4
Utilities RoE based businesses. Low impact of slowdown 2
Telecom, Telecom – Price increase is positive,
Cement, Cement – Volume growth has slowed 6
Media etc. Media – Material slowdown in growth
RoE – Return on Equity
Source: Kotak Institutional Equities, E- Kotak Estimates; DCF – Discounted cash flows. Data updated till December 27, 2019
26
Refer disclaimers on slide 56The end of Largecaps vs Mid / Small caps debate ?
Table 1
CY19 YTD 10 15
5 Years
• Over last few years, a popular belief was that mid / small cap companies grow in % CY14 CY15 CY16 CY17 CY18 upto 27th Years Years
CAGR
faster than larger companies. This belief was probably a result of higher returns Dec CAGR CAGR
Nifty 50 31.4 -4.1 3.0 28.6 3.2 12.7 8.1 8.9 12.5
delivered by small / mid caps between CY14 - 17. (Table 1)
NIFTY 500 37.8 -0.7 3.8 35.9 -3.4 5.7 7.4 8.4 11.9
NIFTY MidCap 55.9 6.5 7.1 47.3 -15.4 -4.9 6.2 8.6 8.6
• In our judgment, Growth is a function of maturity of the business and not its size. NIFTY SmallCap 55.0 7.2 2.3 57.3 -29.1 -10.7 1.2 4.8 9.9
Size on the other hand is a function of the nature of the business. Midcap O/p 24.5 10.5 4.1 18.6 -18.6 -17.6 -1.9 -0.3 -3.9
MSCI World Small Cap 0.4 -1.8 10.9 20.9 -15.2 20.1 6.8 8.9 6.3
• Data suggests that over long periods, category average returns for large caps MSCI World 2.9 -2.7 5.3 20.1 -10.4 21.7 6.7 7.3 4.8
and mid / small cap are comparable globally as well as in India. However, there
are periods when mid / small cap outperform largecaps and vice versa (Table 1). MSCI US Small Cap 11.1 -0.8 9.2 19.5 -6.3 25.6 9.4 11.3 6.9
MSCI US 6.0 -5.1 17.8 15.6 -11.4 22.3 7.5 11.3 7.3
Hence, to achieve better portfolio diversification across cycles, an investor
portfolio should have an appropriate mix of both large caps and mid / small caps. MSCI EM Small Cap -1.1 -8.8 0.3 31.2 -20.3 3.0 0.7 0.7 5.1
MSCI EM -4.6 -17.0 8.6 34.3 -16.6 7.7 3.2 1.2 4.9
• Outperformance during CY14-17 by Midcap / Smallcap indices vs Largecaps was
Chart 1 Chart 2
driven mainly by P/E rerating and less by higher profit growth. This probably led to an
over valuation of mid / small caps. (Chart 1 & 2) 180% NIFTY Midcap premium
Earnings growth (TTM)
160% to NIFTY 50
Average
• Subsequently, with the correction in mid / small cap stocks in 2018 & 2019, 10 year 10 140%
returns and valuations for Large caps and mid / small caps have converged. Hence, in 120%
our judgment, the returns of large cap and mid / small cap should not diverge 100%
materially over the medium to long term. 80%
Broad Market Nifty 60%
-10
05
06
07
08
09
10
11
12
13
14
15
16
17
18
19
• Also, the rally in NIFTY50 was a narrow rally. Top 5 stocks contributed to 152% & 81% 13 14 15 16 17 18
of NIFTY 50 returns in CY18 & CY19 respectively. In our judgment, such conditions
will be short lived and we expect markets to become more broad based. How much to allocate in Largecap and Small / Midcaps ?
In our judgment, 2/3rd to 3/4th allocation to Large caps and 1/3rd to 1/4th allocation to mid
/ small cap is a sound strategy for a typical investor
“What is right is not always popular and what is popular is not always right”
Albert Einstein This strikes a balance between stability of large caps and potential of mid / small caps
mainly driven by stock selection by the Fund Manager
The views are not an investment advice. Investors should obtain their own independent professional advice before taking a decision to invest in any securities. Returns are not assured. HDFC Mutual Fund/AMC is not
guaranteeing any returns on investments made in the Scheme(s). Historical indicators are no guarantee of future results,
Sources: Morgan Stanley, MSCI data, Bloomberg, Broad Market as defined by Morgan Stanley stands for listed Indian companies with quarterly data for 8 or more quarters which comes to about 1200 companies.
27
Refer disclaimers on slide 56Indian equities – Attractive Valuations
Table 1 – Periods when10 year NIFTY Return trailed / exceeded
Nominal GDP Growth materially
• Over the long term, stock market indices in India are growing around the same rate as
Trailing 10 year Trailing Nominal Next 10 year
the nominal GDP Year NIFTY Return GDP Growth (10 NIFTY Return
(CAGR) year CAGR) (CAGR)
2001 7% 13% 16%
‒ This implies that when in any extended period of, say 10 years, indices grow
2002 4% 13% 18%
2003 6% 12% 13%
significantly less than nominal GDP, they tend to make up in the future by 2004 6% 12% 15%
2006 16% 12% 8%
delivering higher returns & vice versa. Interestingly, we are in a similar 2007 19% 12% 6%
2016 8% 14% ?
situation presently (Table 1) 2017 6% 13% ?
2018 14% 13% ?
2019 9% 13% ?
India market cap to GDP ratio, calendar year-ends 2005-21E (%)
170 Mcap/GDP (%) 25
23
NIFTY 12M forward P/E (X) (RHS) 22
• Marketcap to GDP at 61% and CY21(E) P/E of ~15x is attractive, specially at time when 150
149 20 21
130 18 17 19
17 18
17 16 16
NIFTY50 profit growth is estimated at 18% CAGR over FY19-22E and interest rates are 110 15 15 17
13 14
90 99 13
88 11 13
92
low 70 69
98
81 75 78 75
72 65 71 67 9
50 56 61 61
30 5
05
06
07
08
09
10
11
12
13
14
15
16
17
18
19E
20E
21E
• Gap between 10Y Gsec yield and 1Y-Forward NIFTY 50 Earning yield [i.e. 100/ (one
14.0
10Y Gsec and NIFTY Earning Yield near equal
year forward P/E)] has reduced significantly and is now below 10 year average (1.7%) 10.0
6.0
indicating that equities are attractively valued relative to current bond yields
2.0
-2.0 Yield gap (%)
Low Marketcap to GDP, Bond yields equal to Earnings yield and recovery in profit Earnings yields (%)
-6.0 India 10-y G-Sec yields (%)
growth make us optimistic on markets over medium to long term 06 07 08 09 10 11 12 13 14 15 16 17 18 19
Source: Kotak Institutional Equities, updated till 30th Nov, 2019, From 2005-18, NIFTY50 PE is based on 12 month forward estimated EPS. For 2019E, by Kotak Institutional
Equities has calculated PE based on EPS numbers as of Mar-20 end, 2020E based on EPS of Mar-21 end and for 2021E based on EPS of Mar-22 end
28
Refer disclaimers on slide 56NIFTY 50 profits growth – Recovery firmly in sight
Table 1
• For several years now, strong growth in profits has been elusive Profit after Tax (Rs bn) CAGR %
FY13 FY19 FY22E FY13-19 FY19-22E
NIFTY 50 ex Corporate Banks 2,133 3,617 5,111 9% 12%
• For all the noise, slowdown in NIFTY 50 profit growth was led almost
Corporate Banks 289 106 937 -15% 107%
entirely by falling profits in Corporate Banks (Table 1). Share of
NIFTY 50 2,422 3,723 6,047 7% 18%
Corporate Banks in NIFTY 50 profits fell from 12% to 3% between FY13
& FY19 (Table 2)
Sector contribution to NIFTY
FY13 FY19 FY22E
50 profits (%)
• With profitability of Corporate Banks normalizing, the overall NIFTY 50
Consumer Discretionary 10 7 6
profit growth is expected to bounce back Consumer Staples 5 6 6
Table 2 Corporate Banks & Financials 12 3 15
Energy 29 30 22
Information Technology 15 19 15
Materials 8 11 9
Retail Banks & Financials 7 13 15
Others 15 13 12
Total 100 100 100
GNPL of Corporate Banks
• Normalization in profitability and RoE of Corporate Banks is expected by 16% RoE of Corporate Banks 15% Slippagesof Corporate Banks
FY22E as slippages and provision costs are falling and recoveries are 11%
10%
increasing. 6%
1% 5%
-4% 0%
12
13
14
15
16
17
18
19
20E
21E
22E
12
13
14
15
16
17
18
19
20E
21E
22E
NIFTY profit growth of 18% CAGR is expected between FY19 and FY22E led by recovery in profitability of Corporate Banks
HDFC Mutual Fund/AMC is not guaranteeing any returns Source: Kotak Institutional Equities, E- Kotak Institutional Equities Estimates as on 20th December, 2019
29
Refer disclaimers on slide 562019 – Sustained Domestic flows continue to drive equities volatility lower
Secondary Flows Last 5 Last 10
• FPI inflows of US$14.4bn into India in 2019 were highest since 2014. DII (USD bn)
CY15 CY16 CY17 CY18 CY19
years years
flows continue to be healthy and were positive for 5th consecutive year FPIs 3.3 2.9 8.0 (4.6) 14.4 24.0 113.5
DIIs 10.3 5.4 14.0 15.9 5.9 51.5 23.8
Mutual Funds 10.9 7.0 18.3 17.4 7.5 61.0 52.6
Others (0.6) (1.6) (4.3) (1.5) (1.6) (9.5) (28.8)
100
• Stable domestic SIP flows have reduced the impact of periodic FPI Monthly SIP flows (Rs bn)
selling on markets and on market volatility 50
0
Nov 13 Nov 14 Nov 15 Nov 16 Nov 17 Nov 18 Nov 19
90 Days Indian FII outflows Fall in
• Since Jan 17, FPI were net sellers (greater than USD 2.5 bn on 90 days Period
FII Outflows
Market cap as % of Sensex #
(In USD Bn)*
ending (USD bn) Market cap %
cumulative basis) on four occasions but unlike in the past, Indian equity
05-Jan-17 -5.1 1,589 0.3% -1.2
markets held up well led by domestic flows 24-Oct-17 -4.2 2,154 0.2% 8.9
14-Nov-18 -5.6 1,956 0.3% -0.7
20-Sep-19 -5.0 2,014 0.2% -0.4
* Maximum outflow on a 90 days rolling period and greater than USD 2.5 bn ,
# 6 months returns till the date in column 1
70
India Vix (Volatility Index)
SBI term deposit rates for 1-2
10.0 year tenor
50
Lower volatility of Indian equities and low interest rates should 9.0
30 8.0
potentially increase household allocation towards equities over time 7.0
10 6.0
07 08 09 10 11 12 13 14 15 16 17 18 10 11 12 13 14 15 16 17 18 19
Sources: Bloomberg, Morgan Stanley, Kotak Institutional Equities, AMFI, Average rate assumed in case of a range
30
Refer disclaimers on slide 56Strategic sale route for PSU divestment – A big step forward
• Divestment experience through ETF’s has probably impacted PSU valuations 35 31 31 30 PSU as a % of total India market cap
30 27 28
25 26 25
‒ Regular supply of PSU shares through various ETFs distorts market 25 22
22
demand and supply 19
20 16
14 15 13
15 13 11
‒ Share of PSU’s in Market cap has come down 10
5
‒ Discount offered on ETF’s creates interest amongst arbitragers &
0
short term investors as against long term investors. Of the Rs 916 bn
Mar-04
Mar-05
Mar-06
Mar-07
Mar-08
Mar-09
Mar-10
Mar-11
Mar-12
Mar-13
Mar-14
Mar-15
Mar-16
Mar-17
Mar-18
Mar-19
Latest
ETF subscribed till Dec 2019 only Rs182 bn is outstanding
• An announcement of a strategic sale in a large OMC suggests a significant
0.8
shift in strategy 0.7 CPSE Index valuation
relative to Nifty 50 Index
0.6
0.5
• Strategic sale is a positive development. This should drive FDI in the country, 0.4
give additional resources to the government, reduce supply of paper by 0.3
government in equity & debt markets and increase competition in marketplace 0.2
0.1
benefiting consumers.
-
Jan-17 Jun-17 Nov-17 Apr-18 Sep-18 Feb-19 Jul-19 Dec-19
• If the ETF route is less preferred going forward, it should be positive for PSUs
Source: Kotak Institutional Equities, Data updated till Dec 27, 2019
31
Refer disclaimers on slide 56Indian equities - Summary
• The key to successful investing is not in timing but in something that is becoming
increasingly rare in times of instant gratification & short attention spans and that is patience.
• Invariably, successful investors are also the most patient investors
• In the last 40 years, markets have seen high / low growth, high / low interest rates, high /
low inflation; markets have also seen era of coalition governments, 9/11, Gulf war, tech
bubble, Asian crisis, GFC, Brexit, tapering, PIGS crisis, scams etc.
• Yet, If someone had simply remained invested in the Sensex for last 40 years – through
good and bad times, through bullish and bearish times, wealth would have grown 400 times.
This is hard to match by the most traders and timers ! Source: Bloomberg and publicly available information
‒ Infact, there are 24 Equity and Equity Hybrid Funds which have delivered returns
14.2%
in excess of 15% CAGR over last 20 years^ 13%
Returns CAGR % - 29 years
10.4%
7.9%
8%
• Why patience is a virtue and timing a curse in equity markets – If one had invested in 5.7%
3.8%
BSE SENSEX on January 1, 1990 and remain invested till Dec 27, 2019 (10,922 days / 29
3%
years), CAGR was 14%. However, if one missed just the best 10, 20, 30, 40 days of All Days Missed 10 Missed 20 Missed 30 Missed 40
Invested best days best days best days best days
SENSEX returns, the CAGR falls sharply to 10%, 8%, 6% and 4% respectively !
Source: Internal calculations; based on daily returns from January 1, 1990 to Dec 27, 2019
Lower corporate tax rates, increasing resolutions under IBC, strategic sale route for divestment, range bound oil prices (India’s Achilles heel), low interest rates,
improving profit growth outlook, reforms momentum and above all, low market cap to GDP make us optimistic for markets over medium to long term
“Activity is the enemy of investment returns.” “Someone's sitting in the shade today because “In the short run, the market is a voting "The individual investor should act
Warren Buffett someone planted a tree a long time ago.” machine but in the long run, it is a consistently as an investor and not as a
Warren Buffett weighing machine.” Benjamin Graham speculator” Sir John Templeton
The views are not an investment advice. Investors should obtain their own independent professional advice before taking a decision to invest in any securities.
Source: MFI Explorer; ^ - On basis of all equity and equity hybrid funds MFs schemes with over 20 years of history for which data is available (total number of schemes was 56)
32
Refer disclaimers on slide 56Sector Overview
1. Automobile OEMs
2. Banking & NBFCs
3. Capital goods
4. Cement
5. Consumer staples (FMCG)
6. Indian IT services
7. Infrastructure & Construction
8. Media
9. Metals & Mining
10. Oil & Gas
11. Pharmaceuticals
12. Telecom
13. Utilities
33
Refer disclaimers on slide 56Sector Overview : Automobile OEMs
Chart 1
• Consists of varied sub-segments like 2W, 4W, CVs, tractors and
suppliers to them. Sector is estimated to contribute ~3-4% of GDP
Background / • 2W and 4W are relatively less cyclical in India whereas CVs
Characteristics demand has higher linkage with economic growth & existing fleet
• Technology & capital intensive sector with high barriers to scale up
• Dominance of leaders in some categories is being challenged
• 2W & 4W growth was in single digits for last few years. 2W growth
Recent Business was moderate due to high penetration. In 4Ws, key issue is the de- Chart 2
performance / growth in white collar real wages in India
developments • Sharp de-growth in 2W/4W wholesale volumes due to weak
demand and inventory correction
• In PVs, passenger preference has shifted to UVs. UVs are now
35% of PV sales vs 21% in FY15 (Chart 2). UVs are now 45% of
PV industry revenues. This is inline with global trends
What's changing ? • The transition to BSVI will lead to higher vehicle prices and is a
near term headwind. EVs are likely to emerge as a threat in 3Ws
followed by 2Ws over the next few years
• Competition in PVs is rising from new Korean/Chinese players
Chart 3
• India PV penetration at 20/1000 is low. But low white collar 50 (x)
incomes is a challenge for 4W (Chart 1) and penetration is an issue
Prospects / Key for 2Ws 40 NSE Auto 1 year forward P/E
Drivers / Risks
• In FY21, volumes should recover due to low base, lower inventory 30 19.6
levels and launch of new models 20
• Valuations of 4W companies are high compared to global peers 10
Valuation and past, while for 2W companies, valuations are largely in line 0
compared to past 11 12 13 14 15 16 17 18 19
Sources – SIAM, UBS, Kotak Institutional Equities, CIMB
Sources – 2W – 2 Wheelers; 4W – 4 wheelers; PV – Passenger vehicles; UV – Utility vehicles; BS – Bharat Stage emission standards
34
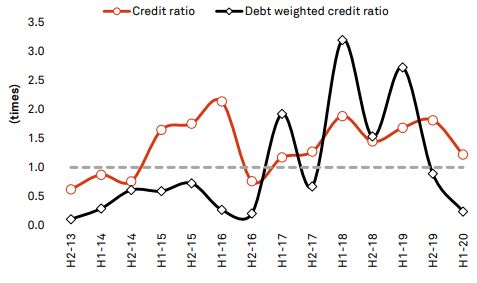
Refer disclaimers on slide 56Sector Overview : Banking & NBFCs
Chart 1
8% NNPA%
• Banking is a capital intensive sector – over the years the 6.0%
6% 5.3%
regulatory requirement of capital has increased significantly (CET I 4.4%
Background / 3.8% 3.7%
from 4.5% to 8% over a decade) 4%
Characteristics 2.1% 2.4%
1.7%
2% 1.3%
• Liability franchise, asset quality, costs & technology are key
0%
• Asset quality is cyclical & industry growth is linked to GDP growth 2012 2013 2014 2015 2016 2017 2018 2019 Q2'20
Table 1
Recent Business • Gross NPA and net NPA have peaked and are declining (Chart 1) Status of resolution under IBC as of 30 Sep 2019
performance / Admitted Resolution Resolution
• Resolution of NPA’s through IBC is gaining traction Rs Bn Mix
Claims Value Value
developments
• Bank’s NIM has remained stable over the years (Chart 2) More than Rs 100bn 54% 1,422 679 48%
Between Rs100bn to
39% 1,027 273 27%
Rs 10bn
Between Rs10bn to
• Expect GDP growth and credit growth to improve in FY21 Rs5bn
3% 79 21 26%
Less than Rs.5bn 3% 82 36 44%
• Sector is consolidating – with weak banks losing market share
Total 100% 2,611 1,009 39%
What's changing ? • Resolution of NPAs should improve profitability
Chart 2
• Large NBFCs/HFCs are able to access liquidity at reasonable NIMs of SCBs
costs. Smaller ones moving to co-originate loans for banks
• India’s Banking credit to GDP at 50% (Chart 3) is low compared to
Prospects / Key developed markets
Drivers / Risks
• Retail credit growth particularly unsecured credit growth has been
Chart 3 Banking system Credit to GDP
high; yet to experience a credit cycle
• Sector valuations are inline with long term averages – however
Valuation
retail banks are trading at a premium to corporate banks
NIM – Net interest margin; SCBs – Scheduled commercial banks
Sources: Investec, RBI, IBBI
35
Refer disclaimers on slide 56Sector Overview : Capital goods
• Cyclical sector dependent on capex outlook. Capacity utilization of Chart 1
Industry capacity utilization (%)
80
underlying industries is a key driver for capex (Charts 1 & 2) 76
• Thermal power has overcapacity and hence capex outlook for 72
Background/
sector is weak. Capacity utilization for metals, cement, oil & gas, 68
Characteristics
64
etc is more balanced with better capex outlook Sep-13 Sep-14 Sep-15 Sep-16 Sep-17 Sep-18 Sep-19
• MNCs with access to technology have competitive advantage in Chart 2
Gross fixed capital formation--quarterly (Rs bn)
industrial automation, smart infrastructure, etc. Real GFCF, 4 quarter avg, YoY% [RHS] 16%
12
• Growth is muted due to weak capex (chart 3) 12%
9
Recent Business
• Increasing share of orders from sustainability projects such as Flue- 6
8%
performance /
developments gas-desulfurization (FGD) 3 4%
• Working capital has increased due to lower collections 0 0%
Sep-13 Sep-14 Sep-15 Sep-16 Sep-17 Sep-18 Sep-19
• Companies increasingly relying on automation for productivity Chart 3
gains, cost optimization Revenues (quarterly)—top ten cos (Rs bn)
320 growth yoy (%) [RHS] 40
• New manufacturing technologies such as robotics, Internet of
What's changing? 240
20
Things (IoT) sensors, machine vision, etc are gaining acceptance 160
-
• Sustainability is a key focus. Renewable energy is being preferred 80
over coal fired power plants, etc. - (20)
Sep-12 Sep-13 Sep-14 Sep-15 Sep-16 Sep-17 Sep-18 Sep-19
• Improvement in capacity utilization in core sectors such as steel,
Chart 4
cement, oil & gas is key to revival of private capex Global cos (top ten)—1 year forward P/E (X)
Prospects / Key India listed MNC cos (top five)—1 year forward P/E (X)
Drivers / Risks • Resolution of IBC cases in core sectors will aid capex cycle Indian owned cos (top three)—1 year forward P/E (X)
• Key risks include delayed pick-up in utilization in core industries, 45
30
lower green-field investments resulting in weak capex cycle
15
Valuations • Current valuations are close to 10 year average -
Dec-09 Dec-11 Dec-13 Dec-15 Dec-17 Dec-19
Sources: RBI, Bloomberg, Universe – Companies have been selected based on market cap
36
Refer disclaimers on slide 56Sector Overview : Cement
Chart 1
1700 Per capita cement consumption
• Cement demand is largely driven by Housing & Infrastructure capex 1,800
• India’s per capita cement consumption is less than half of world 1,350
(Chart 1)
900 760
(Kg)
660
• Barriers to entry are high due to access to limestone, land and high 525
400 355
capital investment. 450 280 245
Background /
Characteristics • Demand has both seasonal and cyclical variations 0
• Due to lower value and high freight cost, large imports not possible
• South has significant overcapacity while North and Central regions
Chart 2
have high utilisation and better pricing power 3.0
GDP Coefficient of cement
• Pricing is also driven by production discipline in the industry 2.5
2.0
• Historically, cement demand growth has been ~1.2x GDP growth 1.5
(Chart 2) but this has changed since FY14 as housing & private 1.0
capex lagged
0.5
Recent Business
• Last 2 years demand growth driven by infra and affordable housing; 0.0
performance
current year demand has been weak 02
FY 04 06 08 10 12 14 16 18
• Capacity expansions skewed towards more split Grinding Units as GDP coefficient = Cement sector demand growth by real GDP growth
players endeavour to reach new markets and reduce logistics cost
Chart 3
Commercial Cement Demand Mix
• If demand picks up, then utilisation and pricing will improve and Ind
What's changing ? Capex, 10%
• Increasing affordability of residential space should drive demand
Infrastructur Rural
e, 22% Housing,
30%
• Valuations vary widely with small and mid size cement companies
Valuation trading at 20-60% discount to replacement costs while large ones
trading at 100% - 200% of replacement costs
Low cost Tier 2 & 3 Tier 1 &
Housing, Housing, Metro
12% 18% Housing, 8%
Sources – DIPP, Company presentations
37
Refer disclaimers on slide 56Sector Overview : Consumer Staples (FMCG)
25%
FMCG Revenue growth ex Tobbaco
20%
• Products are goods of daily consumption 15% Chart 1
• Stable, predictable and profitable business 10%
Background / • Less capital intensive 5%
0%
Characteristics • Barriers to entry are low, but barrier to succeed are high due to
FY06
FY07
FY08
FY09
FY10
FY11
FY12
FY13
FY14
FY15
FY16
FY17
FY18
FY19
FY20E
presence of established brands
• Dominant market shares of leaders in many categories
Chart 2
Recent Business • Growth rates have come down in the last 5 years (Chart 1)
performance / • Profit margins have gone up due to fall in prices of raw materials,
developments steady price increases, GST implementation, etc. (Chart 2)
• Modern trade (super-markets) & ecommerce growing much faster
than general trade (Kirana)
What's changing? • Competition rising from modern trade’s own brands in select Chart 3
categories and new brands getting created on online platforms
• Increasing popularity of natural / organic products
• Penetration of key segments has improved significantly over past 2
Prospects / Key decades. Thus, growth may moderate in medium term (Chart 3)
Drivers / Risks • Rising share of modern trade and progress of own brands are key
monitorables
Valuation • Current valuations are high relative to past (Chart 4)
Chart 4
Sources: Credit Suisse, Bloomberg, Universe is Credit Suisse Consumer staples India universe excluding
tobacco and liquor
38
Refer disclaimers on slide 56You can also read