INVESTMENT RESEARCH AND STRATEGY REPORT - 2020 Q4 REVIEW - PSG ...

Page created by Frances Blake
 
CONTINUE READING
INVESTMENT RESEARCH AND STRATEGY REPORT - 2020 Q4 REVIEW - PSG ...
INVESTMENT RESEARCH AND
STRATEGY REPORT

2020 Q4 REVIEW
INVESTMENT RESEARCH AND STRATEGY REPORT - 2020 Q4 REVIEW - PSG ...
CONTENTS

             Introduction                                                                           3

             2020 etched in history                                                                 4

             Covid-19 timeline                                                                      7

             A journey through the ups and downs of markets in 2020                                 9

             Geopolitics in 2020                                                                  14

             Trade war timeline                                                                   17

             Fund Insights: Growth or value? The ability to adapt is more important               18

             Performance of Wealth solutions over the fourth quarter of 2020                      24

             Equity insights: Emerging and developed market tech shares and regulation risk       26

             Previous publications                                                                30

Contents                                                                                      Page | 2
INVESTMENT RESEARCH AND STRATEGY REPORT - 2020 Q4 REVIEW - PSG ...
INTRODUCTION                                                                                            Contents

Welcome to our fourth quarter Investment Research                                      “Resilience is accepting your new
                                                                                       reality, even if it’s less good than
and Strategy Report for 2020                                                           the one you had before. You can
                                                                                       fight it, you can do nothing but
Looking back is 20/20                                                                  scream about what you’ve lost, or
Although we can all agree that 2020 was a year of note, was it all bad? In the         you can accept that and try to put
past year, we endured a global pandemic, which forced nations to remain home,          together something that’s good.”
sparked an oil crisis, a market crash, and global uncertainty. However, there was      – Elizabeth Edwards
also a silver lining to it. Pharmaceutical companies and scientists across the globe
worked together and at incredible speed to develop a vaccine; central banks stepped
up to provide economic relief; carbon dioxide emissions declined; Brexit finally
happened; and overall, we adapted our way of doing things to overcome some of
these challenges.

In this edition of the PSG Wealth Research and Strategy Report, our research team        You can navigate this
takes a closer look at the year that passed, and what we can expect from the             document in two ways:
one ahead. From geopolitics to tech shares and the value-growth argument, we
                                                                                         1. Each of the article names in
investigate it all.
                                                                                            the table of content acts as a
Do contact us if you have any feedback, questions or insights – we always enjoy             link to a specific article in the
hearing from you. Hope you enjoy our 4Q20 edition.                                          document. To return to the table
                                                                                            of contents simply click on the
Regards                                                                                     ‘Contents’ button in the top
                                                                                            right-hand corner.

                                                                                         2. There are arrows at the top of
                                                                                            each page; use them to flip
Adriaan Pask, PhD                                                                           through the document.
PSG Wealth Chief Investment Officer

Introduction                                                                                                              Page | 3
INVESTMENT RESEARCH AND STRATEGY REPORT - 2020 Q4 REVIEW - PSG ...
2020 ETCHED IN HISTORY                                                                                             Contents

What we expect for economies this year                                                         Table 1: Growth projections according to
                                                                                               the IMF
Last year made records for a variety of reasons. It was the first year the world pulled
together to curb the spread of a pandemic. First-time lockdowns were introduced                Real GDP,
                                                                                                                        2019 2020 2021
                                                                                               annual % change
across the globe that stopped various activities. Last year also saw the shortest bear
market and quickest subsequent recovery in history.                                            World output              2.8   -4.4     5.2

For the first time, pharmaceutical companies worked together to create a vaccine to
                                                                                               Advanced economics        1.7   -5.8     3.9
save human lives on a global scale. Many experts have also coined 2020 as ‘the great
reset’ – a period where corporates and consumers alike had to rethink their normal
                                                                                               United States             2.2   -4.3     3.1
way of doing things. It was likely also the first year your parents and grandparents
bought something online. All these events impacted economies around the globe.                 Euro area                 1.3   -8.3     5.2

Gross Domestic Product (GDP) was impacted across the board                                     Germany                   0.6   -6.0     4.2
The International Monetary Fund (IMF), which has used seven indicators to track GDP
across the globe since 1980, found that the global economy contracted by 4.40%                 France                    1.5   -9.8     6.0
in 2020 following the economic restrictions countries imposed to curb the spread
of Covid-19. Emerging markets contracted by 3.30% while developed economies                    Italy                     0.3   -10.6    5.2
contracted by 5.8% as at the end of November 2020.
                                                                                               Spain                     2.0   -12.8    7.2
In its October 2020 World Economic Outlook report, the IMF noted, “The adoption of
lockdowns was an important factor in the recession, but voluntary social distancing            Japan                     0.7   -5.3     2.3
in response to rising infections also contributed very substantially to the economic
contraction. Therefore, although easing lockdowns can lead to a partial recovery,              United Kingdom            1.5   -9.8     5.9
economic activity is likely to remain subdued until health risks abate.” As such, most
economies around the globe are only expected to recover fully once a safe Covid-19             Canada                    1.7   -7.1     5.2
vaccine has been adopted by most.                                                              Other advanced
                                                                                                                         1.7   -3.8     3.6
                                                                                               economics
The IMF expects the global economy could grow by 5.20% this year, while emerging
markets could rebound by 6%. After declining by 51% in the second quarter of                   Emerging markets and
                                                                                                                         3.7   -3.3     6.0
                                                                                               developing economics
2020, South Africa’s economy rebounded by an annualised rate of 66.10% in
quarter three. We expect the local economy to stabilise and regain some normality              Asia                      5.5   -1.7     8.0
by the second half of 2021. The accelerated debt burden will take the better part
of the decade to repair, but we believe higher commodity prices should support the             China                     6.1   1.9      8.2
South African current account.
                                                                                               India                     4.2   -10.3    8.8
Graph 1: GDP outlook for 2021 by the World Bank
                                                                                               ASEAN-5                   4.9   -3.4     6.2

10%                                                                                            Europe                    2.1   -4.6     3.9

 8%                                                                                            Russia                    1.3   -4.1     2.8
 6%                                                                                            Latin America and
                                                                                                                         0.0   -8.1     3.6
                                                                                               Caribbean
 4%
                                                                                               Brazil                    1.1   -5.8     2.8
 2%
                                                                                               Mexico                   -0.3   -9.0     3.5
 0%
                                                                                               Middle East and
                                                                                                                         1.4   -4.1     3.0
 0%                                                                                            Central Asia
                           Range of EMDE regions
-2%                                                                                            Saudi Arabia              0.3   -5.4     3.1
                           LAC
-4%                                                                                            Sub-Saharan Africa        3.2   -3.0     3.1
                           LAC downside scenario
-6%
                           World                                                               Nigeria                   2.2   -4.3     1.7

-8%
                                                                                               South Africa              0.2   -8.0     3.0
               2012

                         2013

                                2014

                                       2015

                                              2016

                                                     2017

                                                            2018

                                                                   2019

                                                                          2020

                                                                                 2021

                                                                                        2022

                                                                                               Low-income countries      5.3   -1.2     4.9

Source: World Bank                                                                             Source: IMF

2020 etched in history                                                                                                                Page | 4
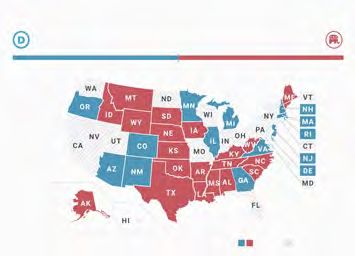
INVESTMENT RESEARCH AND STRATEGY REPORT - 2020 Q4 REVIEW - PSG ...
Contents

Local Purchasing Managers’ Index (PMI) hit two records in 2020
From reaching a low of 30.32 points in April 2020 and a high of 60.90 points in
October 2020, it did not take long for South Africa’s factory activities to rebound
                                                                                               “Economic activity is moving
after the record low recorded in April last year.
                                                                                               the in right direction since the
The index that measures in what direction economic trends are expected to move in              extreme restrictions imposed in
the manufacturing and service sectors, has been recorded as above 50 index points              March 2020.”
since May 2020. This shows that economic activity is moving in the right direction
since the extreme restrictions that were imposed on the local economy at the end of
March 2020, have been alleviated.

Table 2: PMI numbers as at end of December 2020

             Manufacturing PMI: above 50                  Manufacturing PMI: below 50
 Country                 Last     Previous Change   Country       Last     Previous Change
 Sweden                   64.90     59.80    5.10   Russia         49.70     46.30      3.40
 Brazil                   61.50     64.00   -2.50   Egypt          48.20     50.90     -2.70
 Germany                  58.30     57.80    0.50   Greece         46.90     42.30      4.60
 Netherlands              58.20     54.40    3.80   Hong Kong      43.50     50.10     -6.60
 Switzerland              58.00     55.20    2.80   Mexico         42.40     43.70     -1.30
 Canada                   57.90     55.80    2.10   Denmark        41.87     47.02     -5.15
 United Kingdom           57.50     55.60    1.90
 Ireland                  57.20     52.20    5.00   Key
 United States            57.10     56.70    0.40                  Large economies
 Czech Republic           57.00     53.90    3.10                  Members of the EU
 Saudi Arabia             57.00     54.70    2.30                  BRICS countries
 India                    56.40     56.30    0.10
 New Zealand              55.30     51.70    3.60
 Euro Area                55.20     53.80    1.40
 Austria                  53.50     51.70    1.80
 China                    53.00     54.90   -1.90
 South Korea              52.90     52.90    0.00
 Italy                    52.80     51.50    1.30
 Australia                52.10     56.30   -4.20
 Norway                   51.90     52.00   -0.10   “Factory activity numbers are
 Poland                   51.70     50.80    0.90   back to pre-Covid-19 levels.”
 Vietnam                  51.70     49.90    1.80
 Indonesia                51.30     50.60    0.70
 United Arab Emirates     51.20     49.50    1.70
 Hungary                  51.10     51.10    0.00
 France                   51.10     49.60    1.50
 Spain                    51.00     49.80    1.20
 Turkey                   50.80     51.40   -0.60
 Singapore                50.50     50.40    0.10
 South Africa             50.30     52.60   -2.30
 Japan                    50.00     49.00    1.00

Source: IMF

2020 etched in history                                                                                                            Page | 5
INVESTMENT RESEARCH AND STRATEGY REPORT - 2020 Q4 REVIEW - PSG ...
Contents

Business and consumer confidence also rebounded from their
worst to best levels in decades
While business and consumer confidence in South Africa has been under pressure,
the RMB Business Confidence Index dropped to its lowest level since 1995 in the first
quarter of 2020. However, by quarter two, it bounced back to pre-Covid-19 levels,
at 24 points, and higher still when it recorded 40 points for the third quarter of last   “We expect that business
year. We expect that business confidence will continue to improve as profits recover      confidence will continue to improve
and economic restrictions dissipate.                                                      as profits recover and economic
                                                                                          restrictions dissipate.”
The FNB/BER Consumer Confidence Index reached its lowest level in 35 years during
the second quarter of 2020, rebounding by 10 points in the third quarter and a
further 11 points in the last quarter of last year.

We expect business and consumer confidence to improve as economic recoveries
continue.

Our macroeconomic expectations for 2021 include:
•   The world economy will stabilise and normality should return during the latter
    stages of 2021.
•   High government debt will continue to put pressure on government spending,
    while consumer spending could offset some of the slack in government
    spending.
•   Current accounts in traditional exporter and commodity-focused countries are
    set to recover.
•   Global inflation is currently low given the pandemic-induced pressure on
                                                                                          “Overall, we believe 2021 will
    spending. This should materially appreciate as lockdowns ease, but we believe
    lower interest rates will still be seen, averaging roughly 3% over the next           improve greatly from the depressed
    10 years.                                                                             levels reached in 2020, even if
•   As lower interest rates remain, the seemingly inevitable derating of                  intermittent lockdowns remain in
    US Treasuries is delayed a bit longer.                                                place.”
•   We expect local y/y inflation to range between 2% and 8% over the next five
    years, averaging roughly 5% over the next 10 years.
•   We believe the local repo rate with fluctuate between 4% and 7%, which
    translates into real returns on cash of between -4% and 4%.
•   We anticipate through-the-cycle interest rates at 1% to 2% above inflation
    (before costs and taxation).

Overall, we believe 2021 will improve greatly from the depressed levels reached in
2020, even if intermittent lockdowns remain in place.

2020 etched in history                                                                                                    Page | 6
Contents

COVID-19
   Global updates and statistics

SOUTH AFRICA
Tests conducted                                Cases confirmed               Recoveries                              Deaths

7.65 million                                   1.34 million                  1.11 million                            37 449
Source: Covid-19 South African Online Portal                                                                 *Status as at 18 January 2021

                    DECEMBER 2020                                                  JULY 2020
                    •   UK and US grant emergency approval for the                 •   North Korea reports its first case
                        Pfizer-BioNTech vaccine                                    •   South Korea records its largest daily increase
                    •   UK begins Covid-19 vaccination campaign                    •   Mexico records third-highest death toll
                    •   New more transmissible SARS-CoV-2 variant found            •   China and Russia accused of stealing Covid-19
                                                                                       vaccine research
                    NOVEMBER 2020                                                  •   India passes 1 million cases
                    •   US passes 100 000 new daily Covid-19 cases for the         •   White House orders hospitals to bypass CDC
                        first time                                                 •   Moderna shows positive immune response
                    •   Pfizer and BioNTech, and Moderna vaccines’ interim         •   Brazil and US cases continue to spike
                        results over 94% effective                                 •   Countries impose new travel restrictions
                                                                                   •   Africa surpasses half a million cases
                    OCTOBER 2020
                    •   France reports new daily record                            JUNE 2020
                    •   India reports less than 50 000 cases                       •   Saudi Arabia places restrictions on the Hajj
                    •   Italy imposes hardest lockdown since March 2020            •   Africa begin vaccine trials
                    •   Global Covid-19 cases pass 40 million                      •   India reports record spike
                    •   Johnson & Johnson pauses vaccine trial                     •   Global Covid-19 death toll reaches 500 000
                    •   Singapore and Indonesia open borders                       •   Beijing reports new cases
                                                                                   •   FDA revokes use of hydroxychloroquine
                    SEPTEMBER 2020                                                 •   US sees a rise in cases
                    •   Global deaths pass 1 million                               •   New Zealand and India lift restrictions
                    •   US passes 7 million cases                                  •   China publishes White Paper
                    •   India reports over 83 000 new daily cases
                        for two consecutive days                                   MAY 2020
                    •   Russia’s vaccine generates an immune response              •   Spain extends state of emergency
                    •   Over 500 000 US children are diagnosed                     •   President Trump asks congress for
                                                                                       economic stimulus
                    AUGUST 2020                                                    •   US deaths pass 100 000
                    •   EU cases reach March 2020 levels                           •   France pulls hydroxychloroquine as treatment
                    •   India becomes third worst-affected country                 •   China flattens the curve
                    •   Latin America passes 7 million cases                       •   Hydroxychlorquine proven ineffective
                    •   First case of reinfection reported in Hong Kong            •   Global cases top 4 million
                    •   New cases are decreasing in half of US
                    •   South Korea stops in-person instruction in
                        over 2 000 schools
                    •   Russia approves vaccine
                    •   Moderna agrees to supply the US with vaccine
                    •   WHO reports record number of new cases
                    •   Philippines pass 100 000 Covid-19 cases

Covid-19 timeline                                                                                                                Page | 7
Contents

                    APRIL 2020                                              MARCH 2020
                    •    Global cases top 3.5 million                       •   Third of world is under Covid-19 restrictions
                    •    China pledges $30 million to the WHO               •   Japan postpones 2020 Summer Olympics
                    •    Italy and Spain ease lockdown restrictions         •   WHO warns shortage of medical supplies
                    •    US records 1 million cases                         •   China reports no new cases
                    •    China reports its first economic contraction in    •   Italy has the highest death-toll
                         a decade                                           •   President Trump signs the Families First
                    •    Austria is the first EU country to reopen              Coronavirus Response Act into law
                    •    President Trump suspends immigration               •   Fifth of students worldwide not in school
                    •    Japan declares state of emergency                  •   WHO declares Covid-19 a pandemic
                    •    Total of 22 million unemployed Americans since
                         the state of emergency. This job loss is           FEBRUARY 2020
                         comparable to Great Depression statistics.         •   Outbreaks in Iran, Italy and South Korea
                    •    Germany announces plans to reopen                  •   Travel restrictions increase
                         economy and resume in-person schooling
                                                                            •   Death-toll surpasses that of SARS
                    •    Wet markets reopen in Wuhan
                                                                            •   WHO-led team heads to China
                    •    US death-toll is the highest in the world
                                                                            •   Cruise ship cases surpass 100
                    •    South Korea introduces a tracking bracelet to
                                                                            •   First deaths outside China
                         monitor citizens to comply to rules
                                                                            •   Chinese stock markets plunge
                    •    Wimbledon Tennis Tournament cancelled for
                         the first time since World War Two
                    •    World Bank estimates pandemic could push
                                                                            JANUARY 2020
                         11 million people into poverty                     •   Travel bans spread
                                                                            •   First cases appear in US and EU
                                                                            •   Closing of Wuhan (24 January)
                                                                            •   First cases reported in China
                                                                            •   Outbreak spreads to other countries

31 JANUARY 2020                                                            18 JANUARY 2021
                        Countries with confirmed cases                               Countries with confirmed cases

                        19                                                           214
                        Cases confirmed globally                                     Cases confirmed globally

                        9 826                                                        95.2 million
                        Deaths worldwide                                             Deaths worldwide

                        213                                                          2.03 million
Sources: WHO, Think Global Health

Covid-19 timeline                                                                                                          Page | 8
A JOURNEY THROUGH THE UPS AND DOWNS                                                                                 Contents
                                          OF MARKETS IN 2020

    A look at what lies ahead
    A pandemic, an oil price war, a controversial US election, and mountains of                                              “The shortest bear market in history
    liquidity from policymakers – 2020 was a unique year. Most capital markets entered                                       with the quickest recovery.”
    bear market status with declines in excess of 20% across the globe after the
    February 2020 sell-off. The JSE All Share Index lost 34% between February 2020 and
    March 2020, and the S&P 500 34% by 23 March 2020.

    Table 1: Unforgettable days

             Black Monday I                     •    Dow Jones Industrial Average lost over 2 000 points due to the
             (9 March 2020)                          oil plunge.
                                                                                                                             “Covid-19 pandemic, dispute about
                                                •    It had been the most significant single-day percentage fall for US      the oil price and an election year in
                                                     markets since the 1987 stock market crash.                              the US contributed to uncertainty in
             Black Thursday
                                                •    This crash can be ascribed to the Covid-19 pandemic, and the lack
             (12 March 2020)
                                                     of confidence investors had in the then US President Donald Trump
                                                                                                                             markets during 2020.”
                                                     after he banned travel to the Schengen area for 30 days.

             Black Monday II                    •    The Dow Jones dropped over 1 000 points and the S&P 500 futures
             (16 March 2020)                         about 5%, triggering a circuit breaker.

                                                •    Moody’s downgraded South Africa’s international long-term credit
             27 March 2020
                                                     rating one notch from Baa3 to Ba1.

                                                •    Due to lockdowns and an OPEC+ agreement to limit oil supply that
             20 April 2020                                                                                                   “Most markets lost in excess of 20%
                                                     was not sufficient to address plunging demand.
                                                                                                                             during the early sell-off in 2020.”

    Source: B4SA

    Graph 1: JSE sector moves since 1965

                                   45%

                                   40%

                                   35%
5-year annualised rolling return

                                   30%

                                   25%

                                   20%

                                   15%

                                   10%

                                    5%

                                    0%

                                   -5%

                                   -10%
                                      1965    1970       1975        1980        1985        1990        1995         2000      2005       2010        2015        2020

    Source: FactSet 										                                                                                                               *Data as at 31 December 2020

    A journey through the ups and downs of markets in 2020                                                                                                       Page | 9
Contents

Assets and currencies
As can be expected, while equity markets were under strain, safe-haven assets such
as gold, US Treasuries and the dollar came into their element. Gold reached a high
of $2 058.40 per ounce in 2020, compared with a high of $1 542.60 per ounce in
2019, according to Macrotrends.net. Emerging market currencies, such as the rand,
naturally suffered under the stronger US dollar.

Our research shows that the US dollar seems overbought, especially following the                                    “Most asset classes are now trading
previous cycle where investors sought exposure to safe-haven assets as mentioned                                    at either a big premium or a big
above. With more US stimulus expected (such as the planned $1.9 trillion Covid-19                                   discount to their historic yields.”
relief package US President Joe Biden unveiled on 14 January 2021) we think the US
dollar could be under pressure over the medium term.

As graph 3 shows, most asset classes are now trading at either a big premium or a
big discount to their historic yields. The market shock has created opportunities in
selected areas, whereas others have become overly expensive in our opinion.

Graph 2: US dollar versus GBP sterling

                                                                                                                                                             0.88
           USD/GBP
                                                                                                                                                             0.86

                                                                                                                                                             0.84

                                                                                                                                                             0.82

                                                                                                                                                             0.80

                                                                                                                                                             0.78

                                                                                                                                                             0.76

                                                                                                                                                             0.74
                                                                                                                                                             0.73
                                                                                                                                                             0.72
     Jan          Feb           Mar           Apr        May           Jun          Jul         Aug           Sep       Oct         Nov        Dec

Source: FactSet

Graph 3: Real yields of asset classes

12

10                                                                                                                                          10.31

 8
                                                                                                                          6.47
 6
                                                                                                                                                             4.58
 4
                                                                                    3.48
 2
                                                               0.66                                        0.98
 0
                      -0.82                  -0.49
-2

-4
        Global cash           Global bonds      Global property       Global equities      Domestic cash      Domestic bonds   Domestic property Domestic equities
                                                                  Average (real)            Current (real)

Source:
 			    PSG Wealth research team 								                                                                                            *Data as at end December 2020

A journey through the ups and downs of markets in 2020                                                                                                    Page | 10
Contents

Interest rates
To counter the economic destruction caused by the Covid-19 pandemic and
subsequent lockdowns, governments across the globe looked at developing fiscal
stimulus plans and lowering interest rates. As at 31 December 2020, interest rates
were recorded at:

                                                                                                              “Interest rates around the globe
                                                                                                              remain low to encourage economic
                                                                                  Russia: 4.25%               activity.”
                                                         Euro area: 0%
                               UK: 0.10%
                                                                                     Japan: -0.10%

    US: 0.25%
                                                                                   China: 3.85%

                                                                 India: 4%
            Brazil: 2%

                                          South Africa: 3.50%

As long as cash rates remain low, we are likely to favour real assets, especially
because growth is supported, and inflation risk is implicitly elevated. We expect
offshore equities should do well in a lower interest rate environment, but investors
should be weary of noteworthy risks on some mega-cap US stocks.

Real estate                                                                                                   “An oversupply of stock already
An oversupply already constrained the local property sector within the retail and office                      constrained the local property
space before the Covid-19 pandemic hit. These challenges have been compounded                                 sector within the retail and
by structural shifts caused by work from home (WFH) and online retail adoption on                             office space before the Covid-19
office and retail properties, respectively.                                                                   pandemic hit.”
The sector continues to trade at a discount to its book value (about 40% discount),
which is a reflection of the weak macroeconomic environment, the oversupply
concerns in the retail and office sector, the reduced liquidity after the lockdown, the
dividend pay-out prospects (with most REITs either cutting, deferring or withdrawing
dividend payments to preserve liquidity), and large REITs falling off of major domestic
and emerging indices.

Graph 4: Property Index performance over the past few years

                                                                                                                                                 1.6
                                                                                                                                                 1.4
                                                                                                                                                 1.2
                                                                                                                                                 1.0
                                                                                                                                                 0.8

                                                                                                                                                 0.63
                                                                                                                                                 0.6

                                                                                                                                                 0.4

                                                                                                                                                 0.2
             ‘16                           ‘17                            ‘18                           ‘19                  ‘20
                                                            FTSE JSE/SA Listed Property (SAPY) - PB - LTM

Source: Bloomberg

A journey through the ups and downs of markets in 2020                                                                                       Page | 11
Contents

The credit market continues to be dry, with liquidity at record lows.All REIT                      “We saw an improvement in the
issuances have recently been private with significantly lower durations (when                      sector’s price-to-book discount
compared with pre-pandemic levels). It is likely that issuances will also be secured going         from approximately 50% to
forward, as there has been little take on for unsecured paper. Overall, collection rates           40%, together with better returns
have improved post the relaxation of strict lockdown measures, with retail showing                 towards the end of the 2020. This
material improvements.
                                                                                                   was a reflection of higher investor
The office sector vacancies are still rising and are expected to increase further due              confidence and lower fears with
to potential structural changes (as a result of a weaker economy) such as corporates               the hope of a successful Covid-19
cutting costs and enabling employees to work remotely.                                             vaccine.”
The weak balance sheet remains the main concern, with the market implying that
many counters are breaching loan-to-value (LTV) covenants. We expect more
investments into offshore with a high likelihood of the South African macroeconomic
recovery being long-drawn-out. Additionally, we believe there are economic and
distribution growth opportunities in Central and Eastern Europe. We saw an
improvement in the sector’s price-to-book discount from approximately 50% to
40%, together with better returns towards the end of the 2020. This was a reflection
of higher investor confidence and lower fears with the hope of a successful Covid-19
vaccine.

Real estate is faced with risks and opportunities. Property fundamentals are weak,
improving liquidity is key and impairments are increasing loan-to-value (LTV) ratios
across the board. However, returns prove to be compelling, the discount to net asset
value (NAV) shows that the market has already priced in the bad news and there
will be capital opportunities due the ongoing recycling of assets. As a result, on a
risk-adjusted basis, we believe the sector offers value.

Fixed income
Due to lower local interest rates, cash is currently yielding multi-decade low real
yields. The yield curve is also very steep, allowing investors to avoid cash and pursue
higher yields without materially increasing duration and interest rate risk. The less
liquid areas of the fixed income market (credit, some inflation-linked bonds (ILBs)                “The yield curve is also very steep,
and preference shares) are offering higher yields, but our sense is that the risks in              allowing investors to avoid cash
most of these areas are still material. While a South African debt default remains a               and pursue higher yields without
low probability event, the event is not completely excluded from our risk assessment.              materially increasing duration and
We think very selective buying is the right approach here.                                         interest rate risk.”

Graph 5: SA Treasury yield curve

12

11

10

 9

 8

 7

 6

 5

 4

 3
     1M 1Y         3Y                   7Y               10Y                                 20Y                                           30Y
                                        01-Dec-2020            31-Aug-2020   29-Nov-2019              01-Dec-2015

Source: FactSet 										                                                                                          *Data as at 31 December 2020

A journey through the ups and downs of markets in 2020                                                                                 Page | 12
Contents

As global interest rates remain low, the seemingly inevitable derating of US Treasuries
is delayed a bit longer. In this regard, we caution investors to think carefully about
the impact of the next interest rate cycle on global assets. Our analysis suggests that
the long-term prospects do not look good.

Equities
Although equity returns are highly unpredictable over short periods, we believe the
rerating potential is significant. Our analysis suggests returns of inflation plus 8%
                                                                                                “We warn investors to carefully
through the cycle are very plausible. History shows that investors should typically
expect at least one drop of 20% or more over a five-year period, which is what
                                                                                                consider the impact of the next
transpired last year. This uncertainty is what drives the long-term equity premium              interest rate cycle on global assets
and return, but if we expect it, we can mentally prepare ourselves that this is normal          before making asset allocation
market behaviour.                                                                               changes.”

Our analysis shows that offshore markets could deliver around 3% to 6% above
global inflation over the next 10 years. History shows that entering markets at
prevailing multiples typically delivers returns on the lower end of the range, and in
some cases well below that. Given the high levels of monetary support, however,
we think some of the valuation risk is temporarily offset and delayed. Once again,
we warn investors to carefully consider the impact of the next interest rate cycle on
global assets before making asset allocation changes.

Graph 6: SA equities underperformed global equities in US dollar terms

120

                                                                                                                                     108.00
110                                                                                                                                  107.06
                                                                                                                                     106.98

100

 90

 80

 70

 60

 50
         Nov         Dec          Jan         Feb        Mar      Apr   May   Jun         Jul        Aug        Sep        Oct
                           (INDEX) FTSE JSE All Share - total return          (INDEX) FTSE All-world - total return
                           (INDEX) MSCI EM - total return                     (INDEX) MSCI World Index - total return

Source: FactSet 										                                                                                   *Data as at end of December 2020

A journey through the ups and downs of markets in 2020                                                                              Page | 13
GEOPOLITICS IN 2020                                                                                                 Contents

What we expect for global politics this year
Since Covid-19 made its debut, market participants have speculated about its
bearing: whether it would accelerate long-standing geopolitical issues, or create a                 “Diplomacy will be the chief
completely different world than what we know? Truth is, the world during and post
                                                                                                    instrument of US foreign policy.”
the pandemic will have elements of both, the known and the unknown. Here’s a
breakdown of the top geopolitical risks that stood out in 2020 and what investors
can expect going into 2021.

US presidential election
The world’s most anticipated election took place on 3 November 2020 and financial
markets have remained volatile ever since. Expectations of a clean sweep by the
Democrats quickly faded and a narrow race raised concerns over the possibility
of a prolonged legal dispute – especially after President Donald Trump falsely and
prematurely claimed victory and demanded that the tallying of mail-in ballots be
halted. However, the Supreme Court did not find any substantial evidence of fraud
or irregularities extensive enough to change the election and could not halt final vote
counts.

On 14 December 2020, Times Live reported that the Electoral College confirmed
Biden’s win and dismissed the idea of overturning the election in Congress. Be that
as it may, the Republicans look set to retain control of the Senate, which has sparked
fears of policy changes that could hurt businesses under Biden’s administration.

On the foreign policy front, Biden reiterated that the US will not be able to confront
its challenges without the backing of its allies and the cooperation of international
institutions. Diplomacy will be the chief instrument of US foreign policy. Biden also
vowed to rejoin international treaties including restoring support for the North
Atlantic Treaty Organisation (NATO), rejoining the Iran nuclear agreement and the
Paris climate accord, and solidifying partnerships with countries like Japan and South
Korea.

We expect that international politics should be more stable under a Joe Biden
presidency.

Graph 1: 2020 US senate election results

  Democratic party                                                 Republican party

           50 +3                           50                  50 - 3
  35 seats not up for election                                       30 seats not up for election

                                                               Won           No election

Source: The Washington Post       				                          *Data as at 18 January 2021

Geopolitics in 2020                                                                                                                 Page | 14
Contents

Brexit
Britain voted to leave the European Union (EU) in 2016 and officially left the EU at the
end of January 2020. On 13 December 2020, the two sides agreed to “go the extra
mile” and extend a deadline on the trade negotiations to avoid an unsettling no-deal
departure before 31 December 2020. This decision lifted hopes of an eventual deal,
which was finally struck on Christmas Eve.

Working and living between the UK and EU will come to an end this year – UK citizens       “We predict that there might be a
will now need a visa if they want to stay in the EU for longer than 90 days. Other         60% chance of a deal being struck
important changes that took effect from 1 January 2021 include:                            by 31 December 2020 and a 40%
                                                                                           (if not higher) chance of a no deal,”
•   UK citizens can no longer bring in unlimited amounts of duty-free alcohol and
    tobacco products from the EU.                                                          UK economist Paul Dales said in
•   UK citizens will no longer have an automatic right to live, work, study or retire      November 2020.
    in the EU.
•   EU citizens will not be allowed to live in the UK after 30 June 2021 unless they
    become UK citizens.
•   The UK will use a new points-based immigration system said to treat EU and
    non-EU residents equally.
•   Trade with the EU will become trickier (in terms of paperwork); the UK is free to
    negotiate trade deals with other countries.
•   The Republic of Ireland remains in the EU, while “Northern Ireland will continue
                                                                                           “We expect the pound sterling
    to follow most of the EU rules”.
                                                                                           to strengthen. It was quite weak
With the deal announced on 24 December 2020, investors can at last start to see            while negotiations were dragging
some certainty, which is good for sentiment. Markets like certainty, which should bode     on for almost three years, but only
well for both the UK and EU over time. We expect the pound sterling to strengthen.         time will tell how new trading
It was quite weak while negotiations were dragging on for almost three years, but          agreements will impact their
only time will tell how new trading agreements will impact their economies, specific       economies, specific regions and
regions and sectors.                                                                       sectors.”

US/China
The US and China signed a phase one trade deal on 15 January 2020, following a
two-year-long quarrel. The agreement eases US tariffs on Chinese goods and binds
China to purchase an additional $200 billion worth of US goods, while China also
undertook to carry out intellectual property protections. The deal came into effect on
14 February 2020.

Graph 2: What does BREXIT mean for the British economy?

                              2020                                 2025                                     2030
    0

-1%
                                                          -1.1%                                    -1.2%
-2%

-3%
                      -3.1%
-4%                                                                                                                  -3.5%
                                                                           -4.1%
-5%

-6%                                  -5.5%
* FTA = Free Trade Agreement                                                  FTA scenario             WTO scenario
* WTO = World Trade Organisation ‘most-favoured-nation’

Source: World Economic Forum

Geopolitics in 2020                                                                                                         Page | 15
Contents

According to the Peterson Institute of International Economics, the “average US             “Biden calls for “targeted retaliation
tariffs on imports from China remain more than six times higher than before the             against China using existing trade
trade war began in 2018”.                                                                   laws and building a united front of
                                                                                            allies.”
While the agreement was a step in the right direction, the advent of Covid-19 nullified
the progress made. Trump blamed China for the origin of the virus, while Beijing
blamed the US for allowing it to turn into a global pandemic.

On 14 July 2020, Reuters reported that Beijing approved a new national security law
for Hong Kong and President Trump moved to end the city’s preferential trade status
with the US. Trump also banned the undermining of Hong Kong’s freedoms and
sovereignty. In response, China threatened to impose sanctions on US individuals and
entities.

On 23 July 2020, US Secretary of State Mike Pompeo announced that talks with the
Chinese Communist Party had failed and he went on to reproach China for its unfair
trade practices, intellectual property theft and human rights abuses in Hong Kong,
among other things. While tensions remain sour on this front, the consensus among
global economists is that Biden’s win will cool the trade war rhetoric. The Council
on Foreign Relations reports that Biden instead calls for “targeted retaliation against
China using existing trade laws and building a united front of allies”.

The latest developments occurred when the US Department of Commerce added
the Semiconductor Manufacturing International Corporation (SMIC), a major Chinese
semiconductor producer, to the Entity List on 18 December 2020. The listing further
restricts American exports of semiconductor designs, software and equipment to one
of the industry’s largest buyers.

Bottom line
On the local front, we can expect national politics to remain lively given the corruption
clean-up route that President Cyril Ramaphosa has taken. It has been painful to
witness these developments, yet it is also important to recognise that uncovering the
mess is the first step towards building a sustainable path for future policy reform. The
best plans mean very little if corruption still hampers implementation.

Offshore, given the recent Brexit deal and pronouncements made by new US President
Joe Biden, we expect that international relations will be more stable this year.

Graph 3: Main tariffs in the US-Sino trade war

                                                      10%                        25%
                               25%               0n $200 billion           0n $200 billion                 15%
                        0n $50 billion                                                               0n $125 billion

                         June 2018               September 2018               June 2019              September 2019

                               25%                Up to 10%                       25%                  Up to 10%
                        0n $50 billion            0n $60 billion             0n $60 billion           0n $35 billion

Source: World Economic Forum

Geopolitics in 2020                                                                                                           Page | 16
Contents

TRADE WAR
   Key moments in the trade relationship
   between the US and China

                •    JUNE                                                         •   APRIL
                     At a Pennsylvania campaign rally, Trump                          US and Chinese negotiators hold mid-week
   2016              announces plans to counter Chinese unfair trade       2019       trade talks in Beijing, craft a 150-page draft
                     practices and to apply tariffs under sections 201                trade agreement.
                     and 301 of the 1974 Trade Act.
                                                                                  •   MAY
                                                                                      Beijing backtracks on almost all aspects of the
                •    MARCH                                                            draft trade pact.
                     President Trump calls for tighter tariff
   2017              enforcement in anti-subsidy and anti-dumping                     President Trump tweets he intends to raise
                     cases and a review of US trade deficits.                         25% tariffs on $200 billion of Chinese goods
                                                                                      on 10 May 2019.
                •    APRIL
                     Presidents Trump and Jinping agree to a 100-day                  US bans Huawei Technologies from buying parts
                     plan for trade talks.                                            and components from US companies.

                •    JULY                                                         •   JUNE
                     Both sides fail to agree on new steps to reduce                  The US and China agree to restart trade talks,
                     US trade deficit with China.                                     and to delay imposing further tariffs.

                •    AUGUST                                                       •   AUGUST
                     Trump orders a “Section 301” probe into alleged                  US announces further tariffs on Chinese imports,
                     Chinese intellectual property theft.                             after two days of talks with no progress.
                                                                                      China halts purchases of US agricultural
                •    JANUARY                                                          products. US Treasury says China is manipulating
                     Washington imposes tariffs on all imported                       its currency.
   2018              washing machines and solar panels - not just                     President Trump tweets, “American companies
                     China.                                                           are hereby ordered to immediately start looking
                •    MARCH                                                            for an alternative to China.”
                     President Trump orders 25% tariffs on steel                      China announces additional retaliatory tariffs
                     and 10% on aluminium from all suppliers -                        on about $75 billion worth of US goods.
                     not just China.
                                                                                  •   SEPTEMBER
                •    APRIL                                                            After a two-day meeting of US and Chinese
                     China imposes 25% tariffs on 128 US products.                    deputies, US Trade Representative issues tariff
                     US plans 25% tariffs on $50 billion of Chinese                   exclusions on 400 Chinese products.
                     high-tech imports. US bans ZTE Corp from
                     buying US tech, and fines it for doing business              •   OCTOBER
                     with Iran and North Korea.                                       US Commerce Department puts 28 Chinese
                                                                                      companies on its “entity list,” over their alleged
                •    MAY                                                              involvement in human rights abuses.
                     US and China hold two rounds of trade talks.
                                                                                      After two days of high-level talks, Phase 1 deal
                •    JULY                                                             is announced, despite limited detail.
                     US implements 25% levies on $34 billion of
                     Chinese imports. China responds with tariffs on
                                                                                  •   JANUARY
                     $34 billion of US goods.
                                                                                      President Trump and Chinese Vice Premier
                •    AUGUST                                                2020       Liu He signed Phase 1 deal.
                     US releases list of $16 billion of Chinese goods
                                                                                  •   FEBRUARY
                     taxed by 25%. China retaliates in kind.
                                                                                      Phase 1 into effect. Bilateral Evaluation
                •    SEPTEMBER                                                        and Dispute Settlement Office monitor
                     US 10% tariffs come into effect, and will                        implementation.
                     increase to 25% on 1 January 2019. China taxes
                                                                                  •   DECEMBER
                     $60 billion of US goods.
                                                                                      US president-elect Joe Biden says he will not
                •    DECEMBER                                                         make any ‘immediate moves’ to lift trade war
                     Both US and China agree to 90-day halt.                          tariffs.

Sources: Peterson Institute for International Economics, Reuters and CNN

Trade war timeline                                                                                                                 Page | 17
FUND INSIGHTS: GROWTH OR VALUE?                                                                                                                     Contents
                            THE ABILITY TO ADAPT IS MORE IMPORTANT

“The wise adapt themselves to circumstances, as
water moulds itself to the pitcher.” – Chinese proverb
Investing is an integral part of good money management, and it is essential to
ensure both present and future financial security. However, there are quite a few
considerations that need to be made before selecting the ideal investment strategy
for your specific financial goals.
                                                                                                                                    “Value investing is the principal
Are certain investments better than others? Which investment style is the best for
                                                                                                                                    strategy which involves picking
your portfolio? As a multi-manager, we offer our clients the benefits of holding a
mix of high- and low-risk investments, various investment styles and opening the
                                                                                                                                    stocks that appear underpriced i.e.
landscape of selecting a mix of underlying managers to offer you a tailored portfolio                                               less than their intrinsic or book
suited to meet individual investment goals.                                                                                         value.”

Over the last year, investors have become increasingly concerned about which
investment style is the best for their portfolio. Has growth run its course? Is value
investing as a strategy still relevant in today’s market? The debate continues and is
ever more relevant now but before we can answer these questions, we must first have
insight into the difference between the two approaches and analyse their efficacy
over various market cycles.

When we talk about value investing, the principal strategy involves picking stocks
that appear to be trading for less than what they are worth i.e. less than their
intrinsic or book value. Value investors actively hunt for stocks they think the
market is underestimating. They believe the market has overreacted to good or bad
news, resulting in stock price movements that do not correspond to a company’s
long-term fundamentals. One form of growth investing on the other hand involves
a strategy that aims to buy young, early stage companies that are seeing rapid
                                                                                                                                    “One form of growth investing on
growth in profits, revenue or cash flow. Another form of growth investing involves                                                  the other hand involves a strategy
a strategy that focuses on buying larger mature companies which are still able to                                                   that aims to buy young, early stage
maintain higher than average growth metrics. As we can see, growth investors prefer                                                 companies that are seeing rapid
capital appreciation – or sustained growth in the market value of their investments –                                               growth in profits, revenue or cash
rather than the steady streams of dividends sought by income investors. Choosing a                                                  flow.”
single style for one’s portfolio is a seemingly difficult task. Ultimately, the decision will
come down to timing, as value and growth have each outperformed each other over
various market cycles.

Since 3 June 2007, the midst of the Global Financial Crisis (GFC), growth stocks have
reigned superior over their value counterparts (graph 1). This is normally the case post
a financial crisis. As interest rates drop during times of market stress, cash investors
are offered very little benefit to holding these lower yielding money market securities
and start looking elsewhere for better growth opportunities.

Graph 1: Strong run of growth

                   300

                   250
Invetment growth

                   200

                   150

                   100

                    50

                     0
                    03-Jun-07   03-Jun-08   03-Jun-09   03-Jun-10   03-Jun-11   03-Jun-12   03-Jun-13   03-Jun-14   03-Jun-15   03-Jun-16   03-Jun-17   03-Jun-18   03-Jun-19     03-Jun-20

                                                                      MSCI World Growth NR USD                MSCI World Value NR USD

Source: Morningstar direct

Fund Insights: Growth or value? The ability to adapt is more important                                                                                                           Page | 18
Contents

As we begin to see economies reopen and gain confidence, corporate earnings
usually follow suit and begin trending upwards with investors taking the opportunity
to deploy capital into the depressed stock market, buying up the growth story as it
offers a potentially better return trajectory.

While there is merit to rotating out of value and into growth, there are sometimes                                                                                                     “Over a one-month period ending
pitfalls as it seems investors have forgotten that value has also outperformed growth                                                                                                  November 2020, value as a strategy
for long periods of time (graph 2). Value will tend to outperform growth during bear                                                                                                   returned 15% while growth
markets or economic recessions and even in the early stages of a market recovery.                                                                                                      returned 10.90%.”
This can be seen during the one-month and three-month returns ending November
2020 for the MSCI World Value and World Growth performance (graph 3). Over
a one-month period ending November 2020, value as a strategy returned 15%
while growth returned 10.90%. Similarly, over a three-month period ending
November 2020, value outperformed growth by 4.90%.

Graph 2: Outperformance of value

                   60

                   50

                   40
Invetment growth

                   30

                   20

                   10

                    0
                          7

                                    8

                                                9

                                                         0

                                                                    1

                                                                             2

                                                                                      3

                                                                                               4

                                                                                                         5

                                                                                                                      6

                                                                                                                               7

                                                                                                                                        8

                                                                                                                                                 9

                                                                                                                                                            0

                                                                                                                                                                       1

                                                                                                                                                                                  2

                                                                                                                                                                                             3

                                                                                                                                                                                                      4

                                                                                                                                                                                                                  5

                                                                                                                                                                                                                            6

                                                                                                                                                                                                                                       7

                                                                                                                                                                                                                                                 8

                                                                                                                                                                                                                                                            9
                         -9

                                    -9

                                            -9

                                                       -0

                                                                 -0

                                                                          -0

                                                                                    -0

                                                                                              -0

                                                                                                         -0

                                                                                                                    -0

                                                                                                                            -0

                                                                                                                                       -0

                                                                                                                                                -0

                                                                                                                                                            -1

                                                                                                                                                                     -1

                                                                                                                                                                                -1

                                                                                                                                                                                        -1

                                                                                                                                                                                                      -1

                                                                                                                                                                                                                  -1

                                                                                                                                                                                                                          -1

                                                                                                                                                                                                                                     -1

                                                                                                                                                                                                                                             -1

                                                                                                                                                                                                                                                           -1
                        ec

                                ec

                                           ec

                                                       ec

                                                               ec

                                                                        ec

                                                                                 ec

                                                                                             ec

                                                                                                     ec

                                                                                                                ec

                                                                                                                          ec

                                                                                                                                   ec

                                                                                                                                                ec

                                                                                                                                                        ec

                                                                                                                                                                   ec

                                                                                                                                                                            ec

                                                                                                                                                                                        ec

                                                                                                                                                                                                    ec

                                                                                                                                                                                                             ec

                                                                                                                                                                                                                         ec

                                                                                                                                                                                                                                  ec

                                                                                                                                                                                                                                            ec

                                                                                                                                                                                                                                                          ec
                    -D

                               -D

                                           -D

                                                    -D

                                                              -D

                                                                        -D

                                                                                 -D

                                                                                          -D

                                                                                                    -D

                                                                                                               -D

                                                                                                                          -D

                                                                                                                                   -D

                                                                                                                                            -D

                                                                                                                                                      -D

                                                                                                                                                                  -D

                                                                                                                                                                           -D

                                                                                                                                                                                       -D

                                                                                                                                                                                                 -D

                                                                                                                                                                                                            -D

                                                                                                                                                                                                                       -D

                                                                                                                                                                                                                                  -D

                                                                                                                                                                                                                                            -D

                                                                                                                                                                                                                                                     -D
                   08

                               08

                                      08

                                                 08

                                                            08

                                                                    08

                                                                               08

                                                                                       08

                                                                                                  08

                                                                                                          08

                                                                                                                      08

                                                                                                                                  08

                                                                                                                                          08

                                                                                                                                                     08

                                                                                                                                                             08

                                                                                                                                                                           08

                                                                                                                                                                                   08

                                                                                                                                                                                              08

                                                                                                                                                                                                         08

                                                                                                                                                                                                                   08

                                                                                                                                                                                                                                08

                                                                                                                                                                                                                                        08

                                                                                                                                                                                                                                                   08
                                                                                             MSCI World Growth NR USD                                MSCI World Value NR USD

Source: Morningstar direct

Graph 3: Early-stage recovery month ending November 2020

                        32.5                                                                                                                         31.3
                        30.0
                                                                                                                           27.5
                        27.5
                                                                                                  25.2
                        25.0
                        22.5
                        20.0
                        17.5                                                          16.9                                                                                      17.2
                                    15.0                                                                                                                                                                   15.5
                        15.0
Returns

                                                                                                                                                                                                                                     13.0
                        12.5
                                                10.9
                        10.0                                                                                                                                                                                                                                    9.4
                                                              8.2
                                                                                                                                                                                                                          7.2
                         7.5                                                                                                                                                                  6.0
                                                                                                                                                                                                                                                    4.8
                         5.0
                                                                         3.3
                         2.5                                                                                                                                       1.7

                         0.0
                        -2.5                                                                                                             -1.7
                        -5.0                                                                                   -4.6
                        -7.5
                                1-month                     3-months                6-months                  YTD                      1-year                    3-years                    5-years                    10-years                  15-years

                                                                                             MSCI World Growth NR USD                                 MSCI World Value NR USD

Source: Morningstar direct

Fund Insights: Growth or value? The ability to adapt is more important                                                                                                                                                                                    Page | 19
Contents

There are a few drivers which have caused this turnaround
Firstly, stability in the US presidential election. With market participants seeing more
stability in the outcome and supportive trade policy, market risk as measured by
the Volatility Index (VIX), has decreased significantly allowing investors to increase         “The next step in understanding
their risk appetite. Secondly, we have more certainty around a Covid-19 vaccine                the two investment styles is to
which is highly supportive to many industries. The vaccine, although far from global
                                                                                               understand which companies form
distribution, provides positive sentiment which encourages business to reopen, the
                                                                                               part of which index as well as
economy to recover and travel to continue. With travel increasing, this brings in a
third driver, oil demand and an increase in price. Demand for oil took a huge hit as           the underlying sector allocations
global travel came to a complete halt last year. The price in oil sank instantly on the        as a by-product of these stock
back of a global lockdowns, however as the economy emerges, the energy sector                  allocations.”
saw a massive rebound helping push the value index higher.

The next step in understanding the two investment styles is to understand which
companies form part of which index as well as the underlying sector allocations
as a by-product of these stock allocations. Looking purely into the US market as a
barometer, it becomes more evident as to what the underlying return drivers of each
index are, as well as when each index is geared to perform better.

Starting with an index composition (table 1), both indices hold roughly the same
number of underlying companies, namely 469 in the value index and 432 in the
growth index respectively. What we notice further is the significant concentration
risk seen in the growth index against that of the value index. The top 10 holdings
within the growth index amount to nearly half the total index (49.23%) whereas the
top 10 within the value index only amounts to 26.33%. In the market environment
we’ve seen last year, it is no surprise that growth has outperformed value. Returns
for the broad market index have been extremely concentrated in a few names and
therefore higher weightings to those companies would prove beneficial. On a pure
relative basis, not having exposure or having an underweight to those companies
which saw significant growth would have caused one to underperform against the
index. This point stands out in the value index.

In 2020, we have seen a strong resilience among companies with a dominant online
presence, due to their ability to weather the storm of global lockdown. In general,
these companies have more intangible assets and higher growth projections, which
favour their inclusion into a growth index.

Table 1: Value index (left) and growth index (right) composition

  Top 10 holdings                                          Top 10 holdings
  Total number of holdings                         469     Total number of holdings      432
  % in top 10 holdings                           26.33     % in top 10 holdings        49.23

  Top 10 holdings                                          Top 10 holdings
  Johnson & Johnson                             3.84%      Miscrosoft Corp            12.59%
  JPMorgan Chase & Co                           3.62%      Amazon.com Inc             10.48%
  Procter % Gamble Co                           3.48%      Facebook Inc A             5.17%
  Verizon Communications Inc                    2.52%      Alphabet Inc A             4.10%
  Comcast Corp Class A                          2.31%      Alphabet Inc Class C       4.02%

  Bank of America Corp                          2.16%      Tesla Inc                  3.29%
  Pfizer Inc                                    2.14%      Visa Inc Class A           2.76%
  Walmart Inc                                   2.14%      NVIDIA Corp                2.57%
  Intel Corp                                    2.07%      Mastercard Inc A           2.31%
  AT&T Inc                                      2.06%      PayPal Holdings Inc        1.95%

Source: Morningstar direct

Fund Insights: Growth or value? The ability to adapt is more important                                                       Page | 20
Contents

The second point to look at is the sector allocation (table 2)
Value indices as a by-product of stock selection are positioned more defensively,
namely around consumer defensive, healthcare and utility companies. They also tend
to have higher weightings in financials and energy counters. Looking back over the
2020 year, it is again no surprise to see that a value index would underperform.
The year included a price shock for oil causing prices to plummet as well as a global
shutdown forcing less travel, reduced spending and lower interest rates – all of
which are drivers which will cause the respective sectors to do worse. Stock selection
within this space would still prove difficult to seek out positive returns, due to the
broader macro issues playing out of favour.

Table 2: Value index (left) and growth index (right) sector allocation

  Stock sectors                           30-Nov-20         Stock sectors                   30-Nov-20
                                                   %                                               %
         Cyclical                               30.47              Cyclical                     31.73
         Basic materials                          2.21             Basic materials               1.41   “The year included a price shock
         Consumer cyclical                        5.69             Consumer cyclical             18.4   for oil causing prices to plummet as
         Financial services                       20.1             Financial services            9.14   well as a global shutdown forcing
                                                                                                        less travel, reduced spending and
         Real estate                              2.47             Real estate                   2.79
                                                                                                        lower interest rates – all of which
         Sensitive                           3038.07               Sensitive                  3057.77   are drivers which will cause the
         Communication services                   8.04             Communication services        18.6   respective sectors to do worse.”
         Energy                                    6.5             Energy                        0.29
         Industrials                            13.97              Industrials                   4.48
         Technology                               9.56             Technology                    34.4

         Defensive                           3031.46               Defensive                  3010.50
         Consumer defensive                     13.67              Consumer defensive            1.28
         Healthcare                             10.78              Healthcare                    9.17
         Utilities                                 7.0             Utilities                     0.05

Source: Morningstar direct

The key takeaway from the above is that within each index, there are good companies
which, over time, have produced exceptional results. However, given the changing
macro environments, these companies cannot be top performers all the time.

The case can be made that a more prudent approach would be to incorporate both
styles into your portfolio. The benefit of this is smoother returns during times of
market volatility.

The philosophy we use at PSG Wealth has always been to conduct thorough research                        “The philosophy we use at
into our underlying managers and not to make asset allocation (or trend) calls with                     PSG Wealth has always been to
regard to the way we allocate to our managers.                                                          conduct thorough research into
                                                                                                        our underlying managers and not
In a recent article by one of our underlying managers, they noted that the definition
                                                                                                        to make asset allocation (or trend)
of value and growth has recently become much more dynamic and fluid than it
has been over the past 10 years. A large number of companies have moved from
                                                                                                        calls with regard to the way we
growth to value, as sustained high growth has become harder to maintain. Margin                         allocate to our managers.”
of safety and mean reversion (which form the basis of value investing) may not
be as useful as they were once thought to be. For example, why would shares of
an oil company revert to the mean if renewable energy is becoming both cheaper
and storable? The manager’s conclusion is that growth versus value might not be
the correct question, as both strategies have failed in the past and recently. This
illustrates why it is important to have exposure to both styles and not either one or
the other, but to be optimally diversified.

Fund Insights: Growth or value? The ability to adapt is more important                                                                   Page | 21
Contents

As mentioned previously, PSG Wealth strives to position its portfolios in a manner
that will not disadvantage them when styles shift and change, but rather to position
themselves for an all-weather scenario – a diversified approach to ensure consistency
in performance. Graph 4 illustrates this attempt by breaking down the different
market styles over time and how the respective PSG Wealth global portfolios have
                                                                                                                                                                                                                                       “The most successful people are
managed to produce positive returns.
                                                                                                                                                                                                                                       those who accept and adapt to
From graph 4 we can see that as the line increases, growth outperforms value and,                                                                                                                                                      constant change. This adaptability
similarly, as the line decreases, value outperforms growth. Now, speaking to the                                                                                                                                                       requires a degree of flexibility
individual cycles and moving from left to right, we can see value had a massive                                                                                                                                                        and humility most people can’t
run post the 2000 dot-com bubble. From mid-2007 to mid-2009, we then saw the                                                                                                                                                           manage.”
rally in growth stocks until the GFC. Following that, we saw very muted relative
                                                                                                                                                                                                                                       – Paul Lutus
performance with no significant swings to either side, until we saw big changes post
the US election in November 2016. President Donald Trump was elected in November
2016 and with his pro-business stance, growth companies saw a massive rally. To
increase that even further, the world was hit by Covid-19 to further emphasise this
disconnect between the two styles.

The point we are driving home is that, despite limited fund history for the Global
Creator Portfolio (eight years), through each market cycle the fund managed to
produce a positive return. As mentioned previously, we do not take directional
bets on growth versus value, but we try to build resilient portfolios to withstand all                                                                                                                                                        Our three-pillar approach
market conditions.

Looking deeper into the style analysis (graph 5) of the PSG Wealth Global Creator,
the fund maintains a relatively consistent approach to style valuation. Within the                                                                                                                                                                                                 Fees
selected portfolio, we position the fund by choosing underlying managers which can
find value in each style.
                                                                                                                                                                                                                                                              Risk
Like all investors, our underlying managers have both value and growth preferences,
and it is our responsibility to ensure the combination of these preferences aligns                                                                                                                                                                                                        Returns
with long-term success. Each manager has been carefully selected to serve a
particular purpose within the fund structure. Therefore, we place a bigger emphasis
on the fund of funds risk and return profile to ensure the three pillars on which
FoF’s in PSG Wealth are is built remain intact.

Graph 4: Growth versus value relative returns

                     Growth >                                                             Growth <                                                    Growth >                                                Growth = Value                                                                    Growth > Value
300
                      Value                                                                Value                                                        Value                                                      0.0%                                                                             180.0%
                      48.1%                                                                73.0%                                                       122.1%                                                   PSG Wealth                                                                        PSG Wealth
250                                                                                                                                                                                                           Global Creator                                                                    Global Creator
                                                                                                                                                                                                                  32.3%                                                                              58.2%

200

150

100

 50

   0
                 7             8             9             0             1             2             3             4             5             6             7             8             9             0             1             2             3             4             5             6             7             8             9
              c-9           c-9           c-9           c-0           c-0           c-0           c-0           c-0           c-0           c-0           c-0           c-0           c-0           c-1           c-1           c-1           c-1           c-1           c-1           c-1           c-1           c-1           c-1
          -De           -De           -De           -De           -De           -De           -De           -De           -De           -De           -De           -De           -De           -De           -De           -De           -De           -De           -De           -De           -De           -De           -De
       08            08            08            08            08            08            08            08            08            08            08            08            08            08            08            08            08            08            08            08            08            08            08

Source: Factset

Fund Insights: Growth or value? The ability to adapt is more important                                                                                                                                                                                                                                                     Page | 22
Contents

Graph 5: Style valuation

100

 90                                                                             Value
 80

 70

 60                                                                             Core
 50

 40

 30

 20                                                                             Growth
 10

  0
                             2014                     2015               2016           2017   2018                 2019        2020

Source: Morningstar direct 									                                                           Time period: 01-12-2013 to 30-06-2020

Fund Insights: Growth or value? The ability to adapt is more important                                                      Page | 23
PERFORMANCE OF WEALTH SOLUTIONS OVER THE FOURTH                                                                                  Contents
             QUARTER OF 2020

Domestic funds review
The year’s underdogs took the lead in the last quarter of 2020 - emerging market (EM)                  “The US election result and positive
equities and currencies, and global value stocks all saw strong gains. Moreover, this                  news on Covid-19 vaccines helped
is both in absolute terms and on a relative basis. We saw this improvement happen                      the more cyclical segments of the
as risk-on sentiment returned to the markets on the back of news about Covid-19                        market to recover with value stocks
vaccine rollout plans boosting optimism about a possible economic recovery.
                                                                                                       rising by 16% and recording their
Locally, particularly growth assets, equity and property had a very strong quarter.                    best quarter since 2009.”
However, SA bonds remain the dominant asset class, over the medium to longer
term. Global assets had a poor quarter, both on an absolute and a relative basis. This
was largely due to the exchange rate effect of the stronger rand over this time. That
being said, global equity remains the best performer over all periods longer than
one year.

PSG Wealth Equity and Multi-Asset Funds of Funds (FoFs)
The equity solution and the two multi-asset FoFs continued their strong performance
from the second and third quarters, all ranking in the top half of their respective
sectors for the final quarter of 2020. Unfortunately, for the Moderate and Preserver
these impressive nine months were not enough to avoid landing in the third quartile
for the year.

PSG Wealth Fixed Income Fund and FoF
The Enhanced Interest FoF continues to outperform its benchmark over all periods.
The Income FoF also enjoyed another positive quarter, ranking in the second quartile,
and building on its solid performance in the previous two quarters. However, its
medium- to longer-term numbers continue to be below expectations, with the
solution in the third quartile from one to four years. Similar to our other solutions,
the Income FoF has beaten the peer average on a rolling two-year basis 81% of the
time since its inception.

Click here for the complete 4Q20 review of our local solutions.

Offshore funds review
Looking back over the fourth quarter, equity markets continued to rally for the third
consecutive quarter and significantly outperformed fixed income. The US election
result and positive news on Covid-19 vaccines helped the more cyclical segments
of the market to recover with value stocks rising by 16% and recording their best
quarter since 2009.

For equities, the vaccine announcement in early November 2020 led to one of the
largest momentum changes in history.

Table 1: Asset class returns in domestic funds in rand terms

                                                                  3-months to      6-months to      1-year to          3-years to          5-years to
                     Asset class (in rand)
                                                                  31/12/2020       31/12/2020      31/12/2020         31/12/2020          31/12/2020

 SA equity                                                                 11.5             12.6                0.6             -1.5                3.2
 SA property                                                               22.2              4.9           -34.5               -20.7                -8.4
 SA bonds                                                                   6.7              8.3                8.7                 8.9            10.4
 SA cash                                                                    1.0              2.1                5.4                 6.6             7.0
 Global equity                                                              0.4              4.0           21.7                17.0                11.0
 Global bonds                                                               -9.0           -10.4           14.7                11.0                 3.7
 USD/ZAR                                                                  -12.3            -15.3                5.0                 6.1             -1.0

Source: PSG Wealth research team

Performance of Wealth solutions over the fourth quarter of 2020                                                                                Page | 24
Contents

Hard-hit value sectors (energy, hotels, airlines, financials and traditional retail) rallied
while those pandemic winners (healthcare, home improvement and online retail)
lagged. From a regional perspective, emerging markets saw the biggest rally climbing
nearly 20% while Asia ex-Japan delivered 19%.

PSG Wealth Global Preserver FoF
The developments for the Global Preserver remained the same for most of 2020 with
the market crash in March 2020 causing the biggest headwind for the year. However,
as volatility stabilised and yield spreads narrowed, the fund clawed back the return                         “The PSG Wealth Global
lost over the first quarter and produced three consecutive positive quarters to end                          Creator FoF saw a full range of
the year in the green.                                                                                       performance from the underlying
                                                                                                             managers from first to fourth
PSG Wealth Global Flexible FoF                                                                               quartile. Through the turbulent
The FoF continued its strong performance with the underlying managers balancing                              year, active stock selection
their portfolios accordingly. Moreover, the flexibility in the mandate allows managers                       remained an important driver,
to position where they feel the highest risk-adjusted return is best captured.                               which is something we favour
                                                                                                             in the portfolio.”
PSG Wealth Global Creator FoF
The FoF saw a full range of performance from the underlying managers from first
to fourth quartile. Through the turbulent year, active stock selection remained
an important driver, which is something we favour in the portfolio. No portfolio
changes occurred this year as we believe the underlying managers have the ability to
consistently produce alpha.

Click here for the complete 4Q20 review of our offshore solutions.

Table 2: PSG Wealth Global Solutions
                                                                  3-months to
                                                                  31/12/2020

                                                                                        31/12/2020

                                                                                                             31/12/2020

                                                                                                                                   31/12/2020

                                                                                                                                                         31/12/2020
                                                                                                              3-years to

                                                                                                                                    5-years to

                                                                                                                                                          7-years to
                                                                                         1-year to
                                                                                Rank

                                                                                                     Rank

                                                                                                                           Rank

                                                                                                                                                 Rank

                                                                                                                                                                          Rank
PSG Wealth Global Preserver FoF (USD) D                              6.26         24      4.07         87      3.68           63      5.36          23      4.09             13
BM: Morningstar USD Cautious Allocation                               4.7        111       5.6        106       3.8           96       4.3          74       2.9             62
Excess (vs BM) - Morningstar USD Cautious Allocation                 1.60                -1.53                -0.08                   1.07                  1.16

PSG Wealth Global Preserver FoF (GBP) D                             1.76           40     1.31          35     3.08           18      6.28           6      5.75              9
BM: Morningstar GBP Cautious Allocation                              3.3           46      4.1          42      3.1           36       4.2          33       3.9             30
Excess (vs BM) - Morningstar GBP Cautious Allocation               -1.49                 -2.78                -0.04                   2.03                  1.88

PSG Wealth Global Moderate FoF D USD                              10.24          102    10.02          58       5.40         61       6.51         48       3.94            56
BM: Custom Moderate Allocation                                     11.9          147      9.0         147        5.1        146        6.1        134        3.9           111
Excess (vs BM) Custom USD Moderate Allocation                     -1.62                  1.03                   0.26                  0.40                  0.08

PSG Wealth Global Flexible FoF (USD) D                            10.63           55    16.81          21    10.76            7    12.04             9      8.82              6
BM: Morningstar USD Flexible Allocation                             7.9          186      6.9         175      3.7          127      4.9            84       2.7             58
Excess (vs BM) - Morningstar USD Flexible Allocation               2.73                  9.94                 7.04                  7.14                    6.08

PSG Wealth Global Flexible FoF (GBP) D                              4.88         115    13.91          10       9.98          5    12.95             5   11.16                4
BM: Morningstar GBP Flexible Allocation                              7.0         148      4.1         140        2.6        104      5.9            80     4.9               66
Excess (vs BM) - Morningstar GBP Flexible Allocation               -2.15                 9.82                   7.38                7.01                  6.22

PSG Wealth Global Creator FoF D                                   13.40          227    19.26         105    12.70           88    12.95           95       9.88            75
BM: Custom Global Large Cap                                        14.9          379     15.9         379      9.1          378     10.9          377        7.9           319
BM: MSCI World NR USD                                              14.0                  15.9                 10.5                  12.2                     9.2
Excess (vs BM) - Morningstar Global Large-Cap Blend Equity        -0.20                  5.36                 5.37                  3.46                    3.40
Excess (vs BM) - MSCI World NR                                    -0.56                  3.36                 2.15                  0.75                    0.71

Source: Morningstar Direct

Performance of Wealth solutions over the fourth quarter of 2020                                                                                                        Page | 25
You can also read