Community Health Needs Assessment 2014 - 2016 - Advocate Health Care
←
→
Page content transcription
If your browser does not render page correctly, please read the page content below

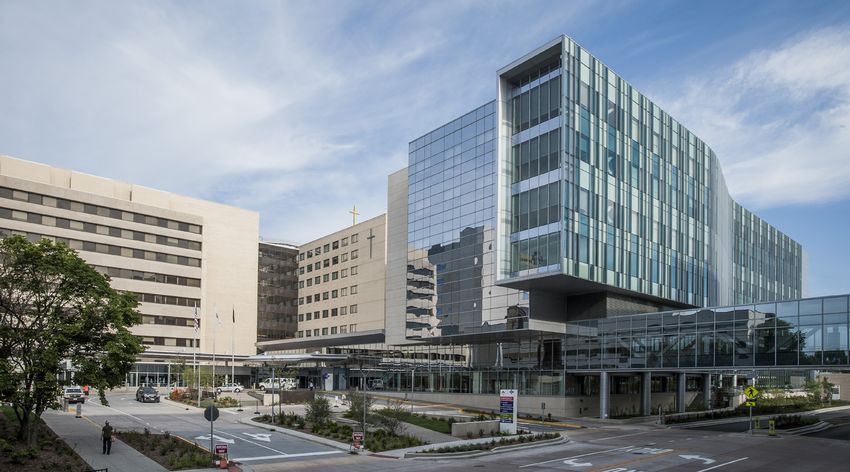
Community Health
Needs Assessment
2014 – 2016
December 2016
I am pleased to present the 2016 Community Health Needs Assessment (CHNA) for Advocate Christ
Medical Center, one of 11 acute care hospitals in the Advocate Health Care System. One way we invest
in the community is by conducting a comprehensive CHNA to look at the health of the residents in the
medical center’s service area. In 2013, we reviewed public health data and a Community Health Council
was convened to review the data and select health priorities to address. The Council chose violence
prevention, access to primary pediatric care and childhood obesity as the priority areas of focus for
2014-2016.
In 2016, our comprehensive review includes a thorough assessment of our primary service area’s health
care profile, secondary public health data and new primary health data through our collaboration with
community and public health organizations and with the Health Impact Collaborative of Cook County
(HICCC). The HICCC was created in 2015 through the collaboration of Advocate Health Care, including
Christ Medical Center, other hospitals, health departments and community organizations within Cook
County. This collaborative facilitated a diverse community-engaged assessment which is posted as a
companion to this report.
We have learned through the process that our collaborations and partnerships with community based
organizations, faith communities, schools and local employers are critical to addressing the priority areas
that were identified in the past and present. We look forward to strengthening those partnerships and
establishing new relationships to further respond to the priority areas identified within this report.
I am grateful for the enduring commitment to this public health mission that we share and thank our
Community Health Council and community partners, the hundreds of community residents that provided
valuable feedback in our surveys and forums, and the leadership at Christ Medical Center for their ongoing
efforts to protect and promote the health of all. It is a privilege to be entrusted with helping to meet the
health care needs of our community.
Sincerely,

Kenneth W. Lukhard
President, Advocate Christ Medical Center
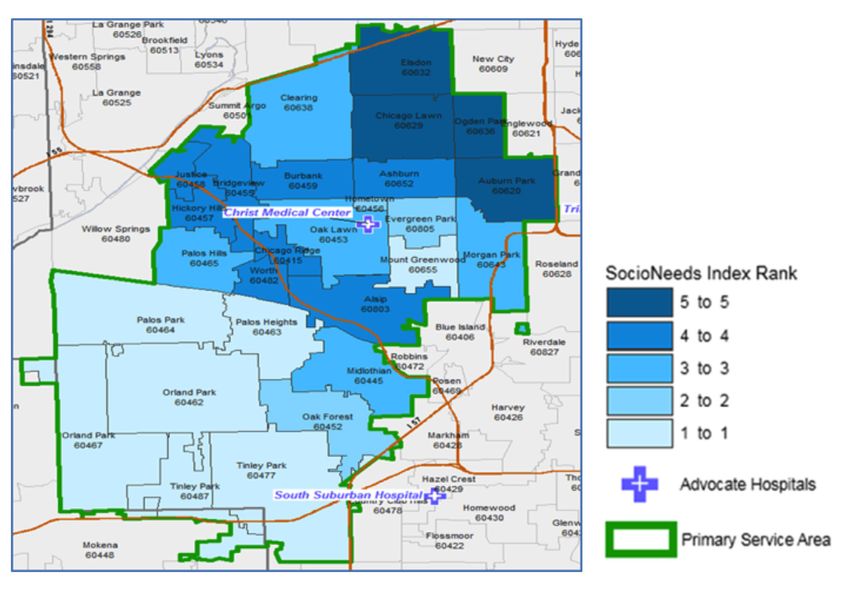
Table of Contents
I.    Executive Summary 3

II.   Description of Advocate Health Care and Advocate Christ Medical Center 4
      4  Advocate Health Care
      4  Advocate Christ Medical Center

III. S
      ummary of the 2011-2013 Community Health Needs Assessment and Program
     Implementation 5
      5  Community Definition
      5  Overall Process of the CHNA
      5  Needs Identified and Priorities Selected for CHNA
      5  Summary of Program Strategies and Outcomes to Meet Identified Priorities
           5  CeaseFire
           6  Access to Pediatric Primary Care
           7  Childhood Obesity
      7  Input from the Community
      7  Lessons Learned

IV. 2014-2016 Community Health Needs Assessment 8
      8  Community Definition
      9  Community Demographics
           9  Race and Ethnicity
           10  Age
           10  Gender
           10  Education and Employment
           11  Household Income
           12  Poverty
           12  Insurance Coverage
           12  SocioNeeds Index
      13  Key Roles in the Assessment
           13  System and Medical Center Leadership
           14  Community Health Council
           15  Governing Council
           15  Health Impact Collaborative of Cook County
      15  Methodology Used for the 2014-2016 Community Health Needs Assessment
           15  Health Impact Collaborative of Cook County
                     15  MAPP Process
                     17  Community Survey
                     18  Focus Groups in South Region
           19  Use of Healthy Communities Institute (HCI) Data Platform
           19  Review of Other Available National and Local Data

                                                    1
Table of Contents continued...
     20  Summary of Results
          21  Asthma
          22  Cancer
          23  Diabetes
          25  Heart Disease
          25  Hypertension and Cerebrovascular Disease
          26  Violence
     27  Prioritization of Health Needs
          27  Health Impact Collaborative of Cook County
          28  Community Health Council Priority Setting
                  29  Needs Selected as Priorities
                  29  Needs Not Selected as Priorities
                          29  Cancer
                          29  Heart Disease
                          29  Hypertension and Cerebrovascular Disease
          30  Approval of CHNA by Governing Council

V.   Implementation Planning 31
     31  Priority Area: Social Determinants of Health – Violence
     31  Priority Area: Asthma
     31  Priority Area: Diabetes

VI. Community Feedback Mechanism 32
     32  Other Communication and Feedback Opportunities

VII. Appendices 33
     33  Appendix 1: 2014-2016 Community Health Needs Assessment Data Sources
     35  Appendix 2: Advocate Children’s Hospital – Oak Lawn Community Profile

                                                         2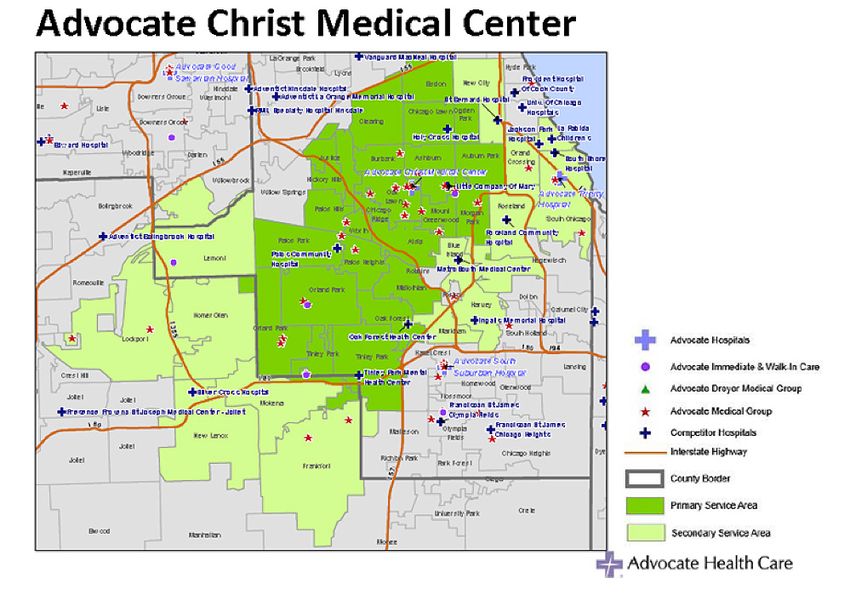
I. Executive Summary
With this Community Health Needs Assessment (CHNA) report, Advocate Christ Medical Center continues
to demonstrate strong commitment to building lifelong relationships to improve the health of individuals,
families and communities. In 2015, all five Advocate Health Care hospitals principally serving Cook County,
including Advocate Christ Medical Center, were founding members of the Health Impact Collaborative of
Cook County (HICCC). HICCC is a best practice community health initiative involving 26 hospitals, 7 health
departments and nearly 100 community-based organizations. The goal of this collaborative is to work
together on a county-wide health assessment and common implementation strategies once priorities
are identified. The Illinois Public Health Institute (IPHI) served as the backbone organization for the
collaborative—providing facilitation, data coordination and report preparation activities.
Given the size and diversity of Cook County, the collaborative created three regions—North, Central and
South—for purposes of organizing the assessment process. Christ Medical Center was appropriately
assigned to the South region consisting of both the south side of Chicago and the south suburbs of Cook
County. Please see the companion document to Christ Medical Center’s CHNA, Health Impact Collaborative
of Cook County, Community Health Needs Assessment, South Region, which is also posted on the
Advocate website and at www.healthimpactcc.org/reports2016.
In addition to participating in the Cook County collaborative, Christ Medical Center conducted a
community health assessment targeting its defined community—the hospital’s primary service area (PSA).
This area includes approximately 947,915 individuals within 27 zip codes in Chicago and Suburban Cook
County. The diverse population served is 59% white, 23% African-American, 2% Asian and 13% other. By
ethnicity, the PSA is 29.4% Hispanic. Nearly 17% of the PSA population over the age of 25 does not have
a high school diploma as compared to 12% for Illinois, while almost 13% of all families live below the
federal poverty level compared to 11% for Illinois. The median age for the PSA is 37.56 years.
For purposes of the 2014-2016 CHNA cycle, a Community Health Council (Council) consisting of 25
community and medical center leaders was convened to oversee the assessment. Data from the Health
Impact Collaborative of Cook County was presented to the Council including the HICCCC priority-setting
process that identified Social Determinants of Health, Mental Health and Substance Abuse, Access to Care
and Chronic Disease as the four county-wide priorities. All hospitals that participated in HICCC agreed to
accept Social Determinants as one of their priorities, with Christ Medical Center identifying that one of
their strategies within this priority would be violence prevention.
In addition, multiple indicators from the Healthy Communities Institute (HCI) data platform were shared
with the Christ Medical Center Community Health Council. Many of these indicators were particularly
useful to the assessment because the hospitalization and emergency room visits rates were available by
zip code thus permitting a deeper look into the health status of the PSA. A voting process was used with
the Council to select the second and third priorities for this CHNA cycle—asthma and diabetes. Cancer,
heart disease and hypertension (stroke) were not selected primarily because the medical center already
has institutes addressing each of these important health needs. The three priorities selected by the
medical center are violence prevention, asthma and diabetes.
Christ Medical Center is currently developing implementation plans for each of the three priorities
selected. Community health staff will be participating in the action planning teams on Community Safety
and Chronic Disease Prevention convened as part of the HICCC. For violence prevention as a social
determinant, the medical center plans to continue its work with CeaseFire and collaborate with Chicago
Safe Start to address the impact of violence on children. For the asthma and diabetes priorities, teams
will be developing educational, outreach and environmental strategies in collaboration with Advocate
Children’s Hospital and community partners to improve the management of these diseases.

                                                    3
II. Description of Advocate Health Care and Advocate
Christ Medical Center
Advocate Health Care
Advocate Health Care is the largest health system in Illinois and one of the largest healthcare providers in
the Midwest, operating more than 400 sites of care, including 11 acute care hospitals, the state’s largest
integrated children’s network, 5 Level I trauma centers, 2 Level II trauma centers, the region’s largest
medical group and one of the region’s largest home health care companies. The Advocate system trains
more primary care physicians and residents at its four teaching hospitals than any other health system in
the state.
Advocate is a faith-based, not-for-profit health system related to both the Evangelical Lutheran Church in
America and the United Church of Christ. Advocate’s mission is to serve the health needs of individuals,
families, and communities through a wholistic philosophy rooted in the fundamental understanding
of human beings as created in the image of God. This wholistic approach provides quality care and
service, and treats each patient with dignity, respect and integrity. To guide its relationships and actions,
Advocate embraces the five values of compassion, equality, excellence, partnership and stewardship. The
mission, values and wholistic philosophy (MVP) permeate all areas of Advocate’s healing ministry and are
integrated into every aspect of the organization building a cultural foundation. The MVP calls Advocate
to extend its services into the community to address access to care issues and to improve the health and
well-being of the people in the communities Advocate serves. As an Advocate hospital, Christ Medical
Center embraces the Advocate system MVP.

Advocate Christ Medical Center
Advocate Christ Medical Center is a 749-bed teaching institution with nearly 1,300 affiliated physicians.
The medical center serves as a major referral hospital in the Midwest for many specialties, including
cardiovascular services; heart, lung and kidney transplantation; neurosciences; oncology; orthopedics;
and women’s health. The medical center provides emergency care for more than 100,000 patient visits
annually and has one of the busiest Level I trauma centers in Illinois, serving southern portions of Chicago
and Cook County, all of Will County and regions as far south as Kankakee, Illinois, west to Morris, Illinois,
and east to Northwest Indiana. As a major teaching institution, the medical center annually trains more
than 400 residents, 600 medical students, 800 nursing students and, through the Emergency Medical
Services Academy, some 2,500 emergency medical technicians, paramedics and other providers of
emergency care.
Christ Medical Center is a designated Magnet hospital by the American Nurses Credentialing Center.
The medical center is accredited overall by the international Det Norkse Veritas (DNV) and holds DNV
certification as a Comprehensive Stroke Center. The medical center’s Cancer Institute has achieved
three-year accreditation with commendation from the Commission on Cancer of the American College
of Surgeons, and the Heart Institute has received a three star rating in heart surgery from the Society
of Thoracic Surgeons. The medical center also serves as one of the leading centers nationally for the
implantation of left ventricular assistive devices to support patients’ with failing hearts.

                                                     4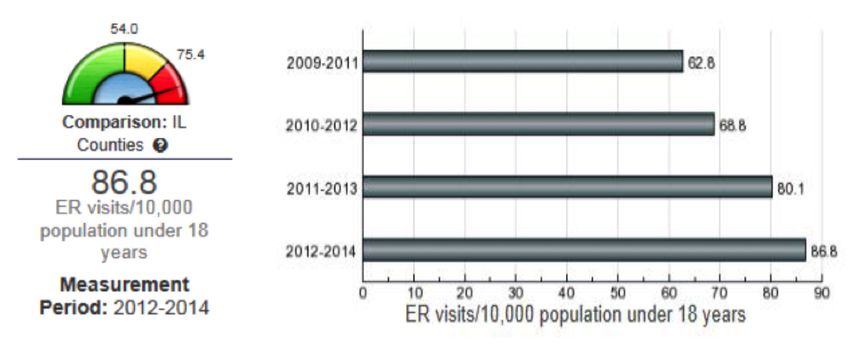
III. Summary of the 2011-2013 Community Health Needs
Assessment and Program Implementation
Community Definition
For the purposes of the 2011-2013 Community Health Needs Assessment (CHNA) cycle, the community
was defined as the total service area (TSA), which included the primary (PSA) and secondary service
areas (SSA) for Christ Medical Center. The medical center, located in Oak Lawn, Illinois, served a total
population of 1,560,571 people across 55 communities in the south/southwest suburbs and Chicago. The
population consisted of 38.4% White Non-Hispanic, 35.6% Black Non-Hispanic, 23.2% Hispanic, 1.6% Asian
and Pacific Islander Non-Hispanic and 1.1% other. There was a significantly higher unemployment rate
in the TSA compared to the US rate and household income was slightly less than the US average. While
the community was served by a variety of health resources, including hospitals, public health clinics and
mobile health providers, there was still substantial variation in both availability and accessibility of health
resources across communities.

Overall Process of the CHNA
As part of the CHNA process, a Community Health Council, chaired by the medical center’s community
health leader, was developed to review data, determine essential health needs and set priorities. Health
needs were prioritized based on prevalence of needs identified, incidence of disease in the community,
areas of greatest need, patient utilization of Christ Medical Center services, potential impact of projects
on community health, programs/services already offered to the community and the availability of internal
and external resources, community partnerships and existing relationships to collaborate on targeted
programs.

Needs Identified and Priorities Selected for CHNA
The Community Health Council compared all the data available using the above criteria and the top
rankings of Christ Medical Center’s admissions and discharges by disease-specific area and service lines.
Key health needs identified by the Council included heart disease, cancer, stroke, violence prevention,
access to pediatric primary care services and childhood obesity. Given available resources, Christ Medical
Center selected violence prevention, access to pediatric primary care services and childhood obesity as
community health priorities to address during the 2014-2016 implementation cycle years. Key health
issues identified, but not specifically targeted in the community health improvement plan were heart
disease, cancer and stroke. Christ Medical Center is addressing these health conditions through specially
designated clinical programs and community outreach activities.

Summary of Program Strategies and Outcomes to Meet Identified Priorities
The following is a summary of program strategies and outcomes Christ Medical Center implemented to
meet the goals and objectives of the identified health priorities.

CeaseFire
CeaseFire is a program that uses prevention, intervention and community-mobilization strategies to
reduce shootings and killings. The program was launched in Chicago in 1999 by the Chicago Project for
Violence Prevention at the University of Illinois at Chicago School of Public Health. Some of the program’s
strategies have been adapted from the public health field, which has had notable success in changing
dangerous behaviors. In fact, the program’s executive director, Gary Slutkin, is an epidemiologist who
views shootings as a public health issue. (CeaseFire: A Public Health Approach to Reduce Shootings and
Killings by Nancy Ritter, NIJ Journal, 2009.) In 2004, the program began a collaboration with Advocate
Christ Medical Center to reduce retaliation by families and shooting victims cared for in the hospital’s
Level I trauma center. Exhibit 1 presents the most recent data from the CeaseFire/hospital collaboration.

                                                      5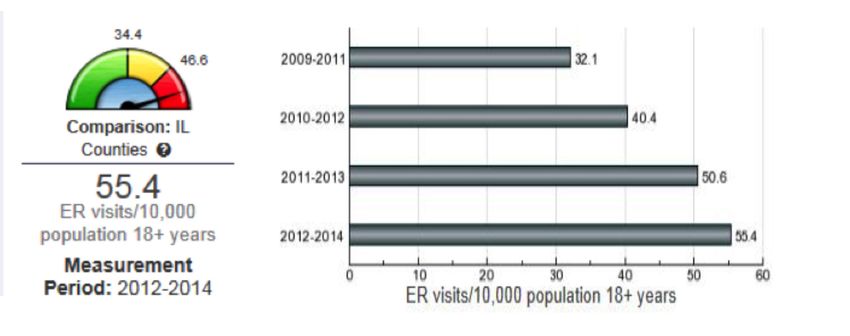
Exhibit 1: Summary of CeaseFire Program Data for Advocate Christ Medical Center 2014–2016

                                      2014                           2015                       2016
 CeaseFire
 Objective                 Total      Patients             Total     Patients           Total   Patients
                                                     %                           %                          %
                          Patients    Served              Patients   Served            Patients Served

 Hospital
 responders will
 have contact
 with patients
 and/or visitors         897          891          99.3   871        832        95.5   897      891        99.3
 in 90% of all
 incidents referred
 to the CeaseFire
 program.
 Follow-up needs
 will be assessed
 for 90% of patients     891          857          96.2   832        828        99.5   891      881        98.9
 treated for a
 violent injury.
 75% of all violent
 injury patients
 admitted inpatient
                     428              425          99.3   420        415        98.8   514      513        99.8
 will be assessed by
 the hospital case
 manager.
 90% of individuals
 assessed will be
 linked to long-
 term support by
                         425          407          95.8   415        394        94.9   513      510        99.4
 being connected
 with existing
 community
 resources.
*2016 includes data from 1/1–11/15/2016
Source: CeaseFire, Unpublished Data, November 18, 2016.

Access to Pediatric Primary Care
Primary health care services were provided through the Ronald McDonald Care Mobile (RMCM) program
to improve access to pediatric primary care. The RMCM is a partnership between Advocate Children’s
Hospital and Ronald McDonald House Charities of Chicagoland and Northwest Indiana to provide primary
health care to uninsured children in the areas of greatest need. The staff fostered relationships with
assigned medical home providers, in addition to solidifying relationships with Federally Qualified Health
Centers and other health care partners. Program results from January 2013 through December 2015 were
as follows:
  • The RMCM staff provided services to 6,411 students.
  • Students received 7,480 vaccines and 4,592 physicals.
  • There were 2,376 referrals made to primary care physicians, 414 referrals to dentists, 932 referrals to
    optometrists and 58 referrals for specialty care.
  • An agreement was negotiated with Aunt Martha’s, the third largest FQHC in Illinois, to provide follow-
    up pediatric care as well as specialty care for patients identified through RMCM visits. In 2015, the
    relationship with Aunt Martha’s was discontinued due to geographical limitations/patient difficulty
    accessing Aunt Martha’s facilities.
                                                           6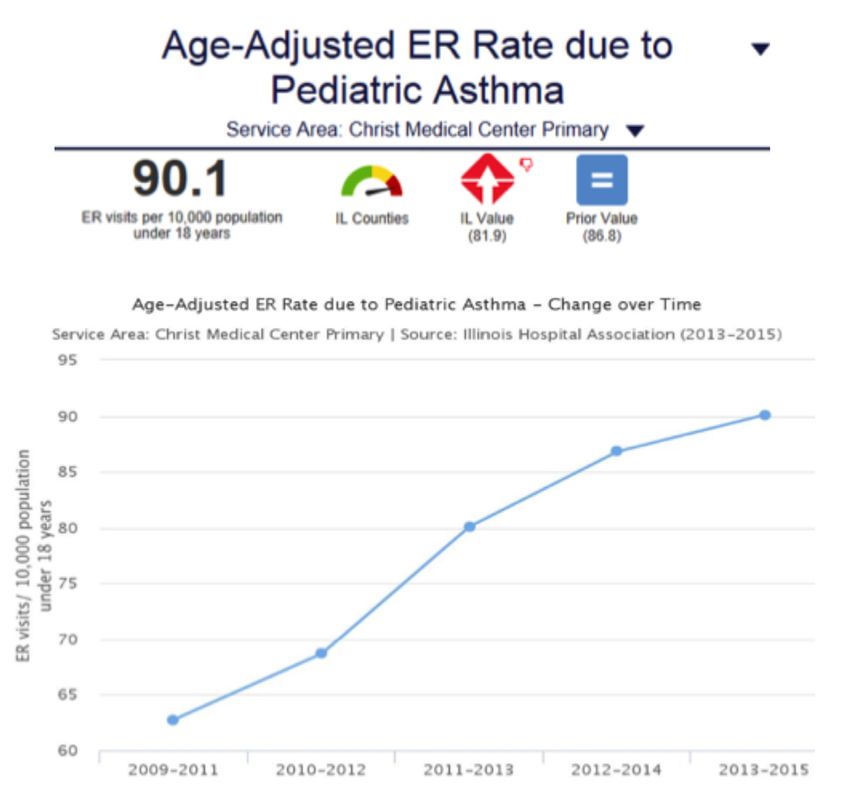
Childhood Obesity
To address childhood obesity, Advocate Christ Medical Center Children’s Hospital offered a program titled
ProActive Kids (PAK) to achieve and maintain a healthy weight, decrease Body Mass Index (BMI) and
improve fitness levels. ProActive Kids is a fitness and nutrition program designed for children ages 8-14
who are struggling with obesity. The program offers a safe environment where children can exercise and
learn about proper nutrition. The program also focuses on self-esteem, body image, stress, feelings and
a variety of other issues that can contribute to being overweight. PAK teaches children and their families
to improve health through exercise, nutrition education and lifestyle modification over a period of eight
weeks.
Three PAK series were planned for each year from 2014-2016. There were 70 registered program
participants in 2014, 66 in 2015 and 48 from January–July 2016. Program results for 2014 and 2015 include
the following:
 • For 8-weeks, all enrolled children participated in a 45-minute fitness session that focused on increasing
   muscle endurance, strength, cardiovascular endurance and flexibility, and reduction of body fat/BMI.
 • 96.5% of PAK parents surveyed reported their child’s confidence, communication, body-image, coping
   skills and self-esteem improved since participating in PAK.
 • 93.5% of PAK parents surveyed reported improvements, solid or significant, in their child’s attitude
   toward diet and nutrition.
 • In 2014, 86% of the PAK parents surveyed reported their child had a solid commitment to fitness
   following the PAK program.
 • In 2015, there was a 6% increase in the response of the parents seeing a solid commitment to fitness
   for their child due to the PAK program.
 • In 2015, 39% of parents who attended the PAK sessions reported personal weight loss as a result of
   their child participating in the program.

Input from the Community
Although many feedback mechanisms were put in place for the general public to comment or provide
input on the CHNA, the hospital did not receive any feedback from the community. The hospital will
continue to encourage input from the community by providing various feedback mechanisms for the
2014-2016 CHNA.

Lessons Learned
Advocate Christ Medical Center has made significant progress toward the strategies and initiatives
adopted to address the top identified health priorities described in the 2011-2013 CHNA and
Implementation Strategy Plan. Lessons learned from the past CHNA cycle include the following:
 • Focus community interventions more strategically toward the PSA to ensure a greater impact in the
   areas that have the greatest need.
 • Continue to seek and collaborate with various partners to increase the impact of community
   interventions.
 • Disseminate information about the CHNA through various strategies using community forums, social
   media, email blasts and other communication channels to share the results of the CHNA.

                                                    7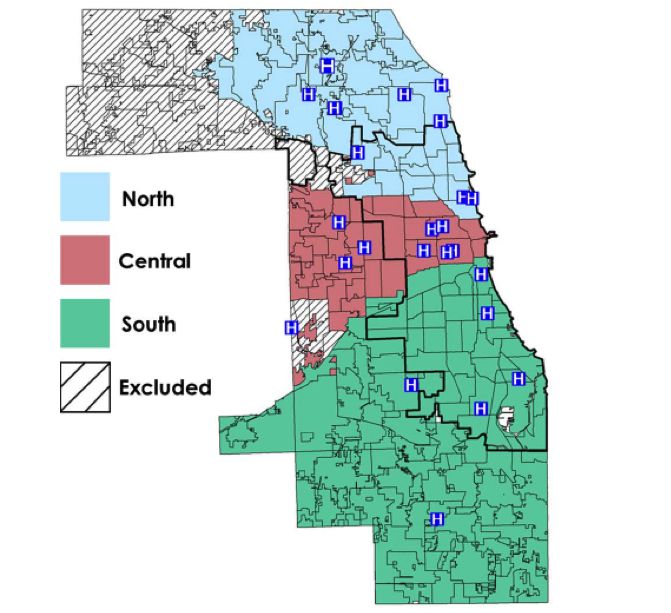
IV. 2014-2016 Community Health Needs Assessment
Community Definition
Located in Oak Lawn, Illinois, Christ Medical Center has a service area that lies within Cook County and
the Chicago city limits. Exhibit 2 is a map of the primary and secondary service areas, described as the
total service area (TSA), for the medical center. For purposes of this CHNA, the Community Health Council
defines the community as the primary service area (PSA) of the medical center located in Chicago and the
south/southwest suburbs. The total population of the defined community is 947,915. Exhibit 3 contains the
local community names and zip codes in the PSA.
Exhibit 2: Advocate Christ Medical Center’s Primary and Secondary Service Areas

Source: Advocate Health Care Strategic Planning Department, 2016.

                                                              8
Exhibit 3: PSA Area Zip Codes
Service Area Name Zip Code Service Area Name Zip Code
Oak Lawn 60453 West Englewood 60636
Auburn Gresham 60620 Tinley Park 60477
Chicago Lawn 60629 Palos Hills 60465
Ashburn 60652 Brighton Park 60632
Burbank 60459 Oak Forest 60452
Morgan Park 60643 Hickory Hills 60457
Chicago Ridge 60415 Palos Heights 60463
Bridgeview 60455 Worth 60482
Mount Greenwood 60655 Justice 60458
Alsip 60803 Hometown 60456
Clearing 60638 Tinley Park 60487
Evergreen Park 60805 Orland Hills 60467
Orland Park 60462 Palos Park 60464
Midlothian 60445
Source: Advocate Health Care Strategic Planning Department, 2016.
Community Demographics
Race and Ethnicity
According to US Census data, the population in the PSA increased from 938,229 to 947,915 between the
years 2010 and 2016. This represents a 0.92% growth in the service area in comparison to a 0.43% growth
in population in the State of Illinois during the same time period. In 2016, the population consisted of
58.6% White, 23.3% African American, 13.3% Other Race, 2.2% Asian and 0.4% American Indian/Alaskan
Native. The ethnicity of the population consisted of 29.4% Hispanic/Latino and 70.6% Non-Hispanic/Latino
(Healthy Communities Institute, Claritas, 2016). Racial and ethnic population data is represented
in Exhibits 4 and 5.
Exhibit 4: PSA Population by Race 2016
Race PSA Cook Illinois
White 58.6% 54.9% 70.3%
Black/African American 23.3% 23.6% 14.3%
Am Indian/AK Native 0.4% 0.4% 0.4%
Asian 2.2% 7.1% 5.3%
Native HI/PI 0.0% 0.0% 0.0%
Some Other Race 13.3% 11.2% 7.2%
2+ Races 2.2% 2.8% 2.5%
Source: Healthy Communities Institute, Claritas, 2016.
9Exhibit 5: PSA Population by Ethnicity 2016
Ethnicity PSA Cook Illinois
Hispanic/Latino 29.4% 25.3% 17.1%
Not Hispanic/Latino 70.6% 74.7% 82.9%
Source: Healthy Communities Institute, Claritas, 2016.
Age
Twenty four percent of their PSA population is under the age of 18 while 9.6% is between the ages of
18 to 24. The largest percent of the population is between the ages of 25 through 44 at 26.8%, and ages
45 through 64 at 25.5%. When combined, this represents over 52% of the total population within the
service area. The elderly population age 65 and over represents 14% of the total population in the PSA.
The median age for the service area is 37.6, which is similar to median ages in Cook County at 36.8 and
in the state of Illinois at 37.8 (Healthy Communities Institute, Claritas, 2016).
Exhibit 6: PSA Population by Age 2016
Age Population Percentage
Age 0-17 228,574 24.1%
Age 18-24 90,808 9.6%
Age 25-44 254,175 26.8%
Age 45-64 241,792 25.5%
Age 65+ 132,566 14.0%
Source: Healthy Communities Institute, Claritas, 2016.
Gender
The primary service area population consists of 50.7% females and 49.3% males. The percentage of males
and females in the PSA closely mirrors the demographics of Cook County and the State of Illinois (Healthy
Communities Institute, Claritas, 2016). See Exhibit 7.
Exhibit 7: PSA Population by Gender 2016
Gender PSA Cook Illinois
Male 49.3% 49.2% 49.3%
Female 50.7% 50.7% 50.8%
Source: Healthy Communities Institute, Claritas, 2016.
Education and Employment
In 2016, the PSA population 25 and over with less than high school graduation was at 16.9%, which is
higher than both Cook County (15%) and Illinois (12.3%). By gender, 18.2% percent of males age 25 and
over had less than a high school diploma in comparison to 16% of females age 25 and over. There were
31.3% of the population with a high school diploma, 29% with some college or associate’s degree, 14.8%
with a bachelor’s degree, and 8.1% with a master’s degree or higher. Exhibit 8 depicts the educational
attainment for the PSA in comparison to Cook County and Illinois.
10Exhibit 8: PSA Population 25+ by Educational Attainment in Comparison to Cook County and Illinois 2016
Education PSA Cook Illinois
Less than High School Diploma 16.9% 15.0% 12.3%
High School Grad 31.3% 24.4% 27.1%
Some College/Associate Degree 29.0% 25.5% 28.7%
Bachelor’s Degree 14.8% 21.0% 19.7%
Master’s Degree or Higher 8.1% 14.1% 12.2%
Source: Healthy Communities Institute, Claritas, 2016.
The unemployment rate in the PSA is 13.17% which is higher than the Illinois unemployment rate (9.86%)
and the Cook County rate (11.52%). The male unemployment rate (13.86%) is higher when compared to
Illinois (10.20%) and Cook County (11.58%). The female unemployment rate (12.40%) is also higher than
Illinois (9.49%) and Cook County (11.45%).
Household Income
The average annual household income in 2015 for the medical center’s PSA is $73,288, which is lower
than the state’s average household income at $81,390 (Healthy Communities Institute, Claritas, 2016).
The Asian, Native Hawaiian/Pacific Islander and White racial groups have the highest average household
incomes, while the Black and American Indian/Alaskan Natives subgroups have the lowest average
household incomes. Income disparity also exists between the Hispanic and non-Hispanic ethnicity. The
Hispanic population’s average household income for the PSA is $63,614, while the average household
income for non-Hispanics is $75,784. Exhibit 9 represents household income by race and ethnicity in the
medical center’s PSA.
Exhibit 9: PSA Average Household Income by Race and Ethnicity 2016
Source: Healthy Communities Institute, Claritas, 2016.
11Poverty
The federal poverty level (FPL) for Illinois in 2015 is defined as an $11,880 gross income or below for
an individual, $16,020 for a family of two, $20,160 for a family of three and $24,300 for a family of four
(https://www.illinoislegalaid.org/legal-information/federal-poverty-guidelines). In the PSA, nearly 13% of
all families and 10.1% of families with children live below the federal poverty level. These percentages are
higher than the state of Illinois rate of nearly 11% for families and 8.4% for families with children (Healthy
Communities Institute, Claritas, 2016).
Insurance Coverage
Health insurance coverage is an important factor as individuals access appropriate and adequate health
care services. Uninsured or underinsured individuals and families are less likely to have access to health
care resources due to an inability to pay for services (Centers for Disease Control and Prevention, 2015).
In the PSA, 26.30% of the population has Medicaid compared to a state rate of 22.90% and US rate of
16.70%, 13.20% has Medicare compared to the state rate of 13.70% and US rate of 14.50%, and 8.50%
of the population is uninsured compared to the state rate of 7.90% and US rate of 11.40%. (Healthy
Communities Institute, Claritas, 2016.) Exhibit 10 represents insurance coverage for the Christ Medical
Center primary service area.
Exhibit 10: PSA Medicare and Medicaid Coverage and Uninsured by Percentage of Population 2014
Source: Truven Insurance Coverage Estimates, 2016.
SocioNeeds Index
To clearly illustrate the disparity of income and other socioeconomic factors that exist within Christ
Medical Center’s service areas, it is useful to examine how the SocioNeeds index varies across zips codes.
Created by the Healthy Communities Institute, the SocioNeeds Index is a measure of socioeconomic
need that is correlated with poor health outcomes. Indicators for the index are weighted to maximize
the correlation of the index with premature death rates and preventable hospitalization rates. This index
combines multiple socioeconomic indicators into a single composite value. As a single indicator, the index
can serve as a concise way to explain which areas are of highest need. The scores can range from 1 to
100. A score of 100 represents the highest socioeconomic need. Within a service area, the ranking of 1-5
is a comparison of each zip code to all others within the primary service area; a 5 represents zip codes of
highest socioeconomic need in the PSA. The index value for each zip code is compared to all zip codes
within a service area and assigned a relative rank (1-5) using natural breaks classification. Exhibit 11 maps
the SocioNeeds Index for the Christ Medical Center primary service area.
12Exhibit 11: PSA SocioNeeds Index Map 2016
Source: Healthy Communities Institute, 2016.
Christ Medical Center has four zip codes in its primary service area with a ranking of five for the
SocioNeeds Index—all within Chicago—which represent the areas with the highest socioeconomic needs:
West Englewood, Brighton Park, Chicago Lawn, and Auburn Gresham. The index values for these zip
codes are all over 90/100 thus representing some of the highest areas of need in the country. Exhibit 12
displays the index values for the zip codes with the highest SocioNeeds Index values with Christ Medical
Center’s PSA.
Exhibit 12: PSA Zip Codes with Highest SocioNeeds Index
Community Name Zip Code Socio Need Index
Auburn Gresham 60620 95.3
Brighton Park 60632 97.6
Chicago Lawn 60629 96.3
West Englewood 60636 99.2
Source: Healthy Communities Institute, 2016.
Key Roles in the Assessment
System and Medical Center Leadership
In 2014, Advocate Health Care began organizing resources to implement the 2014-2016 CHNA cycle. The
system signed a three-year contract with the Healthy Communities Institute (HCI), now a Xerox Company,
to provide an internet-based data resource for their eleven hospitals during the 2014-2016 CHNA cycle.
This robust platform offered the hospitals 171 health and demographic indicators including thirty-one
(31) hospitalization and emergency department (ED) visit indicators at the service area and zip code
levels. In addition, system leaders collaborated with the Strategic Planning Department to create sets
of demographic, mortality and utilization data for each hospital site. This collaboration with Strategic
Planning continued during the three-year cycle ensuring that each hospital site had detailed inpatient,
outpatient and emergency department data for its site.
13By the end of 2014, a new Department of Community Health was established under Mission and Spiritual
Care, a vice-president named to lead the department, and a plan developed to ensure that each hospital
in the system would have a community health expert to coordinate its community health work. This
new system level department expanded staffing resources at Christ Medical Center by adding a new
coordinator position dedicated to the medical center, and the position of South Region Director for
Christ Medical Center, Trinity and South Suburban Hospitals.
Community Health Council
Christ Medical Center convened a Community Health Council to oversee its comprehensive community
health needs assessment. This Council was chaired by a member of the medical center’s Governing
Council and comprised of representatives from the medical center’s community health team, patient
advocacy, community health relations, and business development departments. Community members on
the council included representation from school districts, youth services, and faith communities as well as
other community organizations. The affiliations and titles of the Christ Medical Center Community Health
Council members are provided below.
• Arab American Family Services, Director
• Auburn Gresham Community Development Corporation, Executive Director
• Auburn Gresham Community Development Corporation/Southwest Smart Communities, Program
Manager and Technologist
• Buschbach Insurance, Business Owner; Advocate Christ Medical Center Governing Council Member
(Community Health Council Co-Chair)
• Chicago Public Schools, Community Engagement Manager
• Chicago Public Schools, Project Manager, Student Health and Wellness Project HOOD (Helping Others
Obtain Destiny), Director of Community Engagement; Advocate Christ Medical Center Community
Health Council Member (Community Health Council Co-Chair)
• Children’s Home and Aid, Director, Youth Services
• Christian Community Health Center, Director, Quality Assurance
• Greater St. John AME Church, Faith Leader
• Hispanic Leadership Council, President
• Lights of Zion Ministries, Faith Leader
• Metropolitan Family Services, Program Supervisor
• Metropolitan Tenants Organization, Coordinator, Outreach Services
• Oak Lawn-Hometown School District 123, Superintendent
• Advocate Children’s Hospital, Coordinator, Community Relations
• Advocate Children’s Hospital, Director, Community & Health Relations
• Advocate Christ Medical Center, Care Manager and Oak Lawn Health Care Rotary
• Advocate Christ Medical Center, Coordinator, Community Health
• Advocate Christ Medical Center, Coordinator, Community Health and Wellness
• Advocate Christ Medical Center, Manager, Inpatient Care
• Advocate Christ Medical Center, Manager, Patient and Guest Relations
• Advocate Christ Medical Center, Ronald McDonald Care Mobile, Nurse Practitioner
• Advocate Christ Medical Center, Vice President, Mission and Spiritual Care
• Advocate Health Care, Director, Community Health, South Region
14Governing Council
The Governing Council at Christ Medical Center is made up of local community leaders and physicians.
Governing Council members support medical center leadership in their pursuit of the medical center’s
goals, represent the community’s interest to the medical center and serve as ambassadors in the
community. A total of 68 percent of the current Governing Council members represent the community,
including representatives from the faith community, while 32 percent of members are medical center
affiliated physicians or Christ Medical Center leaders. A Governing Council member serves as the
Community Health Council’s chair.
Health Impact Collaborative of Cook County
In 2015, Advocate Health Care and its five hospitals principally serving Cook County (including
Advocate Christ Medical Center) contributed financially and with in-kind resources to the formation
and development of the Health Impact Collaborative of Cook County (HICCC), a project involving
26 hospitals, 7 health departments and nearly 100 community-based organizations. The goal of this
initiative is to work collaboratively on a county-wide CHNA and implementation plan once priorities have
been identified. The Illinois Public Health Institute (IPHI) serves as the backbone organization for the
collaborative including coordinating both the data collection and report preparation activities.
Given the size and diversity of Cook County (second largest county in the United States), the collaborative
created three regions—North, Central and South—for purposes of organizing the assessment process.
Advocate Christ Medical Center was appropriately assigned to the South region consisting of both the
south side of Chicago as well as southern suburbs of Chicago. As will be described in more detail in the
accompanying report—Health Impact Collaborative of Cook County, Community Health Needs Assessment,
South Region—a regional leadership team was formed including representatives from the hospitals and
health departments in the region. A regional stakeholder group was also organized including members
of community organizations representing various sectors. From February 2015 through June of 2016,
the collaborative completed an extensive community health assessment process within each of the three
regions using the public health process—MAPP—Mobilizing for Action through Partnerships and Planning.
More details regarding the data collection and prioritization process will be presented later in this report.
Methodology Used for the 2014-2016 Community Health Needs Assessment
The methodology for the CHNA had four components: 1) the MAPP process used by the Health Impact
Collaborative of Cook County (2/2015-6/2016); 2) use of the Healthy Communities Institute platform to
review county, service area and zip code data (3/2014-8/2016); 3) a children’s community profile completed
by Advocate Children’s Hospital, which is co-located on the medical center campus (see Appendix 2 for
detailed profile); and 4) review of other available national and local data (1/2016-8/2016).
Health Impact Collaborative of Cook County
MAPP Process
The Health Impact Collaborative of Cook County (HICCC) conducted a collaborative CHNA between
February 2015 and June 2016. The Illinois Public Health Institute (IPHI) designed and facilitated a
collaborative, community-engaged assessment based on the Mobilizing for Action through Planning
and Partnerships (MAPP) framework. MAPP is a community-driven strategic planning framework that
was developed by the National Association for County and City Health Officials (NACCHO) and the
Centers for Disease Control and Prevention (CDC). Both the Chicago and Cook County Departments
of Public Health use the MAPP framework for community health assessment and planning. The MAPP
framework promotes a system focus, emphasizing the importance of community engagement, partnership
development and the dynamic interplay of factors and forces within the public health system. HICCC
chose this inclusive, community-driven process so that the assessment and identification of priority health
issues would be informed by the direct participation of stakeholders and community residents. The MAPP
framework (Exhibit 13) emphasizes partnerships and collaboration to underscore the critical importance of
shared resources and responsibility to make the vision for a healthy future a reality.
15Exhibit 13: MAPP Framework
The key phases of the MAPP process include:
• Organizing for Success and Developing Partnerships
• Visioning
• Conducting the Four MAPP Assessments
• Identifying Strategic Issues
• Formulating Goals and Strategies
• Taking Action – Planning, Implementing, Evaluating
The four MAPP assessments are:
• Community Health Status Assessment (CHSA)
• Community Themes and Strengths Assessment (CTSA)
• Forces of Change Assessment (FOCA)
• Local Public Health System Assessment (LPHSA)
Source: Health Impact Collaborative of Cook County, Community Health Needs Assessment, South Region, 2016.
The collaborative used the County Health Rankings model to guide the selection of assessment indicators.
IPHI worked with the health departments, hospitals and community stakeholders to identify available
data related to Health Outcomes, Health Behaviors, Clinical Care, Physical Environment, and Social and
Economic Factors. The collaborative decided to add Mental Health as an additional category of data
indicators.
As part of continuing efforts to align and integrate community health assessment across Chicago and
Cook County, HICCC leveraged recent assessment data from local health departments where possible
for this CHNA. Both the Chicago and Cook County Departments of Public Health completed community
health assessments using the MAPP model between 2014 and 2015. As a result, IPHI was able to compile
data from the two health departments’ respective Forces of Change and Local Public Health System
Assessments for discussion with the South Stakeholder Advisory Team, and data from the Community
Health Status Assessments was also incorporated into the data presentation for this CHNA.
The Community Themes and Strengths Assessment included both focus groups and community resident
surveys. The purpose of collecting this community input data was to identify issues of importance to
community residents, gather feedback on quality of life in the community and identify community assets
that can be used to improve communities.
16Community Survey
By leveraging its partners and networks, the collaborative collected approximately 5,200 resident surveys
between October 2015 and January 2016, including 2,288 in the South region. The survey was available on
paper and online and was disseminated in five languages – English, Spanish, Polish, Korean, and Arabic. The
majority of the responses were paper-based (about 75%) and about a quarter were submitted online.
\
The community resident survey was a convenience sample survey, distributed by hospitals and community-
based organizations through targeted outreach to diverse communities in Chicago and Cook County, with a
particular interest in reaching low income communities and diverse racial and ethnic groups to hear their input
into this Community Health Needs Assessment. The community resident survey was intended to complement
existing community health surveys that are conducted by local health departments for their IPLAN community
health assessment processes. IPHI reviewed approximately 12 existing surveys to identify possible questions,
and worked iteratively with hospitals, health departments, and stakeholders from the 3 regions to hone in on the
most important survey questions. IPHI consulted with the UIC Survey Research Laboratory to refine the survey
design. The data from paper surveys was entered into the online SurveyMonkey system so that electronic and
paper survey data could be analyzed together. Survey data analysis was conducted using statistical analysis
software (SAS), and Microsoft Excel was used to create survey data tables and charts.
The majority of survey respondents from the South region identified as heterosexual (91%, n=2146) and African
American/black (57%, n=2146). Twenty-seven percent (27%) of survey respondents identified as white, 2% Asian/
Pacific Islander, and 2% Native American/American Indian. Approximately 25% (n=1651) of survey respondents
in the South region identified as Hispanic/Latino and approximately 10% identified as Middle Eastern (n=1651).
Two-percent of survey respondents from the South region indicated that they were living in a shelter and 1%
indicated that they were homeless (n=2257). The South region had the highest percentage of individuals with
less than a high school education (12%, n=2027) compared to the North and Central regions of Cook County,
and the majority of respondents from the South region (68%, n=1824) reported an annual household income of
less than $40,000.
1
Written surveys were available in English, Spanish, Polish and Korean; all surveys with Arabic speakers were conducted
with the English version of the survey along with interpretation by staff from a community-based organization that works
with Arab-American communities
2
Race and ethnicity categories do not add to 100% because a few paper-based surveys included write-in responses and
because 163 surveys that were conducted with Arab American Family Services included an additional race option of
“Arab.”
17Focus Groups in South Region
IPHI conducted eight focus groups in the South region between October 2015 and March 2016. HICCC
ensured that the focus groups included populations who are typically underrepresented in community
health assessments, including racial and ethno-cultural groups, immigrants, limited English speakers, low-
income communities, families with children, LGBQIA and transgender individuals and service providers,
individuals with disabilities and their family members, individuals with mental health issues, formerly
incarcerated individuals, veterans, seniors, and young adults.
The main goals of the focus groups were:
1. Understand needs, assets and potential resources in the different communities of Chicago and suburban
Cook County; and
2. Start to gather ideas about how hospitals can partner with communities to improve health.
Each of the focus groups were hosted by a hospital or community-based organization and the host
organization recruited participants. IPHI facilitated the focus groups, most of which were implemented in
90-minute sessions with approximately 8 to10 participants. IPHI adjusted the length of some sessions to be
as short as 45 minutes and as long as two hours to accommodate the needs of the participants, and some
groups included as many as 25 participants. A description of the focus group participants from the South
region is presented in Exhibit 14.
Exhibit 14: HICCC Focus Groups Conducted in the South Region 2015-2016
Focus Groups Location and Date
Arab American Family Services
Participants in the focus group at Arab American Family Services
Bridgeview, Illinois (12/4/2015)
were residents in the South region and staff at the organization. Their
clients include Arab American immigrants and families.
Chinese American Service League
Participants in the focus group at the Chinese American Service
Chinatown, Chicago, Illinois
League were residents of the Chinatown neighborhood in Chicago
(1/19/2016)
and staff at the organization. Their clients include multiple immigrant
groups, children, older adults, disabled individuals, and families.
Human Resources Development Institute (HRDI)
Participants were clients in HRDI’s day programs on the South Side of
West Roseland, Chicago, Illinois
Chicago. Individuals in the focus group had experienced mental illness
(12/15/2015)
at some point in the past and some had previous interactions with the
criminal justice system.
National Alliance on Mental Illness (NAMI) South Suburban
Participants included the parents, families, and caregivers of adults Hazel Crest, Illinois (1/21/2016)
with mental illness living in South suburban Cook County.
Park Forest Village Hall
Community residents, health department staff, service providers, and Park Forest, Illinois (11/12/2015)
local government representatives in the South Cook suburbs.
Sexual Assault Nurse Examiners (SANE)
SANE providers serving the South side of Chicago and South suburbs Hazel Crest, Illinois (12/17/2015)
at Advocate South Suburban Hospital.
Stickney Senior Center
Participants were older adults participating in the services provided at Burbank, Illinois (12/3/2015)
a senior center in the South Cook suburbs.
Veterans of Foreign Wars (VFW) Post 311
Participants included veterans, retired military, and former military Richton Park, Illinois (1/28/2016)
living in the South Cook suburbs.
Source: Health Impact Collaborative of Cook County, Community Health Needs Assessment, South Region, 2016.
18There were residents from the South region that participated in focus groups that were conducted in
other regions. A focus group in the Austin community area (in the Central region) that was conducted
with formerly incarcerated individuals and hosted by the National Alliance for the Empowerment of the
Formerly Incarcerated included participants who were residents in the South region. A focus group in
the Lakeview community area (in the North region) that was conducted with LGBQIA and transgender
individuals and hosted by Howard Brown Health Center also included several participants who were
residents in the South region.
More detail on the findings of the MAPP Assessments can be found in the companion document to the
Christ Medical Center CHNA report—Health Impact Collaborative of Cook County, Community Health
Needs Assessment, South Region—that is also posted on the Advocate website and at:
http://healthimpactcc.org/reports2016/
Use of Healthy Communities Institute (HCI) Data Platform
Since early 2014, each hospital in the Advocate system has had access to the Healthy Communities
Institute data platform, customized to the system through providing access to data for the counties,
service areas and zip codes served by the hospitals. This robust platform provided the hospitals with
171 indicators at the county level, including a variety of demographic indicators, and thirty-one (31)
hospitalization and emergency department (ED) visit indicators also at the service area and zip code levels.
Utilizing the Illinois Hospital Association’s COMPdata, HCI was able to summarize, age adjust and average
the hospitalization and ED data for five time periods from 2009-2015. The HCI contract also provided
a wealth of county and zip code data comparisons; cross tabulation of data by age, race, ethnicity and
gender; a Socio Needs Index visualizing vulnerable populations within service areas and counties; a
Healthy People 2020 tracker; and a database of promising and evidence-based interventions. HCI provides
a gauge that illustrates comparison of indicators across counties, service areas and zip codes.
When a high value is good, community value is equal to or higher than the 50th
Green (Good): percentile (median), or, when a low value is good, community value is equal to or
lower than the 50th percentile.
When a high value is good, community value is between the 50th and 25th
Yellow (Fair): percentile, or when a low value is good, the community value is between the
50th and 75th percentiles.
When a high value is good, the community value is less than the 25th percentile, or
Red (Poor):
when a low value is good, the community value is greater than the 75th percentile.
Throughout the CHNA, indicators may be referred to as being in the green, yellow or red zone, in
reference to the above value ratings from HCI.
Review of Other Available National and Local Data
Between January and August of 2016, community health staff collected pertinent data regarding
community health for the Christ Medical Center PSA. A comprehensive list of data sources can be found in
Appendix 1.
19Summary of Results
Participation by the medical center in the Health Impact Collaborative of Cook County (HICCC) resulted
in access to a substantial amount of quantitative and qualitative data that is contained in the HICCC
Community Health Needs Assessment South Region Report, a companion document to this CHNA. The
report served as a foundational document to the assessment process at Christ Medical Center. Important
findings from this collaborative project covering data from southern Cook County include the following:
As a complement to the extensive data collection completed by the HICCC, the community health team
at Christ Medical Center reviewed and analyzed additional health data for the medical center’s primary
service area, medical center utilization data and program data from clinical and community programs.
This resulted in the identification of six community health needs that were brought to the Community
Health Council for discussion and prioritization—asthma, cancer, diabetes, heart disease, hypertension
and violence. A summary of the data presented to the Community Health Council about each of these
health needs follows.
20Asthma
People of all ages are affected by asthma. Asthma often begins in childhood. According to the National
Heart, Lung, and Blood Institute, more than 25 million people in the United States are known to have
asthma, about 7 million of whom are children. According to Illinois Hospital Association COMPdata from
2009–2014, there has been a consistent increase in asthma emergency room visit rates for Christ Medical
Center’s PSA (see Exhibit 15). For 2012-2014, the rate of 55.4 visits/10,000 population 18 years or older was
in the HCI red zone in comparison to Illinois counties. Since 2009, the ER visit rate due to Adult Asthma for
the PSA has increased by nearly 73%.
Exhibit 15: PSA Age-Adjusted ER Rate due to Adult Asthma 2009-2014
Source: Healthy Communities Institute, Illinois Hospital Association, COMPdata, 2015.
Not only is the current rate of ER Visits due to Adult Asthma in the HCI red zone for the PSA, but the level
of ER Visits due to Pediatric Asthma is also in the HCI red zone at 86.8/10,000 population under age 18.
There has also been a 38.21% increase in these visits from 2009 to 2014 (Exhibit 16) during the same time
period. Comparatively, the Cook County rate increased by 17.4%.
Exhibit 16: PSA Age-Adjusted ER Rate due to Pediatric Asthma 2009-2014
Source: Healthy Communities Institute, Illinois Hospital Association, COMPdata, 2015.
21Christ Medical Center’s primary service area has four zip codes that have a higher incidence of ER
utilization for adult asthma in comparison to other zip codes and the overall PSA. The zip codes and
names are identified in Exhibit 17.
Exhibit 17: PSA Zip Codes Most Impacted by Adult Asthma ER Visits 2009–2014
Community Name Zip Code Rate of Adult % of Increase
Asthma ER Visits/
10,000 Aged 18+
2012-2014
Auburn Gresham 60620 168.7 126%
Chicago Lawn 60629 69.0 42%
Morgan Park 60643 89.4 67%
West Englewood 60636 260.3 76%
Source: Healthy Communities Institute, Illinois Hospital Association, COMPdata, 2015.
Cancer
Cancer is the second leading cause of death in the US as well as within the primary service area.
According to the National Cancer Institute, lung, colorectal, breast, pancreatic and prostate cancer lead to
the greatest number of annual deaths (Healthy Communities Institute, 2016). The top five cancer incidence
rates in the PSA (age adjusted), five year average for 2008-2012, are:
1. Lung & Bronchus (rate: 78.8 per 100,000 population)
2. Prostate (rate: 77.6 per 100,000 population)
3. Breast Invasive (rate: 72.8 per 100,000 population)
4. Colorectal (rate: 53.8 per 100,000 population)
5. Urinary (rate: 39.8 per 100,000 population)
Source: Illinois Department of Public Health, Illinois State Cancer Registry; Nielson Demographics 2010, Public Dataset, March 2016.
Exhibit 18 shows the top five cancer incidence rates for the medical center’s PSA in comparison to the
Illinois Incidence rates. In the PSA, lung and bronchus, prostate and colorectal are higher than state rates
during the same time period.
Exhibit 18: Top Five Cancer Incidence Rates per 100,000 of PSA Compared to Illinois Incidence Rates per
100,000 population 2008-2012
Source: Illinois Department of Public Health, Illinois State Cancer Registry; Nielson Demographics, 2010, Public Dataset, March 2016.
22Although cervical cancer was not included in the PSA’s top cancer incidence rates, the cervical cancer
incidence rate for the same time period was higher than the state rate. From 2008-2012, the Illinois
incidence rate was 4.3 per 100,000 population, however for the PSA, the incidence rate was 5.7 per 100,000
population.
Racial and ethnic disparities in cancer mortality rates persist in the South region of Chicago and Cook
County, as shown in Exhibit 19.
Exhibit 19: Cancer Mortality Rates for the South Region of Cook County per 100,000 by Race and Ethnicity
2012
Source: Health Impact Collaborative of Cook County, Community Health Needs Assessment, South Region, 2016; Illinois Department
of Public Health, 2012.
The 5 year average age-adjusted cancer incidence rate per 100,000 population for the State of Illinois from
2008-2012 is 511.2 and for Cook County is 487.3. For Christ Medical Center’s PSA for the same time period,
the incidence rate of 543.8 per 100,000 population is higher than both the state and the Cook County rates.
(Illinois Department of Public Health, Illinois State Cancer Registry, Nielson Demographics, 2010, Public
Dataset as of March 2016.)
Diabetes
According to the Centers for Disease Control (CDC), the rate of new cases of diagnosed diabetes in the
United States has started to decline, however the prevalence of diabetes in communities served by the
medical center remain high (http://www.cdc.gov/chronicdisease/resources/publications/aag/diabetes.htm).
Reviewing hospitalization and ER visit data for the medical center’s PSA identified that utilization of
services for diabetes and diabetes related complications are increasing. The age-adjusted ER rate due to
diabetes continued to increase from 15.9 per 10,000 population in 2009-2011 to 25.6 per 10,000 population
in 2013-2015. The age-adjusted hospitalization rate due to diabetes for the PSA was 25.8 per 10,000
population compared to an Illinois rate of 18.8 per 10,000 population in 2013-2015. This PSA rate also
represents a 61% increase since 2009 (Exhibit 20).
23You can also read