The GULF OF MEXICO at a GLANCE; - NOAA'S STATE OFTHECOAST - Explore C oastal C om US Fish and Wildlife ...
←
→
Page content transcription
If your browser does not render page correctly, please read the page content below
N O A A ' S S T A T E OFTHE C O A S T

The GULF OF MEXICO at a GLANCE;

iS5',v
    -i'.,'^:-S'S>s'ii
                        E x p lo r e C o a s t a l C o m m u n i t i e s , E c o n o m y , a n d E c o s y s t e m s

                                                                                                                       DWH-AR0008582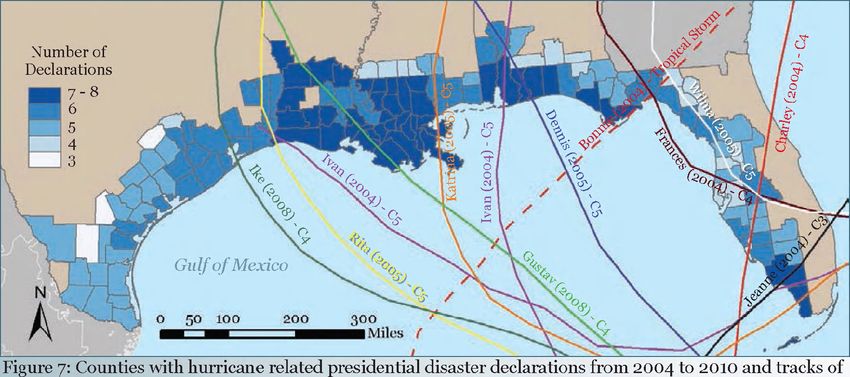
Dear Readers,

                                                                                                  The Gulf of Mexico region provides the Nation with valuable energy resources,
                                                                                                  abundant seafood, extraordinary beaches and leisure activities, and a rich
                                                                                                  cultural heritage. At the sam e tim e, the Gulf of Mexico has endured incredible
                                                                                                  natural and m an-m ade catastrophes in the last decade, including the m ost costly
                                                                                                  natural disaster in U.S. history - H urricane Katrina in 2005 - and the largest
                                                                                                  accidental m arine oil spill in U.S. history - Deepwater Horizon MC252 in 2010.
                                                                                                  All the while, coastal and ocean m anagers in the region continue to address
                                                                                                  complex ecosystem health and w ater quality and quantity challenges.
NOAA’s State of the Coast Web site, and associated products like
this Gulf o f Mexico at Glance: A Second Glance report, exist to help                             Since 2004, the Gulf of Mexico Alliance has worked to increase regional
citizens gain a deeper appreciation of the connections among healthy                              collaboration at state, local, and federal levels, with the goal of im proving the
coastal ecosystems, a robust U.S. economy, a safe population, and a                               ecological and economic health of the Gulf region. NOAA continues as a proud
sustainable quality of life for coastal residents ... and the consequent                          p artn er in this collaborative approach where shared scientific strengths are
need to better understand, manage, and protect our Nation’s coastal
                                                                                                  m atched -with shared m anagem ent strengths.
resources.

Visit: http://stateofthecoast.noaa.gov                                                            One objective of the Gulf of Mexico Alliance is to build public aw areness about
                                                                                                  th e connections between healthy coastal ecosystems, a robust economy, a safe
This document is a publication of the National Oceanic and                                        population, and a sustainable quality of life for coastal residents. To this end,
Atmospheric Administration (NOAA), produced by the National                                       th e G u lf o f Mexico a t a Glance: A Second Glance provides highlights of w hat we
Ocean Service (NOS) Special Projects Dmsion.                                                      know about th e Gulf region’s coastal com munities, coastal economy, and coastal
To further explore socioeconomic attributes presented in this report,                             ecosystems, and how climate change m ight im pact the Gulf coast. W hile this
or to download the relevant coastal socioeconomic data sets, please                               report presents only a small selection of regional attributes w ithin these them es,
visit NOAA’s Spatial Trends in Coastal Socioeconomics, or STICS,                                  we hope to inspire others to increase our collective understanding about these
Web site at: http://stics.noaa.gov.                                                               connections.

Suggested Citation                                                                                Sincerely,
National Ocean Service, NOAA. 2011. The Gulf of Mexico at a
Glance: A Second Glance. Wasliington, DC: U.S. Department of
Commerce.

                                                                                                  TA.w Ul K ennedy
                                                                                                  D avid                            V   T3 .W.U C
                                                                                                                                        Bnck    Sn..Iller                       W illiam W. W alker, Ph.D.
Cover Photo                                                                                       A ssistan t A dm inistrator for       D eputy R egional A dm inistrator       G ulf o f M exico A lliance
Looking south on Bayou Heron, G rand B ay N ational Estuarine Research Reserve in Jackson
County, M S. Credit: Gretchen L. G ram m er                                                       O cean Services and Coastal           Sou theast R egional Office             M anagem ent Team
                                                                                                  Zone M anagem ent                     N ation al M arine F isheries Service   and E xecutive Director
Inside Cover Photo                                                                                N ational O cean Service              NOAA                                    M ississip pi D epartm ent o f
Black Skim m ers on the coast o f Ship Island. Credit: Barbara Am brose, N ational Coastal Data
D evelopm ent Center, NOAA
                                                                                                  NOAA                                                                          M arine R esources

Back Cover Photo
G alveston Bay, TX. Credit: Texas Parks and Wildlife D epartm ent

                                                                                                                                                                                                        DWH-AR0008583
Table of C onten ts

                                                                                     Introduction.

                                                                                     C o m m u n iti e s ........................................................... 3
                                                                                     Population in the Gulf Coast R egion...................... 4
                                                                                     Characteristics of the P opulation............................ 6
The GULF OF MEXICO                                                                   Population in the Special Flood H azard A re a
                                                                                     Housing and D evelopm ent.................................... lo
                                                                                                                                                                     8

                                                                                     W ater U se....................................................................12

    at a GLANCE:                                                                     E c o n o m y ...................................................................13
                                                                                     Coastal Economy....................................................... 14
                                                                                     Federally-Insured A ssets......................................... 17
   A Second Glance                                                                   Oil and Gas P roduction............................................18
                                                                                     W aterborne Commerce............................................20
                                                                                     Commercial F ish in g ................................................ 22
                               June 2011                                             M arine Recreational Fishing..................................24

                            Reprinted February 2012                                  E c o s y s te m s ..............................................................25
                                                                                     Unique H abitats........................................................26
                                                                                     W etlands.................................................................... 28
                                                                                     Protected A reas.........................................................30
 Tliis d ocum ent is a pro d u ct o f the NOAA State o f the C oast R eport Series
                                                                                     Species Diversity.......................................................32
(http://stateofthecoast.noaa.gov), and a publication o f the N ational O ceanic
                                                                                     N onindigenous Aquatic Species............................ 34
and A tm ospheric A dm inistration, D epartm ent o f C om m erce, developed in       Coastal Vulnerability................................................36
partnership w ith the U.S. Environm ental Protection Agency G ulf o f Mexico         N utrient Pollution and Hypoxia............................ 38
Program and U.S. C ensus Bureau, in support o f the G u lf o f Mexico Alliance.      Chemical C ontam inants......................................... 40

                                                                                     A c k n o w le d g e m e n ts .............................................42
                                                                                     E n d N o te s ................................................................ 43
                                                                                     R e f e r e n c e s .............................................................. 44
                                    ^ U n i t e d States
                         ULF
                                   Census <           >B u re a u

                                                                                                                                                           DWH-AR0008584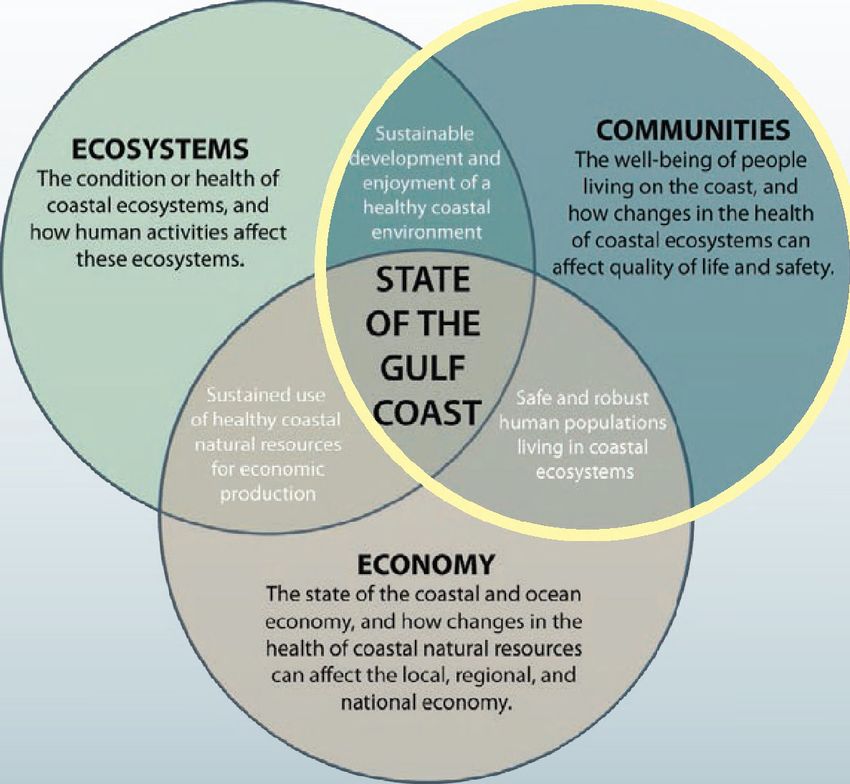
The Gulf of Mexico Alliance is a partnership among the states of Alabama, Florida, Louisiana,
 M ississippi, and Texas, with the goal of significantly increasing regional collaboration to enhance the
 environm ental and economic health of the Gulf of Mexico region. By working together on priority
 regional issues, th e five Gulf states are com m itted to realizing th e benefits of shared m anagem ent
 successes and coordinated environm ental m onitoring and ultim ately striving tow ards a common
 regional vision and strategy for enhancing the Gulf of Mexico region.

                MEXICO

The Gulf of Mexico Alliance actively works to collaborate with the six Mexican Gulf states and is
engaged in a num ber of ongoing activities in Mexico. Both parties acknowledge th at the environm ental
and economic health of th e Gulf of Mexico is contingent upon responsible m anagem ent by both the
U nited States and Mexico

                                    h ttp : / / gulfofm exicoalliance.org/

                                                                                                            DWH-AR0008585
Introduction

The Gulf of Mexico waters                                                                                 As a product of the NOAA State of the Coast Report Series, The
touch the shores of the United                                                                            G ulf o f Mexico a t a Glance: A Second Glance provides highlights of
States, Mexico, and Cuba. The                                                                             w hat we know about the Gulf region’s coastal com munities, coastal
Gulf of Mexico has an area of                                                                             economy, and coastal ecosystems, and how climate change might
approxim ately 5 8 0 ,0 0 0 square                                                                        im pact the Gulf coast (Figure 1). This report is an update to the
miles, contains an approxim ate                                                                           original G ulf o f M exico a t a Glance, published in Ju n e 2008 and
584,000 cubic miles of water, and                                                                         includes an expanded suite of regional attributes. Inform ation in
has an average depth of 5,299                                                                             this report is organized by the following interconnected themes:
feet (Nipper et ah, 2008). The                                                                            Communities, Economy, and Ecosystems.
U.S. portion of the Gulf of Mexico
region extends from the Florida
Keys westw ard to the southern tip
of Texas, following the coastline of
                                                                                                                                                                                                            COMMUNITIES
five states. The com bined coastline                                                                                   ECOSYSTEMS                                                                       T h e w e ll-b e in g o f p e o p le
of these states, Alabama, Florida,                                                                                T h e c o n d itio n o r h e a lth o f                                                 living o n th e co a st, a n d
                                                                                                                    co a stal ec o sy s te m s , a n d                                                 h o w c h a n g e s in th e h e a lth
Louisiana, Mississippi, and Texas                    Ship Island, G ulf Islands N ational Seashore. MS.          h o w h u m a n ac tiv ities affect                                                    of c o a sta I e c o s /s te m s can
                                                     Credit: B arbara Am brose, N ational Coastal D ata
totals over 47,000 miles.^                           D evelopm ent Center, NOAA
                                                                                                                        th e s e e c o sy s te m s                                                  a ffec t q u ality o f life a n d safety
                                                                                                                                                                     STATE
                                                                                                                                                                     OFTHE
The well-being of the Gulf of Mexico region depends on a suite
of benefits th a t flow from healthy coasts: food, clean water, jobs,                                                                                                  GULF
recreation, and protection from hurricanes. But the ability of th e                                                                                                   COAST
Gulf coast to deliver these benefits is being eroded by the extensive
            - —                7         ,         environm ental alterations we
                                                   have m ade to the region’s coastal
                                                                                                                                                                    ECONOMY
                                                   ecosystems. In some cases, these                                                                  T h e s ta te o f t h e c o a sta l a n d o c e a n
                                                   benefits are being fu rth er eroded                                                               e c o n o m y , a n d h o w c h a n g e s in th e
                                                                                                                                                     h e a lth o f co a sta l n a tu ra l re s o u rc e s
                                                   by changes in climate. W hatever                                                                   can a ffec t t h e local, reg io n al, a n d
                                                   th e cause, these changes threaten                                                                            n a tio n a l e c o n o m y .

                                                   to com prom ise the health and
                                                   economic well-being of our coastal
                                                   com m unities and the benefits                           Figure l: The three major report th em es and the signihcance o f their con n ection s.
                                                   th a t the Gulf region brings to the
A charter boat and a line o f shrim p boats docked
                                                   Nation.
a t a ivorking w aterfront in Bayou L a Batre, AL.
Credit: Melissa Schneider

                                                                                                                                T H E G U L F OF M E X I C O AT A G L A N C E : A S e c o n d G l a n c e

                                                                                                                                                                                                                                               DWH-AR0008586
D a t a a n d G e o g r a p h y in t h i s R e p o r t                               D e e p w a t e r H o r i z o n M C 2 5 2 Oil Spi l l a n d t h i s R e p o r t

The statistics, charts, and m aps presented in this report provide a                 The April 20, 2010 explosion on
snapshot of the m ost current, readily available data at the tim e of                the Deepwater Horizon MC252                          ^
publication. All data sources are cited in references available at the               drilling platform killed eleven                      4L
end of the report. Data were acquired directly from several data                     people. The subsequent oil spill
originators and any subsequent m anipulations were thoroughly                        resulted in alm ost 4.9 million                                ^ ■■*5.
verified. Representations of the coastal economy and coastal                         barrels of oil released into the Gulf                        ,
em ploym ent in this report are not necessarily ocean or coastal                     (NOAA, 2010a). During the height                     lA
dependent, b u t rath er econom ic production th at occurs in coastal                of the spill, federal fishery closed                 ti              f' c
areas. Demographic projections presented in this report were                         areas totaled as m uch as 88,522
derived from data generated by Woods and Poole Economics, Inc.                       square miles (NMFS, 2010c) and
The projections are intended to highlight where regional change                      NOAA Natural Resource Damage
m ight occur, and are not intended to be interpreted as actual future                Assessm ent team s docum ented the
                                                                                                                               Credit: NOAA, 2010
conditions.                                                                          presence of oil on m ore than 950         “
                                                                                     miles of shoreline (NOAA, 20iod). As of early November 2010,
The “Gulf Coast Region,” referenced throughout this report as a                      response team s had docum ented 2,263 visibly oiled dead birds;
regional, aggregated geographic reporting unit, is a suite of 141                    2,079 visibly oiled live birds; 18 visibly oiled dead sea turtles; and
NOAA Coastal W atershed Counties chosen by NOAA to represent                         456 visibly oiled live sea turtles (NOAA, 2010c). Additionally,
a relevant geographic area for describing community, economic,                       as of August 6, 2010, approxim ately 1.84 million gallons of total
and ecosystem attributes of the Gulf of Mexico region (Figure 2).                    dispersant had been applied—1.07 million on the surface and
In total, this area contains alm ost 117,000 square miles of land                    771,000 sub-sea (Deepwater Horizon Incident Jo in t Inform ation
area. For m aps and details about the Gulf Coast Region, and for                     Center, 2010).
further inform ation on how NOAA Coastal W atershed Counties are
determ ined, see Appendices A and B.                                                 This report presents inform ation about a wide range of topics and
                                                                                     m ost of the data available for those topics predates the Deepwater
                                                                                     Horizon MC252 oil spill. W here possible and relevant, inform ation
                                                                                     is presented about how different aspects of the oil spill m ay be
                                                                                     connected to various topics in the report. However, this report does
                                                                                     not reflect or attem pt to characterize effects of the oil spill.

                                                C o a s ta l W a te r s h e d
                                                                                     For fu rth er inform ation regarding the oil spill, visit:
                                            f   C o a s ta l C o u n ty
                                                                                     h ttp :/ /www. noaa .gov/deepw aterhorizon /

Figure 2: Coastal w atersheds and corresponding coastal cnnnties that m ake np the
G nlf Coast R egion (see A ppendices A and B for fm th er inform ation).

                                                                                                                                                              DWH-AR0008587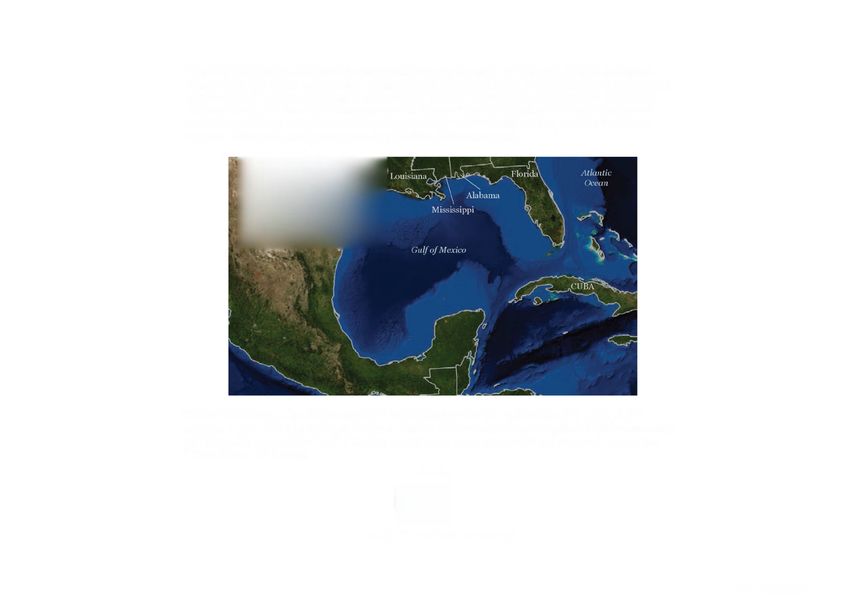
COMMUNITIES
There exists a trem endous variety of com m unities in the Gulf                                                                                                               While the spirit o f
Coast Region, with m any different assemblages of people, cultures,                                                                                                           neighborliness was
occupations, and living and settlem ent patterns. V ibrant com m unities                                                                                                      im portant on the frontier
provide a sense of togetherness, interdependent working relationships,                                                                                                        because neighbors were
and social cooperation and association.                                                                                                                                       so few , it is even more
                                                                                                                                                                              im portant now because
In this section, some of the m ore prom inent factors th at shape and                                                                                                         our neighbors are so
                                                                                                                                                                              m any.
influence the nature, health, and vitality of Gulf coastal com m unities
are exam ined and discussed.                                                                                                                                                  ~Lady Bird Johnson
                                                                           Santa Rosa Sound, FL. Credit: K im Penn, NOAA

Population in the Gulf Coast Region
Examine the characteristics of this fundam ental com ponent of
com munities, including population density and historic and expected
future population change.
                                                                                                                                                                              COMMUNITIES
                                                                                         ECOSYSTEMS                                                                      The w e ll-b e in g o f p e o p le
                                                                                    T h e c o n d itio n o r h e a lth o f                                                living o n th e co a st, a n d
Characteristics of the Population                                                    c o a sta l ec o sy s te m s , a n d                                               h o w c h a n g e s in th e h e a lth
                                                                                   h o w h u m a n activ ities a ffe c t
Learn about the Gulf Coast Region’s unique population, including age                     th e s e e c o sy s te m s .
                                                                                                                                                                         of c o a sta l e c o s y s te m s c a n
                                                                                                                                                                      affec t q u a lity o f life a n d safety
distribution, race, education, and household income.                                                                                    STATE
                                                                                                                                        OFTHE
                                                                                                                                          GULF
Population in the Special Flood Hazard Area
Explore the population residing in th e Gulf coast Special Flood Hazard                                                                  COAST
Area and those subpopulations considered to be at elevated risk to
coastal hazards.
                                                                                                                                      ECONOMY
Housing and Development                                                                                                 T h e s ta te o f th e c o a sta l a n d o c e a n
                                                                                                                        e c o n o m y , a n d h o w c h a n g e s in th e
Discover housing and developm ent characteristics including building                                                    h e a lth o f c o a stal n a tu ra l res o u rc e s
                                                                                                                        ca n a ffe c t th e local, reg io n al, a n d
perm its, housing density, and housing unit change.                                                                                 n a tio n a l e c o n o m y .

Water Use
Examine sources and consum ption patterns of this critical resource.              The three m ajor report th em es and the significance o f their connection s.

                                                                                          T H E G U L F OF M E X I C O AT A G L A N C E : A S e c o n d G l a n c e

                                                                                                                                                                                                            DWH-AR0008588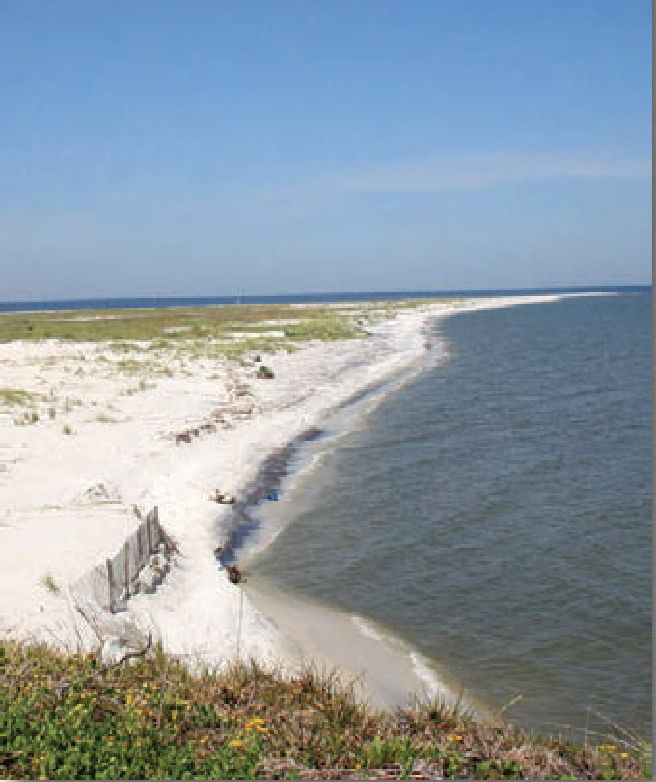
P o p u l a t i o n in t h e G u l f C o a s t R e g i o n Population in the
Gulf Coast Region has
A pproxim ately 37 percen t of th e G ulf states’ p o p u latio n lives increased by 109% since
in th e G ulf Coast R egion (25 p ercen t of th e la n d area). Such a
1970, compared to a 52%
concentratio n of people places p ressu res on sensitive coastal
ecosystem s. As th e reg io n ’s coastal p o p u latio n continues to grow,
increase in total U.S.
it is im perative to u n d erstan d , m anage, an d pro tect th e bo u n ty j)opulation.
an d beau ty th a t have d raw n so m an y to th e coasts. Orange Beach, AL. Credit: Melissa Schneider
2 0 1 0 P o p u la t io n P o p u la t io n C h a n g e from 1 9 7 0 t o 2 0 2 0 Increase m p o pulation in the
U nited States 308,745,538 10 Gulf Coast Region since 1970.
(excluding Territories)
This is roughly equivalent to
Gulf States 56,227,276 ■TX adding a p o pulation th e size of
Gulf Coast Region 20,999,881 Cl. ■FL Los Angeles County, CA, to the
■LA
■ T X ( 3 9 %)
0) J Region.
■ FL (37%) AL
'S3 MS
■ LA (17%) 2;
■ AL (496)
Expected increase of
M S (396)
1970 1980 1990 2000 2010 2020 population in the G ulf Coast
Figure 3: P opulation distribution am ong states in Year Region by 2020. The U.S.
the G nlf Coast R egion. Total G ulf Coast R egion
popnlation com pared to U.S. and G ulf state totals. Figure 4: P opulation change from 1970 to 2 0 2 0 o f the G nlf Coast Region. total population is expected
Source: U.S. Census Bureau, 2 0 iia Source: U.S. Census Bureau, 2 0 iia ; Woods and Poole Economics, Inc., 2010 to increase by 11% in th e sam e
tim e period.
P o p u la t io n D e n s i t y
4 0 0 ---------------------^ ^ ----------------
■ G ulf Coast R egion Portion o f the State Population density of th e
G uh sta te Leading Counties in Population Gulf Coast Region. T he U.S.
Density in th e Gulf Coast Region population density is 104
CD 2.30 (Persons Per Square Mile) persons p e r square m ile
& (excluding A laska an d U.S.
200 Pinellas, FL 3,348
T erritories).
{excLuding ALaskaJ Harris, TX 2,402 Source: U.S. Census Bureau, 2011a; Woods and Poole
Economics, Inc., 2010
Orleans, LA 2,029
Jefferson, LA 1,463
MS Hillsborough, FL 1,205
G ulf Stale
Figure 5: P opulation d en sity o f th e G ulf Coast R egion and G ulf states in 2010. Source: U.S. Census Bureau, 2011a
DWH-AR0008589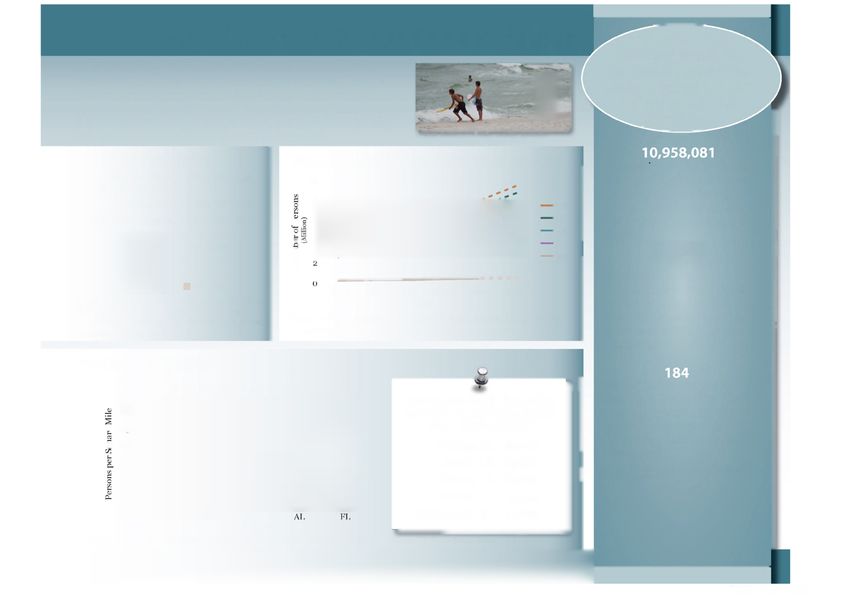
P rojec te d P e r c e n t P o p u la t io n C h a n g e from 2 0 1 0 t o 2 0 2 0
Leading Counties in Projected Percent
Population Change from 2010 to 2020
1. St. Bernard Parish, LA* 79 %
2. W alton, FL 44%
P e rc e n t C h an g e
3. Fort Bend, TX 43%
! 30 - 79 4. Santa Rosa, FL 41%
1 5 -2 9
GulJ o f M exico 5. Wakulla, FL 38%
1 -1 4
*B etw een 2 0 0 0 and 2010, St. Bernard Parish lo st
alm ost half o f its population. By the year 2 0 2 0 ,
-12-0 it is anticipated that the population ivill return to
o 50 lt>0 300
Miles approxim ate year 2 0 0 0 num bers.
Source: U.S. Census Bureau, 2011a; Woods and Poole
Figure 6: Projected percent p op ulation change from 2010 to 2 0 2 0 in the G ulf Coast R egion. Economics, Inc., 2010
Source: U.S. Census Bureau, 2011a; Woods and Poole Economics, Inc., 2010
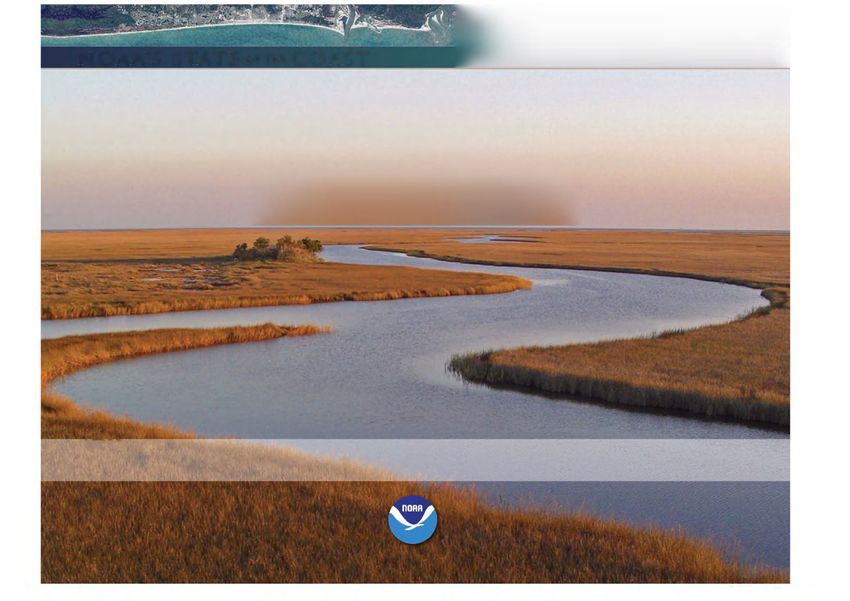
Presidential D isaster D e c la ra tio n s from 2 0 0 4 t o 2 0 1 0
N um ber of Ten Costliest H urricanes
D e c la ra tio n s
from 2004 to 2010
Katrina (2005) $134 billion
Ike (2008) $27 billion
Wilma (2005) $17 billion
Rita (2005) $17 billion
Charley (2004) $17 billion
G u lf o f M exico Ivan (2004) $15 billion
Frances (2004) $10 billion
J e a n n e (2004) $8 billion
Miles f
Gustav (2008) $5 billion
Figure 7: C ounties w ith hurricane related presidential disaster declarations from 2 0 0 4 to 2 0 1 0 and tracks o f
Dennis (2005) $2 billion
the costliest hurricanes w ith in the sam e tim e period. Hurricane Ivan m ade landfall tw ice and Tropical Storm
N o te : E v e n ts p r io r t o 2 0 0 7 a r e n o r m a liz e d t o 2 0 0 7 d o lla r s .
Bonnie struck 22 hours before H urricane Charley, resulting in com bined disaster declarations.
Source: N ational Climate D ata Center, NOAA, 2011
Source: Federal Em ergency M anagem ent Agency, 2 0 iia ; NOAA Coastal Services Center, 2010
T H E G U L F OF M E X I C O AT A G L A N C E : A S e c o n d G l a n c e
DWH-AR0008590
Characteristics of the Population                                                                                                        ^ S even teen percent of the
The G ulf Coast R egion is kn o w n for its un iq u e coastal population,                                                                                              population in the Gulf Coast
one th a t exem plifies diversity an d a strong cultural heritage. The                                                                                                     Region lives below the
people th a t reside in this region help shape a thriving econom y                                                                                                      poverty level (compared to
as well as th e en v iro n m en t to w hich th e ir quality of life is closely                                                                                               13% nationally).
tied.
                                                                                                               Pensacola Beach, FL. Credit: Kim Penn, NOAA

   A ge and Sex                                                                                                                                                        P ercent of th e p o p u latio n in the
                  1096                                                                                                                                                 Gulf Coast Region th a t hold a
                             I Male
                                                                                                                                                                       b ach elo r’s degree (com pared to
                             I Female
                                                                                                                                                                       17% in the to tal U.S.).
                            — U.S. Average

                                                                                                                                                                                          68%
                                                                                                                                                                       P ercent of th e foreign b o rn
                                                                                                                                                                       population in the G ulf Coast
                                                                                                                                                                       Region th a t is from Latin
                                                                             25 -3 4    3 5 -4 4         4 5 -5 4      55-64          65+                              A m erica.
                                                                                 Age Groups
         Figure 8: P opulation b y age group and sex as a percent o f the total p op ulation in the G nlf Coast Region, b a sed on
         data coUected from 2 0 0 5 to 2 0 0 9 . See stics.n oaa.gov for m argin o f error calculations.
         Source: U.S. Census Bureau, A m erican Com m unity Survey, 2010b
                                                                                                                                                                                      $41,203
                                                                                                                                                                       A nnual m ed ian household
                                                                                                                                                                       incom e in th e Gulf Coast
 Race                                                                                                                                                                  Region (w hen averaged across
                                                                            Gulf Coast         Gulf             United
                                                                                                                                                                       counties). This is $2,259 less
                                                                             Region           States            States
                     White (including Hispanic)                                                72%                                                                     th a n the national average.
                                                                               73%                              74%
  Black or African American (including Hispanic)                               17%             17%               12%
              American Indian and Alaska Native
E d u cation
2,r.oo - Gulf Coast Gulf United
I M ale Region States States
I Fem ale
2, 0 0 0 - No School Completed 1% 1% 1%
+/-8,589
Completed 8th Grade 3% 3% 3%
^1,500- +/-8,i34 High School Graduate 30% 29% 29%
I +1-7,964 Completed Some College 21% 21% 20%
OJC
rQ rS. 1,000- Associate’s Degree 7% 7%
7%
B Bachelor’s Degree 15% i6% 17%
2;
500 -
N o Schoo] C o m p le te d
C o m p le te d 8 th G ra d e
I ri
H ig h C o m p le te d A ss o c ia te 's B a c h e lo r’s M a s te r’s
S chool S o m e D e g re e D e g re e D e g re e
P ro fe ss io n a l
S chool
D o c to ra te
D e g ree
Master’s Degree
Professional Degree
Doctorate Degree
5%
2%
1%
6%
2%
1%
Table 2: E ducational atlain m en l o f the pop ulation Lwenly-five
years and old er in th e G nlf Coast R egion com pared to G ulf states
7%
2%
1%
G ra d u a te C ollege D egree
and the U .S., b a sed on data coUected from 2 0 0 5 to 2 0 0 9 . See
F igm e 9: E ducational attainm ent o f the population tw enty-five years and older in the GuK Coast Region, h ased
stics.n oaa.gov for m argin o f error calculations.
on data collected from 2 0 0 5 to 2 0 0 9 . N um bers above the bars rep resent m argin o f error.
Source: U.S. Census Bureau, Am erican C om m unity Survey, 20 io b
Source: U.S. Census Bureau, Am erican C om m unity Survey, 2 0 io h
H ousehold Incom e
2,500 -
Gulf Coast Gulf United
Region States States
2,000
Population Above the 83% 84% 87%
1,500 Poverty Level
O 1 ,0 0 0 Population Below the 17% 16% 13%
+1-5,629
Poverty Level
I
+/-4.505
+/-3,.')32 /-3.146 Table 3: Percent o f population above and b elow the poverty level
in th e G ulf Coast R egion com pared to G ulf states and the U.S.,
Less th a n $ 1 0 ,0 0 0 - $ 2 5 ,0 0 0 - $ 5 0 ,0 0 0 - $ 7 5 ,0 0 0 - $ 1 0 0 ,0 0 0 - $ 1 2 5 ,0 0 0 - $ 1 5 0 ,0 0 0 - $ 2 0 0 ,0 0 0 b a sed o n d ata collected from 2 0 0 5 to 2 0 0 9 . See stics.n oaa.gov for
.$ 10,000 $ 2 4 ,9 9 9 $ 4 9 ,9 9 9 $74,999 $ 9 9 ,9 9 9 $ 1 2 4 ,9 9 9 $ 1 4 9 ,9 9 9 $ 1 9 9 ,9 9 9 o r m o re m argin o f error calculations.
Figure 10: H ousehold incom e in the G ulf Coast R egion, b a sed o n data collected from 2 0 0 5 to 2 0 0 9 . N um bers Source: U.S. Census Bureau, Am erican C om m unity Survey, 2 0 io b
above the bars represent m argin o f error.
Source: U.S. Census Bureau, Am erican C om m unity Survey, 2010b
T H E G U L F OF M E X I C O AT A G L A N C E : A S e c o n d G l a n c e
DWH-AR0008592C O M M U N IT I Es Population in the Special Flood Hazard Area Fourteen percent
of the population within
The G ulf Coast contains low lying areas th a t are p ro n e to
the Gulf coast Special
flooding. A ssessing th e grow ing p o p u latio n w ith in these
areas provides us a b e tte r u n d erstan d in g of who is at risk
Flood Hazard Area is living
to coastal in u n d a tio n from sto rm surge an d lo n g -term sea helow the poverty lev^el.
level rise.
Dauphin Island, AL. Credit: Adrien Lam arre
Land Area in t h e Gulf C o a s t Special Flood Hazard Area
P ercent lan d area of counties
Gulf Coast Special Flood containing FEMA V -Zones th a t
^ ---------------------------------- is w ithin th e Gulf coast Special
Hazard Area as a Percent of
The Special Flood Hazard Area (SFHA) is th e area Area w ithin Gulf Counties Flood H azard Area.
where the National Flood Insurance Program ’s Containing FEMA V-Zones
(NFIP) floodplain m anagem ent regulations m ust Texas 31%
be enforced and where the m andatory purchase Louisiana 84%
of flood insurance applies. Inform ation related Mississippi 35% P ercent of the p o p u latio n of
to the Gulf coast SFHA is reported for counties Alabama 23% counties containing FEMA
containing Federal Emergency M anagem ent Florida 37% V -Zones th a t is w ith in th e Gulf
Agency V-Zones (see Appendix C). Table 4: Land area o f the G ulf coast Special F lood H azard Area coast Special Flood H azard
b}' state, in relation to counties that contain FEM A V -Zones. Area.
Source: U.S. Census Bureau, Am erican C om munity
Survey, 2010b
/
D i d You Know?
You can fu rth e r explore
dem ographic attributes o f the
p op uiatio n in th e Nation's coastai
Speciai Fiood Hazard Areas. Visit:
G ulf Coast Special F lood H azard Area
NCAA's Spatiai Trends in Coastai
Inland Boundary o f C ounties Containing
FEMA V -Zones Socioeconomics, or STiCS, Web site:
stics.noaa.gov
A o 50 100 aoo 300
I M iles
G u lf o f M exico
Coastai C ounty Snapshots:
Figure 11: The G ulf coast Special F lood H azard Area and the inland boundary o f counties containing FEMA V -Zones www.csc.noaa.gov/snapshots/
(see A p pendix C).
DWH-AR0008593C onnections to a Changing C lim ate
E stim ated Total P o p u la t io n Case Study: Possible Sea Level Rise Impacts
Gulf Coast Special Flood H azard
A rea P o p u latio n as P ercent
to Transportation Infrastructure
P o p u latio n in th e
Gulf C oast Special of Population in Gulf Counties
Along the G ulf coast, betw een H ouston, TX, an d M obile,
Flood H azard Area Containing FEMA V-Zones
AL, an estim ated 2 ,400 m iles of m ajo r roadw ay and 246
Texas 1,072,642 18% m iles of freight rail lines are a t risk of p erm a n en t flooding
L ouisiana 1,290,051 49% w ithin 50 to 100 years if relative sea level rises four feet.
M ississippi 129,265 37% The G ulf coast is particularly at risk to sendee disru p tio n s
A labam a 83,881 15% due to th e in terd ep en d en t n a tu re of a tra n sp o rta tio n
netw ork th a t relies on m in o r roads and o th er low-lying
Florida 1,645,514 29%
in frastructure.
Table 5: E stim ated population w ith in the G ulf coast Special F lood H azard Area b}' state com pared to
population in counties containing FEMA V-Zones, b a sed on data collected from 2 0 0 5 to 2 0 0 9 . See
stics.n oaa.gov for m argin o f error calculations.
The G ulf coast is hom e to six of the te n largest com m ercial
Source: U.S. Census Bureau, Am erican C om m unity Survey, 2 0 io b
p o rts (by to n s of traffic) in the country. The region also
h o sts a significant p o rtion of th e U.S. oil and gas industry,
w ith its offshore drilling platform s, refineries, an d
Estim ated S u b p o p u l a t i o n s C o n s id e r e d at E levated Risk pipelines. R oughly tw o-thirds of all U.S. oil im p o rts pass
P o p u latio n 65 P o p u latio n 5 Years P o p u latio n Below th ro u g h the Gulf. Sea level rise could potentially affect
Y ears an d Over an d Y ounger Poverty Level com m ercial tra n sp o rta tio n activity valued in th e h u n d red s
Texas 10% 9% 17% of billions of dollars annually th ro u g h in u n d a tio n of area
L ouisiana 11% roads, railroads, airports, seaports, and pipelines (U.S.
7% 16%
Global Change R esearch Program , 2009).
M ississippi 13% 7% 14%
A labam a 15% 6% 16%
Florida 23% 5% 10%
Table 6: E stim ated su hp opulations considered to b e at elevated risk to flooding w ith in th e G ulf
coast Special F lood Hazard Area, b a sed on data collected from 2 0 0 5 t o 2 0 0 9 . See stics.n oaa.gov for
m argin o f error calculations.
Source: U.S. Census Bureau, Am erican C om m unity Survey, 2010b
D i d You Know? Qihtf rii9hwtty«botow4fMt
Rivan
The a b ility o f w etiands to store floodw aters reduces th e risk o f costly p ro p e rty dam age and Clrvalicn Otherhtghwsyt
loss o f life in flo o d prone areas. Just one acre o f w etland can store 1.5 m illio n gallons o f
eeicpw4ie«i
floodw ater.The presence o f w etiands in o nly 15% o f a w atershed can reduce flo o d in g by as
Figure 12: The G ulf coast area roads at risk from four feet o f long-term
m uch as 6%.
Source: USDA, 20oy relative sea level rise. Source: U.S. Global Change Research Program, 2O0g
T H E G U L F OF M E X I C O AT A G L A N C E : A S e c o n d G l a n c e
DWH-AR0008594Sixteen percent of the
R esidential developm ent accom m odates new resid en ts th a t Nation’s building permits
are draw n to th e Gulf coast. W ell-planned developm ent can were issued in the Gulf Coast
enhance com m unities a n d preserve open space, farm land, an d Region from 2006-2010.
environm en tal areas th a t are critical to a health y coastal region. (single fam ily units only)
Gulfport, MS. Credit: George A rm strong
Building Pernnits Issu ed for C o n s tr u c tio n
P ercent increase in th e n u m b er
of housing u n its in th e Gulf
250- Hurricane Katrina and Rita
made landfall in 2005.
Coast Region from 2 0 0 0 to
200 2010. The n u m b e r of housing
■Texas im its in the U.S. in creased by
B '. 150 • Louisiana
14% in th e sam e tim e fram e.
• M ississip p i
100
OJOt • Alabam a
S3
• Florida
I P ercent of hom es th a t are
seasonal in th e G ulf Coast
1998 2000 2002 2004 2006 2008 2010
R egion (based on d a ta from
Year
Construction o f homes in Jefferson Parish, LA. 2005 to 2009).
Credit: Louisiana Recovery Authority
Figure 13: N um ber o f b u ild in g perm its issu ed for single
fam ily h om es in the G ulf Coast R egion from 1998 to 2010.
Source: U.S. Census Bureau, 2010b
A pproxim ate n u m b e r ot
Leading Counties in building p erm its issued from
Building Permits Issued 2 0 0 6 to 2010 in th e G ulf Coast
for Single Family Homes Region.
N um ber
o f P e m iits
from 2006 to 2010
3 0 ,0 0 1 - 9 4 ,4 7 9
1. Harris, TX
10 .0 0 1 - 3 0 , 0 0 0
Gulf o f M exico
H arris County, Texas, led
3 .0 0 1 - 1 0 ,0 0 0 2. Fort Bend, TX th e N ation in th e n u m b e r of
0 - 3 ,0 0 0
3. Lee, FL building p erm its issued for
A 50 100 4. Hillsborough, FL single fam ily hom es from 2006
to 2010.
Figure 14: N u m ber o f building perm its issu ed for single fam ily hom es in th e G ulf Coast R egion from
5. Hidalgo, TX
Source: U.S. Census Bureau, 2010a, 2011a, 2011b
2 0 0 6 to 2010.
Source: U.S. Census Bureau, 20 io b
DWH-AR0008595Seasonal H om es
Leading Counties in N um ber of Percent of County
Seasonal Housing Seasonal Homes Housing Unit Total
Lee, FL 58,730 17%
F L (7 4 %)
TX (1496) Collier, FL 53,458 28%
LA (796) Pinellas, FL 10%
48,329
AL (496)
Sarasota, FL 32,940 15%
M S (196)
Polk, FL 25,124 9%
Table 7: Leading G nlf Coast R egion cou n ties in th e nu m ber o f season al h om es, b a sed o n data
collected from 2 0 0 5 to 2 0 0 9 .
Figure 15: D istribution o f the over 5 0 0 ,0 0 0 season al hom es in the
Source: U.S. Census Bureau, Am erican C om m unity Survey, 2010b
G nlf Coast R egion, b a sed o n data collected from 2 0 0 5 to 2 0 0 9 .
Source: U.S. Census Bureau, Am erican C om m unity Survey, 2 0 io b
H o u s in g U n i f C h a n g e
C o u n tie s w ith 6 + Number of Housing Units in
D is a s te r D e c la r a tio n s
I 5 0 ,0 0 1 - 3 0 0 ,5 6 2 Counties with Six or More
2 5 ,0 0 1 - 5 0 ,0 0 0
I 1 - 2 5 ,0 0 0
Presidential Disaster Declarations
I -4,999 - o 6 . 5 ---------------------------------------------------------------------------
) -- 5 ,0 0 0
I - 2 5 ,1 9 5 - -1 0 ,0 (
6.4
*3
6.3
0J3 6.2
O .2 6.1
Kg 6 .0
Gulf o f M exico O
u0)
5-9
o 50 100 £00 500 5-8
M ile s f
5 -7 -
2004 2005 2006 2007 2008 2009 2010
Year
Figure 16: H ousing unit change in tlie G ulf Coast R egion from 2 0 0 4 to 2010 and tracks o f the costliest
hurricanes w ithin the sam e tim e period. Hurricane Ivan m ade landfall tvsdce an d Tropical Storm Bonnie struck Figure 17: N m nber o f hou sing u n its in com ities w ith six or m ore
22 hours before Hurricane Charley resulting in com b in ed disaster declarations. presidential disaster declarations from 2 0 0 4 to 2010.
Source: U.S. Census Bureau, 2010a
Source: U.S. Census Bureau, 2010a, 2011a: FEMA, 2010; NOAA CSC, 2010
T H E G U L F OF M E X I C O AT A G L A N C E : A S e c o n d G l a n c e
DWH-AR0008596C O M M U N IT IE S : W a t e r Use
Per capita water use in
Gulf Coast R egion com m unities, farm s, an d in d u stries the Gulf Coast Region
share th e need for fresh w ater w ith rivers an d estuaries, averages 147 gal/person/
w here fresh w ater is necessary to su stain ecologically an d day compared to 172 used
econom ically im p o rta n t fish species an d hab itats. As the nationally.
coastal p o p u latio n an d th e su b seq u en t d em an d fo r clean
freshw ater increases, so does th e risk of lim ited freshw ater.
South Texas Project nuclear pow er p la n t in B ay City, TX,
is cooled by a 7,000 acre reservoir. Credit: U.S. N uclear
R egulatory Commission P ercent of th e total w ater used
in the Gulf Coast R egion th a t is
Water S o u r c e s a n d U s e s Water U se Over T im e freshw ater (com pared to 85%
for th e to tal U.S.)
Sources I Public Supply ( l 096)
■ F resh G roundwater (1396) I D om estic ( l 96)
■ F resh Surface W ater (5596) I Irrigation ( l l 96)
I Saline G roundwater ( l 96) I Livestock (ECONOMY
The Gross Domestic Product (GDP) of the five states of the Gulf The G ulf o f Mexico
Coast Region was alm ost 2.4 trillion dollars in 2009, representing region is a vital
17% of the N ation’s GDP (Bureau of Economic Analysis, 2011). economic engine fo r
the Nation, supplying
The Gulf Coast Region’s economy is highly intertw ined with its
trillions o f dollars
natural resource base, including oil and gas deposits, commercial
annually to the
and recreational fisheries, and waterways for ports and w aterborne
U.S. economy and
commerce. providing jobs fo r
In this section, coastal and ocean-related revenue sectors of th e Gulf millions o f people.
coast economy are explored. -Governors Action
Shrim p boat in the G nlf o f Mexico o ff the coast o f Biloxi, MS.
Credit: Barbara Am brose, N ational Coastal D ata D evelopm ent Center,
Plan II, 2009
Coastal Economy NOAA
Explore key com ponents of th e Gulf Coast Region’s economy,
including employment, and wages.
Federally-Insured Assets
Examine basic statistics about the National Flood Insurance COM MUNITIES
ECOSYSTEMS T h e w e ll-b e in g o f p e o p le
Program in the Gulf Coast Region. T h e c o n d itio n o r h e a lth o f living o n th e c o a st, a n d
c o a sta l ec o sy s te m s , a n d h o w c h a n g e s in t h e h e a lth
h o w h u m a n ac tiv ities affect
Oil and Gas Production th e s e ec o sy s te m s .
o f co a sta l e c o s y s te m s can
'e c t q u a lity o f life a n d safety.
Discover facts about oil and gas production in the Gulf region and STATE
the infrastructure required to support production and distribution. OFTHE
GULF
Waterborne Commerce COAST
Learn about this critical com ponent of the Gulf economy through
data on m ajor ports and th e distribution of commodities shipped
through these ports.
ECONOMY
T h e s ta te o f t h e co a sta l a n d o c e a n
Commercial Fishing e c o n o m y , a n d h o w c h a n g e s in th e
h e a lth o f co a stal n a tu ra l res o u rc e s
Explore the weight and value of commercial fisheries landings by can a ffec t t h e local, reg io n al, a n d
n a tio n a l e c o n o m y ,
port, and state, and th e top species landed.
Marine Recreational Fishing
Discover the im portance of m arine recreational fishing through data The three major report th em es and the significance o f their connection s.
on fishing trips by state and top species caught by pounds.
T H E G U L F OF M E X I C O AT A G L A N C E : A S e c o n d G l a n c e
DWH-AR0008598Coastal Economy
The U.S. Gulf states, if
The G ulf of Mexico region is a vital econom ic engine for th e considered an individual
N ation, supplying trillions of dollars an n u ally to th e U.S. econom y country, would rank 7th
an d providing jo b s for m illions of people. The G ulf su p p o rts in global Gross Domestic
m ajo r m arin e in d u stries such as com m ercial seafood, oil an d Product.
gas production, an d shipping. The Gulf of Mexico is also hom e
to w hite san d beaches, excellent seafood restau ra n ts, an d w arm
w eather, creating recreatio n o p p o rtun ities an d a th ri\in g to u rism
industry. Total n u m b e r of jo b s in the
Unloading shrim p in Cameron, LA.
Credit: Beth Bourgeois, NOAA G ulf Coast Region.
J o b s a n d W a g e s b y Major E c o n o m i c S e c t o r A v e r a g e Annual W a g e s
by State A verage an n u al wage in the
Average G ulf Coast Region in 2 0 0 8 .
Industry EmployTnent Annual Wage
Construction 628,518 $37,545
Education & Health Services 1,608,147 $31,095
$359 billion
Financial Activities 460,964 $38,065 W ages paid out to em ployees
w orking at establishm ents in
Information 133,613 $35,078
th e Gulf Coast Region.
Leisure & Hospitality 871,703 $14,109
Manufacturing 639,661 $45,471
Natural Resources & Mining 232,614 $43,447
Other Services 237,236 $24,353 P ercent of jobs in the G ulf
Professional & Business Services 1,061,878 Coast Region th a t are in
$37,393
th e to u rism and recreatio n
Public Administration 398,210 $37,959 TX LA MS AL industry.^
Trade, Transportation & Utilities 1 ,7 3 3 ,8 9 3 $31,551 State
Source: Bureau o f Economic A nalysis, 2011;
Bureau o f Labor Statistics, 2010; Colgan, 2004
F igm e 20: A verage annual w ages b y state
Table 8: Total nu m ber o f jo b s an d total w ages for major industry sectors in the
in the G ulf Coast R egion in 2 0 0 8 .
G ulf Coast R egion in 2 0 0 8 .
Source: Bureau o f Labor Statistics, 2010
Source: Bureau o f Labor Statistics, 2010
DWH-AR0008599Total E m p l o y m e n t b y C o u n t y
E m p lo y m e n t
5 0 0 .0 0 1 - 2 ,0 5 9 ,0 3 4
0 50 in n
I 1 0 0 .0 0 1 - 5 0 0 ,0 0 0
10 .0 0 1 - 1 0 0 , 0 0 0
5 0 6 - 1 0 ,0 0 0
G u lf o f M exico
I'
Figure 21: Total em p lo jin en t b y cou n ty in th e G ulf Coast R egion in 2 0 0 8 . Construction after H urricanes Katrina and R ita in south Louisiana.
Credit: Louisiana Recovery Authority
Source: Bureau o f Labor Statistics, 2010
E m p l o y m e n t b y S ta te
TX (41%)
F L (3 4 %)
LA (18%)
A L(4% )
MS (3%)
Figure 22: D istribution o f the over 8.3 m illion jo b s in
Port o f Corpus Christi, TX. Credit: Port o f Corpus Christi A uthority Commercial fisherm en unloading red snappers fr o m the Destin
the G ulf Coast R egion b y state in 2 0 0 8 . docks, FL. Credit: June Weeks, NO AA/NM FS - P anam a City
Source: Bureau o f Labor Statistics, 2010 Laboratory
DWH-AR0008600ECONOM Y: Coastal Eco nomy (continued)
Tourism a n d Recreation^ E m p l o y m e n t
Total Wages
Industry Em ployment (M illion)
Eating and Drinking Establishm ents 565,638 $8,477
Hotels and Lodging 60,566 $ 1,435
A m usem ent and Recreation Services 10,258 $191
Boat Dealers 3,784 $138
E m p lo y m e n t Zoos and Aquaria 3,514 $117
5 0 ,0 0 1 - 2 2 8 ,6 5 5
M arinas 2,306 $70
I 1 0 ,0 0 1 - 5 0 ,0 0 0
2,5 0 1 - 1 0 , 0 0 0
0 -2 ,5 0 0
G ulj o f M exico
Scenic W ater Tours
Recreational Vehicle Parks/C am psites
1,136
1,019
$27
$20
A fjO 100 i^oo
Mile»
Sporting Goods 347 $13
Table 9: T ourism and recreation jo b s and total w ages in the G ulf Coast R egion in
2009.
Figure 23: T ourism and recreation em p lo jin en t in th e G ulf Coast R egion in 2 0 0 9 . Source: Bureau o f Labor Statistics, 2010; Colgan, 2004
Source: Bureau o f Labor Statistics, 2010; Colgan, 2004
Total I n c o m e from Farm-Related S o u r c e s
Gulf C o a st R e g io n Facts
7 Total num ber of farms: 108,779
„ Total land area of farm properties:
2 48,641 square miles, or 40% of the total
Gulf Coast Region
M arket value of agricultural products
3
sold: $8,617,228,000
Total income from farm -related sources,
4 gross before taxes and expenses:
8295,363,000
Figure 24: Total incom e from farm -related sources, gross before taxes and exp en ses in 2 0 0 7 .
Source: U.S. D epartm ent o f Agriculture, 2009
DWH-AR0008601C onnections to a
EC O N O M Y : F 6 Cl6 r a M y - l n S U r 6 Cl As s 6 ts ch a n g in g C lim ate Taxpayers are responsible
for $204 billion of in su red
The second largest fiscal liability of th e U.S. G overnm ent,
assets in the G ulf coast Special
b eh in d Social Security, is th e N ational Flood In su ran ce
P rogram (Beatley, et al. 2 0 0 2 ). In su red assets in flood p ro n e Flood H azard A rea (com pared
areas along th e G ulf coast rep resen t alm ost half of th e U.S. w to $521 billion in to tal U.S. m
total. assets insured). «
Galveston, TX. Credit: USGS
Federally-Insured A s s e t s in Gulf C oast S pecial Flood Flazard Area F lorida G ulf coast’s ran k
am ong all U.S. states for total
in su ran ce coverage (m ore th a n
Gulf Coast Special
double th e coverage of any
Flood Hazard Area Percent of U.S. Total
oth er state in th e U.S.).
N um ber of Policies 990,496 41%
Total Prem ium $756,113,124 42% B
L ouisiana’s ra n k am ong all U.S.
Total Coverage $203,912,369,300 39% states for total claim payouts
Total Claim Payouts $19,802,037,380 84% from th e N ational Flood
(1978-2010)
In surance P rogram (m ore th a n
Tabic 10: Characteristics o f federally-insured assets as a percent o f U.S. totals in the GuK coast Special F lood Hazard four tim es th a t of any o th e r
A rea w ith in coim ties containing FEMA V -Z ones in 20 1 0 (see A ppendix C).
state).
Source: Federal Em ergency M anagem ent Agency, 2011b
Total claim s paid out b y the
Insurance C o v e r a g e Claim P a y o u ts N ational Flood In surance
P rogram w ithin th e G ulf coast
Special Flood H azard A rea
FL (6 o 96) LA (6396)
from 1978 to 2010. _
LA (24% ) TX (1496)
TX (1396) FL ( 1196)
AL (296) M S (9%)
Average payout per claim by
MS (196) A L (396)
FEMA after H u rrican e K atrina
(largest average payout for a
Figure 25: Total coverage b y the N ational F lood Insurance Figure 26: Total claim s paid b y the N ational F lood flood event since 1978).
Program in the GuK coast Special F lood H azard A rea in Insurance Program in the GuK coast Special F lood Hazard Source: Federal Em ergency M anagem ent Agency,
2010. Area from 1978 to 2010. 2011b, 2011c
Source: Federal Em ergency M anagem ent Agency, 2 0 iih Source: Federal Em ergency M anagem ent Agency, 2 0 iib
T H E G U L F O F M E X I C O AT A G L A N C E : A S e c o n d G l a n c e
DWH-AR0008602Oi l a n d Gas P r o d u c t i o n
If placed end to end, the oil
The G ulf of Mexico reg io n ’s oil an d gas in d u stry and gas pipelines in the Gulf
is one of th e m ost developed in th e world,
of Mexico could wrap around
supplying th e region w ith jo b s an d the N ation
w ith a valuable energy source.
the Earth’s equator.
Source: BOEMRE, 2011
^
Offshore aquaculture cage near an oil rig in the G u lf o f Mexico. Credit: Tim Reid
P ercent of leased acreage for oil
T h e Gulf Region's C on trib u tion T h e Gulf Region's Energy and gas p ro d u ctio n in th e U.S.
t o U.S. Energy P r o d u c tio n P r o d u c tio n a n d Hurricanes Gulf of Mexico th a t is located
H urricanes and A ssociated C ategories (C) in deep w ater (> 1 ,0 0 0 feet).
Isidore (C3) ClaudeLLe Ivan KaLriiia(C5) Eriii(TS) GusLav(C4) Ida
& Lili(C 4) (Cl) (0,5) & R ita(C 5) & D ean(C 5) & Ike(C 4) (C2) Source: M inerals M anagem ent Service, 2003
Crude Oil Production ) 16
r A Q / of U.S. total based on a three year 1.6
Crude Oil
w
(left axis)
^ • /U average from 2008 to 2010. 14 o' A pproxim ate n u m b e r of U.S.
=* 2:
1.2 Pa b ased G ulf of Mexico active oil
N atural Gas Production
1.0 >Tj
o ^
and gas platform s.
o s 0..8 N atural Gas so Source: BOEMRE, 2011
(right axis) 51e
0 .6
r 'y o / of U.S. total based on a three year
^ average from 2007 to 2009. 0 .4
2
120,676
0 .2
R eported n u m b er of
Crude Oil Refinery Capacity 2002 2003 2004 2005 2006 2007 2008 2009 p etroleum -related w orkers
Year em ployed in th e Gulf Coast
of U.S. total based on a three year Region in 2009.
47% average from 2008 to 2010.
Figure 28: Crude o il and natural gas production in federal
offshore G ulf o f M excio in relation to hurricanes, 2 0 0 2 to 2 0 0 9 .
Source: U.S. Energy Inform ation Adm inistration, 2010b
Source: Bureau o f Labor Statistics, 2010
Figure 27: Energy production and refining capacity o f the
y $15.6 billion
G ulf o f M exico region as percentages o f the total U.S. share. Offshore oil production is susceptible to Total w ages earn ed b y those
The crude oil and natural gas percentages rep resent die extrem e w eather events. H urricane Ivan in w orking in th e oil a n d gas
aggregation o f federal and state offshore production in the 2004 destroyed s e v e n platform s in the Gulf of in d u stry in th e Gulf Coast
G ulf o f M exico and the entire states o f Florida, Alabama,
M ississippi, Louisiana, and Texas. Crude oil refining capacity Mexico, significantly dam aged 24 platform s, Region in 2009.
represents the entire states o f Florida, Alabam a, M ississippi, and dam aged 102 pipelines. H urricanes Katrina Source: Bureau o f Labor Statistics, 2010
Louisiana, and Texas. Data is n ot readily available b e lo w the and Rita in 2005 destroyed m ore than 100
state level.
platform s and dam aged 5 5 8 pipelines.
Source: U.S. E nergy Inform ation Adm inistration, 2011a, 2010a, 2011b
Source: U.S. Global Change Research Program, 2009
DWH-AR0008603S tatu s a n d L ocation o f Oil a n d Gas P ip e lin e s in t h e Gulf o f M e x ic o
)
A ctive (2 6 ,5 9 0 m i.) \
G u lf o f M exico
P r o p o s e d (1 ,0 5 4 m i.) \
200
O u t o f S ervice (17,124 m i.L Fort Fourchon, LA, services approxim ately ninety percent o f all deepw ater
rigs and platform s in the G ulf o f Mexico and is host fo r the Louisiana
Offshore Oil Port (LOOP) Credit: Greater Lafourche Port Commission
Figure 29: Oil and gas pip elin es in th e U.S. portion o f the G ulf o f M exico in 2010.
Source: BOEMRE, 2011
Location o f A ctive Oil a n d Gas Platforms in t h e Gulf o f M e x ic o
■ D e e p w a te r H o riz o n O il R ig
G u lf o f M exico
A ctive O il a n d G as The Louisiana Offshore Oil Port (LOOP) is the only offshore deepw ater
20 0 P la tfo rm s [3,701) p o rt in the U.S. LOOP is connected to over 5 0 percent o f the U.S. refinery
I Miles capacity and has offloaded over 7 billion barrels o f fo reig n crude oil since
its installation (http://loopllc.com ). Credit: Bob Webster
Figure 30: A ctive oil and gas platform s in the U.S. portion o f the G ulf o f M exico in 2010.
Source: BOEMRE, 2011
T H E G U L F OF M E X I C O AT A G L A N C E : A S e c o n d G l a n c e
DWH-AR0008604Waterborne Commerce
The Gulf Coast Region
The U.S. econom y relies h e a \ily on th e p o rts in th e G ulf of contained thirteen of the
Mexico region for th e im p o rt an d export of b o th foreign an d Nation’s 2 0 leading ports for if
dom estic goods. The Gulf of Mexico region su p p o rts m any
tonnage in 2009.
p o rts th a t lead th e N ation in to tal com m erce. S o u r c e ; U.S. A r m y Corps o f
Enninpprs: ODlDn
Port o f Corpus Christi, TX. Credit: Port o f Corpus Christi Authority
L eading Ports in T o n n a g e in 2 0 0 9 V essel Transits Respective state rankings of
Short Tons Louisiana an d Texas in U.S.
U.S. Rank Port (M illions) AI5 V essel Trafric C ounts w aterborne traffic in 2009.
W estsrn Gulf o f Mexico
Source: U.S. A rm y Corps o f Engineers, 2010b
1 South Louisiana, LA 213
2 H ouston, TX 211
5 Corpus Christi, TX 68 P ercent of all U.S. in tern atio n al
6 New Orleans, LA 68 trad e tonnage passing th ro u g h
7 Beaumont, TX 68 Gulf coast p o rts in 2009.
10 Texas City, TX 53 Source: U.S. A rm y Corps o f Engineers, 2010a
11 Lake Charles, LA 52
12 Mobile, AL 52 G u lf o f M exico
Baton Rouge, LA 52 N um ber of m iles th e p o rt of
13
Plaquemines, LA South Louisiana stretches
14 51
16 along th e M ississippi River.
Pascagoula, MS 37 V essel Transits from July, 2 0 0 9 - July, 2 0 to
The p o rt has b een ran k ed first
17 Tampa, FL 35
in the U.S. for to tal to n n ag e for
19 Port A rthur, TX 34 [I m ore th a n a dozen years an d is
27 Freeport, TX Low M edium H igh
27 (o -1 0 unique vessels) (1,180-2,070 (17,880-38,240 the largest tonnage p o rt in the
47 Galveston, TX 10 unique vessels) unique vessels)
W estern H em isphere.
Table 11: In 2 0 0 9 ,1 5 o f top 5 0 U.S. ports, by tonnage, w ere Source: U.S. A rm y Corps o f Engineers, 2010b
located in the G ult Coast R egion. Ports are listed individually and Figure 31: V olum e o t unique vessels reported per day b y the
d o n ot include port com plexes. For the geographic description A utom atic Inform ation System (AIS) in the W estern G ult ot CQ
o t each port, visit: http ://w w w .n d c.iw r.u sace.arm y.m il/w csc/ M exico.
w eb p u b 0 9 /P a rt2 _ P o rts_ to nsbycom m C Y 2009.htm .
M illion cubic yards of m aterial
Source: W ard and Gallagher, 2011
Source: U.S. A rm y Corps o f Engineers, 2 0 io a
dredged by the U.S. A rm y
Corps of Engineers from
D i d You Know? 3 0 ,0 0 0 square m iles of south
The G ulf Intracoastal W aterway extends 1,109 miles, greater than th e distance from W ashington, DC, to M iam i, FL.The central an d coastal L ouisiana
w aterw ay is a dredged canal spanning from Florida to Texas, linking com m erce along all five U.S. G ulf o f Mexico states. in 2009.
Source: USACE, 20iob
I
Source: U.S. A rm y Corps o f Engineers, 2010b
DWH-AR0008605T h e Location o f t h e Gulf C o a st Region's Principal Ports a n d S h i p p i n g R o u t e s
id
I
to/.
'^ee/, '* • ^
A"'
G u lf o f M exibo
A 0 ^o loo 200 300
MikR
Figure 32. Location o f the top 15 G ulf ports b}' tonnage, and principal shipping routes (blue lin es) in 2 0 0 9 . A ship arriving into the Port o f Tam pa, Florida’s largest port. Credit: M ike Henderson,
Source: U.S. A rm y Corps o f Engineers, 2 0 io a NOAA
Primary C o m m o d i t i e s o f t h e L eading Gulf Ports
South Louisiana H ouston, TX Corpus Christi, TX New Orleans, LA Beaumont, TX
Prim ary Commodities Prim ary Commodities Prim ary Commodities Prim ary Commodities Prim ary Commodities
b 9% k 196 a 3%
a 2%
f 296
c
e s 96 d 396
a. Coal b. Crude P etroleum I c. P etroleum Products I d. Fertilizers e. C hem icals f. Sand
g. Iron h. O ther M etals Ii. M etal Products I j. F ood k. M anufactured G oods
Figiu'e 33. Prim ary com m od ity charts o f the lead in g five G ulf ports in total ton n age in 2 0 0 9 .
Source: U.S. A rm y Corps o f Engineers N avigation D ata Center, 2010
T H E G U L F OF M E X I C O AT A G L A N C E : A S e c o n d G l a n c e
DWH-AR0008606C o m m e r c i a l Fishing In 2009,
three of the top six
C om m ercial fishing, w hich h as long su p p o rted th e livelihood commereial fishing ports in the
of m an y regional resid en ts an d provided th e N ation w ith U.S. by pounds landed were in
ab u n d an t seafood, is d ep en d en t on a health y Gulf of Mexico the Gulf Coast Region.
Source: N ational Alarine
ecosystem . This m ulti-billion dollar in d u stry has trad itio n ally Fisheries Service, 20 io d
included fin fish, shrim p, oysters, an d crab.
Pass Christian Harbor shrim p boats.
Credit: Barbara Am brose, NOAA N ational Coastal D ata
D evelopm ent Center. P ercent of to tal U.S. shrim p
landings th a t w ere from the
G ulf of Mexico region from
Q
e/vOft Vjjf 20 0 7 to 2009, a three-year
Ms average of 221 m illion pounds.
Source: N ational M arine Fisheries Service, 2010a
G u lf o f M exico P ercent of to tal U.S. oyster
landings th a t w ere from the
G ulf of Mexico region from
20 0 7 to 2009, a three-year
average of 22 m illion pounds.
Source: N ational M arine Fisheries Service, 2010a
Most Productive Ports by Value Most Produetive Ports by Poundage
U.S. Rank Port Dollars (Vfi'ffio?!; U.S. Rank Port Pounds (M illion)
6 Empire-Venice, LA 68 3 Empire-Venice, LA 363 P ercent of to tal U.S.
11 Brownsville-Port Isabel, TX 47 5 Intracoastal City, LA 266 com m ercial fishery landings
12 Dulac-Chauvin, LA 45 6 Pascagoula-Moss Point, MS 208 fhaf w ere from the G ulf of
15 Intracoastal City, LA 37 7 Cameron, LA 187 Mexico region betw een 2007
16 Galveston, TX 36 26 Dulac-Chauvin, LA 34 an d 2009 (Alaska accounts for
18 Key W^'est, FL 35 30 Brownsville-Port Isabel, TX 24 55% of all landings).
19 Bayou La Batre, AL 35 31 Lafitte-Barataria, LA 23 Source: N ational M arine Fisheries Service, 2010a
20 Port A rthur, TX 35 33 Bayou La Batre, AL 21
29 Palacios, TX 28 36 Golden Meadow-Leeville, LA 19
30 Lafitte-Barataria, LA 27 38 Galveston, TX 18 A verage n u m b e r of p o u n d s of
Table 12: Average annual value o f com m ercial landings from Table 13: Average annual pou nd s o f com m ercial landings com m ercial landings p e r year
2 0 0 7 to 2 0 0 9 in the G ulf Coast R egion’s m o st productive from 2 0 0 7 to 2 0 0 9 in the G ulf Coast R egion’s m o st productive in the Gulf of Mexico region
com m ercial fishing ports. com m ercial fishing ports.
Source: N ational M arine Fisheries Service, 2 0 io d
from 2 0 0 7 to 2009, yielding a
Source: N ational M arine Fisheries Service. 2 0 io d
value of $660 m illion.
Source: N ational M arine Fisheries Service, 2010a
DWH-AR0008607Fishing Closures and t he
D e e p w a t e r Hor i z on
MC 2 5 2 Oil Spill
C o m m e r c ia l Fishing L an d in gs
Oil has the potential to im pact fish
directly through uptake by gills,
Landings by Poundage Landings by Value
ingestion of oil or oiled prey, effects on
eggs and larval survival, or changes in
th e ecosystem th a t support th e fish.
LA (71%) LA (4396) The D eepw ater H orizon MC252 oil
MS (1696) T X ( 2596) spill forced the tem porary closure
T X ( 696) FL (1996) of up to 88,522 square miles or 36
FL (596) A L (796) percent of federal Gulf w aters, and
AL (296) MS (696) m ore in state waters, to fishing. In
2010, the m ajority of state an d federal
w aters had been reopened based on
jo in t efforts of NOAA, th e EPA, the
Figure 34: D istribution o f the 1.4 b illion pou nd s o f Figure 35: D istribution o f the $ 6 6 0 m iUion o f Food and D rug A dm inistration and
com m ercial fishing land in gs b y state. A n average annual com m ercial fishing value b y state. A n average annual th e states in developing a reopening
num ber from 2 0 0 7 to 2 0 0 9 . value from 2 0 0 7 to 2 0 0 9 .
Source: N ational M arine Fisheries Service, 2010a
protocol th a t includes sensory and
Source: N ational M arine Fisheries Service, 2010a
chem ical testing of seafood for
com ponents of the oil (M abus, 2010).
As of April 2011, all federal w aters of
th e Gulf once closed to fishing due to
Top C o m m e r c ia l S p e c i e s th e spill are now open (NOAA, 2011).
Species Landings by Poundage Species Landings by Value u \T w .G e o P liMFOB M-t«[ ft'A ■t •i.iK F s
IL=?1
M
P ounds D ollars
R ank Species___________ (Muuon) R ank Species___________ (MUUon)
1 M enhaden 978 1 W hite Shrim p 176
2 Brovm Shrim p 106 2 Brown Shrim p 152
3 VNdiite Shrim p 104 3 E astern O yster 67
4 Blue Crab 55 4 M enhaden 62
5 E astern O yster 22 5 Blue Crab 43
Table 14: The top five sp ecies land in gs b y poundage in the Table 15: T he top five sp ecies land in gs b y value in the F igm e 36: G eoplatform .gov provided current
G ulf o f M exico, a three-year average from 2 0 0 7 to 2 0 0 9 . G ulf o f M exico, a three-year average from 2 0 0 7 to 2 0 0 9 . inform ation o n fisheries closures in the G ulf o f
M exico that w ere a direct result o f th e D eepw ater
Source: National M arine Fisheries Service, 2 0 i0 a Source: N ational M arine Fisheries Service, 2 0 W a H orizon M C252 o il spill.
T H E G U L F OF M E X I C O AT A G L A N C E : A S e c o n d G l a n c e
DWH-AR0008608ECONOM Y: M a r i n e R e c r e a t i o n a l Fishing
The Gulf of Mexico
From fly fishing in shallow -w afer flafs for red d ru m to fishing accounted for over 44% of
artificial reefs fo r grouper, th e G ulf of Mexico offers a variety
all U.S. marine recreational
of diverse h ab itats an d species for th o se seeking a recreational
fishing adventure. B oth resid en ts an d to u rists alike are draw n
fishing catch in 2009.
to th e G ulf fo r ex trao rd in ary fishing opportunities.
A recreationalfisherm an in Nueces County, TX
Credit: Texas Parks and Wildlife D epartm ent
Recreational Fishing Trips R ecreational Fishing S p e c i e s
P ercent of total U.S. m arin e
recreational fishing trip s taken
in the G ulf of Mexico in 2009.
N um ber of m arine recreational
fishing trip s tak en in th e Gulf
of Mexico during 2009.
2 JS. million
Recreation fish in g trip along the Florida G ulf coast. Father and son catch a red drum along the Florida G ulf coast. N um ber of Gulf Coast Region
Credit: Russell Dunn Credit: Russell Dunn
residents w ho took p a rt in
Fishing Trips by State Top Six Species Caught in 2009 m arin e recreational fishing in
2009.
Pounds
FL (6796) Rank Species (M illion)
LA (17%)
1 Spotted seatrout 145 P ercent of fish th a t w ere
AL (7%)
MS (5%)
2 Red drum 11.9 released out of a to tal catch of
T X (496) 3 Sheepshead 4.4 173 m illion fish in th e G ulf of
4 Red snapper 3-6 Mexico during 2 0 0 9 (harvest
Figure 37: D istribution o f the 2 3 m illion G ulf o f M exico 5 King mackerel 3.3 value does n o t include Texas).
m arine recreational fishing trips h y state in 2 0 0 9 . 6 Black drum 2.9 Source: N ational M arine Fisheries Service, 2010c
Note: M arine recreational fishin g in Texas is m onitored b y
the Texas Parks and W ildhfe D epartm ent and has n o t b een Table l6 : Top six m arine recreational fishing sp ecies in the
surveyed b y the N ational M arine F isheries Service’s survey G ulf o f M exico h y pounds harvested (harv^est nu m bers do not
program since 1985. include Texas).
Source: N ational M arine Fisheries Service, 20 io c Source: N ational M arine Fisheries Service, 2010c
DWH-AR0008609ECOSYS T EMS
The Gulf of Mexico region boasts a wide range of ecosystems with Nutrient Pollution and Hypoxia
unique features and habitats, and Gulf w aters are home to a rich Gain insight about hypoxic “Dead Zones” and other problem s
diversity of species. Its coastal areas contain half of the coastal associated with nutrient pollution.
w etlands in the United States, and are home to vital natural resources,
including nesting waterfowl, colonial w aterbird rookeries, sea turtles, Chemical Contaminants
and fisheries. National, local, and state protected areas have been Explore chemical contam ination in natural environm ents through
established to conserve m any of these unique places. However, these a look at contam inants in oysters, as well as EPA’s N ational Priority
ecosystems have been both under pressure by hum an uses and stressed List of Superfund sites.
by natural processes over time.
In this section, explore unique habitats in the Gulf of Mexico region
and the threats facing those habitats.
Unique Habitats
Explore the Gulf coast’s m any different natural habitats.
COMMUNITIES
ECOSYSTEMS T he w e ii-b e in g o f p e o p le
Wetlands T h e c o n d itio n o r h e a lth o f
c o a sta l e c o sy s te m s , a n d
living o n th e c o a st, a n d
h o w c h a n g e s in th e h e a lth
Discover the current extent of w etlands in the Gulf of Mexico coastal h o w h u m a n ac tiv ities a ffe c t o f co a sta l e c o s y s te m s can
th e s e e c o sy ste m s.
w atershed area and how w etland coverage has changed over time. STATE
,a f f e c t q u a lity o f life a n d safety.
OF THE
Protected Areas
Learn about both land based and m arine protected areas and collective GULF
protection level and conservation focus. kCOAST
Species Diversity
Investigate the rich diversity of species associated with m arine aquatic
ECONOMY
environm ents by types of organism s and by species richness at varying T h e s ta te o f th e c o a sta l a n d o c e a n
depths in the Gulf of Mexico. ec o n o m y , a n d h o w c h a n g e s in th e
h e a lth o f co a stal n a tu ra l re s o u rc e s
can a ffec t th e local, reg io n al, a n d
Nonindigenous Aquatic Species n a tio n a l e c o n o m y .
Explore nonindigenous plants and anim als in the Gulf Coast Region and
some of their im pacts on ecosystems and economies.
The three m ajor report th em es and the significance o f their con n ection s.
Coastal Vulnerability
Gain an appreciation for th e vulnerability of coastal areas to sea level
rise, and current rates of change in local sea level.
T H E G U L F OF M E X I C O AT A G L A N C E : A S e c o n d G l a n c e
DWH-AR0008610Unique Habitats
The G ulf of Mexico is ho m e to Gulf of Mexico:
diverse habitats, som e u n iq u e to th e
N ation an d th e world. T hese h ab itats
Habitat Areas o f
provide a rich m osaic of featu res th a t Particular Concern
su p p o rt n o t only th e large m arin e
ecosystem b u t its sensitive an d
com m ercially im p o rtan t species. Red m angroves fo u n d in Florida.
Credit: U.S. Geological Survey
H ab itats o f Particular C o n cern
FaEkifii 39
H abitat Areas of Particular Concern (HAPC) represent only a
Fli?na^ {iDrdCfi Rmk Q MiteSvil Miinli
subset of particularly im portant areas along the Gulf coast th at FIoti S t T i ^ I ^ llarik ^
are recognized by conservation entities. They are designated R«nl|in l]«nA
to focus conservation priorities on specific areas th a t play a
particularly im portant role in the life cycles of federally m anaged NW Texas-Louisiana Shelf Ban
fish species. HAPC are designated within areas identified as
Essential Fish Habitat"^ an d are based on one or more of the
following considerations:
• the im portance of the ecological function provided by the
habitat;
• the extent to which the habitat is sensitive to hum an-induced V
environm ental degradation;
• w hether and to w hat extent developm ent activities are or will
be stressing th e habitat; and,
• the rarity of th e habitat type (Dale and Santos, 2006).
Legend
S u b s t r a t e a n d H a b ita t T y p e H ard Bottem --------- GPM Bathymetry
Mar$h S an d Land
M angrove Sill [ 1 HAPC B oundaries
O y sters Clay A reas with Fishing R ostrictions
S e a g ra ss | Unknov/n
A giant anem one (Condylactis yigantea) at Turtle Grass in the Florida Keys N ational M arine Figure 38: H abitat Areas o f Partieular C oncern in th e G ulf o f M exico in 2 0 0 6 .
the Flower Garden Banks N ational M arine Sanctuary. Credit: Paige Gill Source: Dole and Santos, 2006
Sanctuary. Credit: NOAA
DWH-AR00086IIYou can also read