Measuring & Managing Park Carrying Capacity - Prepared by: Hyeone Park, UBC Sustainability Scholar 2020 Prepared for: Deanne Manzer, Park Planner ...
←
→
Page content transcription
If your browser does not render page correctly, please read the page content below
Measuring & Managing Park Carrying Capacity
                                        Final report: August 2020

         Prepared by: Hyeone Park, UBC Sustainability Scholar 2020
      Prepared for: Deanne Manzer, Park Planner, Metro Vancouver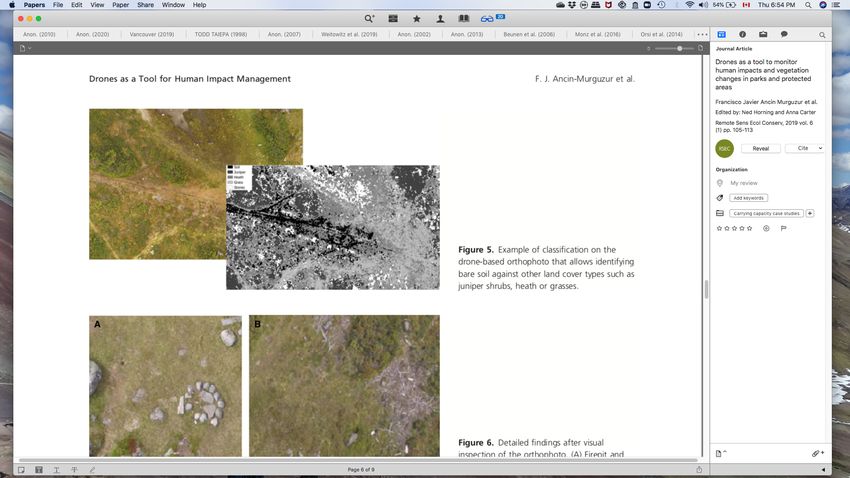
Acknowledgements
I acknowledge the research was primarily conducted in the unceded territories of the Coast
Salish Peoples. I thank all park managers and planners in Canada, the United States, and
Australia who generously took their time during busy, challenging time of COVID-19 and shared
their experience and expertise this research. I also thank my mentor Deanne Manzer, the
research committee members Jamie Vala and Robyn Worcester at Metro Vancouver and UBC
Sustainability Initiative Manager Karen Taylor for their endless support throughout the study.

Executive summary
Metro Vancouver Regional Park’s role is to protect natural areas and connect people to them.
Metro Vancouver protects over 13,600 ha of diverse ecosystems as regional park lands. Over
the last three decades, park visitation has grown at almost twice the rate of the regional
population growth. In 2019 alone, regional parks received over 11.9 million visitors. Park
visitation is expected to continue to increase as the regional population grows and more people
seek opportunities to connect with, enjoy, be active and learn about the environment.

Many regional parks are at or reaching their capacity, with a potential to affect ecological
integrity of parks and the quality of visitor experiences. Metro Vancouver aims to take a holistic
approach to managing park’s capacity and continue to sustainably protect and connect. Metro
Vancouver is not alone in this challenge. Other parts of the country and the world are
increasingly experiencing capacity challenges and have started exploring ways to managing
their capacity.

This report on measuring and managing carrying capacity in parks is informed by a series of
conversations with park managers and planners in the country and beyond as well as scientific
literature over the last four decades. The report is intended to inform visitor use management
planning for Metro Vancouver Regional Parks and support Metro Vancouver in continuing to
sustainably manage park visitors, visitor experiences and natural resources.

Disclaimer
This report was produced as part of the UBC Sustainability Scholars Program, a partnership
between the University of British Columbia and various local governments and organisations in
support of providing graduate students with opportunities to do applied research on projects
that advance sustainability across the region.

This project was conducted under the mentorship of Metro Vancouver staff. The opinions and
recommendations in this report and any errors are those of the author and do not necessarily
reflect the views of Metro Vancouver or the University of British Columbia.

                                                1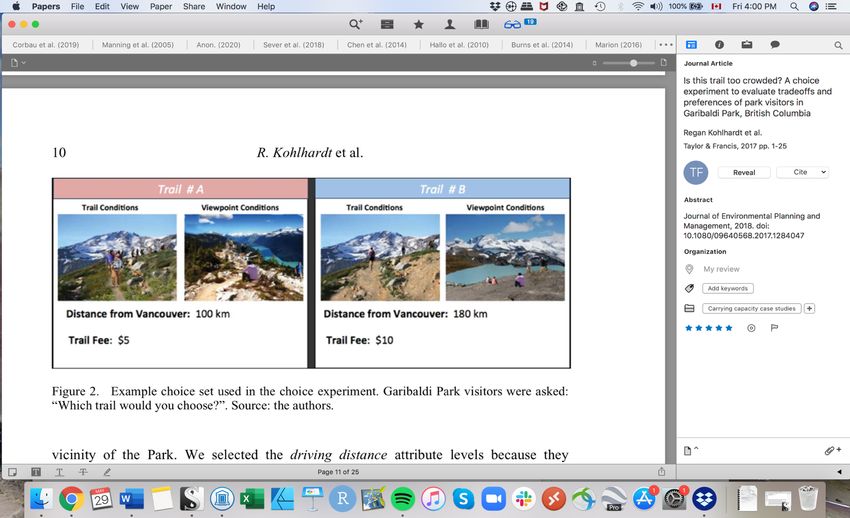
Contents
ACKNOWLEDGEMENTS ........................................................................................................... 1
EXECUTIVE SUMMARY ............................................................................................................ 1
DISCLAIMER ............................................................................................................................ 1
1. PURPOSE AND SCOPE OF THE STUDY .................................................................................. 4
2. OUTLINE OF THE REPORT .................................................................................................... 4
3. INTRODUCTION .................................................................................................................. 4
   3.1 METRO VANCOUVER REGIONAL PARKS .......................................................................................... 4
   3.2 CURRENT CAPACITY ISSUES ........................................................................................................... 4
4. METHODOLOGY .................................................................................................................. 5
5. CONCEPT OF CARRYING CAPACITY ...................................................................................... 6
   5.1 EVOLUTION AND DEFINITION ........................................................................................................ 6
   5.2 MANAGEMENT-BY-OBJECTIVE FRAMEWORK .................................................................................... 6
   5.3 CORE CAPACITY ATTRIBUTES ......................................................................................................... 8
   5.4 CULTURAL CAPACITY ................................................................................................................... 8
6. MEASUREMENT AND TYPES OF CARRYING CAPACITY.......................................................... 9
   6.1 MONITORING INDICATORS AND STANDARDS .................................................................................... 9
   6.2 MEASURING AND ESTABLISHING ENVIRONMENTAL CAPACITY ............................................................. 13
   6.3 MEASURING AND ESTABLISHING SOCIAL CAPACITY ........................................................................... 13
   6.4 MEASURING AND ESTABLISHING MANAGERIAL CAPACITY .................................................................. 14
   6.5 INTEGRATING ENVIRONMENTAL, SOCIAL AND MANAGERIAL CAPACITIES ................................................ 15
7. CASE STUDIES ................................................................................................................... 17
   7.1 VISITOR USE MANAGEMENT PLAN AND VISITOR CAPACITY FOR PETROGLYPH NATIONAL MONUMENT ......... 17
   7.2 VISITOR USE MANAGEMENT PLAN, ZONING AND VISITOR CAPACITY FOR DELAWARE WATER GAP NATIONAL
   RECREATION AREA ......................................................................................................................... 20
   7.3 PARKING AND SHUTTLE RESERVATIONS AT MUIR WOODS NATIONAL MONUMENT................................ 23
   7.4 VISITOR RESERVATION SYSTEM OF CONSERVATION HALTON, ONTARIO ................................................ 25
   7.5 PAY PARKING AND SHUTTLE SERVICE IN WATERTON LAKES NATIONAL PARK ......................................... 26
   7.6 RECOGNITION AND EDUCATION OF BLACKFOOT HISTORY IN WATERTON LAKES NATIONAL PARK ............... 27
   7.7 WATCHMEN PROGRAM INTEGRATING CULTURAL, SOCIAL AND ENVIRONMENTAL CAPACITIES AT GWAII
   HAANAS ...................................................................................................................................... 28
8. KEY FINDINGS ................................................................................................................... 31
9. LITERATURE CITED ............................................................................................................ 33
APPENDIX 1. METHODOLOGIES FOR MEASURING AND ESTABLISHING ENVIRONMENTAL,
SOCIAL AND MANAGERIAL CAPACITIES ................................................................................. 41
   APPENDIX 1.1 MEASURING AND ESTABLISHING ENVIRONMENTAL CAPACITY............................................... 41

                                                                        2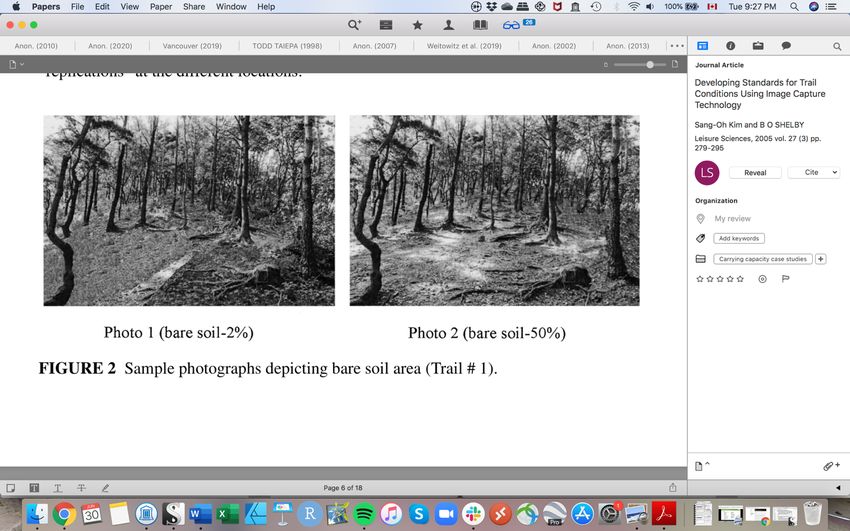
Appendix 1.1.1 Measuring vegetation: Field survey ............................................................. 41
  Appendix 1.1.3 Alternative to field survey: Drones ............................................................... 44
  Appendix 1.1.4 Establishing standards for environmental capacity: field survey and visual
  image method ...................................................................................................................... 45
APPENDIX 1.2 MEASURING AND ESTABLISHING SOCIAL CAPACITY ............................................................. 47
  Appendix 1.2.1 Crowding and maximum visitor number through visual image method ..... 47
  Appendix 1.2.2 Temporal-spatial patterns of park use via GPS-tracking methods .............. 48
APPENDIX 1.3 INTEGRATING ENVIRONMENTAL, SOCIAL, MANAGERIAL AND/OR CULTURAL CAPACITIES ............. 49
  Appendix 1.3.1 Physical carrying capacity, real carrying capacity and effective carrying
  capacity ................................................................................................................................ 49
  Appendix 1.3.2 Discrete choice experiment survey............................................................... 52
  Appendix 2.3.3 Modeling for shuttle services ....................................................................... 53

                                                                    3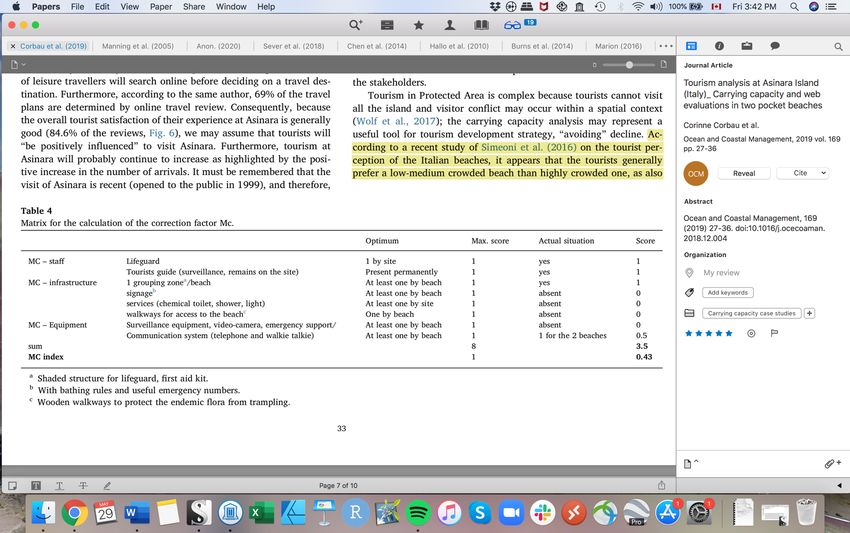
1. Purpose and scope of the study
The purpose of this study is to inform and support visitor use management planning for Metro
Vancouver Regional Parks in order to sustainably manage park visitors, visitor experiences and
natural resources. This study examines methodologies used for defining, measuring and
establishing carrying capacity of parks, and includes a set of case studies highlighting best
practices.

2. Outline of the report
This report summarises key carrying capacity challenges with which the Metro Vancouver
Regional Parks are faced (Section 3); introduces a methodology used for this study (Section 4);
discusses the concept of carrying capacity (Section 5); methodologies used for measuring
carrying capacity (Section 6); presents 11 case studies that showcase best practice for managing
carrying capacity in parks (Section 7); and summarises key findings (Section 8).

3. Introduction
3.1 Metro Vancouver Regional Parks
Metro Vancouver is a partnership of 21 municipalities, one electoral area and one Treaty First
Nation that collaboratively plans for and delivers regional-scale services. Its core services are
drinking water, wastewater treatment and solid waste management. Metro Vancouver also
regulates air quality, plans for urban growth, manages a regional parks system and provides
affordable housing.

Metro Vancouver manages 23 regional parks, 5 greenways, 2 ecological conservancy areas and
2 park reserves, covering over 136 km2 of land. The Regional Parks Plan provides strategic
direction for the management of Metro Vancouver’s Regional Parks through two main goals.
One is to protect important natural areas to contribute to regional liveability and enhance
connections. The other goal is to, within the context of natural area protection, provide
opportunities for people to connect with, enjoy, be active and learn about the environment.
Regional Parks received over 11.9 million visitors in 2019.

3.2 Current capacity issues
Regional Park visitation has grown at almost twice the rate of the regional population over the
last 30 years. A dramatic rise in number of visitors has been seen during the COVID pandemic,
with 600,000 (67%) more visitors in April 2020 than April 2019. Such a spike has amplified
capacity challenges that already existed while highlighting the importance of the regional parks
for the well-being of the Metro Vancouver residents.

Parking capacity, or lack of parking spots, is one of the most prominent capacity challenges. This
challenge causes other problems inside and outside of the parks. With the limited parking stalls
available, visitors who do not find a parking spot within a park try to park on adjacent roads,

                                                 4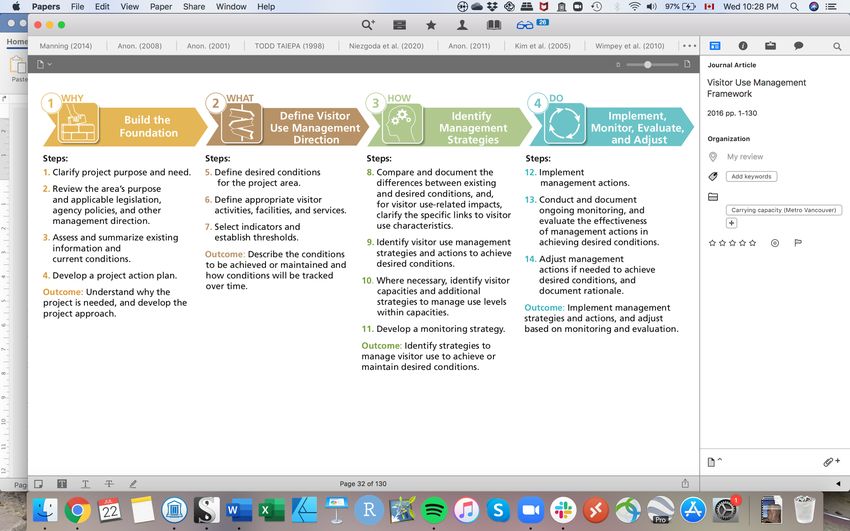
which can lead to traffic congestion, affect neighbourhood parking availability for residents and
reduce accessibility for emergency vehicles. For example, Lynn Headwaters Regional Park is at
parking capacity on many weekends, which leads to overflow onto the park road (e.g. 90 cars
parking on roadside) and adjacent neighbourhood throughout the year. Dedicated traffic
control is used to help manage parks where this issue is at its worst, which can be resource-
intensive.

Apart from the immediate challenges that must be addressed, Metro Vancouver aims to take a
holistic approach to measuring and managing park’s capacity as increases in visitation can
challenge not only parking capacity but also affect visitors’ experience (e.g. crowding) and the
health of ecosystems and wildlife. This study looks at three types of capacity– managerial (e.g.
park facilities and amenities), environmental (e.g. the acceptable limits of change for the
environment) and experiential (e.g. crowding). An outcome of this work is to inform a visitor
use management strategy that will outline visitor use limits and strategies to manage visitation
within those limits.

4. Methodology
This study includes a review of scientific literature and reports that define, measure, or examine
carrying capacity of parks or protected areas. Literature search terms included carrying
capacit*, environmental capacit*, physical capacit*, visitor capacit*, social capacit*, user
capacit*, recreation capacit*, experiential capacit*, parking, dog, and park* or protected area.
The search was limited to a time period between 1980 and 2020. The literature review was
complemented with case studies and with interviews with park managers.

                                                5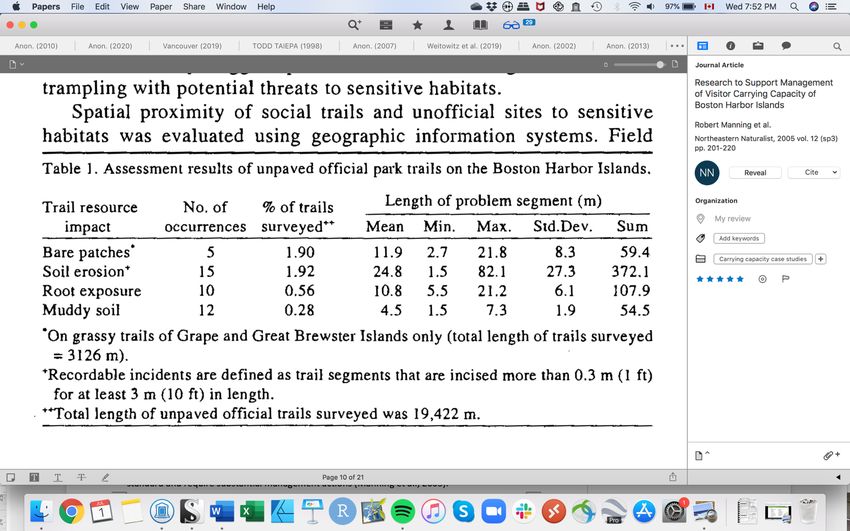
5. Concept of carrying capacity
5.1 Evolution and definition
Carrying capacity (CC) originated in the shipping industry, concerning “the amount of freight a
ship could carry” (Whittaker et al., 2011). The concept of CC was adapted to parks and outdoor
recreation in the mid-1930s due to growing awareness of the limits of environmental resources
and concern of sustainability in recreation (Ly & Nguyen, 2017; Whittaker et al., 2011). Early
work on CC in parks focused on the “limits of acceptable change (LAC)” and attempted to
answer a question of “how much use will be permitted to occur before management
intervenes?” (Frissell, Lee, Stankey, & Zube, 1980).

In park settings, the initial scientific applications of CC focused on the negative impacts of
visitor use on ecosystems (i.e. biophysical or ecological capacity). For example, trampling can
reduce ground cover vegetation, plant growth and reproduction through brushing and
breakage of plants, which can also lead to soil erosion and other negative ecological effects.
Park managers advocate that recreation use should be kept within the carrying capacity of the
ecosystem (Whittaker et al., 2011). This was expanded to include another dimension of carrying
capacity to reflect social values or qualities of visitor experience (i.e. social or experiential
capacity) (Wager 1964). Research started showing that visitor experience and environmental
impacts of visitor use was not always related to the number of visitors but may be strongly
affected by managerial capacity and factors (e.g., designed or built trails, regulation
enforcement, personnel, unauthorized use, inconsistent tourism marketing, etc.) (Whittaker et
al., 2011).

CC is broadly defined as “the amount and type of use that is compatible with the management
prescription for an area” (Whittaker et al., 2011). The management prescription describes
goals, objectives, desired conditions and corresponding indicators and standards of quality. It
also needs to take into account budget and staffing resources. CC can be expressed in a number
on a use-level scale, with components of units of use, timing and location (Whittaker et al.,
2011).

CC is also known as recreation capacity, user capacity and visitor capacity (Graefe et al., 2011;
Whittaker et al., 2011). For example, the Visitor Use Management Framework defines visitor
capacity as “the maximum amounts and types of visitor use that an area can accommodate
while achieving and maintaining desired resource conditions and visitor experiences that are
consistent with the purposes for which the area was established” (IVUMC, 2016).

5.2 Management-by-objective framework
A management-by-objectives framework is a systematic approach to analysing and managing
CC of parks (Manning 2001; Stankey et al. 1985). A good example of the management-by-
objectives framework is the Visitor Use Management Framework (IVUMC, 2016). This
framework was developed by the Interagency Visitor Use Management Council of the United

                                                 6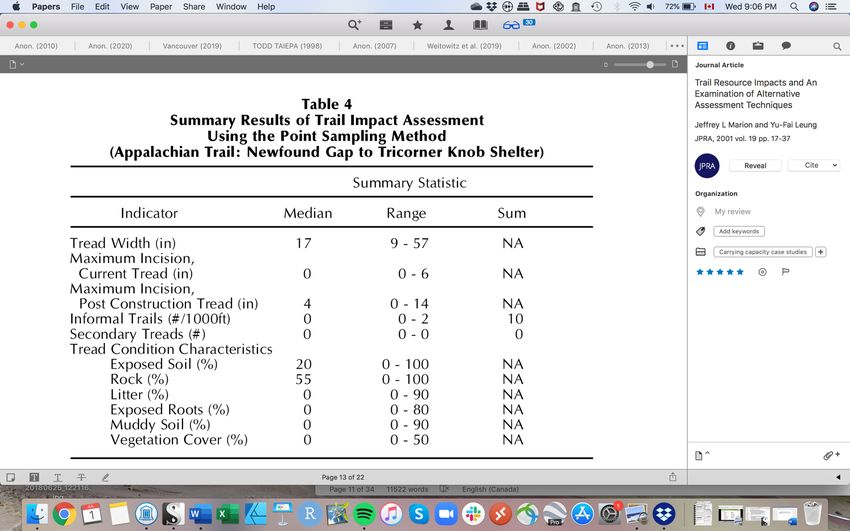
States (IVUMC) to provide cohesive guidance on defining, managing and monitoring visitor
capacity and visitor impacts on federal lands and waters in the country. It is also intended to be
a tool for decision-making on management processes and actions that are legally defensible,
transparent and accountable (Fig. 1).

Recently, Parks Canada has adopted the framework (IVUMC, 2016) as a planning tool for
developing a visitor use management strategy and is in the process of applying the framework
at Fathom Five National Marine Park. BC Parks has applied the framework and developed the
Visitor Use Management Action Plan (2019) for Joffre Lakes Provincial Park, in collaboration
with First Nations and other government administrations. This plan is designed to address
immediate capacity issues in Joffre Lakes Park with a goal of developing a longer-term Visitor
Use Management Strategy next. Recent reports for Saskatchewan Provincial Parks (Absher et
al., 2018) also discuss the application of the framework.

       Figure 1 Elements and steps of visitor use management planning (IVUMC, 2016)

The framework (IVUMC, 2016) provides step-by-step guidelines for determining management
objectives, strategies, associated indicators and standards of quality, and implementation,
monitoring and evaluation. Management objectives state the environmental and experiential
conditions desired and to be maintained in the park. Indicators “translate the broad description
of desired conditions into measurable attributes that can be tracked over time to evaluate
change in conditions” (IVUMC, 2016). Standards or thresholds are “minimally acceptable
conditions associated with each indicator” (IVUMC, 2016). Standards serve as a “stop sign”,
which helps to determine when conditions would become “unacceptable” or “irreversible” and
when management attention is required (IVUMC, 2016).

                                                7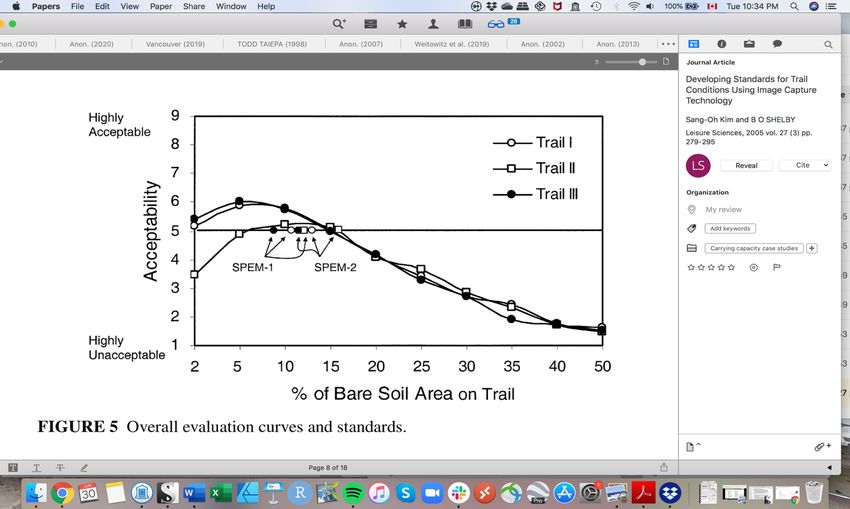
5.3 Core capacity attributes
Three core capacity attributes—environmental, social and managerial capacities—have been
addressed in different CC frameworks (e.g., Recreation Opportunity Spectrum (USFS, 1982);
Visitor Activity Management Process (Environment Canada and Park Service, 1991); Visitor
Experience and Resource Protection Framework (NPS, 1997); Visitor Use Management
Framework (IVUMC, 2016). Each attribute constrains the ability of a park or a site to
accommodate visitor use, and understanding of attributes is critical for establishing carrying
capacity (IVUMC, 2016). Based on the case studies and academic research, each capacity
attribute may be defined as follows:
        ⁃        Environmental (ecological or biophysical) capacity is how resilient the ecosystem
is to the demands placed on it. Associated attributes may include: vegetation, soil, wildlife
behaviour, biodiversity, hydrology, air and water quality, climatic conditions, presence of snow
or mud, naturalness, scenic integrity and/or tranquility (Absher et al., 2018; Fefer et al., 2018;
IVUMC, 2016).

         ⁃      Social (or experiential) capacity is how many people can use the space before the
experience diminishes. Associated attributes include: amount and type of contact between
individuals or groups and between different types of recreation activities (e.g., motorized or
non- motorized use); spatial arrangements of activities; and quality and amount of use (Absher
et al., 2018; IVUMC, 2016; Whittaker et al., 2011).

         ⁃         Managerial capacity is the amount of physical space, staffing and financial
resources available to achieve a park’s vision and goals. Associated attributes include: park
facilities (e.g., trails, parking lots), staffing, and management of visitor behaviour (e.g.,
regulations and enforcement, education) (NPS, 1997; Whittaker et al., 2011).

5.4 Cultural capacity
Cultural capacity work is specific to the place and peoples who have and currently inhabit an
area. Park or area specific definitions of cultural capacity may be developed through place-
based conversations with local Indigenous peoples to make sure their values and knowledge
are reflected in ways they deem appropriate.

   -   Cultural capacity is how are cultural values, resources and practices respected,
       protected and/or supported. Associated attributes include 1) rights, values, interests,
       language and practices of local indigenous community; 2) cultural, spiritual, pre-
       historic, historic or heritage sites; 3) culturally-modified species, landscapes or features;
       or 4) cultural use (IVUMC, 2016; Whittaker et al., 2011).

Existing CC frameworks consider cultural capacity as an element of either social capacity or
combined with environmental resources. Metro Vancouver may consider cultural capacity as
one of social capacity attributes or consider it as one of core capacities along with
environmental, experiential and managerial capacities.

                                                 8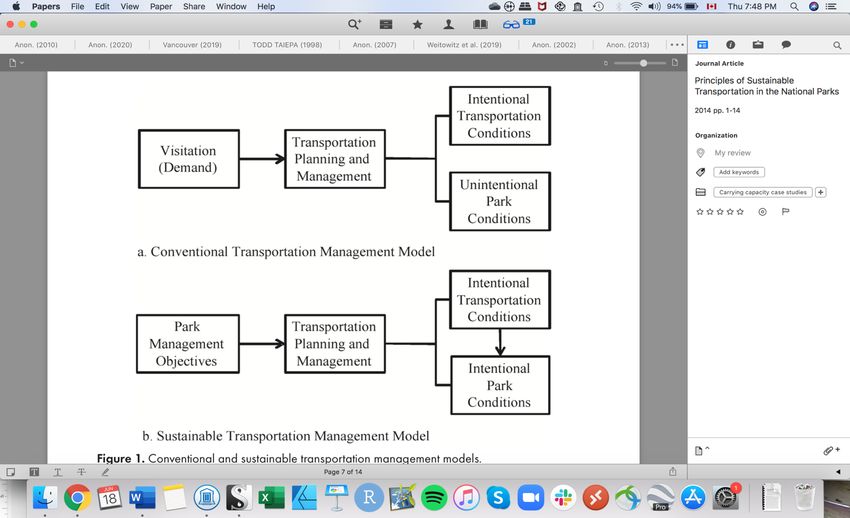
6. Measurement and types of carrying capacity
   6.1 Monitoring indicators and standards
   Monitoring is essential for adaptive management. Monitoring helps to understand the
   environmental effects of visitors. It also helps to detect changes in conditions of interest, to
   determine when to take actions to maintain or improve desired conditions, to evaluate the
   effectiveness of actions and to inform future direction (Reigner et al., 2012). And, in order for
   monitoring to be effective, monitoring indicators and standards should be carefully
   determined.

   The Visitor Use Management Framework (IVUMC, 2016) lays out tips for selecting indicators
   and establishing standards. First, managers review or establish desired condition statements
   and identify key capacity issues by reviewing existing data on the environmental effects of
   visitor use, related scientific research and/or through consultation with stakeholders. Second,
   managers screen and identify the minimum number of indicators. Good indicators are simple,
   feasible, reasonable, connected to visitor use and desired conditions and sensitive to change.
   Third, they determine the appropriate unit of measurement for each indicator. Fourth, park
   managers establish standards once indicators are selected. Standards maybe be informed by
   science, professional experience, legal requirements, management objectives and/or desired
   conditions. Last, park managers evaluate indicators and standards through monitoring to
   ensure that they detect and reflect changes in conditions. Such process underlies adaptive
   management (Manning et al., 2011).

   Table 1 An example of a carrying capacity framework for parks including four core capacities
   and associated attributes, monitoring indicators and standards. A set of appropriate
   attributes, indicators and standards will be selected and adapted to each park.
Attribute        Element (e.g.)    Indicator (e.g.)         Standard (e.g.)                   Reference

Environmental Vegetation           Amount of                Amount of vegetation loss at      IVUMC
                                   vegetation loss          campsite will not exceed 625      (2019)
                                                            ft2 (25 ft x 25 ft); or
                                                            No more than a 2 ft increase
                                                            in trampled vegetation from
                                                            baseline values that were
                                                            identified as acceptable

                 Soil              Proportion of bare       20% of area under study           Manning et
                                   soil area                                                  al. (2005)

                                   Hazard rating for soil   Soil erosion hazard rating will   IVUMC
                                   erosion into a creek     not exceed “Low” in 80            (2016)
                                   at marked sections       percent of the water
                                   along the entire trail   influence zone

                                                      9
Attribute Element (e.g.) Indicator (e.g.) Standard (e.g.) Reference
Wildlife Density of informal No more than 1 informal trail IVUMC
trails in known, from the designated trail per (2019)
sensitive wildlife 1 km
habitat
Population sampling No downward trend for more IVUMC
of spotted trout at than 3 consecutive years (2016)
marked places in a
creek during project
implementation and
following
implementation
Water Level of fecal Provincial fecal coliform IVUMC
coliform per standard for recreational (2019)
sampling period contact
Naturalness Distance to roads or The area is 1 km or less from Clark and
to motorized use roads and trails open Stankey
to motorized use (“roaded (1979)
natural”)
Social Crowding Maximum number 95 persons at selected Manning et
of people-at-one- attraction sites al. (2005)
time at destination
points acceptable
Maximum persons 8 persons on a 50 m section Lawson et
per viewscape along of trail during summer al. (2011)
a trail weekend
Number of groups No more than 6 encounters IVUMC
encountered along a with other groups in the (2019)
trail management zone 80% of
the time
Number of people Fewer than 5 people sanding IVUMC
standing on the bus 80% of the time (2019)
Use conflicts Number of incidents No more than 5 incidents IVUMC
specific specific to use conflicts per (2019)
to use conflicts year
reported or
10Attribute Element (e.g.) Indicator (e.g.) Standard (e.g.) Reference
responded to by law
enforcement
Safety Number of incidents No more than 30 safety IVUMC
reported during the incidents reported during the (2019)
hottest months hottest months on trails
Noise Increase in sound During a 30-day monitoring National
level (i.e., median period, only 3 days can Park
ANS-weighted sound exceed natural daytime Service
pressure level) ambient by 3 dB (2019);
above natural
ambient at locations
during daytime
hours
Visitor Number of Nor more than 20 reasonable National
satisfaction reasonable visitor complaints Park
complaints related Service
to trail experiences (2019)
each year
Percent of visitors 90% of visitors responding to
satisfied with the the annual visitor satisfaction
monument’s survey are satisfied within
facilities, trailheads, the categories of park
trail system, visitor facilities and interpretive
center and programs.
interpretative
programs
Managerial Parking Number of cars in Parking lot is at full capacity IVUMC
the parking lot per less than 80 % of the time (2019)
day
Parking Traffic control Number of staff hours Regional
needed and/or annual cost of Parks
traffic control per park
entrance
11Attribute Element (e.g.) Indicator (e.g.) Standard (e.g.) Reference
Banning of Number of ticketed Taylor and
dogs uncompliant visitors Langeloo
(n.a.)
Trail Number of informal No more than 1 informal trail IVUMC
trails per km of leaving designated trail per 1 (2019)
designated trail km segment
Number of new No additional informal trails National
informal trails annually that exceed over 15 Park
leaving the formal meter in length Service
trail system (2019)
Percent change in No more than 25% increase National
trail depth in trail depth Park
Service
(2019)
Percent change in No more than 25% increase National
trail width in trail width Park
Service
(2019)
Human waste Aggregate number No more than 50 human IVUMC
of improperly waste sites in a zone (2019)
disposed human
waste sites within an
area
Cultural Cultural Number of No more than 1 documented IVUMC
resource (e.g. theft/vandalism incident per year (2019)
site, artifact) incidents
Condition rating for No less than a condition IVUMC
integrity of cultural rating of good (50% integrity) (2019)
resource features
Number of cultural IVUMC
or spiritual sites (2019)
Cultural Loss of use by Absher et
practice indigenous al. (2018)
community
12The following sections 6.2, 6.3, 6.4 and 6.5 summarize methodologies for measuring and
establishing some of environmental, social and managerial capacity attributes included in Table
1. The methodologies are discussed in detail in Appendix 2.
6.2 Measuring and establishing environmental capacity
Vegetation is most commonly measured to examine environmental impacts of visitor use in
parks. Typically, field survey is conducted to measure vegetation cover, plant composition and
tree conditions along formal or informal trails, or at recreational sites. Measurements of
vegetation cover and plant composition are compared to ones of adjacent undistributed
(control) trails or sites in order to determine trampling impacts on vegetation in a park
(Hammitt, 2015). Existing studies have shown vegetation loss on lightly used sites can be nearly
as substantial as that on heavily used sites (Guntenspergen, 2014).
Soil erosion is another environmental impact of visitor use that is commonly measured. Similar
to vegetation, soil erosion on formal or informal trails, or at recreational sites can be measured
(Murguzur et al., 2019). Similar to vegetation loss, low levels of repeated visitor use can cause
erosion (Cole, 2004). In addition to the frequency of use, use type (e.g., horses or motorized
uses) and/or environmental conditions (e.g., steep trail slope, low density vegetation, wet
season) can influence the magnitude of soil erosion (Marion and Leung, 2004).
The natural range of variation (NRV) of ecosystem qualities may inform decisions on standards
for a park or a specific location within a park. NRV assumes that a range of natural variation
exists and that there is a point beyond which an ecosystem will irreversibly shift to a different
state. In recreation settings, one may establish realistic standards of ecosystem qualities even
though the standards are outside NRV. In some cases, desired or current conditions can
substantially differ from NRV and they can be difficult to maintain without significant, direct
management actions (Hammitt, 2015). In addition, visual image methods can be used to
identify visitor values of environmental capacity for a park (Kim and Shelby, 2005).
6.3 Measuring and establishing social capacity
Visitor experience can be influenced by crowding, safety, soundscape, conflict between different
visitor uses, wildlife-human conflict, trail conditions, and quality of view (IVUMC, 2019). Among
these conditions that can influence visitor experience, crowding at viewpoints and trails is found
to have the most significant influence on the quality of visitor experience and visitor satisfaction
(Kohlhardt et al., 2017; Manning et al., 2005). Crowding is commonly measured as the number
of people-at-one-time (PAOT) at a specific destination, the number of persons per view (PPV) on
trails or encounters along trails. A visitor survey with simulated images that represent different
levels of PAOT is often used to determine visitors’ acceptability of crowding in a park or at a
certain location within a park (Manning et al., 2005).
Different standards can be determined for different zones in a park. For a zone emphasizing
solitude, for example, a best standard quality of PAOT may be selected. For a zone in which
13visitor services and park facilities (e.g., parking lots, visitor centre) are located, the (minimum)
acceptable (or even less acceptable) standard quality of PAOT may be selected (Manning et al.,
2005).
Understanding seasonal-spatial patterns of visitors’ activities is critical for effectively identifying
hot spots and managing crowding in parks. Different from PAOT measures, GPS-based tracking is
a method that enables park managers to estimate visitor densities and distribution patterns
across a park (Kim et al., 2018; Meijles et al., 2014). For example, Meijles et al. (2014) found
that visitors tended to stay relatively near to parking lots in a national park in the Netherlands.
The signposted paths also had higher visitor density than unmarked trails, which indicated that
respondents preferred marked trails.
Social capacity can also be measured through collecting visitor satisfaction information. A
conventional method is visitor surveys. Social media (e.g., Dai et al., 2019; Sim and Miller, 2019)
and Tripadvisor (e.g., Corbau et al., 2019; Niezgoda and Nowacki, 2019; Prakash et al., 2019) are
other resources being increasingly used to understand visitation patterns, satisfaction and
dissatisfaction.
6.4 Measuring and establishing managerial capacity
Managerial capacity encompasses budget, space, facilities, staffing, enforcement and other
resources of park management available to achieve park’s vision and goals (NPS, 1997;
Whittaker et al., 2011). One of the most challenging managerial capacity issues with which
Metro Vancouver and other popular parks in Canada are faced was found to be parking
capacity. This capacity issue can lead to traffic congestion and unsafe conditions for visitors to
access a park, affect neighbourhood parking availability for residents, and reduce accessibility
for emergency vehicles.
Some parks expand parking lots or provide alternative means of transportation, such as a
shuttle bus, to address parking shortage and traffic congestion while accommodating visitor
demand (Lawson et al., 2011; Manning et al., 2014). However, shuttle services may lead to
unintentional park conditions (Fig. 2). Shifting a greater proportion of visitors from personal
vehicles to the park’s shuttle bus system might cause a “pulsing effect” on the timing and
number of visitor arrivals at trailheads that causes visitor crowding on trails and at attractions to
be more pronounced. As of now, the effects of “demand-driven” transportation management
on ecological conditions (Monz et al., 2016) and visitor’s experience (Lawson et al., 2011) are
not well known (Fig. 2).
When setting standards for managerial capacity, it is important to consider park management
objectives and environmental and social capacities (See Appendix 2) and following case studies
for detailed methods that consider other managerial attributes and environmental and social
attributes.
14Figure 2 Conventional and sustainable transportation management models (Manning et al.,
2014)
6.5 Integrating environmental, social and managerial capacities
CC of a park can be estimated by incorporating environmental, social and managerial capacities.
One method is the Cifuentes method that was developed to estimate tourism carrying capacity
in protected areas. This method is introduced in international guidelines such as the
International Union for Conservation of Nature (IUCN) guidelines for tourism in protected areas
(Ceballos-Lascuráin, 1996; Eagles et al., 2002) and the World Tourism Organisation guideline for
sustainable tourism for local authorities (WTO, 1998). The method has been applied in tourism
studies of protected areas around the world (e.g., Corbau et al., 2019; Nghi et al., 2007; Sayan
and Ortaçe, 2006).
By using the Cifuentes method, Corbau et al. (2019) estimated carrying capacities for popular
beach destinations in Italy. A range of the area required for tourist and factors (i.e., daily open
period/average time of visit) were considered for different quality of visitor experience or
different seasons rather than using one single value. The authors suggest that setting an upper
and a lower limit of visitor capacity maybe more useful than estimating a fixed single value.
When setting visitor capacity limits, park usage and impacts should be monitored to adjust
limits as necessary.
Another method is choice experiment survey to predict people’s responses to a set of different
potential visitor experiences by asking respondents to make choices among alternative
15scenarios (Lawson and Manning, 2003). Scenarios are formulated with a series of attributes
reflecting diverse hypothetical social, biophysical and managerial conditions within a park under
study. These scenarios can be communicated in visual images with or without text.
By employing a choice experiment survey, Kohlhardt et al. (2017) identified tradeoffs that
people are willing to make for their outdoor experience in Garibaldi Provincial Park. The survey
results reiterated that crowding (at viewpoint and trail) has a larger influence on visitor
satisfaction in Garibaldi Park than other undesirable attributes such as day use fees, eroded trail
conditions, or non-worthy viewpoint destinations. Even natural trails with no erosion and
worthy viewpoint destinations were not by themselves sufficient to compensate visitor’s
dissatisfaction caused by crowding. The study also found different groups of visitors have
different preferences for the park conditions (See appendix 2.3.2 for more details on this study.)
Case studies in the Section 7 also discuss how parks approaches to establishing CC for their
visitor use management plan.
167. Case Studies
7.1 Visitor use management plan and visitor capacity for Petroglyph National Monument
Organization and area: Petroglyph National Monument (monument) is jointly managed by the
National Park Service of the United States (NPS) and the City of Albuquerque. The monument
covers an area of 29.17 km2 in New Mexico’s West Mesa, featuring more than 20,000
petroglyphs etched by native peoples and early Spanish settlers, a 27-km basalt escarpment
and more than 350 archeological sites and ethnographic resources (e.g. cultural landscape,
object, etc.). Such features are of spiritual and cultural significance to many pueblo
communities and tribes of the Southwest United States.
Capacity issues: The monument has seen a significant increase in the number and extent of
informal trails created by visitors. These informal trails have contributed to trail widening,
vandalism, graffiti, soil erosion, native vegetation loss, invasive species, and damage to
petroglyphs and archeological sites. There has been a concern that access of the tribes and
traditional use are impacted by current use patterns. In addition, the quality of visitor
experiences is affected by crowding in popular areas and conflict among different types of use.
Actions taken: NPS developed the Visitor Use Management Plan (NPS, 2019) that formalizes a
sustainable trail system to manage public access and use on trails, in collaboration with the city
and through consultations with tribal representatives and the public. The entire planning
process for the plan (https://parkplanning.nps.gov/PlanProcess.cfm?projectID=66887) was
guided by the Visitor Use Management Framework (IVUMC, 2016). The planning process
started in 2016 and was completed (Step 11) in 2019 (See below). As of July 2020, the
monument is one of the few national parks in the United States that have applied the
framework for developing their visitor use management planning and completed the planning
process.
The Visitor Use Management planning process of Petroglyph National Monument
Step 1. Define purpose and need/develop preliminary alternatives
Step 2. Conduct external scoping
Step 3. Review scoping comments
Step 4. Refine alternatives
Step 5. Identify environmental impacts and select preferred alternative
Step 6. Prepare plan/environmental document
Step 7. Public review of plan/environmental document and open house meetings
Step 8. Analyze public comments
Step 9. Prepare draft decision document
Step 10. Provide draft decision document to the NPS Intermountain Regional Director for
final decision
Step 11. Release decision document to the public
Step 12. Implement decision with site-specific analysis and consultation, as needed
17In Step 1, NPS developed three management action alternatives—one no-action alternative and
two action alternatives—, which were reviewed through public scoping. Each alternative
describes their own management strategies for visitor use, public access points, existing trail
system, designated trails, administrative roads, unauthorized visitor-created and former roads,
utility access corridors, visitor educational and interpretive opportunity, accessibility,
partnerships, and volunteer efforts. In addition, key environmental, social and cultural impact
issues were identified internally by NPS, other agencies, and tribal governments as well as
through public scoping. After the public scoping, NPS refined the alternatives and analyzed key
potential individual impacts and cumulative impacts associated with each alternative. Then, the
most preferable alternative was chosen by NPS.
The interdisciplinary planning team developed six indicators (e.g., change in trail width or trail
depth) related to the impact issues (e.g., trail conditions) that would help identify when
management action is needed. Then, the team established thresholds (e.g., no more than 25%
increase in trail width or trail depth) for each indicator by considering the goals and objectives,
existing conditions, relevant research studies, staff management experiences and public
preferences. Their plan discusses a rationale for their indicators and thresholds as well as
monitoring plan, management strategies, and mitigation measures (e.g., establishing trail
borders with rocks, logs, post and cable, or fencing to narrow width) to be implemented.
Guided by the framework (IVUMC, 2016), literature and best practices, the planning team
established a CC (“visitor capacity”)—maximum amount and type of visitor use that an area can
sustainably accommodate—for each key management area by considering environmental,
social and managerial attributes, as summarized in Table 2.
Table 2 Steps for establishing a carrying capacity for Boca Negra Canyon, Petroglyph National
Monument
Steps Example
Step1. Determine the analysis area where Boca Negra Canyon, the second most visited
high levels of use currently or can impact area of monument. A narrow trail is in close
important resources and quality of visitor proximity to hundreds of petroglyphs and
experiences and that are directly related to highly used. Crowding can cause visitor
the management goals and objectives conflicts and damage to petroglyphs.
Step 2. Review existing direction and Goal: To maintain sustainable access and trail
knowledge including management goals use
and objectives; indicators and thresholds;
and conditions and values that must be Indicator: Number of features affected by
protected and most related to visitor use visitor use adjacent to trail system (e.g., rocks
levels moved and/or newly recorded modern graffiti
or artifacts missing, evidence of site erosion or
compaction)
18Threshold: No more than five documented
incidents of damage impacted by visitor
activity adjacent to the trail system each year
or disruption of tribal access or traditional use
Given that the current parking lots can
accommodate 36 vehicles and up to three 35-
person buses, the current level of use is
estimated at 215 PAOT (incl. 20 PAOT from
residential walk-in access). The persons-per-
vehicle factor of 2.5 was applied.
Step 3. Identify the limiting attributes (e.g. Trail system and cultural resources are limiting
physical, biological, cultural, social or attributes. There is more parking capacity than
managerial) that are most constraining or ecological, social and cultural conditions can
sensitive for deciding the amount of use for accommodate. In case of full parking, the
the analysis areas overwhelming volume of people can cause
overcrowding and damage to trails and
petroglyph viewing areas.
Step 4. Identify the appropriate amount of Considered the monument’s goal for this area,
use at key areas by understanding current a maximum of two buses (instead of three
conditions compared to goals and buses) and 36 vehicles on site at one time was
objectives for the area and by reviewing determined as appropriate. Subsequently, a
visitation data including daily visitor counts, CC for the canyon is decided at 180 PAOT (incl.
counts of fees, parking availability and 20 PAOT from residential walk-in access)
other data sources (e.g., Strava Metro). except during the one-time annual event.
Next steps: More detailed planning and environmental compliance may be needed before
certain actions of the selected alternative are carried out (e.g., active restoration or
rehabilitation of closed routes, stabilization of trails, trail reroutes, etc.).
Considerations: The implementation of the plan will depend on future funding and could be
affected by changes in NPS staffing, visitor use patterns, unanticipated environmental
conditions, development on adjacent lands. The plan intends to be flexible to adapt to these
changes. Full implementation could take many years.
Other: The planning process may differ between individual parks even though they are guided
by the framework (IVUMC, 2016).
197.2 Visitor use management plan, zoning and visitor capacity for Delaware Water Gap National
Recreation Area
Organization and area: Delaware Water Gap National Recreation Area (park) is operated by
National Park Service (NPS) and located in New Jersey and Pennsylvania. The park covers an
area of 28.5 km2 and features the 64-kilometre-long Middle Delaware National Scenic and
Recreational River, of which main stem is one of the cleanest rivers in the country, and cultural
resources spanning more than 12,000 years of human habitation. The park is among the top 20
most-visited national parks in the states and is located less than a two-hour drive from both
New York City and Philadelphia. The park receives an average of 3.8 million visitors every year
and is popular for water-based recreation, hiking and camping.
Capacity issues: The park was managed by the 1987 General Management Planning zoning, and
strategies which were no longer adequate or appropriate for current use. In addition, as
demand for parking increases, visitors would park farther away from the entrance and access to
the main trailhead through visitor-created trails, which creates unsafe conditions for visitors. As
some popular areas become overcrowded, visitors would go off-trails to seek places for
solitude. Such visitor behaviors have led to vegetation trampling and degradation, soil erosion,
unsafe recreational use and have affected the quality of visitor experiences.
Actions taken: In 2015, NPS started the planning process for a visitor use management plan,
guided by the framework (IVUMC, 2016), in parallel to revision of the 1987 zoning. NPS
conducted a survey to understand visitor use, and two universities conducted studies that
informed park decisions on indicators, thresholds for visitor experiences, visitor capacities and
monitoring protocols. The public review for the Draft Visitor Use Management Plan (the draft
plan) was completed in December 2019
(https://parkplanning.nps.gov/PlanProcess.cfm?projectID=55912).
The planning process for the visitor use management plan for Delaware Water Gap National
Recreation Area
Step 1. Stating the park purpose and significance
Step 2. Identifying applicable laws and policies
Step 3. Establishing the purpose and need of the plan
Step 4. Identifying the fundamental resources and values of the park
Step 5. Engaging the public (Spring 2015)
Step 6. Assessing the condition of the visitor experience and park resources
Step 7. Identifying issues that the plan will address
Step 8. Developing preliminary management strategies and options
Step 9. Identifying visitor use management goals and best practices
Step 10. Conducting formal public scoping - Summer 2015
Step 11. Refining options to meet objectives and identify management strategies
Step 12. Establishing indicators for monitoring visitor experiences and resource conditions
Step 13. Changing zoning
Step 14. Identifying environmental impacts and selecting proposed action
20Step 15. Prepare draft plan
Step 16. Public review of draft plan
Step 17. Analyzing and responding to public comments
Step 18. Prepare final plan/environmental document/decision document
Step 19. Releasing final plan/decision document to the public
The draft plan provides a detailed description of each zone that has been revised. Each zone
has its own management direction, desired natural and cultural resource(s) and facilities, and
appropriate visitor use. In some cases, different monitoring indicators and/or thresholds are
applied to each zone. A threshold for visitor-created trails in the Visitor Service Area Zone, for
example, is no more than 0.4 km of visitor-created trails while a threshold for the Outstanding
Natural Feature Zone is no more than 4.8 km of visitor-created trails.
Instead of reducing the current visitation levels to reduce visitor use impacts, which was the
case for Petroglyph National Monument (Case study 1), NPS plans to maintain the current PAOT
as their CC (“visitor capacity”) and to employ other management actions to control the impacts.
Table 3 below summarized the process of determining the visitor capacity and examples of
management actions planned to control impacts for one of the important areas in the park.
Table 3 Steps for establishing a carrying capacity for George W. Childs Park, Delaware Water
Gap National Recreation Area
Steps Example
Step 1. Determine the analysis area George W. Childs Park is one of the most
affected by high visitation above their
intended use level. It is within the Outstanding
Natural Feature Zone, featuring a short trail,
three waterfalls, historical ruins, etc.
Park visitors would go off trails to be close to
the waterfalls, affecting the growth of
vegetation, causing a high level of soil erosion
and crowding-related issues such as
diminished visitor experience, illegal parking,
littering, human waste, etc.
Step 2. Review existing direction and Goal: To accommodate a high level of uses
knowledge including frontcountry users, hiking, water-
base recreation
Indicator: Number of visitor use-related
incidents (or complaints)
21Threshold: No more than 25% increase from
baseline in reported incidents at any one site
within patrol zones.
Given that approximately 56 parking spaces
available at the park, the current level of use
(or current parking capacity) is estimated at
195 PAOT. The persons-per-vehicle factor of
3.5 was applied.
Step 3. Identify the limiting attributes Visitor experience. The current levels of visitor
use result in crowding and visitor complaints
from user conflicts.
Step 4. Identify visitor capacity and Visitor capacity: maintaining the current level
implementation strategies (i.e., 195 PAOT) as a visitor capacity and
allowing no more than current levels of use.
Implementation strategies: near-term actions
(e.g. evaluation of trail repair needs and
completion of trail repair), mid-term actions
(e.g. a permit system or metering system with
a site attendant, discouragement of roadside
parking), and potential actions (e.g.
establishing a maximum parking duration).
Deer fencing has been installed to help protect
the vegetation and promote growth at areas
affected by trampling.
Next steps: As of July 2020, NPS is in the process of analyzing public input and will use feedback
to inform the final visitor use management plan. Once the plan is finalized, implementation of
the management strategies directed in the plan will take many years and be updated and
adjusted as needed during implementation. Near and mid-term actions will be evaluated for
implementation individually, considering future budget restrictions, requirements for
regulatory compliance, NPS’s priorities, etc.
Considerations: None
Other: The draft plan lists best management practices for vegetation and soil as well as visitor
use and experience, historic sites and other capacity attributes.
227.3 Parking and Shuttle Reservations at Muir Woods National Monument
Organization and area: Muir Woods National Monument (monument) is managed by the
National Park Service (NPS) within Golden Gate National Recreation Area in Marin County,
California. The monument of approximately 2.25 km2 in size is managed as both an interpretive
corridor and a sensitive resources zone. It preserves one of the last remaining old-growth
redwood forests for scientific values and inspiration (NPS, 2017).
Capacity issues: In 2000s, the monument received over 700,00 visitors annually arriving by
private car. High visitation coupled with limited parking space resulted in increases in wait time
for parking spaces, illegal parking on the sideroad, and unsafe, inconvenient conditions for
visitors to access the park (e.g., walking over 1.6 km on a narrow two-lane road) while
exacerbating crowding at parking lots (NPS, 2017). There is limited space available for
expanding parking lots due to the monument being a steep canyon. Moreover, parking
expansion would have exacerbated residents’ concern on increasing in traffic in the
neighbourhood (Nelson et al., 2008).
Actions taken: In 2005, NPS and Marin Transit launched the Muir Woods Shuttle as a three-
year pilot project, and the shuttle service has since expanded (Nelson et al., 2008). The shuttle
brings visitors from three off-site locations to the monument, and visitors can return by the
shuttle at any time until the last shuttle. The shuttle runs on all weekends and holidays year-
around at different frequencies, depending on the time of year (e.g., every 10 minutes during
peak periods), and additionally on weekdays during the peak summer season. The shuttle
round trip costs 3 USD per person. Due to COVID-19, shuttle service is not available as of July
2020 (https://gomuirwoods.com/muir/shuttleInfo).
The shuttle service has become an integral component of the transportation system. However,
the shuttle did not sufficiently reduce the volume of personal vehicles arriving at the
monument. From 2006 to 2014, shuttle ridership had increased by ten times from fewer than
5,000 visitors to over 50,200. During the peak season, 20–25% of Muir Woods’ visitors used the
shuttle. Meanwhile, visitation had significantly increased from 775,000 visitors in 2005 to
1,000,747 visitors in 2014. During this period, increase in shuttle ridership did not grow as much
as the increase rate of visitation, and visitors predominantly came by personal vehicle. NPS
decided that without a system in place to control visitation levels, the shuttle service alone
would not sustainably or sufficiently reduce traffic and parking issues even though the shuttle
service continued to expand (NPS, 2017).
To limit visitation levels, distribute visitation through a day or a year, and reduce the number of
visitors per hour during peak times of the day (NPS, 2015), NPS and the County of Marin agreed
to create a reservation system for visitors using personal vehicles and shuttles in 2015. While
the reservation system was being developed, NPS and the County reduced roadside parking on
the south of the Redwood Creek Bridge to 80 cars and increase fines, physical barriers (e.g., a
combination of posts and post-and-cable fencing) and parking enforcement (e.g., adding one
full time NPS staff person to enforce traffic and parking regulations) (NPS, 2019).
23The staff report indicated that the parking restriction had significantly reduced roadside parking
and improved safety in the area as it shorten the walking distance between their parked cars
and the monument entrance. In addition, the physical barriers create a buffer and allow for
vegetation regrowth (County of Marin, 2019).
In January 2018, the reservation system for visitors using a personal vehicle or the shuttle was
launched. The reservation system is operated by Ace Parking Management, Inc. Visitors book a
reservation for parking or shuttle via a web-based system (https://gomuirwoods.com) or a call
centre, year-round prior to their trip. Parking reservations can be made up to 90 days in
advance and are not sold onsite.
Visitors reserve a 30 minute-arrival time slot for parking and pay a reservation fee, depending
on the length or type of the vehicle (from 8.50 USD for standard vehicle to 45 USD for large
vehicle; 8.50 USD for electric vehicle and extra 3 USD if charging is needed), plus the entrance
fee of 15 USD per adult. Standard, ADA and electric vehicles can stay until the closing time
regardless of their arrival time (http://gomuirwoods.com). Commercial carriers make advance
reservations via a separate system managed through www.recreation.gov. There are 232 visitor
spaces and 12 commercial spaces at the monument parking lot. After the launch of the
reservation system in 2018, road shoulder parking was reduced to 40 cars, and “No Parking”
signage was installed (County of Marin, 2019).
The reservation system has shown a promising outcome. Since NPS started active enforcement
on parking violation in 2015, the number of parking tickets issued had increased. When the
reservation system came in place, however, the number of parking tickets significantly
decreased as far less visitors parked in no parking zones. Yet, queuing occurs at the parking lot
entrance as some visitors arrive without a reservation and parking ambassadors are needed to
provide information (County of Marin, 2019).
Next steps: With the premise that reservation system would accommodate all parking demand,
roadside parking will be limited to 30 cars. NPS is developing plans to improve the parking lot,
trails and other arrival facilities to improve safety and visitors experience and stormwater
management (County of Marin, 2019).
Considerations: The reservation system is expected to reduce from approximately 1.2 million
visitors to fewer than 1 million visitors (Gonzales, 2017) and visitation by 40-45 % during peak
period weekends and by 20-30 % during off-peak season weekends. Daily vehicle trips are
expected to decrease by up to 32 % in July (busiest month) and by about 2 % in January
(slowest month) (NPS, 2017). The General Management Plan (NPS, 2014) sets no more than
10% of the days in excess of the performance standards regarding user capacity for the
monument (e.g., maximum arrival time of 20 minutes per individual or group; no more than 18
PPV per 50-meter trail section along valley primary trails). With the reservation system in place,
the occurrences are expected to further decrease to 9 % of the days (NPS, 2017).
24You can also read