Global Attractions Attendance - Themed Entertainment ...

 
CONTINUE READING
Global Attractions Attendance - Themed Entertainment ...
Global
Attractions
Attendance
Report
Global Attractions Attendance - Themed Entertainment ...
Cover image:
Puy du Fou España in Toledo, Spain features four daytime shows,
three period villages and a night show. The newly opened park builds
on the success of the operator's original Puy du Fou park in France.
Photo courtesy Puy du Fou.

Credits
TEA/AECOM 2020 Theme Index and Museum Index: The Global Attractions Attendance Report
Publisher: Themed Entertainment Association (TEA)
Research: Economics practice at AECOM
Editor: Judith Rubin
Producer: Linda Cheu
Lead Designers: Miguel Nonato, Mel Patrick Kasingsing
Publication team: Humberto Castro, Beth Chang, Linda Cheu, Lucia Fischer, Marina Hoffman,
Doris Li, Jodie Lock, Jason Marshall, Miguel Nonato, Michael Posso, John Robinett,

                                                                                                         Global
Judith Rubin, Chris Yoshii

©2020 TEA/AECOM. All rights reserved.

Contacts
                                                                                                         Attractions
                                                                                                         Attendance
For further information about AECOM:

John Robinett                                    Chris Yoshii
Senior Vice President – Economics
john.robinett@aecom.com
T +1 213 593 8785
                                                 Vice President – Economics, Asia-Pacific
                                                 chris.yoshii@aecom.com
                                                 T +852 3922 9000
                                                                                                         Report
Abe Chorbajian, AIA NCARB, LEED AP               Beth Chang
Senior Vice President/Lead – Global Leisure      Executive Director – Economics, Asia-Pacific            The definitive annual
abe.chorbajian@aecom.com                         beth.chang@aecom.com                                    attendance study for the
T +1 213 593 8399                                T +852 3922 8109                                        themed entertainment and
Marina Hoffman                                   Jodie Lock                                              museum industries.
Senior Analyst – Economics, Americas             Associate Director – Economics, Asia-Pacific and EMEA
marina.hoffman@aecom.com                         jodie.lock@aecom.com
                                                                                                         Published by the Themed
T +1 203 969 5764                                T +852 3922 9000
                                                                                                         Entertainment Association
Linda Cheu                                       aecom.com/economics
Vice President – Economics, Americas
                                                                                                         (TEA) and the Economics
linda.cheu@aecom.com                                                                                     practice at AECOM.
T +1 415 955 2928

For information about TEA (Themed Entertainment Association):
Judith Rubin                                     Lindsey Nelson
Theme Index editor and press contact             TEA Executive Director
judy@judithrubinetc.com                          lindsey@teaconnect.org
T +1 314 853 5210                                T +1 818 843 8497

TEAconnect.org
Global Attractions Attendance - Themed Entertainment ...
The Big Picture               6
    The Americas                 16
    Asia-Pacific                 34
    EMEA                         50
    Museums                      64
    About The Study              92
    Frequently Asked Questions   93

                                      Futuroscope, Jaunay-Clan, France
                                                        © Futuroscope

4                                                                        5
Global Attractions Attendance - Themed Entertainment ...
Continuity
                  and hope
                  The year 2020 is one that we’d
                  probably all prefer to forget.
The Big Picture
                  While hesitant to report on the
                  woes of our industry during the
                  pandemic, we have abided by our
                  general principle that transparent
                  documentation of our industry
                  is for the benefit of all. And it’s
                  not all bad news. Our industry
                  has persevered through this
                  disruption with some innovative
                  products and services emerging
                  in multiple sectors. We have also
                  seen a positive comeback in 2021,
                  with pent-up demand fueling
                  many parks, albeit still at reduced
                  capacity for some.

                  Global attraction attendance
                  fell from 50% to 90% in 2020
                  depending on the extent of the
                  pandemic and the type of parks
                  in various regions - one of the
                  steepest annual drops the industry
                  has ever faced. That decline came
                  on the heels of one of the strongest
                  years: 2019 attendance numbers
                  were an economic peak for the
                  industry, the best in five decades
                  according to the performance of
                  the top global operators that we
                  track. (See last year’s report.)

                                                                    Tivoli Gardens in Copenhagen, Denmark put on an

                  John Robinett                               American-style 4th of July celebration in 2021 complete
                                                                              with burgers, classic cars and fireworks.
                                                         Founded in 1843, Tivoli is one of the oldest amusement parks
                  Senior Vice President,                   in the world and was honored with the Thea Classic Award.
                  Economics                                                                             © Tivoli Gardens

 6                                                                                                                         7
Global Attractions Attendance - Themed Entertainment ...
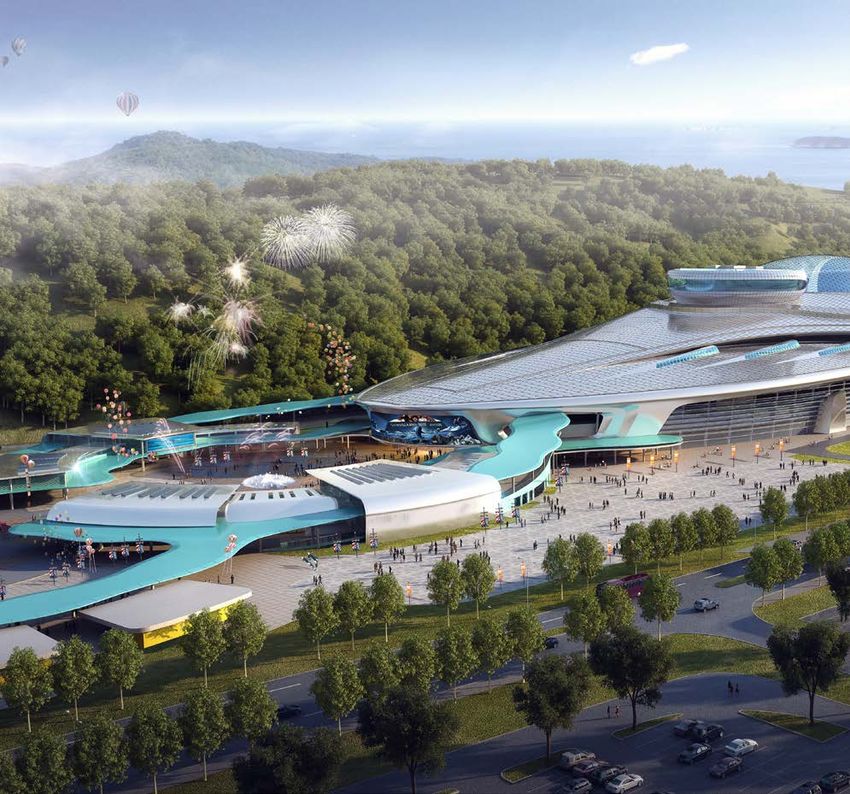
In the Americas, many full-season parks        of performance worldwide in 2020.
    had several operating months in early 2020     Accordingly, 2020’s attendance is largely a
    before being mostly shut down in March         function of regulatory agency restrictions
    for anywhere from several months to the        limiting parks’ operating days and capacities
    remainder of the year. Overall attendance      and not park popularity and management.
    drops generally ranged from 70%-80%.           Therefore, we have decided to keep our 2019
    China was about three months ahead of this     rankings in place for our 2020 report. This
    schedule and had milder losses of 50-70%.      will be re-ranked in 2021 once global health
    EMEA also had more modest losses typically     conditions stabilize.
    from 60% to 65%. The Americas, with many
    major destination parks dependent on
    tourism, had this component of attendance
    largely eliminated. Notable exceptions to
    these regional numbers were China’s OCT
    parks, which reported an average decline
    of only 14%, and Fantawild parks, which
    dropped an average of 20%. Both of these
    Chinese operators rely largely on resident                                     83.1m
    markets. And similarly, in Europe, Efteling                      Top 25 theme parks worldwide
    Park in the Netherlands, which also is                                       attendance 2020                            SeaWorld will open Sesame Place San Diego in 2022.
    oriented towards local guests, and was hit                                                                                                © SeaWorld Parks & Entertainment
    by COVID-19 later in the season, declined
    by only 45%.                                                               253.7m
                                                                     Top 25 theme parks worldwide
    Park closures as well as the loss of
                                                                                                                             The cycle of
                                                                                 attendance 2019
    international and domestic tourists varied
    from country to country creating a patchwork
                                                                                                    2020’s attendance is     recovery
                                                                                                    largely a function of
                                                                                                                             It is not reasonable to expect recovery
                                                                       Universal Studios Beijing    regulatory agency        to equal an instant return to record 2019
                                                                     has opened to the public at
                                                                       Universal Beijing Resort.    restrictions limiting    numbers; a more realistic expectation in
                                                                      © Universal Studios Beijing
                                                                                                    parks’ operating days    the short term would be to return to a level
                                                                                                                             comparable to an average of the recent
                                                                                                    and capacities and       years prior to COVID.
                                                                                                    not park popularity
                                                                                                    and management.          Because the attractions industry model
                                                                                                                             is dependent on bringing people together
                                                                                                                             in groups, and relying to some extent on
                                                                                                                             tourists, it was especially vulnerable to
                                                                                                                             suffer economic harm from COVID. The
                                                                                                                             heartening news is that our industry has
                                                                                                                             faced downturns before and recovered,
                                                                                                                             with the most recent example being the
                                                                                                                             Great Recession of 2007-2009. If you
                                                                                                                             recall, during this crisis the tourist-based
                                                                                                                             parks were hurt more than the resident-
                                                                                                                             based parks. Our current situation is, not
                                                                                                                             surprisingly, similar.

8                                                                                                                                                                                9
Global Attractions Attendance - Themed Entertainment ...
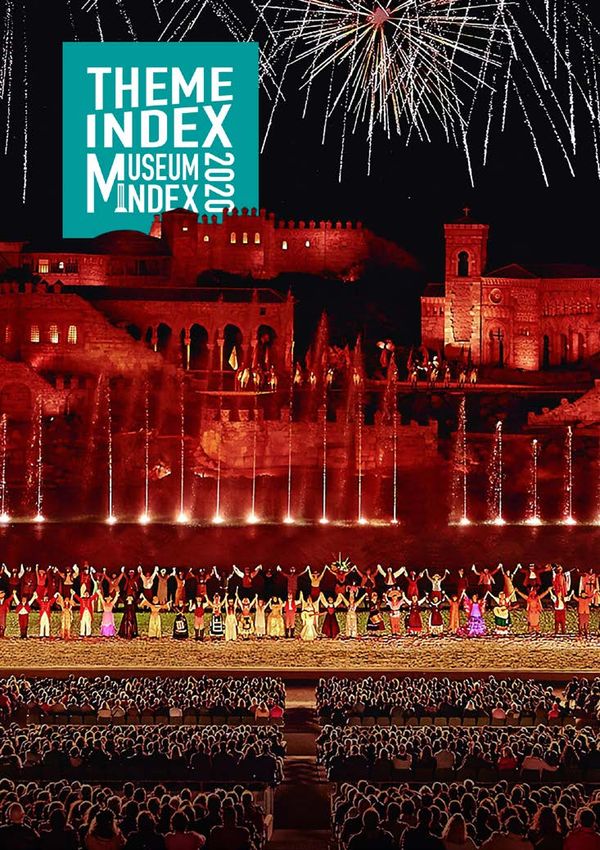
nature of work will likely create new demand   new media technologies. Examples include
                                                                                                         for the leisure products of our industry.      the new units being opened by Meow Wolf,
                                                                                                                                                        Illuminarium, teamLab and several others.
                                                                                                         Another prevalent trend was the use of
                                                                                                         technology to adapt operations to new          Our industry has a fundamental product that
                                                                                                         conditions and create efficiencies for the     delivers family together time, nostalgia, and
                                                                                                         future. The advancement of electronic          escape. The demand will always be there,
                                                                                                         ticketing being a good example. The use of     and our industry will be there to provide for it.
                                                                                                         more advanced ticketing and reservations       We are already seeing abundant proof of this
                                                                                                         software enabled parks to better serve         in the pent-up demand surge reported to us
                                                                                                         customers directly rather than relying on      by operators in the course of researching
                                                                                                         third party bookings, and the incorporation    this report. As soon as they were able to
                                                                                                         of devise, artificial intelligence, and        reopen, guests came flooding back. This
                                                                                                         facial recognition driven applications,        points toward a positive and improved
                                                                                                         has provided for handsfree admissions,         industry of the future.
                                                                                                         purchasing, and interactives. All of these,
                                                        CataCombs at Meow Wolf’s Convergence Station,
                                                                                                         along with virtual queueing, and other
                                                                                      Denver, CO, U.S.   enterprise software programs have allowed
                                                                        © Kennedy Cottrell | Meow Wolf   for rich data collection which can improve
                                                                                                         everything from ride maintenance to the
                                                                                                         personalization of guest experiences.          The change of the nature
                                                                                                                                                        of work will likely create
     There is an historic model for the cycle
     of downturn, bounce-back and recovery              Innovation                                       A final trend that has continued this year
                                                                                                         is the planning, development, and rollout      new demand for the leisure
     that has been observed in past tourism
     and attraction markets that can be applied
                                                        and demand                                       of smaller immersive experiences using         products of our industry.
     to the COVID-19 pandemic (assuming, of             It is difficult to pinpoint which changes will
     course, that all other things remain equal         stay and which will vanish in recovery, but
                                                                                                                                                              Construction is underway on LEGOLAND
     and the Pandemic is generally contained).          there are some trends to observe.                                                                      Shenzhen with a planned 2024 opening.
     Our research shows that the pattern applies                                                                                                                               © Merlin Entertainments
     whether the catalyst is terrorism, civil           Virtual gatherings and programs quickly
     unrest, economic decline or pandemic. The          became one of the most important tools
     cycle shows a steep drop-off in the initial        of continuity and communication during
     year, followed by a three-year recovery            pandemic shutdowns. At this stage,
     curve. Applying this cycle to the current          participation in virtual events has dropped
     pandemic, subsequent to the declines of            from those early months of the crisis.
     2020 we can expect 2021 to manifest as a           People have digital burnout and want to go
     bounce-back year. The following year, 2022,        back to in-person experiences where and
     would begin to usher in real recovery - it         when they can, for business and leisure.
     could be expected to be a full operating           But virtual events and online meetings are
     year for everyone, but still limited in ways. In   not disappearing any time soon. COVID-19
     2023, guest expectations would rise - they         closed offices as well as theme parks, and
     would start looking for new attractions -          many will continue to work remotely even
     and operators should plan and budget for           after recovery, though some will adopt
     reinvestment accordingly. And indeed many          flex schedules. There will still be online
     have, with a number of new parks, rides, and       meetings. This will feed the continuing
     specialty attractions either opening during        demand of the public to get out and have
     COVID or in the near future. Details on this       real experiences, which includes theme
     are in the body of our report.                     parks and attractions. The change of the

10                                                                                                                                                                                                          11
Global Attractions Attendance - Themed Entertainment ...
Top 25
       Amusement/Theme Parks
       Worldwide

                                                                                                            ATTENDANCE

                                                                                                                             ATTENDANCE

                                                                                                                                                                                                                                               ATTENDANCE

                                                                                                                                                                                                                                                               ATTENDANCE
                                                                                              % CHANGE

                                                                                                                                                                                                                                % CHANGE
     2019 RANK

                                                                                                                                          2019 RANK
                 LOCATION

                                                                                                                                                      LOCATION
                 PARK

                                                                                                                                                      PARK
                                                                                                            2020

                                                                                                                             2019

                                                                                                                                                                                                                                               2020

                                                                                                                                                                                                                                                               2019
                  MAGIC KINGDOM THEME PARK AT WALT DISNEY WORLD RESORT,                                                                                DISNEYLAND CALIFORNIA ADVENTURE PARK AT DISNEYLAND RESORT,
       1          LAKE BUENA VISTA, FL, U.S.
                                                                                          -66.9%         6,941,000       20,963,000         13         ANAHEIM, CA, U.S.
                                                                                                                                                                                                                             -80.5%        1,919,000        9,861,000

       2          DISNEYLAND PARK AT DISNEYLAND RESORT, ANAHEIM, CA, U.S.                 -80.3%         3,674,000       18,666,000         14         DISNEYLAND PARK AT DISNEYLAND PARIS, MARNE-LA-VALLEE, FRANCE          -73.1%        2,620,000        9,745,000

       3          TOKYO DISNEYLAND AT TOKYO DISNEY RESORT, TOKYO, JAPAN                   -76.8%         4,160,000       17,910,000         15         UNIVERSAL STUDIOS HOLLYWOOD, UNIVERSAL CITY, CA, U.S.                 -81.4%        1,701,000        9,147,000

       4          TOKYO DISNEYSEA AT TOKYO DISNEY RESORT, TOKYO, JAPAN                    -76.8%         3,400,000       14,650,000         16         EVERLAND, SEOUL, SOUTH KOREA                                          -58.2%        2,760,000        6,606,000

       5          UNIVERSAL STUDIOS JAPAN, OSAKA, JAPAN                                   -66.2%         4,901,000       14,500,000         17         LOTTE WORLD, SEOUL, SOUTH KOREA                                       -73.8%        1,560,000        5,953,000

       6          DISNEY'S ANIMAL KINGDOM AT WALT DISNEY WORLD, LAKE BUENA VISTA, FL, U.S. -70.0%        4,166,000       13,888,000         18         NAGASHIMA SPA LAND, KUWANA, JAPAN                                     -59.7%        2,400,000        5,950,000

       7          EPCOT AT WALT DISNEY WORLD, LAKE BUENA VISTA, FL, U.S.                  -67.5%         4,044,000       12,444,000         19         EUROPA-PARK, RUST, GERMANY                                            -56.5%        2,500,000        5,750,000

       8          CHIMELONG OCEAN KINGDOM, HENGQIN, CHINA                                 -59.1%         4,797,000       11,736,000         20         OCEAN PARK, HONG KONG SAR                                             -61.4%        2,200,000        5,700,000

       9
                  DISNEY'S HOLLYWOOD STUDIOS AT WALT DISNEY WORLD,
                                                                                          -68.0%         3,675,000       11,483,000         21         HONG KONG DISNEYLAND, HONG KONG SAR                                   -70.1%        1,700,000        5,695,000
                  LAKE BUENA VISTA, FL, U.S.
                                                                                                                                            22         EFTELING, EFTELING THEME PARK RESORT, KAATSHEUVEL, NETHERLANDS        -46.3%        2,900,000        5,260,000
       10         SHANGHAI DISNEYLAND AT SHANGHAI DISNEY RESORT, SHANGHAI, CHINA          -50.9%         5,500,000       11,210,000
                                                                                                                                            23         WALT DISNEY STUDIOS PARK AT DISNEYLAND PARIS, MARNE-LA-VALLEE, FRANCE -73.1%        1,410,000        5,245,000
       11         UNIVERSAL STUDIOS FLORIDA AT UNIVERSAL ORLANDO, FL, U.S.                -64.2%         3,908,000       10,922,000
                                                                                                                                            24         OCT HAPPY VALLEY, BEIJING, CHINA                                      -23.4%        3,950,000        5,160,000
       12         UNIVERSAL'S ISLANDS OF ADVENTURE AT UNIVERSAL ORLANDO, FL, U.S.         -64.9%         3,638,000       10,375,000
                                                                                                                                            25         CHIMELONG PARADISE, GUANGZHOU, CHINA                                  -45.3%        2,681,000        4,905,000

                                                                                                                                              TOP 25 TOTAL ATTENDANCE 2020                                                                 83,105,000 253,724,000

                                                                                                                                              TOP 25 ATTENDANCE CHANGE 2019-20                                               -67.2%        83,105,000 253,724,000

                                                                                                                                            © 2020 TEA / AECOM

       2020 attendance declines were
       largely due to agency restrictions
       limiting operating days and
       capacities in the COVID-19 pandemic.
       Therefore, we have kept the 2019
                                                                                                                                            -67.2%                                        83.1m                          253.7m
                                                                                                                                            Top 25 amusement/theme parks                  Top 25 amusement/theme parks   Top 25 amusement/theme parks
       rankings in place for the 2020 report.                                                                                               worldwide attendance change                   worldwide attendance 2020      worldwide attendance 2019
                                                                                                                                            2019–20

12                                                                                                            © 2020 TEA / AECOM            © 2020 TEA / AECOM                                                                                                              13
Global Attractions Attendance - Themed Entertainment ...
Top 25
     Amusement/Theme Parks
     Worldwide

                                                                                                                                                                                         SOUTH KOREA

                                                                                                                                                                                         4.3m
                                                                                     NETHERLANDS

                                                                                       2.9m                22                                                                17
                                                                                                                                                                                   16    2 PARKS
                                                                                           1 PARK                                GERMANY

                                                                                  FRANCE
                                                                                                                         19
                                                                                                                                 2.5m                                                               18
                                                                                                                                 1 PARK                      25
                         15
                                                                                4.0m         23
                                                                                                      14                                           CHINA              8                                    3
     CALIFORNIA, U.S.

           7.3m                        2                                        2 PARKS                                                      16.9m         24
                                                                                                                                               4 PARKS                                           5
           3 PARKS                                                                                                                                                 10
                         13                                                                                                                                                                                4

                                                                                                                                                                                        HONG KONG
                                                                                                                                                                            21    20
                                                                                                                                                                                        3.9m                   JAPAN

                                                               12       1                                                                                                               2 PARKS                14.9m
                                                      11                                                                                                                                                       4 PARKS
                                                                                    FLORIDA, U.S.

                                                                                    26.4m
                                                                                    6 PARKS
                                                         9          7       6

     Key
                                                                                                                              -67.2%                            83.1m                          253.7m
           0–-24.9%      Circles represent size of
                                                                                                                              Top 25 amusement/theme parks      Top 25 amusement/theme parks   Top 25 amusement/theme parks
                         attendance at ranked parks at
                         the geography indicated. Slices                                                                      worldwide attendance change       worldwide attendance 2020      worldwide attendance 2019
           -25%–-49.9%
                         within circles represent proportion                                                                  2019–20
                         of attendance at the geography
           50%–74.9%
                         from the ranked park indicated
                         by number. Shading indicates
           >-75%
                         attendance change at the ranked
                         park versus all other ranked parks.

14                                                                                                  © 2020 TEA / AECOM        © 2020 TEA / AECOM                                                                              15
Global Attractions Attendance - Themed Entertainment ...
Magic Kingdom Theme Park

               A disturbance in the force                                                 at Walt Disney World Resort,
                                                                                                  Lake Buena Vista, FL
                                                                                                             © Disney
               Theme parks, amusement parks and water parks everywhere in the
               world struggled in 2020. Due to the COVID-19 pandemic, they were
               closed for part if not all of their operating seasons.
               This report studies the top-attended parks, and most of those
               major players normally operate year-round. In the US, most of these
               attractions were open Jan 1, 2020, but shut down mid-March.
               The top 20 North American theme parks saw a 72% drop in
The Americas
               attendance numbers.
               Closures and re-openings were state regulated. Florida parks were
               generally shut for four months and began re-opening in early to mid-
               summer 2020, with capacity limits. In California, most major parks were
               shut down for most or all of 2020, with a few exceptions noted below.

               The pain rippled through the industry as well as the
               fan base. Let’s face it, there is a real disturbance in the
               force if Disneyland is closed!
               At this writing in September 2021, most parks in the Americas have
               been open for the season and doing well. Attendance caps have largely
               been eliminated, with the largest operators reporting some days that
               measure up to 2019 levels, economically speaking. The TEA/AECOM
               Theme Index being a calendar-year study, next year’s report will present
               the 2021 numbers.
               The calendar has been a factor in terms of when a region was hardest
               hit by infection relative to operating season. In the Americas, water
               parks suffered more than theme parks for this reason, and parks with
               limited seasons suffered more than those designed to operate year-
               round. The 2019 top ranked 20 North American theme parks saw a 72%
               drop in attendance numbers from 2019 to 2020.

               Marina Hoffman
               Senior Analyst,
               Economics

 16                                                                                                                      17
Global Attractions Attendance - Themed Entertainment ...
Hersheypark, Hershey, PA, U.S.
     © Hersheypark                                                                               America were open at the beginning of           health authorities and their own internal
                                                                                                 2020 and closed mid-March, but did not          doctors and in many cases opened with
                                                                                                 reopen until mid-October at a preliminary       lower capacities than required.
                                                                                                 reduced capacity of 35%.
                                                                                                                                                 Domestic tourism has been making a very
                                                                                                 Staffing has been an issue, particularly for    strong comeback, which is good news
                                                                                                 water parks. Under the circumstances,           for the smaller and more regional parks
                                                                                                 operators have been consolidating staff         catering to mostly domestic visitor bases.
                                                                                                 and resources where they could. Whether         Hotel occupancy, Airbnb, and auto vehicle
                                                                                                 open or closed, a park has fixed costs          counts are all up by large margins, especially
                                                                                                 including labor, real estate tax, insurance,    in destination areas a short distance from
                                                                                                 administration, executive salaries and          major cities. We’re hearing reports of some
                                                                                                 utilities, regardless of whether revenue        of the highest such numbers ever seen.
                                                                                                 is coming in. Reducing staff may save           National parks and campgrounds are doing
                                                                                                 as much as 50% of fixed costs, but not          great business. The domestic tourism boom
                                                                                                 100%. This is most challenging for smaller      should continue and be a lifeline as we wait
                                                                                                 parks, many of which are likely to become       for borders to reopen.
                                                                                                 acquisition targets due to the pandemic.
                                                                                                                                                 For their part, airlines have been seeing
                                                                                                                                                 leisure but not business travelers, meaning
                                                                                                                                                 airline revenues are down although planes
                                                                                                 Market changes                                  and airports are full.

                                                                                                 Shifts in real estate, retail and tourism
                                                    Broadly speaking, for those that were        markets affect the picture in various
     Bouncing back                                  allowed to open, North American theme        ways that will play out in future attraction
                                                    parks operated at 25% capacity through       development. As consumer buying patterns
     As soon as parks could open back up, they      summer 2020. Capacity was allowed            have shifted to online shopping, there are
     had streams of guests. Some operators          to increase in the fall to 35%, and some     sizeable retail assets available, such as
     expressed amazement at how many                properties were able to accommodate          shopping mall space, that can be utilized
     people showed up. It was a testament           50%. Within those estimates there are        for entertainment. And as many middle-
     to how much people love our industry’s         finer shadings. The actual attendance caps   income wage-earners, now working from
     product. Operators adapted in ways to          varied from state to state and province      home, have been relocating away from large
     prioritize safety and reassure patrons while   to province. And some municipalities         urban centers to more affordable places,
     seeking to provide the best possible guest     instituted attendance caps stronger than     secondary markets have become high-
     experience - and were able to recoup some      those imposed by their states. Actual        growth markets able to sustain new leisure
     of their lockdown losses.                      demand was probably higher than what         development.

     It was a plus that theme parks and water
                                                    these caps allowed, and had greater
                                                    capacity been allowed, attendance would      Regionalization is further accentuated                                        44.1m
     parks offer a mostly outdoor experience        have been higher.                            by the lack of international tourism due                                  Top 20 theme parks in
     and outdoor activities have been favored                                                    to travel bans and basic caution. Some                           North America attendance 2020
     as less risky for contagion. (Museums and      In Latin America, theme park and water       North American parks, particularly the

                                                                                                                                                                             159.4m
     other indoor venues suffered much more,        park operators were hit hard by the          top-attended major operators that are the
     as reflected in the Museum Index section of    effects of the pandemic and have had less    focus of this report, normally rely heavily
     this report.)                                  opportunity to recover due to less vaccine   on international visitors and welcome
                                                                                                                                                                           Top 20 theme parks in
                                                    availability than the US. Our research       significant numbers of guests from the                           North America attendance 2020
                                                    pointed to an overall attendance decline     UK, Germany, China, and Japan. They are
                                                    of 71% for the theme parks and a decline     having to shift focus. Disney localized their
                                                    of 61% for the water parks. Parks in Latin   openings working with local and national

18                                                                                                                                                                                                 19
West Coast Racers at Six Flags Magic Mountain, Valencia, CA
                                                                   © Six Flags Entertainment Corporation   full-sized animatronic Indominus Rex (it       fortunate to be able to reopen in 2020
                                                                                                           fights the T-Rex in the final scene) for the   under the state’s zoo/aquarium guidelines,
                                                                                                           park’s reopening. The Bourne Stuntacular       making the most of a survival tactic
                                                                                                           premiered June 30, 2020, at Universal          available to them while other parks were
                                                                                                           Orlando, 25 days after the park reopened;      obliged to remain shut. Six Flags Discovery
                                                                                                           the elaborate new stunt show was recently      Kingdom (Vallejo) reopened on July 2 and
                                                                                                           honored with a Thea Award. In Orlando,         SeaWorld San Diego on August 28.
                                                                                                           the new Jurassic World Velocicoaster
                                                                                                           that opened June 10, 2021 has been well
                                                                                                           received. After a 2020 pause, work has
                                                                                                           resumed on Epic Universe, which will be
                                                                                                           the fourth theme park at Universal Orlando.
                                                                                                           (Meanwhile, on the other side of the globe
                                                                                                           in China, Universal Beijing Resort opened in   NBC Universal kept its
                                                                                                           September 2021.)                               parks moving forward
                                                                                                           Two California parks having a significant      with development and
                                                                                                           animal attraction component were               expansion plans.

                                                    Disney Springs closed all the Disney-
     Theme parks                                    owned shops and restaurants on March
                                                    17. A few days later, on March 20, Disney
     The spirit of recovery is evident in how       Resort hotels were closed. A phased
     our theme park and water park operators        reopening of Disney Springs began on
     have adapted and innovated to continue         May 20. Magic Kingdom and Animal
     doing what they do best - welcoming and        Kingdom reopened July 11; EPCOT and
     entertaining the public, providing a unique    Disney's Hollywood Studios reopened
     environment in which to gather with friends    July 15. In Anaheim, CA, Disneyland Resort
     and family, and making that environment as     reopened April 30, 2021, to California
     safe a space as possible.                      residents only due to regulatory and health
                                                    agencies requirements. The residency
     Disney, the world’s top theme park             requirement was dropped June 15, 2021.
     operator, conceived and implemented            The new Avengers Campus opened June 4,
     some new, innovative ways to design            2021, at Disneyland, featuring encounters
     attractions and entertainment and to           with Marvel characters and villains and an
     operate its parks, and many of these           interactive, Spider-Man ride.
     changes will continue in the future.
     Disney is continuing to invest in the guest    NBC Universal kept its parks moving
     experience. While some construction            forward with development and expansion
     projects paused out of necessity, planning,    plans. Universal Studios Hollywood
     investment, and development are up and         reopened with two major additions -
     running again.                                 Secret Life of Pets: Off the Leash dark                                                                                    Jurassic World – The Ride,
                                                    ride, which was delayed from 2020,                                                                    Universal Studios Hollywood, Universal City, CA.
     In 2020, all Disney World theme                and Jurassic World™ - The Ride, which                                                                                             © Universal Studios
     parks closed to guests by March 16.            had opened in 2019, but added a new,

20                                                                                                                                                                                                           21
River Falls, its new, $23 million rapids
                                                               Star Wars: Rise of the Resistance at
                                                                        Disneyland, Anaheim, CA.      ride. Herschend also embarked on new
                                                                                          © Disney    acquisitions, purchasing the Kentucky
                                                                                                      Kingdom park and the Vancouver              Operators displayed
                                                                                                      Aquarium in spring 2021.                    ingenuity and hospitality
                                                                                                      On a general note, most regional chains
                                                                                                                                                  in 2020, hosting festivals
                                                                                                      extended their 2020 annual passes           and drive-through tours
                                                                                                      and memberships an extra year for no        even while rides were
                                                                                                      additional fee to keep locals engaged.
                                                                                                      Combined with travel slowdowns, this
                                                                                                                                                  closed, extending annual
                                                                                                      meant that a great many of the returning    passes and in a few cases,
                                                                                                      guests were existing passholders. This is   operating under zoo and
                                                                                                      deep discounting but from an operational
                                                                                                      standpoint the loss in ticketing revenue    aquarium guidelines.
                                                                                                      can be offset by per caps spending and
                                                                                                      the value in goodwill.

                                                                                                        Knott's Scary Farm Halloween festival
                                                                                                        at Knott's Berry Farm, Buena Park, CA
     But there were other ways guests could         the park as Taste of Knott's; and in the            © Knott's Berry Farm
     still visit some of the parks prior to that.   Halloween season, in lieu of the annual
     Although the State of California closed        classic Knott's Scary Farm, the park hosted
     down typical operations at theme parks,        Taste of Fall-O-Ween, finishing out 2020
     both Discovery Kingdom and Magic               with Taste of Merry Farm and then in March
     Mountain converted their Holiday in            2021, the Taste of Boysenberry Festival. All
     the Park experiences to drive-through          these festivals were limited-ticket events
     attractions. Discovery Kingdom went            that took place prior to the park’s being
     on to offer drive-throughs that featured       able to fully reopen.
     special scenes around the different holiday
     celebrations at the park, such as 4th of       When it came time to reopen at last in
     July and Fright Nights. Magic Mountain         spring 2021, both Knott's and Cedar Point
     offered one through a custom car show          held anniversary celebrations and opened
     coordinated by West Coast Customs.             new rides. Knott’s celebrated its centennial
     SeaWorld San Diego also offered a drive-       and premiered the new Knott's Berry Tales:
     through Christmas experience, starring         Return to the Fair dark ride. In Sandusky,
     Sesame Street characters.                      Ohio, Cedar Point opened the new Snake
                                                    River Expedition riverboat attraction and
     Cedar Fair operators also displayed            marked 150 years of thrills.
     ingenuity and hospitality. Knott's Berry
     Farm doubled down on its popular tradition     Herschend Entertainment was also visible
     of hosting festivals to enable guests          and active. Dollywood reopened on June
     to gather on the park grounds for food,        17, 2020; Silver Dollar City on June 15 and
     beverages and merchandise even while           the following month premiered Mystic
     the park’s rides were shut down. These
     included Taste of Calico in Ghost Town,
     subsequently expanded throughout

22                                                                                                                                                                             23
Water parks                                    Water parks in hub locations have been
                                                    missing many of their tourists. Brazil
     Water parks tend to operate on a seasonal      plays a major role in international tourism
     schedule. In the US, they usually open         to Orlando, for example. In 2019, 1.22
     around May for the Memorial Day holiday,       million Brazilians flew into Orlando, third
     and close in September. By June 2020,          behind visitors from Canada and the UK. In
     with the pandemic in full swing, US water      California, not a single water park was legally
     parks were obliged to operate at reduced       permitted to operate during 2020.
     capacities. They have reportedly done much
     better in 2021, seeing a flurry of pent-up     But even in the hard-hit water parks
     demand, though still at reduced capacity.      sector, there was some encouraging new
                                                    development in 2020. Soaky Mountain
     Water parks in most US states were             opened in Sevierville, Tennessee on
     following CDC guidelines, which were           June 27. It is owned by hospitality and
     devised with the assistance of the World       attraction company Wilderness Resorts. In
     Waterpark Association - generally for masks    Round Rock, Texas, Kalahari Resorts and
     to be worn everywhere except in the water.     Conventions opened Kalahari Round Rock
     The role played by WWA was an excellent        on November 12. It is an indoor water park
     instance of an industry association stepping   that is part of a hospitality and mixed-use
     up to work with government to devise           resort. These reflect a continuing trend of
     achievable operating plans in a pandemic.      bundling attractions and waterparks with
                                                    resort properties.                                 Typhoon Texas, Pflugerville, TX
     Maintaining staffing levels has been                                                              © Typhoon Texas
     especially difficult for water parks in the    We’re looking forward to bringing more
     pandemic. In a smart move to consolidate       and better news on water parks in next
     staff and resources particularly while         year’s report, when we expect to chronicle
     operating at reduced capacity, in Orlando      bounce-back and the beginnings of
     Disney kept its Typhoon Lagoon water park      recovery in North America and
     closed but Blizzard Beach open.                Latin America.

                                                                                      3.9m
                                                                               Top 20 water parks in
     Even in the hard-hit water                                       North America attendance 2020
     parks sector, there was
     some encouraging new
     development in 2020.
                                                                                    16.4m
                                                                               Top 20 water parks in
                                                                      North America attendance 2019

                                                                                                       Ihu's Breakaway Falls, Aquatica Orlando
                                                                                                       © SeaWorld Parks & Entertainment

24                                                                                                                                               25
Top 20
     Amusement/Theme Parks

                                                                                                                                                                                                                                             ATTENDANCE

                                                                                                                                                                                                                                                              ATTENDANCE
                                                                                                                                                                                                                              % CHANGE
                                                                                                                                  2019 RANK

                                                                                                                                              LOCATION
     North America

                                                                                                                                              PARK

                                                                                                                                                                                                                                             2020

                                                                                                                                                                                                                                                              2019
                                                                                                                                               MAGIC KINGDOM THEME PARK AT WALT DISNEY WORLD RESORT,
                                                                                                                                    1          LAKE BUENA VISTA, FL, U.S.
                                                                                                                                                                                                                          -66.9%          6,941,000       20,963,000

                                                                                                                                    2          DISNEYLAND PARK AT DISNEYLAND RESORT, ANAHEIM, CA, U.S.                    -80.3%          3,674,000       18,666,000

                                                                                                                                    3          DISNEY'S ANIMAL KINGDOM AT WALT DISNEY WORLD, LAKE BUENA VISTA, FL, U.S.   -70.0%          4,166,000       13,888,000

                                                                                                                                    4          EPCOT AT WALT DISNEY WORLD, LAKE BUENA VISTA, FL, U.S.                     -67.5%          4,044,000       12,444,000

                                                                                                                                               DISNEY'S HOLLYWOOD STUDIOS AT WALT DISNEY WORLD,
                                                                                                                                    5          LAKE BUENA VISTA, FL, U.S.
                                                                                                                                                                                                                          -68.0%          3,675,000       11,483,000

                                                                                                                                    6          UNIVERSAL STUDIOS FLORIDA AT UNIVERSAL ORLANDO, FL, U.S.                   -64.2%          3,908,000       10,922,000

                                                                                                                                    7          UNIVERSAL'S ISLANDS OF ADVENTURE AT UNIVERSAL ORLANDO, FL, U.S.            -64.9%          3,638,000       10,375,000
                                                 ONTARIO, CANADA

                                                      1.1m                                                                          8          DISNEY CALIFORNIA ADVENTURE PARK AT DISNEYLAND RESORT, ANAHEIM, CA, U.S.   -80.5%          1,919,000        9,861,000
                                                                       13
                                                       1 PARK                                                                       9          UNIVERSAL STUDIOS HOLLYWOOD, UNIVERSAL CITY, CA, U.S.                      -81.4%          1,701,000        9,147,000

                   MIDWEST U.S.                                                                                                     10         SEAWORLD ORLANDO, ORLANDO, FL U.S.                                         -65.6%          1,598,000        4,640,000

                    2.6m               17   15
                                                                                                 NORTHEAST U.S.                     11         KNOTT'S BERRY FARM, BUENA PARK, CA U.S.                                    -80.9%           811,000         4,238,000
                    2 PARKS
                                                                                                 2.3m
                                                                                           18
                                                                                      19
                                                                                                                                    12         BUSCH GARDENS TAMPA BAY, TAMPA, FL U.S.                                    -69.2%          1,288,000        4,180,000
                                                                                                 2 PARKS
                                                                                                                                    13         CANADA'S WONDERLAND, VAUGHAN, ONTARIO, CANADA                              -71.2%          1,139,000        3,950,000

     CALIFORNIA, U.S.                                                                                                               14         SEAWORLD SAN DIEGO, SAN DIEGO, CA, U.S.                                                             -       3,742,000

        8.8m                                                                                                                        15         CEDAR POINT, SANDUSKY, OH, U.S.                                            -72.7%          1,020,000        3,731,000
        5 PARKS
                          11      16                                                                                                16         SIX FLAGS MAGIC MOUNTAIN, VALENCIA, CA, U.S.                               -81.0%           686,000         3,610,000

                                                                   10 12          1
                                            2              7                                                                        17         KINGS ISLAND, MASON, OH, U.S.                                              -53.8%          1,626,000        3,521,000
                         9                                                                       FLORIDA, U.S.

                                                                                                 29.3m
                                                                                                                                    18         SIX FLAGS GREAT ADVENTURE, JACKSON, NJ, U.S.                               -82.7%           598,000         3,451,000

                                  8                                                                                                 19         HERSHEYPARK, HERSHEY, PA, U.S.                                             -49.3%          1,717,000        3,384,000
                                                          6
                                                                                                 8 PARKS
                                                                                       3                                            20         SIX FLAGS GREAT AMERICA, GURNEE, IL, U.S.                                                           -       3,169,000
                                                                   5        4
                                                                                                                                      TOP 20 TOTAL ATTENDANCE 2020                                                                       44,149,000 159,365,000

                                                                                                                                      TOP 20 ATTENDANCE CHANGE 2019–20                                                    -72.3% 44,149,000 159,365,000

                                                                                                                                    © 2020 TEA / AECOM

     2020 attendance declines
                                                               Key
     were largely due to agency                                                             Circles represent size of
                                                                       0–-24.9%
     restrictions limiting operating
     days and capacities in the                                        -25%–-49.9%
                                                                                            attendance at ranked parks at
                                                                                            the geography indicated. Slices
                                                                                            within circles represent proportion
                                                                                                                                    -72.3%                                       44.1m                               159.4m
     COVID-19 pandemic. Therefore,                                     50%–74.9%
                                                                                            of attendance at the geography
                                                                                            from the ranked park indicated
                                                                                                                                    Top 20 amusement/theme                       Top 20 amusement/theme              Top 20 amusement/theme
                                                                                                                                    parks North America                          parks North America                 parks North America
     we have kept the 2019 rankings                                    >-75%
                                                                                            by number. Shading indicates
                                                                                                                                    attendance change                            attendance 2020                     attendance 2019
                                                                                            attendance change at the ranked
     in place for the 2020 report.                                                          park versus all other ranked parks.     2019–20

26                                                                                                          © 2020 TEA / AECOM      © 2020 TEA / AECOM                                                                                                                 27
Top 10
     Amusement/Theme Parks

                                                                                                                                                                                                                   ATTENDANCE

                                                                                                                                                                                                                                    ATTENDANCE
     Latin America

                                                                                                                                                                                                     % CHANGE
                                                                                                                 2019 RANK

                                                                                                                         LOCATION
                                                                                                                         PARK

                                                                                                                                                                                                                   2020

                                                                                                                                                                                                                                    2019
                                                                                                                   1         SIX FLAGS MEXICO, MEXICO CITY, MEXICO                               -75.0%          701,000         2,803,000

                                                                                                                   2         BETO CARRERO WORLD, SANTA CATARINA, BRAZIL                          -44.1%         1,252,000        2,241,000

              MEXICO                                                                                               3         PARQUE XCARET, CANCUN, MEXICO                                       -62.4%          736,000         1,960,000

           1.4m         3    1                                                                                     4         MUNDO PETAPA, GUATEMALA CITY, GUATEMALA                             -79.8%          268,000         1,330,000
           2 PARKS
                                                                                                                   5         LA FERIA DE CHAPULTEPEC, MEXICO CITY, MEXICO                               -                -       1,306,000

                       GUATEMALA                                                                                   6         PLAZA DE SESAMO, MONTERREY, MEXICO                                         -                -       1,173,000

                        .3m        4                  COLOMBIA

                                                      .7m
                                                                                                                   7         PARQUE MUNDO AVENTURA, BOGOTÁ, COLOMBIA                             -70.1%          344,000         1,151,000
                        1 PARK              9 7
                                                      2 PARKS                                                      8         FANTASIALANDIA, SANTIAGO, CHILE                                     -60.9%          430,000         1,100,000

                                                                                                                   9         THEME PARQUE NACIONAL DEL CAFÉ, QUINDIO, COLOMBIA                   -69.2%          321,000         1,043,000

                                                                                                                   10        PARQUE DE LA COSTA, BUENOS AIRES, ARGENTINA                         -72.8%          263,000          968,000

                                                                                                                     TOP 10 TOTAL ATTENDANCE 2020                                                               4,315,000       15,075,000

                                                                                                                     TOP 10 ATTENDANCE CHANGE 2019-20                                            -71.4%         4,315,000 15,075,000

                                                                                                                   © 2020 TEA / AECOM

                                                                                    BRAZIL

                                         CHILE
                                                                             2      1.3m
                                                                                    1 PARK
                                       .4m        8
                                       1 PARK
                                                               ARGENTINA

                                                         10    .3m
                                                               1 PARK

     2020 attendance declines
                                                 Key
     were largely due to agency                                            Circles represent size of

                                                                                                                   -71.4%                                      4.3m                            15.1m
                                                       0–-24.9%
     restrictions limiting operating                                       attendance at ranked parks at
                                                                           the geography indicated. Slices
     days and capacities in the                        -25%–-49.9%
                                                                           within circles represent proportion
     COVID-19 pandemic. Therefore,                     50%–74.9%
                                                                           of attendance at the geography
                                                                           from the ranked park indicated
                                                                                                                   Top 10 amusement/theme                      Top 10 amusement/theme parks    Top 10 amusement/theme parks
                                                                                                                   parks Latin America attendance              Latin America attendance 2020   Latin America attendance 2019
     we have kept the 2019 rankings                    >-75%
                                                                           by number. Shading indicates
                                                                                                                   change 2019-20
                                                                           attendance change at the ranked
     in place for the 2020 report.                                         park versus all other ranked parks.

28                                                                                         © 2020 TEA / AECOM      © 2020 TEA / AECOM                                                                                                            29
Top 20
     Water Parks

                                                                                                                                                                                                                          ATTENDANCE

                                                                                                                                                                                                                                           ATTENDANCE
                                                                                                                                                                                                            % CHANGE
                                                                                                                       2019 RANK

                                                                                                                               LOCATION
     North America

                                                                                                                               PARK

                                                                                                                                                                                                                          2020

                                                                                                                                                                                                                                           2019
                                                                                                                                   DISNEY'S TYPHOON LAGOON WATER PARK AT WALT DISNEY WORLD RESORT,
                                                                                                                         1         ORLANDO, FL, U.S.
                                                                                                                                                                                                               -                -       2,248,000

                                                                                                                         2         DISNEY'S BLIZZARD BEACH WATER PARK AT WALT DISNEY WORLD RESORT,
                                                                                                                                                                                                        -84.1%          316,000         1,983,000
                                                                                                                                   ORLANDO, FL, U.S.

                                                                                                                         3         UNIVERSAL'S VOLCANO BAY, ORLANDO, FL, U.S.                           -68.3%          574,000         1,811,000

                                                                                                                         4         AQUATICA, ORLANDO, FL, U.S.                                          -65.6%          528,000         1,533,000

                                                                                                                         5         SCHLITTERBAHN, NEW BRAUNFELS, TX, U.S.                               -54.7%          451,000          996,000

                                                                                                                         6         WATER COUNTRY USA, WILLIAMSBURG, VA, U.S.                                   -                -        736,000

                                                                                                                         7         ADVENTURE ISLAND, TAMPA, FL, U.S.                                    -80.9%          125,000          656,000

                                                                                                                         8         AQUATICA SAN ANTONIO, SAN ANTONIO, TX, U.S.                          -59.6%          263,000          651,000

                                                                        NORTHEAST U.S.
                                                                                                                         9
                                                                        .2m
                                                                                                                                   SCHLITTERBAHN, GALVESTON, TX, U.S.                                   -40.6%          337,000          567,000
                                                         18       13
                             MIDWEST U.S.                                                                                10        SPLISH SPLASH, CALVERTON NY, U.S.                                           -                -        542,000

                             0.2m           16
                                                                        2 PARKS
                                                                                                                         11        SIX FLAGS-HURRICANE HARBOR, ARLINGTON, TX, U.S.                      -56.3%          235,000          538,000
                              1 PARK                                               SOUTHERN U.S.

                                                                                   .4m                                   12        SIX FLAGS WHITE WATER ATLANTA, MARIETTA, GA, U.S.                    -54.8%          238,000          526,000
                                                                       19   12
                                                                                   2 PARKS                               13        SIX FLAGS HURRICANE HARBOR, JACKSON, NJ, U.S.                        -82.4%           85,000          482,000

               TEXAS, U.S.         14                                                                                    14        TYPHOON TEXAS, KATY, TX, U.S.                                        -57.5%          203,000          478,000

              1.5m
                                        5
                              11
                                                                                                                         15        SIX FLAGS HURRICANE HARBOR SPLASHTOWN, SPRING, TX, U.S.                     -                -        475,000
              5 PARKS              9    8
                                                     7        2                                                          16        ZOOMBEZI BAY, POWELL, OH, U.S.                                       -62.2%          176,000          466,000
                                                                            FLORIDA, U.S.

                                                 4                          1.5m                                         17        SIX FLAGS HURRICANE HARBOR PHOENIX, GLENDALE, AZ, U.S.                      -                -        441,000

                                                              3             4 PARKS                                      18        CAMELBEACH, TANNERSVILLE, PA, U.S.                                   -65.6%          151,000          439,000

                                                                                                                         19        DOLLYWOOD'S SPLASH COUNTRY, PIGEON FORGE, TN, U.S.                   -56.6%          188,000          433,000

                                                                                                                         20        CEDAR POINT SHORES, SANDUSKY, OH, U.S.                                      -                -        424,000

                                                                                                                           TOP 20 TOTAL ATTENDANCE 2020                                                                3,870,000       16,425,000

                                                                                                                           TOP 20 ATTENDANCE CHANGE 2019-20                                             -76.4%         3,870,000 16,425,000

                                                                                                                         © 2020 TEA / AECOM

     2020 attendance declines
                                                 Key
     were largely due to agency                                                  Circles represent size of
                                                         0–-24.9%
     restrictions limiting operating
                                                                                                                         -76.4%                                        3.9m                          16.4m
                                                                                 attendance at ranked parks at
                                                                                 the geography indicated. Slices
     days and capacities in the                          -25%–-49.9%
                                                                                 within circles represent proportion
     COVID-19 pandemic. Therefore,                       50%–74.9%
                                                                                 of attendance at the geography
                                                                                 from the ranked park indicated          Top 20 water parks North                      Top 20 water parks North      Top 20 water parks North
     we have kept the 2019 rankings                                              by number. Shading indicates            America attendance change                     America attendance 2020       America attendance 2019
                                                         >-75%
                                                                                 attendance change at the ranked         2019-20
     in place for the 2020 report.                                               park versus all other ranked parks.

30                                                                                               © 2020 TEA / AECOM      © 2020 TEA / AECOM                                                                                                             31
Top 10
     Water Parks

                                                                                                                                                                                                    ATTENDANCE

                                                                                                                                                                                                                    ATTENDANCE
     Latin America

                                                                                                                                                                                      % CHANGE
                                                                                                     2019 RANK

                                                                                                             LOCATION
                                                                                                             PARK

                                                                                                                                                                                                    2020

                                                                                                                                                                                                                    2019
                                                     BAHAMAS
                                                                                                       1         THERMAS DOS LARANJAIS, OLIMPIA, BRAZIL                           -50.0%          922,500        1,845,000

            MEXICO                           2       .5m                                               2         BAHAMAS AQUAVENTURE WATER PARK, PARADISE ISLAND                  -72.8%          494,000        1,813,000

           .2m       10                              1 PARK
                                                                                                       3
                                                                                                                 (NASSAU, NEW PROVIDENCE), BAHAMAS

           1 PARK                                                                                                HOT PARK RIO QUENTE, CALDAS NOVAS, BRAZIL                        -50.0%          734,500        1,469,000

                                                                                                                 PARQUE ACUATICO XOCOMIL, SAN MARTÍN ZAPOTITLÁN, RETALHULEU,
                                                                                                       4                                                                          -86.5%          121,000         894,000
                                                                                                                 GUATEMALA
         GUATEMALA

         0.1m
                                                                                                       5         BEACH PARK, AQUIRAZ, BRAZIL                                      -65.0%          312,000         890,000
                      4
                                              COLOMBIA

                                              .3m
          1 PARK                                                                                       6         PISCILAGO, GIRARDOT (BOGOTA), COLOMBIA                           -65.0%          307,000         876,000
                                       6
                                              1 PARK                                                   7         MAGIC CITY WATER PARK, SUZANO, BRAZIL                            -47.9%          355,000         681,000

                                                                                                       8         THERMAS WATER PARK, SÃO PEDRO, BRAZIL                            -50.9%          315,000         641,000

                                                                                                       9         HOT BEACH, OLYMPIA, BRAZIL                                       -60.0%          243,200         608,000

                                                                8     9
                                                                               1       BRAZIL          10        PARQUE ACUATICO EL ROLLO, MORELOS, MEXICO                        -60.0%          210,000         525,000

                                                               7                       2.9m              TOP 10 TOTAL ATTENDANCE 2020                                                            4,014,200 10,242,000
                                                                5          3           6 PARKS
                                                                                                         TOP 10 ATTENDANCE CHANGE 2019-20                                         -60.8%         4,014,200 10,242,000

                                                                                                       © 2020 TEA / AECOM

     2020 attendance declines
                                       Key
     were largely due to agency                                Circles represent size of
                                             0–-24.9%
     restrictions limiting operating
     days and capacities in the              -25%–-49.9%
                                                               attendance at ranked parks at
                                                               the geography indicated. Slices
                                                               within circles represent proportion
                                                                                                       -60.8%                                    4.0m                          10.2m
     COVID-19 pandemic. Therefore,           50%–74.9%
                                                               of attendance at the geography
                                                               from the ranked park indicated
                                                                                                       Top 10 water parks                        Top 10 water parks            Top 10 water parks
                                                                                                       Latin America attendance                  Latin America attendance      Latin America attendance
     we have kept the 2019 rankings          >-75%
                                                               by number. Shading indicates
                                                                                                       change 2019–20                            2020                          2019
                                                               attendance change at the ranked
     in place for the 2020 report.                             park versus all other ranked parks.

32                                                                             © 2020 TEA / AECOM      © 2020 TEA / AECOM                                                                                                        33
6th
                                      6th top theme park
                                      group worldwide,

               A story of
                                      Chimelong Group,
                                      China

               growth
               interrupted
               Attendance numbers for parks
               and attractions throughout Asia
               were down sharply in 2020 due
               to closures, regulations, and
               restrictions. To what degree they
               were affected varied depending
Asia-Pacific

               on when a particular country or
               region was hit by the first COVID
               wave, the timing and duration of
               lockdowns and closures, travel
               limitations, the rate of vaccination,
               and other control measures as well
               as geography and the nature of the
               property itself.

               Beth Chang
               Executive Director –
               Economics, Asia‑Pacific

               Chris Yoshii                                   Rendering of Chimelong Marine Science Park,
                                                             set to open next to Chimelong Ocean Kingdom in
               Vice President – Economics,                            2021 as a second gate of the Chimelong
               Asia-Pacific                                International Ocean Tourist Resort in Zhuhai, China.
                                                                                          © Chimelong Group

 34                                                                                                               35
Super Nintendo World recently opened at
     Universal Studios Japan, Osaka                                                                      allowing them to serve customers directly         Parks in China had the first wave of closures
     © Usa-Pyon | Shutterstock                                                                           and gaining more control over ticket sales        in 2020 in late January and first reopened by
                                                                                                         and data collection, which helps                  late March at about one-third capacity, while
                                                                                                         boost profitability.                              the country gradually returned to something
                                                                                                                                                           like business as usual (sans international
                                                                                                                                                           tourism). Domestic air travel and high-speed
                                                                                                         China                                             rail were operating at about 90% of normal
                                                                                                                                                           capacity; outdoor scenic areas and parks
                                                                                                         As mentioned above, our research                  were doing well, with people seeking open,
                                                                                                         indicates that most parks in China saw            outdoor activities.
                                                                                                         attendance numbers drop significantly
                                                                                                         in 2020 due to closures and capacity
                                                                                                         restrictions, with certain exceptions. Not
                                                                                                         only was international tourism at a standstill,
                                                                                                         domestic tourism (from one province to
                                                                                                         another within the country) was also banned
                                                                                                         during this period. As a result, even after
                                                                                                         reopening, most of China’s theme parks and
                                                                                                         water parks have been drawing on a much           China added nearly
                                                                                                         smaller pool of visitors than previously,
                                                                                                         although the country's sizeable resident          20 parks during
                                                                                                         population is a home advantage.                   the pandemic.

     Asia's theme parks and water parks                                                                     Shanghai Disneyland, Shanghai, China
                                                                                                            © Disney
     How much parks were able to bounce back           prestigious of these is Universal Beijing, with
     in 2020 after re-opening also varied, tied to a   its September 2021 grand opening. The
     host of factors including location, operating     OCT and Fantawild chains both opened new
     season, special offers and marketing, travel      parks, while Chimelong Paradise expanded.
     patterns and type of facility. In the third       Ocean Park Hong Kong has opened its
     quarter of 2021, at this writing, emerging        new, year-round water park, Water World.
     new variants of the COVID-19 virus are            In Osaka, Japan, Universal Studios Japan
     bringing fresh challenges.                        opened Super Nintendo World™ in March
                                                       2021. Meanwhile there are still quite a few
     In the Asia-Pacific region, the top 20            new properties under construction, and
     theme parks saw attendance numbers                plenty of buzz about new projects. The
     drop a total of 58% in 2020. The impact to        trend is toward mixed-use: clusters of small
     China has been different than in other            attractions, which are easier to finance than
     parts of Asia.                                    one large park.

     Being hit very early in the pandemic China        Like their counterparts around the world,
     was the first to implement restrictions           Asian parks turned to technology to
     and closures. Nonetheless, new parks and          adapt operations and guest services for
     attractions continued to open even during         pandemic conditions. Operators that had
     the pandemic, though with some delays.            long depended on third-party bookings
     China added nearly 20 parks. The most             upgraded their systems and websites,

36                                                                                                                                                                                                         37
operator’s 26 parks. In the past, Fantawild
     The major operators                              parks have seen 1 million to 2 million
                                                      attendance per property; however, in 2019-
     Some parks were able to sustain higher           2020, some were open only part of the year
     attendance numbers as they were already          and some closed altogether. Nonetheless,
     oriented to local markets. Notably in this       in 2020 Fantawild opened a new Oriental
     category was the government-owned                Heritage park in Mianyang. The Fantawild
     chain OCT Group, which reported an               Oriental Heritage Park in Jingzhou was
     average decline of only 14% among its            recently honored with a Thea Award for the
     37 parks in more than 20 cities. OCT did         live show Qu Yuan, which marks the second
     a lot of marketing to encourage guests           Thea honor for this operator.
     to return - and sweetened the deal with
     deep discounts on admission. And even            Being more tourism-dependent than the
     though it was 2020, OCT moved ahead with         other chains, and featuring many indoor
     expansions and additions, including a new        shows, Chimelong Group properties
     Happy Valley theme park in Nanjing, three        experienced a more severe attendance
     new water parks in Nanjing, Shunde and           drop in 2020, averaging 59% across the
     Xiangyang, and several small attractions         various parks. As the most locally oriented
     including an observation wheel in Shunde.        of Chimelong parks, Chimelong Paradise
                                                      in Guangzhou saw the best returns of the
     Fantawild parks are primarily targeted to        group, and also opened a new show and
     local audiences, including school groups,        themed area in 2020.
     with their local culture and history theme.
     For this chain, 2020 attendance numbers                                                                                                                                       Everland, Seoul, South Korea
     dropped an average of 20%, with declines                                                                                                                                                        © Everland
     ranging from 10% to 60% among the

                                                                                                           Disney, the world’s leading theme park
                                           The live show Qu Yuan at Fantawild Oriental Heritage Park in    operator, has demonstrated optimism              Looking ahead
                                         Jingzhou, China, was recently honored with a TEA Thea Award.      about the future. Shanghai Disney Resort
                                                                      © Fantawild Oriental Heritage Park
                                                                                                           has been celebrating its fifth anniversary       Even in the pandemic, China’s attractions
                                                                                                           in 2021 and has announced another                industry continues to evolve and expand as
                                                                                                           admission price increase, planned to take        the country moves toward a leading global
                                                                                                           effect in January 2022. This would be the        position. A number of older theme parks
                                                                                                           third time the park has raised the price since   are beginning to shut down or relocate
                                                                                                           first opening to the public in 2016.             as they reach the end of their land leases
                                                                                                           The move, along with the planned expansion       (generally 40 years). Built on the outskirts
                                                                                                           with an under-construction land themed to        of cities that have continued to grow,
                                                                                                           Zootopia, reflects Disney's confidence in its    surrounding them with urban development,
                                                                                                           operations in China, as well as the company      these parks are sitting on land that has
                                                                                                           strategy to keep growing per-visitor             increased greatly in value, presenting the
                                                                                                           revenue. Development of a new, Frozen-           opportunity to relocate to parcels farther
                                                                                                           themed land at Hong Kong Disneyland is           out and redevelop the parks. As they do so,
                                                                                                           also underway.                                   Chinese parks have plenty of opportunity
                                                                                                                                                            to raise their game with technology such
                                                                                                                                                            as virtual ride queues and to support VIP
                                                                                                                                                            experiences and operations in general.

38                                                                                                                                                                                                           39
Discounting admission to boost                      be instructive: If Universal Beijing sets a                                                        Korea
     attendance is a short-term strategy. To             successful example for winter operations,
     succeed over the long term, a park needs            it will influence the market for other parks in                                                    Korea was hit early by the pandemic and
     to deliver a high-quality experience.               the northern regions.                             Even in the pandemic,                            experienced multiple cycles of businesses
     Engaged guests stay longer, spend more                                                                China’s attractions                              opening and closing. Everland and Lotte
     money, share their experiences with others          Be that as it may, the establishment of                                                            World respectively were hit with 58% and
     and come back for more. In a situation              Universal Beijing Resort, and the ongoing
                                                                                                           industry continues to                            74% attendance decreases. Everland’s
     such as the current pandemic, people                expansion of Shanghai Disney Resort,              evolve and expand as the                         better figures likely reflect its having more
     are limiting how much they go out and               continue an upward trajectory for the             country moves toward a                           outdoor experiences and being more of a
     the decision to visit a theme park is not           industry, and reinforce the notion of quality                                                      vacation destination whereas Lotte World is
     made lightly. People do want to get out, to         entertainment for parks in China and Asia–
                                                                                                           leading global position.                         more of an urban, indoor facility.
     gather with friends and family, to enjoy time       raising the bar in the use of technology and
     outdoors - but they will look for high-quality      media and leading other parks and all sorts
     options. The better-quality parks are able          of attractions to follow suit. Many operators     Japan                                            Southeast Asia
     to stand more firmly on price, and their per        have already been part of this trend, with        Because Tokyo’s two Disney parks were            In warmer climates such as Southeast
     caps revenue will recover more quickly.             substantial upgrades to their properties.         shut down by February 2020 and didn’t            Asia, parks tend to have longer operating
                                                         Universal Beijing has also set an exemplary       reopen until July, their attendance drop         seasons and, in 2020, this gave them more
     Due to travel constraints, Universal Beijing        standard in being the first LEED-certified        for the year was close to 80%. Similarly,        time to recoup attendance losses after
     Resort will need to draw its initial attendance     theme park in the world. As China pushes          Universal Studios Japan (Osaka), reopened        reopening. The average attendance drop
     from the approximately 20 million population        to reduce greenhouse gas emissions and            earlier in June, suffering a smaller, 66% drop   was 40-50%. However, due to the region’s
     in the nation’s capital city. The summer            cut its carbon footprint, we will see more        in 2020; however, the much-anticipated           high rate of COVID infection and low
     season portends to be uneven, and the               innovation of this kind, moving toward            Super Nintendo World opened there in             vaccination rate, parks in Southeast Asia
     Beijing winter is quite cold, so the park’s first   reduced energy consumption and more               March 2021.                                      may not do as well in 2021.
     big year entertaining the public will most          sustainable development with less waste.
     likely be 2022. What happens in winter may

        Ocean Park Hong Kong, Hong Kong, SAR
        © Lee Yiu Tung | Shutterstock

                                                                                                                                                                                          59.5m
                                                                                                                                                                                      Top 20 theme parks in
                                                                                                                                                                               Asia-Pacific attendance 2020

                                                                                                                                                                                        141.3m
                                                                                                                                                                                      Top 20 theme parks in
                                                                                                                                                                               Asia-Pacific attendance 2019

40                                                                                                                                                                                                            41
China Dinosaur Park, Changzhou, China
                                                      more quickly at the higher end as the
     Water parks                                      affluent recover their ability to travel first.
                                                                                                                                                       © China Dinosaur Park

                                                      This is well demonstrated by the
     How well a particular water park did in terms    cruise ship industry.
     of attendance in 2020 in Asia depended on
     whether conditions allowed it to be open for     Poseidon Beach Water World in Harbin
     the summer season.                               (China) had a typical result for a facility with
                                                      mostly indoor activities, with a 67% drop in
     Chinese water parks, allowed to open by          attendance. Water parks with more outdoor
     late May, were pretty much able to capture       features did best.
     summer, though with limited capacity and
     the need to address guests’ heightened           Australia did a very good job of containing
     hygiene concerns. The Atlantis Sanya resort      the pandemic in 2020, and because of
     water park was the only one with essentially     its seasonal cycle, parks were not overly
     no loss of attendance. Geography and             affected when the warm weather began,
     demographics were in its favor - it is located   especially on the Gold Coast. This year,
     on an island that was able to better contain     however, has brought new challenges and
     the pandemic, and as an established resort       lockdowns to the country.
     destination, it drew affluent Chinese guests
     who weren’t able to travel overseas. Tickets
     also were heavily discounted. In general,
     when a market starts to recover, it recovers

        Poseidon Beach Water Park, Harbin, China
        © Poseidon Beach Water Park

                                                                                                                                                             11.1m
                                                                                                                                                       Top 20 water parks in
                                                                                                         Chinese water parks,                  Asia-Pacific attendance 2020

                                                                                                         allowed to open by late
                                                                                                         May, were pretty much                              21.6m
                                                                                                         able to capture summer,                      Top 20 water parks in
                                                                                                         though with limited                   Asia-Pacific attendance 2019

                                                                                                         capacity and the need to
                                                                                                         address guests’ heightened
                                                                                                         hygiene concerns.
42                                                                                                                                                                             43
OCT Shunde Playa Maya
                                                                                                                                       Water Park, Shunde, China
                                                                                                                                        © OCT Shunde Water Park
     Adapting and improving
     In China, various strategies and fresh
     approaches are being employed to help
     water parks perform better in the new
     conditions, and these can be instructive
     examples for all park operators.

     The pandemic accelerated the transition to
     electronic ticketing. Guests now use apps
     within WeChat to make reservations and pay
     for admissions. Facial recognition technology
     has been adopted at some water parks. This
     enables guests to enter, participate and
     make purchases without having to carry their
     wallet and phone around the property.

     We’ve also observed that in 2021 a number
     of water parks opened a bit earlier (April vs.
     June) to extend the season. However, the
     appearance of the Delta virus variant put
     a damper on this, entering China in mid-
     summer and interrupting domestic travel
     across provinces.

     The Chinese government is promoting
     a “nighttime economy” to help stimulate
     domestic demand. Many attractions have
     been adding evening activities this year,
     including water parks that traditionally         To utilize their space more fully at all times of
     avoided nighttime operations. The new            year, many water parks have begun to explore
     OCT Shunde water park has had success            hosting seasonal events such as Halloween
     offering nighttime ticket discounts,             in fall, ice-and-snow festivals in winter, light    The Chinese government
     drawing as much as three-quarters of             festivals around the Chinese New Year, etc.
     the day’s attendance and giving guests
                                                                                                          is promoting a nighttime
     the opportunity to experience the park           A new wave of boutique water parks as resort        economy to help stimulate
     without the intense summer heat and sun          amenities cater to increased demand for             domestic demand. Many
     of Southern China. The EDM (electronic           short-distance, regional travel and staycation
     dance music festival) is popular in China        options. These mid- to small-scale indoor/          attractions have been
     among young people, and some water               outdoor water parks are being packaged with         adding evening activities
     parks are incorporating it for nighttime         on-site hotels. This trend, begun a few years       this year, including water
     operations. One water park’s creative            ago, aligns well with guests’ needs in the
     and highly Instagrammable twist: placing         pandemic today and we expect to see it in           parks that traditionally
     boats in the lazy river for guests to row, and   some high-profile future developments.              avoided nighttime
     enhancing the path with colorful lighting.
                                                                                                          operations.
44                                                                                                                                                                 45
Top 20
     Amusement/Theme Parks

                                                                                                                                                                                                                                  ATTENDANCE

                                                                                                                                                                                                                                                   ATTENDANCE
     Asia-Pacific

                                                                                                                                                                                                                   % CHANGE
                                                                                                                               2019 RANK

                                                                                                                                       LOCATION
                                                                                                                                       PARK

                                                                                                                                                                                                                                  2020

                                                                                                                                                                                                                                                   2019
                                                                                                                                 1         TOKYO DISNEYLAND AT TOKYO DISNEY RESORT, TOKYO, JAPAN                -76.8%         4,160,000       17,910,000
                                                                                      SOUTH KOREA

                                                                                      4.3m
                                                                                                                                 2         TOKYO DISNEYSEA AT TOKYO DISNEY RESORT, TOKYO, JAPAN                 -76.8%         3,400,000       14,650,000
                                                                      7
                                                                                 6
                                                NORTHERN CHINA
                                                                                      2 PARKS                                    3         UNIVERSAL STUDIOS JAPAN, OSAKA, JAPAN                                -66.2%         4,901,000       14,500,000

                                                     4.0m                                                                        4         CHIMELONG OCEAN KINGDOM, HENGQIN, CHINA                              -59.1%         4,797,000       11,736,000
                                                      1 PARK                                              JAPAN
                                                                                                                                 5
                                                                                                          14.9m
                                                                                                                                           SHANGHAI DISNEYLAND AT SHANGHAI DISNEY RESORT, SHANGHAI, CHINA       -50.9%         5,500,000       11,210,000

                                WESTERN CHINA             11                                                                     6         EVERLAND, SEOUL, SOUTH KOREA                                         -58.2%         2,760,000        6,606,000
                                                                                                          4 PARKS
                                     2.6m       18                                                                               7         LOTTE WORLD, SEOUL, SOUTH KOREA                                      -73.8%         1,560,000        5,953,000
     SOUTHERN CHINA                   1 PARK
      12.5m                                                                                           8                          8         NAGASHIMA SPA LAND, KUWANA, JAPAN                                    -59.7%         2,400,000        5,950,000
                                                                                                                1

       4 PARKS                                                                                                                   9         OCEAN PARK, HONG KONG SAR                                            -61.4%         2,200,000        5,700,000
                                                                                                  3
                      16                                                                                        2                10        HONG KONG DISNEYLAND, HONG KONG SAR                                  -70.1%         1,700,000        5,695,000

                                 4                                                                                               11        OCT HAPPY VALLEY, BEIJING, CHINA                                     -23.4%         3,950,000        5,160,000

                 15        12                                                                                                    12        CHIMELONG PARADISE, GUANGZHOU, CHINA                                 -45.3%         2,681,000        4,905,000

                                                                                                                                 13        UNIVERSAL STUDIOS SINGAPORE, SINGAPORE                               -75.6%         1,098,000        4,500,000
                                                                                 20
                                                                                              5                EASTERN CHINA     14        CHINA DINOSAUR PARK, CHANGZHOU, CHINA                                -46.4%         2,375,000        4,434,000

                                                                                                               16.3m
             HONG KONG

            2.9m                10     9
                                                                            19
                                                                                                               5 PARKS
                                                                                                                                 15        OCT WINDOW OF THE WORLD, SHENZHEN, CHINA                             -52.6%         1,890,000        3,990,000

            2 PARKS                                                                                                              16        OCT HAPPY VALLEY, SHENZHEN, CHINA                                    -21.6%         3,120,000        3,980,000
                                                                                 17         14
                                                          SINGAPORE
                                                                                                                                 17        ZHENGZHOU FANTAWILD ADVENTURE, ZHENGZHOU, CHINA                      -10.9%         3,421,000        3,840,000

                                                     13   1.1m                                                                   18        OCT HAPPY VALLEY, CHENGDU, CHINA                                     -26.8%         2,620,000        3,580,000

                                                          1 PARK                                                                 19        NINGBO FANTAWILD ORIENTAL HERITAGE, NINGBO, CHINA                    -36.9%         2,257,000        3,575,000

                                                                                                                                 20        OCT HAPPY VALLEY, SHANGHAI, CHINA                                    -19.5%         2,730,000        3,390,000

                                                                                                                                   TOP 20 TOTAL ATTENDANCE 2020                                                               59,520,000 141,264,000

                                                                                                                                   TOP 20 ATTENDANCE CHANGE 2019-20                                             -57.9%        59,520,000 141,264,000

                                                                                                                                 © 2020 TEA / AECOM

     2020 attendance declines
                                                          Key
     were largely due to agency                                                       Circles represent size of
                                                                 0–-24.9%
     restrictions limiting operating
     days and capacities in the                                  -25%–-49.9%
                                                                                      attendance at ranked parks at
                                                                                      the geography indicated. Slices
                                                                                      within circles represent proportion
                                                                                                                                -57.9%                                        59.5m                          141.3m
     COVID-19 pandemic. Therefore,                               50%–74.9%
                                                                                      of attendance at the geography
                                                                                      from the ranked park indicated
                                                                                                                                Top 20 amusement/theme parks                  Top 20 amusement/theme parks   Top 20 amusement/theme parks
                                                                                                                                attendance change Asia-Pacific                Asia-Pacific attendance 2020   Asia-Pacific attendance 2019
     we have kept the 2019 rankings                              >-75%
                                                                                      by number. Shading indicates
                                                                                                                                2019-20
                                                                                      attendance change at the ranked
     in place for the 2020 report.                                                    park versus all other ranked parks.

46                                                                                                        © 2020 TEA / AECOM     © 2020 TEA / AECOM                                                                                                             47
Top 20
     Water Parks
     Asia-Pacific

                                                                                                                                                                                                                   ATTENDANCE

                                                                                                                                                                                                                                    ATTENDANCE
                                                                                                                                                                                                    % CHANGE
                                                                                                                 2019 RANK

                                                                                                                         LOCATION
                                                                                                                         PARK

                                                                                                                                                                                                                   2020

                                                                                                                                                                                                                                    2019
                                                                                                                   1         CHIMELONG WATER PARK, GUANGZHOU, CHINA                             -49.8%          1,512,000        3,014,000

                                                                                                                   2         WUHU FANTAWILD WATER PARK, WUHU, CHINA                             -42.8%           770,800         1,348,000

                                                                                                                   3         CARIBBEAN BAY, SEOUL, SOUTH KOREA                                  -87.4%           168,000         1,333,000

                                                                                                                   4         PLAYA MAYA WATER PARK, WUHAN, CHINA                                -23.1%           930,000         1,210,000

                                                       19               SOUTH KOREA                                5
                                                                 3                                                           AQUAVENTURE ATLANTIS, SANYA, CHINA                                   0.0%          1,200,000        1,200,000

                                                                        .6m                                                  SUNWAY LAGOON, KUALA LUMPUR, MALAYSIA                              -50.0%           600,000         1,200,000
                                                      17         8      4 PARKS
                                                                                                                   7         WET 'N' WILD GOLD COAST, GOLD COAST, AUSTRALIA                     -15.0%           952,000         1,120,000

                                                                                                                   8         OCEAN WORLD, HONGCHEON, SOUTH KOREA                                -83.2%           180,000         1,071,000
                            15 17   1
              CHINA   13

          7.2m
                                                                            JAPAN                                  9         POSEIDON BEACH WATER WORLD, HARBIN, CHINA                          -67.3%           299,600          916,700

          9 PARKS     11
                                            2                         14
                                                                            0.5m                                             SUNWAY LOST WORLD OF TAMBUN, PERAK, MALAYSIA                       -40.0%           600,000         1,000,000
                                                                            1 PARK
                        9      5        4                                                                          11        PLAYA MAYA WATER PARK, SHANGHAI, CHINA                             -11.3%           860,000          970,000
                                                                     SINGAPORE

                                                            20       0.3m                                          12        ATLANTIS WATER ADVENTURE, JAKARTA, INDONESIA                       -75.8%           220,000          910,000

                                                                     1 PARK                                        13        ZHENGZHOU FANTAWILD WATER PARK, ZHENGZHOU, CHINA                   -31.2%           622,300          905,000

                  MALAYSIA
                                                                                                                   14
                1.2m
                                                                                                                             SUMMERLAND, TOKYO, JAPAN                                           -47.7%           454,000          868,000
                               9    5                                  INDONESIA

                2 PARKS                                    16    12    .4m                                         15        XIAMEN FANTAWILD WATERPARK, XIAMEN, CHINA                          -46.9%           442,000          832,000

                                                                       2 PARKS                                     16        THE JUNGLE WATER ADVENTURE, BOGOR, WEST JAVA, INDONESIA            -74.5%           200,000          785,000

                                                                                                                   17        PLAYA MAYA WATER PARK, TIANJIN, CHINA                              -26.7%           550,000          750,000
                                                                                   AUSTRALIA

                                                                                   1m
                                                                                                                             WOONGJIN PLAYDOCI WATERDOCI, BUCHEON, SOUTH KOREA                  -80.5%           146,000          750,000
                                                                           7
                                                                                   1 PARK                          19        LOTTE WATER PARK, GIMHAE, SOUTH KOREA                              -82.1%           132,800          740,000

                                                                                                                   20        ADVENTURE COVE WATER PARK, SINGAPORE                               -57.7%           300,000          710,000

                                                                                                                     TOP 20 TOTAL ATTENDANCE 2020                                                              11,139,500       21,632,700

                                                                                                                     TOP 20 ATTENDANCE CHANGE 2019–20                                           -48.5%         11,139,500 21,632,700

                                                                                                                   © 2020 TEA / AECOM

     2020 attendance declines
                                                Key
     were largely due to agency                                            Circles represent size of
                                                      0–-24.9%
     restrictions limiting operating
     days and capacities in the                       -25%–-49.9%
                                                                           attendance at ranked parks at
                                                                           the geography indicated. Slices
                                                                           within circles represent proportion
                                                                                                                   -48.5%                                     11.1m                          21.6m
     COVID-19 pandemic. Therefore,                    50%–74.9%
                                                                           of attendance at the geography
                                                                           from the ranked park indicated
                                                                                                                   Top 20 water parks Asia‑Pacific            Top 20 water parks             Top 20 water parks
                                                                                                                   attendance change 2019–20                  Asia‑Pacific attendance 2020   Asia‑Pacific attendance 2019
     we have kept the 2019 rankings                   >-75%
                                                                           by number. Shading indicates
                                                                           attendance change at the ranked
     in place for the 2020 report.                                         park versus all other ranked parks.

48                                                                                         © 2020 TEA / AECOM      © 2020 TEA / AECOM                                                                                                            49
You can also read