Climate-Sensitive Mining: Case Studies - Background Paper for Building Resilience: A Green Growth Framework for Mobilizing Mining Investment ...
←
→
Page content transcription
If your browser does not render page correctly, please read the page content below

Public Disclosure Authorized
Public Disclosure Authorized

                                                                     Climate-Sensitive
Public Disclosure Authorized

                               INTERNATIONAL DE VELOPMENT IN FOCUS

                                                                     Mining: Case Studies
                                                                     Background Paper for Building
                                                                     Resilience: A Green Growth
                                                                     Framework for Mobilizing Mining
                                                                     Investment
Public Disclosure Authorized

                                                                     Sri Sekar, Kyle Lundin, Christopher Tucker,
                                                                     Joe Figueiredo, Silvana Tordo, and Javier Aguilar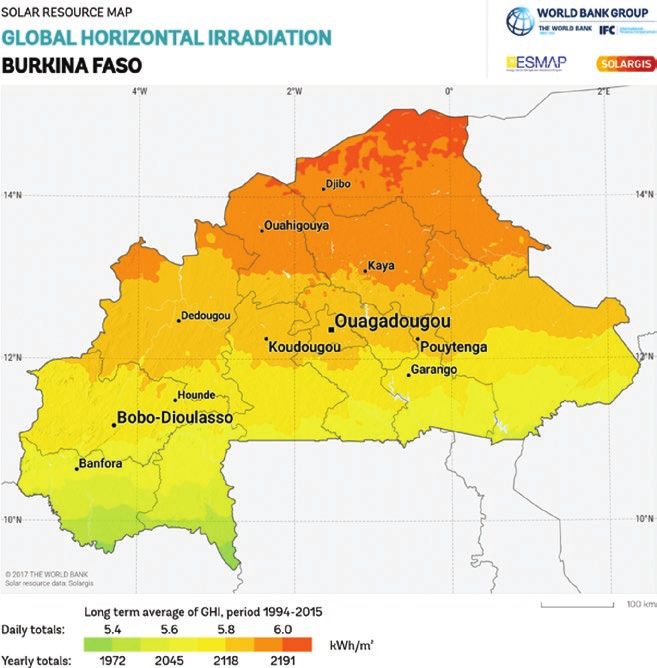
INTERNATIONAL DEVELOPMENT IN FOCUS Climate-Sensitive Mining: Case Studies Background Paper for Building Resilience: A Green Growth Framework for Mobilizing Mining Investment Sri Sekar, Kyle Lundin, Christopher Tucker, Joe Figueiredo, Silvana Tordo, and Javier Aguilar
© 2019 International Bank for Reconstruction and Development / The World Bank 1818 H Street NW, Washington, DC 20433 Telephone: 202-473-1000; Internet: www.worldbank.org Some rights reserved 1 2 3 4 22 21 20 19 Books in this series are published to communicate the results of Bank research, analysis, and operational experience with the least possible delay. The extent of language editing varies from book to book. This work is a product of the staff of The World Bank with external contributions. The findings, interpre- tations, and conclusions expressed in this work do not necessarily reflect the views of The World Bank, its Board of Executive Directors, or the governments they represent. The World Bank does not guarantee the accuracy of the data included in this work. The boundaries, colors, denominations, and other information shown on any map in this work do not imply any judgment on the part of The World Bank concerning the legal status of any territory or the endorsement or acceptance of such boundaries. Nothing herein shall constitute or be considered to be a limitation upon or waiver of the privileges and immunities of The World Bank, all of which are specifically reserved. Rights and Permissions This work is available under the Creative Commons Attribution 3.0 IGO license (CC BY 3.0 IGO) http:// creativecommons.org/licenses/by/3.0/igo. Under the Creative Commons Attribution license, you are free to copy, distribute, transmit, and adapt this work, including for commercial purposes, under the following conditions: Attribution—Please cite the work as follows: Sekar, Sri, Kyle Lundin, Christopher Tucker, Joe Figueiredo, Silvana Tordo, and Javier Aguilar. 2019. “Climate-Sensitive Mining: Case Studies: Background Paper for Building Resilience: A Green Growth Framework for Mobilizing Mining Investment.” Washington, DC: World Bank. License: Creative Commons Attribution CC BY 3.0 IGO Translations—If you create a translation of this work, please add the following disclaimer along with the attribution: This translation was not created by The World Bank and should not be considered an official World Bank translation. The World Bank shall not be liable for any content or error in this translation. Adaptations—If you create an adaptation of this work, please add the following disclaimer along with the attribution: This is an adaptation of an original work by The World Bank. Views and opinions expressed in the adaptation are the sole responsibility of the author or authors of the adaptation and are not endorsed by The World Bank. Third-party content—The World Bank does not necessarily own each component of the content con- tained within the work. The World Bank therefore does not warrant that the use of any third-party- owned individual component or part contained in the work will not infringe on the rights of those third parties. The risk of claims resulting from such infringement rests solely with you. If you wish to re-use a component of the work, it is your responsibility to determine whether permission is needed for that re-use and to obtain permission from the copyright owner. Examples of components can include, but are not limited to, tables, figures, or images. All queries on rights and licenses should be addressed to World Bank Publications, The World Bank Group, 1818 H Street NW, Washington, DC 20433, USA; e-mail: pubrights@worldbank.org. Cover photo: © weerapatkiatdumrong. Used with permission; further permission required for reuse. Cover design: Debra Naylor / Naylor Design Inc.
Contents

Acknowledgments  v
Abbreviations  vii

CHAPTER 1: Introduction  1
             Scope of this report   1

CHAPTER 2: Case Study Framework   3
             Thematic technology areas   3
             Benchmark metals and minerals   3
             Benchmark mineral processes   5
             Iron ore  8

CHAPTER 3: Case Studies  11
             Case Study 1: Gold   11
             Case study 2: Iron ore   16
             Case study 3: Copper   21
             Case study 4: Cement and aggregate   26
             Case snapshot: Critical raw materials and frontier minerals   28
             Notes  31

CHAPTER 4: Conclusion  33

BIBLIOGRAPHY       35

Boxes
2.1   Gold mining drivers   6
2.2   Copper mining drivers   7
2.3   Iron ore mining drivers   8
2.4   Cement production drivers   9
3.1   Economic drivers of IAMGOLD’s investment   15
3.2   Rio Tinto’s Mine of the Future   19
3.3   Notable example of mining automation   21
3.4   Freeport Cerro Verde economic drivers    24
3.5   Ambuja Cement economic drivers    28

                                                                                iii
iv | Climate-Sensitive Mining: Case Studies
Figures
2.1 Categorization of firms’ climate initiatives 4
2.2 Value chain and subsector heat map 4
2.3 CO2 emissions by commodity 5
3.1 Mining’s contribution to Australia 17
3.2 Iron ore employment profile 18
3.3 Australia’s potential gain from automation 19
3.4 Mine of the Future productivity gains 20
3.5 Peru’s export map 2016 22
Maps
3.1 Burkina Faso’s photovoltaic power potential 13
3.2 Countries with the largest supplies of CRM 29
Table
3.1 List of case studies in this chapter 11Acknowledgments
This report was commissioned by the World Bank’s Extractives-led Local
Economic Diversification (ELLED) Program: a knowledge program that sup-
ports inclusive growth in mineral and hydrocarbons rich countries through
innovation, long term competitiveness, and regional synergies.
This report is part of a series of background reports underpinning the report on
Building Resilience: A Green Growth Framework for Mobilizing Mining Investment,
which investigates potential for leveraging the mining industry to drive the uptake
of climate-sensitive technologies and practices in emerging and developing mar-
kets. The series includes four reports: Methodology and Value Chain Analysis,
Mining Firms’ Climate-Sensitive Initiatives, Climate Sensitive Mining: Case
Studies, and Policy Approaches to Climate Change in Mineral Rich Countries.
The research was undertaken by a team comprising Sri Sekar (Mining &
Energy Lead), Kyle Lundin (Mining & Energy Research Analyst), Christopher
Tucker (Mining Specialist), and Joe Figueiredo (Extractives Policy Associate), all
with Deloitte Consulting LLP, with the contribution and under the guidance and
direction of Silvana Tordo (Lead Energy Economist, World Bank), and Javier
Aguilar (Senior Mining Specialist, World Bank) who co-lead the ELLED Program.
The team would like to thank the Extractives Global Programmatic Support,
a multi-donor trust fund administered by the Energy and Extractives Global
Practice of the World Bank, for their financial support.
The comments of peer reviewers Jonathan Coony (Senior Private Sector
Specialist, World Bank), Sven Renner (EGPS Program Manager, World Bank),
Alberto Criscuolo (Senior Private Sector Specialist, World Bank), and Michael
Stanley (Global Lead, Extractives, World Bank) are gratefully acknowledged.
Comments were also provided by Kirsten Lori Hund and Daniele La Porta
(Senior Mining Specialists, World Bank) and Thao P. Nguyen (Consultant).
Editorial support was provided by Isabella Lacsamana.
Special thanks go to Barrick Gold,1 Goldcorp, Newmont Mining, Anglo
American, and IAMGOLD for their cooperation.
vvi | Climate-Sensitive Mining: Case Studies
NOTE
1. A merger between Barrick Gold Corporation and Rangold Resources Limited was com-
pleted on January 1, 2019. The new company continues to be known as “Barrick.”
All references to “Barrick” or “Barrick Gold” or “Barrick Gold Corporation” in this report,
refer to the activities and actions of Barrick Gold Corporation prior to the January 2019
merger and do not necessarily reflect the actions or activities of the newly formed
company, Barrick.Abbreviations
ACF Ambuja Cement Foundation
AEMP African Energy Management Platform
AUS Australian dollar
BF-BOF blast furnace/basic oxygen furnace
BMW Bavarian Motor Works
CAD Canadian dollar
CAPEX capital expenditure
CDP Carbon Disclosure Project
CO2 carbon dioxide
CRM critical raw materials
DRC Democratic Republic of Congo
EAF electric arc furnace
ELLED Extractives-Led Local Economic Diversification
FDI foreign direct investment
FPO farmer producer organization
GAO U.S. Government Accountability Office
GDP gross domestic product
GHG greenhouse gas
GPS Global Positioning System
GSP gross state product
GVA gross value added
HFO heavy fuel oil
ICMM International Council on Mining & Metals
IFC International Finance Corporation
IRENA International Renewable Energy Association
kWh kilowatt hour
MNRE Ministry of New and Renewable Energy
MT metric tonne
MW megawatt
NOAA National Oceanic and Atmospheric Association
OPEX operating expenditure
PPA power purchase agreement
PPP public private partnership
PV photovoltaic
viiviii | Climate-Sensitive Mining: Case Studies
SAG semi-autogenous grinding
SEDAPAR Servicio de Aqua Potable y Alcantarillado de Arequipa
UN United Nations
USD United States dollar
USGS United States Geological Survey1 Introduction
The mining industry is one of conflicting identities. Mining firms can add
tremendous value to the resource-rich countries where their mines operate but
also to their shareholders. Further, the industry extracts and ferries to the m
arket
many of the raw materials that are crucial to industrial and economic progress
around the world, creating a magnifying effect to its added value to global GDP.
However, the nature of mining activity itself—extracting and processing metals
and minerals for commercial use—produces a substantial portion of global
greenhouse gas (GHG) emissions, and as such burdens those same beneficiaries
of firm value with externalized, unaccounted for, costs. This makes the industry
a significant opportunity for broad-based climate improvement in an era where,
with the global adoption of the Paris Climate Accords, the world has placed
renewed emphasis on mitigating the effects of climate change while keeping the
increase in global average temperature below 2°C above pre-industrial levels.
SCOPE OF THIS REPORT
This report is part of a more comprehensive study intended to investigate the
potential for leveraging the mining industry to drive the uptake of climate-
sensitive technologies and practices in emerging and developing markets. The
study includes four background reports—Methodology and Value Chain
Analysis, Mining Firms’ Climate-Sensitive Initiatives, Climate Sensitive Mining:
Case Studies (this report), and Policy Approaches to Climate Change in Mineral
Rich Countries—and an overview report on Building Resilience: A Green Growth
Framework for Mobilizing Mining Investment.
This report is intended to deliver an account of mining technologies, pro-
cesses, and strategies that seek to incorporate new, green technologies that have
the potential to diversify local and national economies where the mine operates.
This report is not intended to provide an ordered ranking of industry trends,
mine sites, or the companies engaged in these operations. An analysis of that
nature would likely not produce a sufficiently diverse set of case studies to pro-
vide an industry-wide perspective. As a result, in selecting the case studies the
report prioritizes comprehensiveness and diversity.
12 Case Study Framework
THEMATIC TECHNOLOGY AREAS
The Methodology and Value Chain Analysis (Sekar et al. 2019) report analyzed
certain processes and technologies being implemented by mining firms. These
were ranked on a two-dimensional scale of (a) Climate Impact and (b) Ease of
Implementation (figure 2.1). The confluence of these two factors indicates green
mining practices that are scalable and have a propensity to contribute to the
development of new green value chains in a host country’s economy. Among
these activities, the following three overarching thematic areas that rank highly
on both axes were selected for detailed analysis and are discussed in this paper.
• Renewable Energy
• Water Management
• Automation & Transportation
These thematic areas cover some of the climate-sensitive activities in which
mining firms are currently engaged that are not only contributing the most
impact but are also eminently deployable at the mine site.
BENCHMARK METALS AND MINERALS
This report incorporates specific elements of the Methodology and Value Chain
Analysis report such as the Value Chain and Subsector Heat Map (figure 2.2),
which identifies climate-related pressure points across the mining industry
value chain within specific industry subsectors (i.e., mineral categories).
34 | Climate-Sensitive Mining: Case Studies
FIGURE 2.1
Categorization of firms’ climate initiatives
Wind and solar technology
Ambitious Conversion to pump Most effective
storage
Bioleaching Digital energy
Water management management
Electrification of mining equipment and fuel conversion
Processing
Carbon sequestration Haul truck idle management
Climate impact
optimization
Tailings management
Alternative material movement
Engineering design enhancements
Climate modeling and
risk assessment
Strategic GHG
Mine closure initiatives reduction
framework
Challenging Quick wins
Mine land use
planning
Ease of implemenation
Adaptation initiative Mitigation initiative
FIGURE 2.2
Value chain and subsector heat map
Other/construction
Gold Base/copper Iron ore
mineral
Exploration/drilling
Ore grade/recovery
Mine design/
Hazardous/harsh environment potential
planning
Small scale/artisanal mining
Tailings/alluvial
Underground mining potential
Closure and decommissioning
Blasting/extraction
Extraction
Digging/excavation
Ventilation
Dewatering/suction
Crushing
Processing
Grinding
Separations
Final processing (roasting, smelting, refining)
Diesel equipment
handling/
Materials
equip.
Electric equipment
Pumps
Intensity
Water risk
intensity
and
Risk
Legend: High Medium Low
PriorityCase Study Framework | 5
This report prioritizes trends and mine operations based on the benchmark
minerals identified in figure 2.2. For example, mining operations producing a
benchmark mineral with potential to contribute to low-carbon value chains,
over mined fuels such as coal or uranium. One case study is presented for each
benchmark metal or mineral identified in the methodology report, namely Gold,
Iron Ore, Copper, and Aggregate/Cement.
As a forward-looking element the report includes a note on frontier minerals
some of which the European Commission labels as “critical raw materials”
(CRM) (European Commission 2017). Frontier minerals are those metals and
minerals that stand to play a substantial role in the future commodity landscape
and are projected to be in increasingly high demand while simultaneously facing
a stressed supply chain. Examples of materials that would fall under this defini-
tion are cobalt, lithium, and rare earth elements.
BENCHMARK MINERAL PROCESSES
Mining and mineral processing is an energy intensive activity that currently uses
about 8 percent of the total global energy supply (van der Voet 2013). As such, the
mining and downstream processing industries are significant contributors to
global greenhouse gas emissions (figure 2.3). Nevertheless, mineral inputs are
critical to the development of renewable energy technologies that help reduce
energy related GHG emissions. As accessible, high-grade deposits have been
largely exhausted over the last century, miners are moving further afield and
working lower-grade deposits. This trend only increases the amount of energy
used in hauling rock and processing ore. The current processes for mineral
extraction and refining present a large opportunity for technological transfor-
mation to low-carbon production methods—many of which were identified in
FIGURE 2.3
CO2 emissions by commodity
60,000
50,000
40,000
38,100
30,000
Tonnes CO2 e/tonne
20,000
10,000
1,000
30
20 16.5
10 4.5 4.0 2.3 1.3 0.2
0
Gold Aluminium Copper Zinc Steel Lead Coal
Source: World Gold Council 2018 (https://www.gold.org/goldhub/research/gold-and
-climate-change-introduction).6 | Climate-Sensitive Mining: Case Studies
the Methodology and Value Chain Analysis report. Developing electrified min-
ing equipment, shifting to renewable energy sources, and changing mineral pro-
cessing and mine waste management practices can reduce some of the climate
and water impacts from mining as the industry continues to facilitate the shift
toward a low-carbon global economy. While new solutions to these challenges
are emerging throughout the mining and mineral processing landscape, not
every solution is equally applicable to every operation. Mining and processing
operations vary significantly by the metals and minerals produced as well as
across geographical regions. Understanding the specific climate change risks
and opportunities associated with the various types of mineral extraction and
processing operations is important. However, as a report from the United Nations
Environment Program cautions:
Important knowledge is still missing in the linkages that exist between
different types of resources: metals, energy, water, and maybe others. This
refers both to the resources needed in the chain of the metals (e.g., energy for
refining) and to the fact that metals are in some cases mined as a by-product
of other materials (mostly other metals, but sometimes other materials,
e.g., mercury production from natural gas). In scenario explorations for the
future, this is essential knowledge. It requires an interdisciplinary approach
and the cooperation of researchers from different fields to build up this type
of knowledge. (van der Voet 2013)
This section reviews the current state of knowledge with respect to climate
change risks and opportunities particular to each benchmark metal and
mineral.
Gold
There are many unique aspects to gold mining but three notably worth high-
lighting (box 2.1). First, due to its high value and relative scarcity, gold can be
economically extracted in very low ore grades (e.g., below 1 gram of gold per
tonne of ore), depending on global prices, resulting in relatively high volumes
of material mined and waste generated. Second, large scale mining of
the refractory ores (i.e., ore from which is it more challenging to extract gold
due the presence of other minerals) requires more energy- and reagent-
intensive processes. As such, it can increase the acid-generating potential of
waste products as well as liberate harmful metals
BOX 2.1 such as arsenic into the environment. Third, gold
mining uses large amounts of water for processing,
Gold mining drivers dust suppression, and for maintaining tailings waste
ponds.
• Extraction can be economical even when the ore
Recognizing the climate implications stemming
grade is extremely low
from gold extraction, industry, governments, and
• Chemicals used and released in the extraction
non-government entities are seeking to adopt policies
and processing of gold can end up contaminating
and techniques which can address these challenges.
ecosystems if not managed effectively
Technology areas that may be particularly applicable
• Water use in traditional processes for mining
to gold in light of the above processing nuances include
and refining gold is high
integrating renewable energy, bioleaching, and water
management.Case Study Framework | 7
Copper BOX 2.2
Compared to gold and other precious metals, copper is
relatively abundant in the earth’s crust. Box 2.2 summa- Copper mining drivers
rizes the drivers of copper mining. Copper is classified
• Most copper mines are large, low grade, open pits.
as a base metal (along with nickel, zinc, aluminum, lead,
• A large part of operating costs come from energy
etc.) and is widely used in many manufacturing indus-
use associated with moving ore and waste rock
tries due to its high conductivity and relatively low cost.
as well as mining and mineral processes.
Total global copper production from mining was
• Copper play a fundamental role in the
approximately 22.5 million metric tons in 2016. Major
electrification of industry and transition away
copper producing countries include Chile, China, and
from fossil fuels.
Peru, with Chile having the world’s largest copper
reserves and accounting for almost one third of global
production (USGS 2018).
In copper mining, energy use accounts for a significant amount of operating
costs and is the main source of GHG emissions. These operations’ GHG emis-
sions are primarily scope 1 emissions associated with the burning of diesel or
other liquid fuels to move ore and waste rock, and scope 2 emissions from elec-
tricity use in mining and mineral processing. Approximately 80 percent of cop-
per comes from sulphide ores that are processed using grinding and flotation
plants to produce concentrates for smelting (Reemeyer 2016). The remainder
comes from mines using heap leaching, solvent extraction and electrowinning to
make copper cathode (Reemeyer 2016). Most copper mines are large, low grade,
open pits. Typically, these operations process over 50,000 tonnes per day of ore
with copper head grades below 1 percent, and sometimes as low as 0.3 percent
(Reemeyer 2016). For sulphide ores, electricity is used for crushing and grinding,
pumping water and slurries, and operating flotation machines (Reemeyer 2016).
For oxide ores, electricity is used in crushing, conveying, pumping solutions, and
electrowinning copper metal (ICSG 2018).
Given the copper’s abundance within the earth’s crust, compared to precious
metals such as gold and silver, copper can be mined at a higher grade. As such,
less ore and waste rock need to be moved and processed per unit of metal pro-
duced. Thus, the overall GHG intensity associated with copper production is
lower than that of gold and other precious metals. Nevertheless, the same prin-
ciples of electrification of mining equipment, alternative material movement
(e.g., conveyors over haul trucks), and use of renewable energy sources apply to
the production of copper. In addition, because of the relative high volume of
copper production, such efforts will significantly contribute to reduction in
global GHG emissions.
Given its use in wiring and electrical delivery, copper has a fundamental role
to play in the electrification of industry and the transition away from fossil fuels.
Electric vehicles are projected to significantly increase their share of both the
industrial and consumer markets and the copper requirements of electric vehi-
cles are estimated to be approximately 3–4 times those of traditional vehicles.
Hence, copper’s role is expected to grow (ICSG 2018). Since copper is common
to established and emerging technologies, it represents a mineral that lends itself
to establishing local value chains. Whereas, emerging critical minerals such as
lithium, cobalt and rare earths require relatively specialized industries and tech-
nologies, copper’s use is near universal. As such, developing copper value chains
in copper-rich regions presents a relatively straightforward route towards8 | Climate-Sensitive Mining: Case Studies
enhancing local economic development while addressing climate change. For
example, when a mine such as Goldcorp’s Borden project creates a demand among
local equipment suppliers for electrified mining equipment, expertise is
established in the region. In c opper-producing countries this demand holds the
potential to make use of existing copper products such as concentrate or copper
metal. Developing the intermediate value chains for electric motors (e.g., wire pro-
duction and components) would require a strategic outlook by both governments
and local business.
IRON ORE
Iron is the most used metal globally, primarily in the production of steel, and
makes up approximately 5 percent of the earth’s crust (Royal Society of
Chemistry). Box 2.3 summarizes the drivers of iron ore mining. Due to this very
high level of production, the iron and steel industry is the largest energy consum-
ing manufacturing sector and the second-largest industrial consumer of energy,
after the chemical sector, producing 5 percent of global GHG emissions (Global
Network for Climate Solutions 2012). Of the multiple iron-forming minerals,
hematite (Fe2O3), is the most abundantly found and also among the highest
grade. Due to its relative abundance and comparatively low price per tonne, iron
ore must be mined in large deposits to be commercially viable. This also rarely
justifies the expense of “digging deep” to access an ore body, no matter how high
the grade, due to the volume of material that must be captured to sustain a mar-
gin. As a result, most of the world’s successful iron ore mines are close to the
surface in large, open pits that cover large amounts of land.
This involves a substantial excavation process to move tonnes of earth after it
is loosened through blasting or drilling. At a high level, the iron ore extraction
and processing flow involves the following processes:
• Excavators and wheel loaders often collect the ore and transport it out of the
pit, where trucks take the ore to be crushed and processed.
• Crushing is the first stage in iron ore processing, taking the raw ore and break-
ing it into pieces that range from only a few millimeters in length to the size
of a football.
• Trucking or use of conveyor belt to the processing plant, which sorts and
washes the ore until it can be pelletized.
• Pelletization is a process that uses the powder from
the extraction process that, until recently, was con-
BOX 2.3
sidered waste, to bind and collate loose ore into
Iron ore mining drivers small balls of iron ore to be used in the steel produc-
tion process.
• Due to its relative abundance and comparatively • Storage of processed pellets in a dry stockyard in
low price per tonne, iron ore must be mined in large piles prior to being loaded onto rail cars and
large deposits to be commercially viable. transported to a port to be sent to market.
• Most iron ore mines are close to the surface,
The next step, steel production, includes both pro-
large open pits.
duction from raw iron ore and recycling of scrap metal.
• Iron ore is primarily used in the making of steel.
Recycling of steel strongly affects the energy perfor-
The iron ore and steel industry generates
mance of the sector as a whole, since steel produced
5 percent of global GHG emissions.
from scrap requires considerably less energy than
steel produced from iron ore.Case Study Framework | 9
Steel plants are divided into two general categories according to their major
source of metal. Plants that produce steel from iron ore using a blast furnace/
basic oxygen furnace (BF-BOF) process are referred to as integrated plants. Plants
that produce steel by melting steel scrap in the electric arc furnace (EAF) process
are referred to as EAF plants. To produce one tonne of crude iron (“pig iron”)
requires 1.5 tonnes of iron ore and about 450 kilograms of coking coal (Accrue
Group Holdings). This latter process using carbon as reducing agent results in
approximately 2.8 tonnes CO2 per tonne of steel (Watson et al. 2008). By shifting
iron ore production to use hydrogen as a reducing agent, a significant amount of
the process emissions from iron ore production could be reduced (Kundak, Lazić,
and Črnko 2009).
Cement and aggregate
Cement and its key ingredient, aggregate, are ubiquitous throughout the world.
The drivers of cement production are summarized in box 2.4. Aggregate com-
prises mostly of rocks and sediment and is a highly local industry as it is available
nearly everywhere. Cement is primarily used in the production of concrete and
is one of the most common and important construction materials in the world.
Concrete is a mixture of mineral aggregates, such as sand, gravel, crushed stones,
and cement. Cement consumption and production is tied to construction and
correlates to economic activity in general.
Cement production accounts for approximately 6 percent of global GHG
emissions (Harvey 2018). The widespread availability of raw materials required
for cement production combined with high transport costs relative to cement’s
value result in little international trade in cement. As of 2011, 96 percent of
cement production stayed within the country of production (Armstrong 2012).
Thus, cement is generally consumed close to where it is produced.
The majority of CO2 emissions from cement production are process emis-
sions from the conversion of limestone to lime in the production of clinker.
The second source of emissions is the burning of fossil
fuels to generate the energy required to heat the raw BOX 2.4
ingredients to over 1,000 degree Celsius. Initiatives
such as clinker substitution directly reduces the ther- Cement production drivers
mal energy and process carbon emissions associated
• Cement and its key ingredient aggregate are
with the production of this intermediate product for
widely available.
the same amount and quality of final cement produced
• Compared to other industries, cement has the
(IEA 2017).
highest logistics cost as a percentage of sales.
Improved grinding technologies also present
Hence, 96 percent of global cement production
opportunities for energy efficiency in cement manu-
remains within the country of production
facturing. Efficient grinding technologies (e.g., roller
(Armstrong 2012).
presses and vertical mills) offer significant improve-
• Energy represents 20 to 40 percent of the total
ments over traditional ball mills. Electricity savings in
cost of cement production (Climate Technology
grinding cement would benefit the overall energy
Centre & Network).
efficiency of the manufacturing process (IEA 2017).3 Case Studies
The following case studies are organized by the key benchmark metals and min-
erals outlined in the methodology report. They are intended to be comprehen-
sive, not exhaustive, and represent a high-level overview of the sites operations
with the potential for replication. The case studies were selected for their geo-
graphical diversity, their technological relevance, and their relevance to driving
green growth. Table 3.1 below outlines the minerals, technologies, geographies,
and companies that are covered by the case studies presented in this chapter.
Each company profiled in the case studies was contacted for corroboration and
confirmation of facts. Feedback was received from Goldcorp, IAMGOLD, Anglo
American, Barrick Gold, and Newmont Mining.
CASE STUDY 1: GOLD
Gold has been mined and used to make goods and as currency for thousands of
years. Countries with known resources often stand to reap significant economic
benefits from extraction. In 2015, over 60 percent of the 30 largest gold produc-
ing countries globally were categorized as low or lower-middle income coun-
tries (World Gold Council 2015).
Countries can collect significant direct and indirect gross value added (GVA)
from mining companies operating in their jurisdictions. Direct value to
TABLE 3.1 List of case studies in this chapter
BENCHMARK MINERAL TECHNOLOGY AREA COUNTRY COMPANY
Gold Energy Efficiency and Burkina Faso IAMGOLD Corporation
Renewable Energy
Iron Ore Automation and Australia Rio Tinto
Transportation
Copper Water Conservation Peru Freeport-McMoRan
and Infrastructure
Cement/Aggregate Energy Efficiency and India Ambuja Cement
Renewable Energy
1112 | Climate-Sensitive Mining: Case Studies
Case 1 Snapshot
Gold Renewable Energy
IAMGOLD Burkina Faso
To tackle a technical challenge requiring reliable and competitive source of energy in
its Essakane gold mine, IAMGOLD teamed up with Total EREN and AEMP to build the
world largest hybrid solar-thermal plant. The plant started operations in March 2018.
Support from the Government of Burkina Faso has been instrumental in making this
project viable and bodes well for similar future projects. Developing renewable energy
assets and skillsets in a nascent power sector can trigger knock-on economic and
human capital development.
governments from gold mining companies, in the form of corporate taxes and
royalties, is far outweighed by the 70 percent indirect value gained through taxes
on payments to domestic suppliers (e.g., fuel), contractors, and employee salaries
(i.e., payroll tax) (World Gold Council 2015). Other benefits can be realized
throughout a country’s mining value chain when industry pursues local procure-
ment of goods and services. Of the largest global gold producers, lower income
countries in Africa and Asia r ealized the most GVA to national GDP from gold
mining from 2003 to 2013 (World Gold Council 2015).
The importance of gold to Burkina Faso
Burkina Faso is the fourth largest African producer of gold, behind Mali and
Ghana, with as much as 55 tonnes produced in 2018, an increase of approxi-
mately 66 percent from 2012 (Cocks and Aboa 2018). This underlies the gold
mining industry’s importance to the Burkinabé economy.
According to the International Council on Mining and Metals (ICMM)
Burkina Faso’s economy is the third most dependent country on the mining
industry in the world, ranking just behind Mauritania and the Democratic
Republic of Congo (DRC) (ICMM 2017).
While the country also retains significant zinc and manganese deposits, S&P
Market Intelligence estimates that the vast majority of active, non-artisanal min-
ing operations in Burkina Faso are predominantly gold-producing. In the past
decade, gold has replaced cotton as the country’s largest export, with gold
responsible for more than 71 percent of exports by value in 2013, according to the
U.S. Geological Survey (Burmúdez-Lugo 2016).
A dominant gold sector within an economically vital extractive industry makes
Burkina Faso’s economic landscape highly sensitive to changes in the manner in
which gold is extracted, processed, and produced, in addition to highly suscepti-
ble to demand and price fluctuations. Adaptations to processing technology, pro-
duction techniques, or advances in energy generation or use related to mining
firms’ activities could have a large effect on the Burkinabé economy. Policy and
regulatory changes that influence the adoption of new mining processes and
technology would necessarily have a far-reaching impact on economic advance-
ment and have the potential to trigger the localization of new value chains.
The importance of renewable energy to Burkina Faso
Even compared to other West African countries, Burkina Faso’s power sector
is nascent. The national electricity grid stops more than 300 kilometers from
the Essakane site and there are no connecting transmission lines.Case Studies | 13 Generation options are limited, with fossil fuels responsible for approximately 86 percent of Burkina Faso’s install electricity capacity while the country is forced to import nearly all of the fossil fuel consumed (CIA 2018). It is esti- mated that approximately 1 percent of the rural population is reliably electri- fied (CIA 2018). In an effort to foster sector growth, the national government, through the Ministry of Mines and Energy, has drafted and implemented a handful of renewable-friendly policies and made a push to expand the coun- try’s renewable portfolio, including recently commissioning the Zagtouli solar PV plant near the capital city of Ouagadougou, a 33 MW f acility that is expected to provide 5 percent of the country’s generation needs (ESI Africa 2018). The economically additive nature of the renewable energy industry is particu- larly acute in Burkina Faso, where there are no naturally occurring fossil fuel resources and where the balance of jobs existing in industry has outpaced the num- ber of jobs in agriculture only within the last few years. Replacing imported fuel resources, and their respective jobs abroad, with locally developed renewable energy resources could create an entirely new technology and employment base in-country. Further, Burkina Faso’s potential for renewable energy success is high, with a strong solar radiation profile (map 3.1) receiving direct sunshine for more than 3,000 hours annually and stands to facilitate the country’s case for PV invest- ment (Bellini 2018). MAP 3.1 Burkina Faso’s photovoltaic power potential Source: World Bank Group, https://globalsolaratlas.info/downloads/burkina-faso.
14 | Climate-Sensitive Mining: Case Studies
Adding renewable energy capacity offers a stable and scalable alternative to
traditional generation options that can be erected in off-grid locations or where
there is “bad grid,” where the community is connected to the grid, but the ser-
vice is so unreliable or expensive that they operate as if they are not connected
to the grid. The national government has recognized this potential and has com-
mitted to making renewable generation a significant part of their push to
improve electricity access in rural and urban areas by 2025 (World Bank 2017).
To accomplish this goal and take advantage of the country’s unique suitability to
solar photovoltaic generation technology, the national government has unveiled
plans to erect eight solar parks for a combined generation capacity of 100 MW
(Bellini 2018).
IAMGOLD’s Essakane operation
Essakane
IAMGOLD IAMGOLD’s Essakane mine is the largest single gold
Gorom Gorom mine in Burkina Faso, producing more than 430,000
ounces of the more than 1.4 m ounces produced
nationally in 2017. 1 This single site accounts for
approximately one third of annual Burkinabé gold
Ouagadougou
production. Given gold’s prominent role in Burkina
Faso’s economy and Burkina Faso’s renewable energy
potential, IAMGOLD’s Essakane gold mine rep-
resents a compelling snapshot of how the interests of
the mining industry and the benefits of green eco-
Burkina
nomic growth and economic diversifications oppor-
Faso tunities associated with the renewable energy
industry are aligned.
IAMGOLD understood that, due to the mine’s
remote location and the fledgling state of the Burkinabé
power sector, Essakane would have to generate its own power. This was no small
feat, as the processing facilities, with multiple production lines, primary and sec-
ondary crushers, SAG and ball mills, and leach tanks. To generate the amount of
electricity required to power a system that processed more than 12 million
tonnes of ore annually, IAMGOLD constructed a 57 MW thermal plant. This
type of generation is a proven standard for large mining or industrial operations
and relies on heavy fuel oil (HFO)—a notoriously high-carbon and inefficient
fuel type formed as a derivative of other fuel refining processes that yields
approximately 1 kWh for every 11 liters consumed—to provide the generation
capacity (SEAI 2017). Due to supply strain constraints and the isolated nature of
the mine site in the Essakane case, utilizing HFO meant trucking fuel in over
hundreds of kilometers from neighboring countries Benin and Togo.
This arrangement required more than 130 haul trucks to drive more than
1,400 kilometers to transport millions of liters of HFO on an annual basis.2
IAMGOLD’s decision to construct a solar generation facility was prompted
by increasing power demand to process harder ore. Relatively soon after the
mine was commissioned deeper pits struck a higher proportion of harder rock.
This harder ore took longer to grind and crush than the anticipated softer rock,
a process that can demand three-to-four times more electricity to process than a
softer ore body. Responding to this obstacle, the mine’s energy consumption
jumped from 14 GWh/month in 2013 to 26 GWh/month in 2015, significantly
increasing the mine’s HFO consumption to generate the required power.Case Studies | 15
From 2013 on, the mine looked at multiple options to BOX 3.1
add additional generation, including connecting to the
national grid, to reduce its dependency on HFO Economic drivers of IAMGOLD’s
(IAMGOLD 2017).
investment
By 2015, solar PV generation had become rela-
tively affordable, on par with traditional fossil fuels, • 90 million liters of HFO saved over 15 years
and renewable energy emerged as IAMGOLD’s pre- • 40 percent reduction in the price of power
ferred power source. The company was concerned, compared to HFO
however, that the intermittency of solar power could • ~$100 million saved from reducing the amount
result in supply interruptions and jeopardize their of HFO purchased
continuously-running processing operation.
IAMGOLD determined that a 15 MW hybrid
solar-thermal plant would be the appropriate solu-
tion to reap the cost savings and environmental benefits of solar while ensuring
that the solar-thermal integration did not compromise the power supply’s
reliability.
To IAMGOLD, the economic considerations justifying this additional expense
were clear (box 3.1): integrating solar power to their existing thermal asset
improved energy reliability by reducing the mine’s dependency on imported
HFO and reducing fuel costs associated with the purchasing approximately 90
million liters of HFO over the expected 15-year life of the Essakane hybrid plant.
At the current spot price of approximately $500 per ton, this corresponds to
more than $100 million in fuel savings over the life of the generation asset, not
including savings on logistical expenses associated with trucking HFO in from
abroad. Further, prior to the plant coming online, HFO power accounted for
approximately 14 percent of Essakane’s operating costs (IAMGOLD 2017).
Compared to thermal costs of between $0.30/kWh and $0.19/kWh over the 5 years
prior to the plant’s construction, the solar plant is expected to produce power at
a rate of $0.17/kWh for the first year and average $0.18/kWh going forward, sav-
ings of up to 40 percent (IAMGOLD 2017). In this context, IAMGOLD moved
forward with the project sponsor, Total Eren, a global renewable energy inde-
pendent power producer, and AEMP, a developer and independent power pro-
ducer, to add solar capacity to its existing power system.
For Burkina Faso, there was an immediate economic benefit and longer term
strengthening of the renewable energy value chain stemming from this installa-
tion. The Essakane site is the largest private employer in the country, deriving
more than 95 percent of its 2,000+ employees from the local population
(IAMGOLD 2014). At the time of its opening, the Essakane mine represented the
largest private foreign investment in the history of Burkina Faso (IAMGOLD
2010). The Essakane hybrid solar-thermal plant opened in March 2018 and is
playing a role in establishing and strengthening local technical expertise in
renewable energy. The recent commissioning of another large solar installation
in Burkina Faso, the Zagtouli plant, serves a tangible example of the potential for
deployment of the technical skillsets set in motion by Essakane. In addition to
hiring 70–120 contractors for the project’s construction phase, IAMGOLD com-
mitted to securing approximately 40 locally-held operational jobs at the solar
plant over the 15-year life of the asset (IAMGOLD 2017). This not only creates
short term local jobs and skillsets but builds long term renewable energy-related
skillsets in Burkina Faso well into the future, a key consideration when the
national government plans to make renewable generation at least 50 percent of
its energy mix by 2025.316 | Climate-Sensitive Mining: Case Studies
CASE STUDY 2: IRON ORE
Case 2 Snapshot
Iron Ore Automation
Rio Tinto Australia
Increasing the degree of automation in mining activities, including material
movement, has both improved efficiency of mining operations and created an avenue
to diversify Australia’s economy into high-tech areas; including monitoring and
operation of automated vehicles and logistics systems.
Iron ore represents the second largest commodity market in the world behind
crude oil and is integral to the global economy. The commodity has a primary
role in the production of everything from daily-use household items to large
industrial projects. Iron ore is a high-volume commodity, requiring large mining
operations to extract enough of the metal to make the comparatively narrow
margin. Due to its high volume nature and that it is often not profitable to dig
deep into the earth, even compared to other metals, developing iron ore assets
requires high up-front CAPEX (Blas, O’Murchu, and Bernard 2010). This is due
to the amount of processing infrastructure required, the large tracts of land cov-
ered to extract enough ore to have a commercially viable business, and the neces-
sity of having a well-developed pit-to-port supply chain. Companies must be
capable of moving millions of tonnes on an annual basis across increasingly large
distances using a variety of machinery and methods. Due to these conditions
iron ore is, perhaps more so than other commodities, uniquely matched to the
promise of automated operations.
In the coming decades it is estimated that nearly 50 percent of all jobs
currently performed manually could be subject to automation (Economist 2018).
The mining industry will be at the center of this transformation—where the
traditional transportation of ore, waste, and processed metals is highly labor,
energy, and emission intensive. While this technological shift represents a possi-
ble cost savings for miners by energy efficiency, reducing transportation-related
carbon emissions, and curbing waste, it also stands to dramatically change the
landscape of the modern workforce, both for the mine and the economy of the
host country, where automation is an opportunity to modernize the economy at
large by creating new, greener value chains.
The importance of iron ore to Australia
Australia is among the most successful mining economies in history and perhaps
no single mineral or metal is more integral to that success than iron ore. In 2015,
Western Australia produced 741 million tonnes of iron ore, approximately
37 percent of global production and second only to China’s production levels
(Government of Western Australia 2017). The Pilbara region in the state of
Western Australia produces more than 98 percent of the country’s iron ore
(Government of Western Australia 2017). This not only makes Western Australia
one of the richest iron ore veins in the world but indicative of Australia’s mining
industry at large and a key driver of Australia’s national and state economies
(figure 3.1).
Total mining production accounted for approximately 8 percent of national
GDP in 2015 (Frydenberg 2015). The national economy and iron ore areCase Studies | 17
FIGURE 3.1
Mining’s contribution to Australia
100 100
80 80
Dollars, billions
60 60
Percent
40 40
20 20
0 0
1996–97 2001–02 2006–07 2011–12 2016–17
Gross value added (nominal) Mining share of GSP (%)
Western Australia share
of Australian mining (%)
Source: Government of Western Australia, Department of Mines, Industry Regulation and
Safety (https://www.jtsi.wa.gov.au/docs/default-source/default-document-library
/wa-economic-profile---september-20187cfa10a57ba2628e86e4ff0000981137
.pdf?sfvrsn=5e0d721c_6 https://globalsolaratlas.info/downloads/burkina-faso).
Note: GSP = Gross State Product.
intertwined to such a degree that a US$10 swing in the commodity’s spot price
could increase or decrease national GDP by as much as US$12 billion (approx-
imately .01 percent of total GDP) according to projections from the Australian
Treasury for the 2019–20 calendar year (West Australian 2018). Western
Australia accounts for the lion’s share of Australia’s iron ore production and
approximately 13 percent of national GDP. Royalties alone accounted for
18 percent of the state’s total government revenue in 2017 (Government of
Western Australia 2018). The mining sector’s share of the Gross State Product
(GSP) has increased significantly since the late 1990’s, with its total contribu-
tion now hovering around 30 percent of GSP (Government of Western
Australia 2018).
In Western Australia, the iron ore industry represents significant share of the
state’s mineral sector employment accounting for approximately 50 percent of
all mining jobs (figure 3.2) (Government of Western Australia 2017). Overall, the
mining industry accounts for approximately 2 percent of national employment,
compared to healthcare, the largest sector, which accounts for approximately
13 percent of the job market (Parliament of Australia 2018). Due to its centrality
to the economy of Western Australia, the iron ore sector would be particu-
larly sensitive to policies aimed at supporting the development of a green econ-
omy pursued by the local and national governments. Given this dynamic between
the state and the sector, targeted green industrial policy enacted by the state may
be able to leverage the sector for further diversifying the economy beyond min-
ing. This logic holds true for Australia at large, as there is likely no single mineral
or metal in Australia’s mining economy that so heavily influences the national
economic tenor to the same degree as iron ore.18 | Climate-Sensitive Mining: Case Studies
FIGURE 3.2
Iron ore employment profile
120,000
100,000
Direct employment
80,000
60,000
40,000
20,000
0
1995 1998 2001 2004 2007 2010 2013 2016
Iron ore Rest of minerals mining
Source: Government of Western Australia Department of Mines, Industry Regulation,
and Safety (https://www.jtsi.wa.gov.au/docs/default-source/default-document-library
/wa-iron-ore-profile---august-2017.pdf?sfvrsn=2).
The importance of automation to Australia
Some analysts estimate that nearly 60 percent of fuel waste in the trucking indus-
try is due to driver over-acceleration (Morris 2015). According to industry analysts,
manual transportation systems, including cars, trucks, and rail systems, are starkly
inefficient compared to automated systems. The Smithsonian Institute, for exam-
ple, by merely equipping their fleet of more than 1,000 cars with GPS tracking
systems and wireless communications to enable better fleet management, reduced
fuel consumption by more than 50 percent (Pyper 2014). This has a corresponding
impact on not just cost savings, but the amount of GHG emitted by automated
vehicles compared to manually driven vehicles, with some reports estimating that
widespread adoption of automation technology in transportation systems could
reduce global GHG emission by upwards of 50 percent in 2050, should the neces-
sary societal and technology steps be taken (Fulton, Mason, and Meroux 2017).
With approximately half of all existing jobs susceptible to automation and a
renewed emphasis on climate-conscious policies and activities, these timelines
coalesce to affirm that the jobs of tomorrow will likely not resemble the jobs of
today (The Economist 2018). Value chains—the technical skillsets, infrastruc-
ture requirements, and logistical capabilities—are likely to reflect these market
adaptations. But, according to a research by AlphaBeta, industry’s adoption of
automation in Australia has been timid (AlphaBeta 2018).
A report commissioned by Google and authored by economic consultancy
AlphaBeta estimated that widespread adoption of automation technology could
lead to as much as a $2.2 AUS trillion benefit to Australia’s national income, pro-
vided that Australia acts soon (figure 3.3). Currently, Australia ranks 10th on a list
compiled by The Economist of countries “most ready” for the shift towards an
automated economy (The Economist: Intelligence Unit 2018). While this is a
globally strong position, it is one of the lowest ranked amongst its peer group of
industrialized western nations that would be top competitors for investment,
industry, and jobs, with the U.S., Japan, the Republic of Korea, Germany, and
Singapore all ranking as more prepared (The Economist: Intelligence Unit 2018).Case Studies | 19
FIGURE 3.3
Australia’s potential gain from automation
$2.2
Net present value of GDP
$1.0 Gains from accelerating automation
increment, $ trillions
$1.2 Gains from transitioning workers
Source: Based on AlphaBeta (https://www.alphabeta.com/wp-content/uploads/2017/08/The
-Automation-Advantage.pdf).
Note: Automation could deliver a $2.2 trillion dividend to Australia if workers are transitioned
successfully and the uptake of automation is accelerated.
Rio Tinto’s Mine of the Future
Rio Tinto’s “Mine of the Future” operation in Western Mine of the Future Operations
Australia is a prime example of how automation can Rio Tinto
mitigate the impacts of a mining operation on climate
while developing green value chains of the future and
diversifying local economic sectors. Inaugurated in
2008, the Rio Tinto’s Mine of the Future automation
portfolio holds four primary technological advances
(box 3.2): (1) a modern operations center in the Western
Australian city of Perth that oversees mining opera-
tions remotely; (2) autonomous vehicle haulage system
that moves ore around the mine site by relying on a
supervisory control system and remote controller from
Australia Canberra
the operations center in Perth; (3) an automated drill-
ing system that can engage multiple drill rigs simulta-
neously; and (4) AutoHaul®, a long-distance rail
transportation system that moves ore to ports of call
for export abroad (Rio Tinto 2018). The car industry’s
dramatic shift from a manually-intensive assembly line
to an automated and more efficient production process BOX 3.2
served partially as the impetus for Rio Tinto’s invest-
ment in its Mine of the Future technology. Former Rio Rio Tinto’s Mine of the Future
Tinto Chief Executive Sam Walsh cited the American
car industry’s failure to rapidly adapt to changing tech-
• State of the art operations center in Perth,
Western Australia
nology and the supply chains of the future as a critical
example of how a failure to innovate can lead to a lack
• Autonomous haulage systems that transport
ore around the mine site
of competitiveness in the long term, saying, “Having
seen the automotive evolution in the car industry
• Automated drilling systems that can operate
simultaneously from a single point of control
I wanted to ensure that Rio Tinto pushed itself up the
technology curve.” (Brookes 2018) This drive to avoid
• Automated long-haul systems, including rail
transport
technological complacency fueled Rio Tinto’s invest-
ment in new technologies to create greater20 | Climate-Sensitive Mining: Case Studies
FIGURE 3.4
Mine of the Future productivity gains
a. Haul truck effective utilization b. Haul truck payload
1.08 1.08
%, index: 2015 = 1.00
kt, index: 2015 = 1.00
1.03
1.02
1.00 1.00
2015 2016 2017 2015 2016 2017
Source: Rio Tinto (https://www.riotinto.com/documents/180618_Presentation_Chris_Salisbury
_Iron_Ore.pdf).
efficiencies, ensure long-term competitiveness, increase savings, and reduce the
degree of climatological impact.
For Rio Tinto and their automated haul partners Komatsu and Caterpillar,
these adaptations have achieved significant efficiencies and cost savings, as
shown in figure 3.4.
The fleet of approximately 80 automated haul trucks now move approxi-
mately 25 percent of ore and waste material produced across Rio Tinto’s Pilbara
operations (Jamasmie 2018). The adaptation has proved so successful, with the
same or fewer number of trucks able to carry more ore, that Rio plans to roll out
as many as 50 additional trucks by the end of 2019 (Rio Tinto 2017). Maximizing
route efficiency and curbing the amount of truck idle time have contributed to
both increased haul efficiency and reduced carbon-intensive fuel consumption
with overall cost reductions of approximately 15 percent compared to a manned
truck (Jamasmie 2018). Rio Tinto’s mine of the future is not the only example of
high-level of automation in the industry. Resolute’s Syama Mine in Mali and
Vale’s S11D operation in Brazil are also notable examples and suggest a growing
trend (box 3.3).
In addition to the direct economic benefits of the Mine of the Future pro-
ductivity gains, including extracting, moving, and selling more ore, generating
more royalties, and expanding mine operations, the nature of the technology
being used in Rio Tinto’s operation has a high potential to establish new, scal-
able green value chains and drive national economic diversification. While
automating labor and time-intensive manual processes may initially reduce
the number of manually-performed jobs, it creates new categories of jobs. For
example, while the Mine of the Future operation replaced truck driving with
an automated haul system, it simultaneously created jobs for more than 200
controllers and schedulers and more than 230 technical planning positions to
keep trucks running from more than 1,500 kilometers away (Rio Tinto 2018).
These are skilled positions in high-technology areas of the Australian econ-
omy that did not exist prior to the Rio Tinto’s investment in automation.You can also read