Victoria's Climate Science - Report 2019 - Climate Change
←
→
Page content transcription
If your browser does not render page correctly, please read the page content below
Victoria’s Climate Science
               Report 2019
Acknowledgments
The State of Victoria wish to acknowledge the assistance of John Clarke, Dr Michael Grose, Dr Marcus Thatcher,
Dr Kathy McInnes, Dr Vanessa Hernaman, Dr Xuebin Zhang from CSIRO; Dr Pandora Hope, Dr Lynette Bettio,
Ben Hague, Dr Scott Power and Dr Karl Braganza, from the Bureau of Meteorology; Professor David Karoly, from the
Earth Systems and Climate Change Hub; and Dr Ailie Gallant from Monash University.

Editorial support Karen Pearce, Bloom Communication

Figures, design and layout Carmel Reilly, ceeDesign

Illustrations Kate Doyle

   Acknowledgment
   We acknowledge and respect Victorian Traditional Owners as the
   original custodians of Victoria's land and waters, their unique
   ability to care for Country and deep spiritual connection to it.
   We honour Elders past and present whose knowledge and wisdom
   has ensured the continuation of culture and traditional practices.
   We are committed to genuinely partner, and meaningfully engage, with
   Victoria's Traditional Owners and Aboriginal communities to support the
   protection of Country, the maintenance of spiritual and cultural practices
   and their broader aspirations in the 21st century and beyond.

© The State of Victoria Department of Environment, Land, Water and Planning 2019

This work is licensed under a Creative Commons Attribution 4.0 International licence. You are free to re-use the
work under that licence, on the condition that you credit the State of Victoria as author. The licence does not apply
to any images, photographs or branding, including the Victorian Coat of Arms, the Victorian Government logo
and the Department of Environment, Land, Water and Planning (DELWP) logo. To view a copy of this licence, visit
creativecommons.org/licenses/by/4.0/
Printed by Finsbury Green, Melbourne.
ISBN 978-1-76077-852-1 (print)
ISBN 978-1-76077-853-8 (pdf)
Disclaimer
This publication may be of assistance to you but the State of Victoria and its employees do not guarantee that the
publication is without flaw of any kind or is wholly appropriate for your particular purposes and therefore disclaims all
liability for any error, loss or other consequence which may arise from you relying on any information in this publication.

Accessibility
If you would like to receive this publication in an alternative format,
please telephone the DELWP Customer Service Centre on 136 186, or email
customer.service@delwp.vic.gov.au, or via the National Relay Service on 133 677,
www.relayservice.com.au. This document is also available on the internet at
www.delwp.vic.gov.au

Department of Environment, Land, Water and Planning

Contents
Minister’s foreword                    6    4.3 Temperature                                     28
                                            4.3.1 Average temperature                           28
Executive summary                       8
                                            4.3.2 Extreme temperatures                          30
                                            4.4 Rainfall                                        31
1.0 The big climate picture            10
                                            4.4.1 Average rainfall                              31
2.0 Victoria’s changing climate        14   4.4.2 Extreme rainfall                              31
2.1 Victoria’s climate                 14   4.5 Regional changes in climate                     32
2.2 Victoria’s climate is shaped by         4.5.1 Regional temperature changes                  32
weather systems, seasonal influences
                                            4.5.2 Regional rainfall changes                     34
and large-scale climate drivers        14
                                            4.6 Fire danger                                     35
2.2.1 Weather systems and
seasonal influences                    14   4.7 Snow                                            35
2.2.2 Large-scale climate drivers      16   4.8 Sea level rise                                  35
2.3 Victoria’s climate has changed     18   4.8.1 Mean sea level                                35
2.3.1 Warmer and drier                 18   4.8.2 Extreme sea level events                      36
2.3.2 Changing climate drivers         20   4.8.3 Waves                                         36
2.3.3 Sea level                        20
                                            5.0 Using climate science
2.3.4 Fire danger                      21   to support decision making                          38
2.3.5 Snow                             21   5.1 Climate change and water
                                            resource management                                 39
3.0 Understanding climate science      22
                                            5.2 Climate change and fire management              39
3.1 Modelling the future climate       22
                                            5.3 Climate change and snow tourism                 39
3.1.1 Model resolution                 22
                                            5.4 Climate change and agriculture                  40
3.1.2 Representing emissions           23
                                            5.5 Biodiversity conservation
3.1.3 Global modelling efforts         23   in a changing climate                               40
3.2 Climate science assessment         24
                                            Shortened forms                                     42
3.3 National climate projections       24
3.4 Climate science for Victoria       24   Glossary                                            43

4.0 Victoria’s future climate          26
                                            References                                          45
4.1 Interpreting projections           26
4.2 Major climate influences           26   Photo credits                                       47
4.2.1 Weather systems                  26
4.2.2 Climate drivers                  28

                                                       Victoria’s Climate Science Report 2019    3
Department of Environment, Land, Water and Planning

4     Climate Science for Victoria

Department of Environment, Land, Water and Planning

List of figures

Figure 1. The enhanced greenhouse effect explained.                                                   11
Figure 2. Australia’s average annual temperature relative to the 1850–1900 period.                    12
Figure 3. The influence of the sub-tropical ridge.                                                    15
Figure 4. The influence of large-scale climate drivers.                                               17
Figure 5. Observed average annual temperature in Victoria from 1910–2018 compared
to the 1961–1990 baseline average.                                                                    18
Figure 6. Maps showing warm season (November–March) and cool season
(April–October) rainfall deciles.                                                                     19
Figure 7. Days per year when Victorian average temperature is ‘unusually hot’.                        20
Figure 8. The number of very high fire danger days in spring has increased.                           21
Figure 9. Topography of Victoria as represented in a typical global climate model
(GCM about 150 km), intermediate downscaling model (CSIRO’s modelling at 50 km)
and the VCP19 modelling at 5 km.                                                                      23
Figure 10. Projected changes that will influence Victoria’s future climate.                           27
Figure 11. Average annual temperature of Victoria in observations and models
relative to the pre-industrial era, showing the highest emissions pathway (RCP 8.5)
and the lowest (RCP 2.6) separately.                                                                  28
Figure 12. Comparison of the observed average annual temperatures for Victoria
with the projected range of change.                                                                   29
Figure 13. Observed rainfall averaged over Victoria and the projected rainfall change.                30
Figure 14. Comparison of the median number of hot days per year currently (between
1986 and 2005) and in the 2050s under high emissions (RCP 8.5).                                       33
Figure 15. Average decline in annual rainfall in percent for locations across Victoria
for the 2050s under high emissions scenario (RCP 8.5) compared to 1986–2005.                          34
Figure 16. Sea level rise projections relative to the baseline (1986–2005) for key
Victorian locations under high (RCP8.5) emissions scenarios for the 2030s and the 2070s.              35

                                                             Victoria’s Climate Science Report 2019        5
Department of Environment, Land, Water and Planning

Minister’s
foreword
Evidence is the strongest base
for decisions about the future.
Our state is a fantastic place to live, work and raise a family.
A healthy environment is vital for a healthy future for our state,
and the generations to come. Victoria has many world-renowned
climate scientists to turn to for help in making good decisions.
As well as making a valuable contribution to the global evidence
base, local scientists give us valuable insight into both how our
climate is changing and what that might mean for the future.

The Victorian Government is committed to understanding our
climate and exploring the impacts of our future climate with the
Victorian community.

Victoria’s Climate Science Report 2019 provides a summary of the
best available scientific evidence on climate for our state. The report
builds on the knowledge gained from the Victorian Government’s
ongoing investment in climate science, such as the Victorian Climate
Projections 2019 and the Victorian Water and Climate Initiative, as well
as research from our leading academic institutions.

The report tells us that Victoria’s climate has already changed –
becoming hotter and drier in recent years. It also shows how these
trends are projected to continue in the future, along with more frequent
high fire danger days and rising sea levels. By explaining the changes
projected for Victoria, this report is the evidence base for taking strong
steps to reduce our emissions and adapt to climate change.

By outlining the changes that Victoria could experience if the global
community does not reduce its greenhouse gas emissions, this report
demonstrates the need for Victoria to play its part and reduce our own
emissions. This will also ensure Victoria is well-placed to take advantage
of the opportunities of switching to a net zero emission economy.

The report also makes clear that our regions and sectors must prepare
for the future by understanding and adapting to the projected changes
in our climate. The Victorian Government has laid a strong foundation
for effective adaptation through Victoria’s Climate Change Adaptation
Plan 2017–2020.

We know the Victorian community is looking for strong and lasting
action on climate change, and the time for that action is now. We will
continue to work with the scientific community to gather evidence of
future climate change risks and opportunities for Victoria. For the health   The Hon. Lily D’Ambrosio MP
of our community and environment, to strengthen our state’s economy,         Minister for Energy,
to ensure there are jobs for Victorians now and for future generations,      Environment and Climate Change
our government is acting strongly on climate change for Victoria.            Minister for Solar Homes

6     Climate Science for Victoria

Department of Environment, Land, Water and Planning

        Victoria’s Climate Science Report 2019    7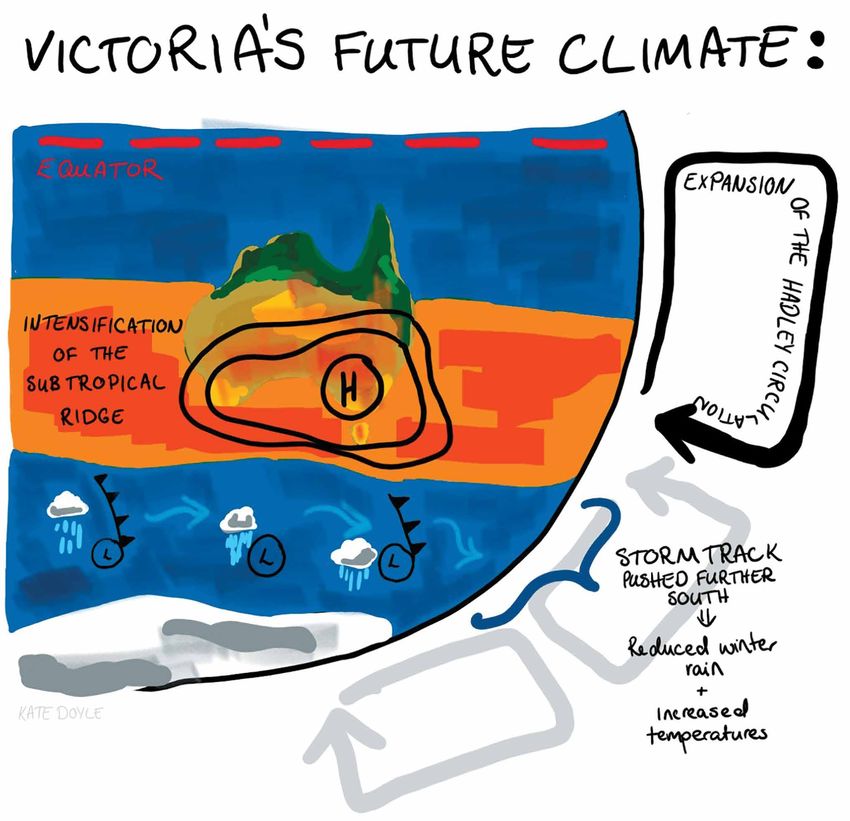
Department of Environment, Land, Water and Planning

Executive
summary
Victoria’s climate has changed in recent decades, becoming
warmer and drier. These changes are expected to continue in
the future. Understanding the drivers and impacts of these
changes, as well as what we can expect in the future, will help
us to plan and adapt.
Victoria’s changing climate                           Victoria’s future climate
Victoria’s climate varies across the state, with      Climate projections suggest that Victoria will
distinct climate zones. Northwest Victoria is         continue to become warmer and drier in the future.
hotter and drier, the south and east are milder       However, natural year-to-year and decade-to-
with higher rainfall, while the northeast has an      decade variability mean that relatively cooler
alpine region. Victoria’s climate also varies from    periods and very wet years will still occur.
year to year and decade to decade due to the
influence of large-scale climate drivers such         Annual rainfall is projected to decrease across the
as the El Niño Southern Oscillation.                  state, due to declines across autumn, winter and
                                                      spring. When extreme rainfall events do occur, they
Long-term observed records show that                  are likely to be more intense. Areas of the Victorian
Victoria’s climate is changing under the influence    Alps are projected to see a greater reduction in
of both natural variability and global warming.       rainfall than the surrounding areas. Victorian alpine
The average temperature across the state has          areas are also projected to continue to experience
warmed by just over 1.0°C since official Bureau       declining snowfall (35–75% by the 2050s under high
of Meteorology records began in 1910. Over the        emissions). Comparison of observations and
past 30 years, Victoria’s cool season rainfall has    projections in Victoria suggest that temperature has
declined compared to last century. Mean sea level     been tracking towards the upper limit of projections
for Melbourne (recorded at Williamstown) has          while winter rainfall has been tracking towards the
risen by approximately 2 mm per year since 1966.      drier end of projections.
There has been an increase in dangerous fire
weather and in the length of the fire season across   By the 2050s, if the current rate of global warming
southern Australia since the 1950s.                   continues, Victorian towns could experience around
                                                      double the number of very hot days each year
                                                      compared to the 1986–2005 average. By the 2090s,
Determining changes to come                           Victoria is projected to warm on average by 2.8 to
                                                      4.3°C under a high emissions scenario compared to
The climate experienced over the long term
                                                      1986–2005. This would see Victoria frequently
is no longer a good indicator of the climate we
                                                      experiencing currently unprecedented high
can expect in the future. Instead, we rely on
                                                      temperatures. Victoria is likely to have a significantly
information from climate models, along with
                                                      lengthened fire season with the number of very high
other information. Climate models help us to
                                                      fire danger days likely to continue to increase. Sea
understand the changes that are already happening
                                                      levels along the Victorian coast are also likely to
and provide guidance on the changes to come.
                                                      continue to rise.
Climate models give robust projections of the
future climate, providing a solid evidence base       Science supporting decision making
from which to assess the risks of climate change
and inform decisions that will support Victoria's     Climate change poses a serious risk for Victoria
resilience into the future.                           and the science underpinning this report has shown
                                                      that not every region in Victoria will change in the
                                                      same way. Using robust science to understand
                                                      the potential impacts of climate change is essential
                                                      to build a more resilient Victoria in the future.

8     Climate Science for Victoria
Department of Environment, Land, Water and Planning

Victoria is already
experiencing the impacts                                            Decrease
                                                                    in average rainfall
of climate change:

               Temperature                                          Significant
               increase of just
                                                                    increase
               over 1.0°C                                           in fire danger
               since 1910                                           in spring
In the future Victoria can expect:

    Average annual                                                   Melbourne’s climate
    temperature                                                      could be more like
    increase up                 Longer fire seasons, with
                                                                     Wangaratta’s
    to 2.4°C                    up to 60% more very
                                high fire danger days

                                                                         Decline in
                                                                         alpine snowfall
                                                                         of 35–75%
 Double the
 number of
 very hot days

      Sea levels will rise by                                   Decline in
      around 24 cm                                              cool season
                                                                rainfall

                                      More intense
                                      downpours

                                                By 2050s under high emissions, compared to 1986–2005

                                                                Victoria’s Climate Science Report 2019   9
Department of Environment, Land, Water and Planning

1.0 The big
climate picture
Increasing concentrations of greenhouse gases in the Earth’s
atmosphere are warming the planet at an unprecedented rate.
It is clear that this warming is the result of human activity
(IPCC, 2013).
Atmospheric carbon dioxide concentrations               and Tasmania. However, the rate of change
have risen from around 280 parts per million            associated with glacial-interglacial cycles is much
at the start of the industrial revolution, to above     slower than the speed of global warming over the
400 parts per million today (Global Carbon Project,     20th century (BoM and CSIRO, 2018). Ice cores,
2018). These increasing concentrations of carbon        corals, tree rings and other palaeoclimate archives
dioxide and other greenhouse gases are trapping         that provide a record of past climate confirm that
heat in the Earth’s atmosphere and warming the          our climate warmed faster over the past 100 years
planet as a result of the enhanced greenhouse           than it has during any other time in the past 2000
effect (Figure 1).                                      years and that a warming period is now affecting
                                                        the whole planet at the same time for the first
In the recent geological history of the Earth,          time (Neukom et al., 2019a; Neukom et al., 2019b;
equivalent rates of change in atmospheric carbon        Allen et al., 2019).
dioxide have taken thousands of years to occur.
The Earth’s climate system has not seen                 Experiments simulating the global climate with
atmospheric carbon dioxide levels above 400             and without human emissions clearly show that
parts per million since around 2.3 million years        this unprecedented warming can only be explained
ago (BoM and CSIRO, 2018).                              by human activity (Figure 2).

Global warming is causing changes in the climate        How much the climate changes will depend
system. The warming atmosphere is not only              strongly on the greenhouse gas emissions pathway
making the world hotter but is also affecting the       that the world follows. The already increased
water cycle, causing both drying and extreme rainfall   concentrations of carbon dioxide in the atmosphere,
events. Sea levels are rising as ice sheets melt and    compared to pre-industrial levels, have locked in
sea water expands; circulation patterns in the          further global warming of up to half a degree above
atmosphere and ocean are also changing.                 the present 1°C rise (IPCC, 2018). The oceans will
                                                        continue to warm in response to emissions already
During the peak of the last ice age around 21,000       present in the atmosphere trapping heat.
years ago, Victoria was colder and drier, with lower
sea levels exposing the land bridge between Victoria

10    Climate Science for Victoria
Department of Environment, Land, Water and Planning
Enhanced greenhouse effect
Most radiation
is absorbed by the
Solar 2 land and oceans,
radiation heating the Earth
reaches
the Earth Heat radiates
from Earth 3
1 4
Some radiation
Some heat
is reflected back
is trapped
into space
by greenhouse
gases in the
atmosphere
5
Burning fossil fuels,
agriculture and land
The extra heat trapped in
the atmosphere causes the
6 clearing are increasing
the amount of greenhouse
Earth’s temperature to rise
gases in the atmosphere,
trapping extra heat
Figure 1: The enhanced greenhouse effect explained (Dept of Environment and Energy, 2019).
Victoria’s Climate Science Report 2019 11Department of Environment, Land, Water and Planning
Human influence on Australia’s climate
2.25
Temperature (°C) difference from
1850–1900 average
2.00
1.75
1.50
1.25
1.00
0.75
0.50
0.25
0.00
-0.25
-0.50
-0.75
1920 1940 1960 1980 2000 2020
Past climate (simulated)
Past climate without human emissions (simulated)
The recent
Future climate (simulated) warming can only
Observed temperatures be explained by
Observed, 10-year running mean
human influence
Figure 2: Australia’s average annual temperature relative to the 1850–1900 period. The thin line
represents Australian temperature observations since 1910, with the thick line the 10‑year running
mean. The shaded bands are the 10–90% range of the 20-year running mean temperatures
simulated from global climate models. The purple band shows simulations that include observed
conditions of greenhouse gases, aerosols, solar radiation and volcanoes; the green band shows
simulations of observed conditions excluding human emissions of greenhouse gases or aerosols; the
red band shows simulations projecting forward into the future (all emissions scenarios are included)
(BoM and CSIRO, 2018).
12 Climate Science for VictoriaDepartment of Environment, Land, Water and Planning
Can we say an extreme weather event was caused
by human-induced global warming?
Attribution studies allow us to understand the links between
68%
of all extreme weather
climate change and individual extreme events by working out events studied to date were
if the likelihood or severity of an event happening now is
made more likely or more
different to what it would be in a world that was not warming
severe by human-caused
in response to human activities.
climate change
An analysis of more than 230 peer-reviewed studies looking
at extreme weather events around the world — including
Hurricane Katrina and Russia’s 2010 heatwave — suggests
68% of all extreme weather events studied to date were
made more likely or more severe by human-caused climate
change (Carbon Brief, 2019). Of the 80 attribution studies
that looked at heatwaves around the world, 76 (95%) found
that climate change had made such an event more likely or
more severe.
While attribution can indicate if an event was more likely
due to climate change, it does not allow us to say that
climate change ‘caused’ a particular event. Also, where
attribution science finds that climate change is making
a given type of extreme weather more likely, natural
variability means that there will still be ups and downs
in the strength and frequency of extreme events from year
to year (Carbon Brief, 2019).
Researchers from the national Earth Systems and Climate
Change Hub have been conducting attribution studies on
Australian extreme events, as well as supporting the
development of a real-time attribution service.
For more information see http://nespclimate.com.au/
science-update-understanding-the-role-of-climate-change
-in-climate-extremes/
Victoria’s Climate Science Report 2019 13Department of Environment, Land, Water and Planning
2.0 Victoria’s
changing climate
Victoria is known for its highly variable weather. However,
long-term observed records show that Victoria’s climate
is changing. Our changing climate presents a significant
challenge to Victorian communities, governments, businesses
and the environment.
2.1 Victoria’s climate 2.2 Victoria’s climate is shaped by
Victoria experiences a temperate climate with weather systems, seasonal influences
variations across the state from the hot dry and large-scale climate drivers
conditions in Mildura in the northwest, alpine
Victoria’s rainfall is highly variable, as it is
conditions in the mountain areas, to the wet elevated
influenced by a range of weather systems and
areas of Gippsland.
large-scale climate drivers over different time
The state’s average temperature ranges from scales (Hope et al., 2017). The amount of rainfall,
10°C in winter to 20°C in summer, with regional where and when it falls, varies from year to year
variations (Timbal et al., 2016). Widespread frost and decade to decade (Power et al., 1999b).
can occur in the cooler seasons and there is
seasonal snow on the mountains. 2.2.1 Weather systems and seasonal influences
Rainfall totals vary across the state, from 917 mm Victoria’s average climate is controlled by the
per year in the southeast and 730 mm per year transfer of excess energy from the tropics to the
in the southwest regions, to the drier area north south pole that, through atmospheric circulations
of the Great Dividing Range with an average such as the Hadley Cell, controls the position
of 562 mm per year (Timbal et al., 2016). Over much of the band of semi-stationary high-pressure
of Victoria, most of the rain falls during the cool systems called the sub-tropical ridge (Nguyen, 2013).
season (April to October). The sub-tropical ridge influences the passage of
rain-bearing weather systems over Victoria. In winter,
Climate represents the long-term the sub-tropical ridge typically moves north allowing
average weather conditions experienced fronts to bring rain to Victoria. In summer, it moves
south limiting the passage of fronts and associated
in a location. Climate is what you expect,
rain (Timbal et al., 2016) (Figure 3).
but weather is what you get.
Most of the rain for western Victoria comes from
the cold fronts and troughs embedded within
the predominant westerly flow over Victoria
(Hope et al., 2017). In eastern Victoria, east coast
lows can cause heavy and widespread rainfall,
particularly in autumn and winter (Pepler et al., 2013).
Thunderstorms are also important for rainfall in this
region (Dowdy and Catto, 2017).
14 Climate Science for VictoriaDepartment of Environment, Land, Water and Planning
* The Earth's tilt results in a seasonal north-south shift
of global atmospheric circulations
* In the Australian summer this results in the sub-tropical ridge
moving south over Victoria, bringing generally dry weather
* In winter the sub-tropical ridge traditionally moves north
allowing the storm track to bring rain to Victoria.
Figure 3: This figure illustrates how the sub-tropical ridge influences Victoria’s climate differently in summer and winter
(Illustrated by Kate Doyle, 2019).
Victoria’s Climate Science Report 2019 15Department of Environment, Land, Water and Planning
2.2.2 Large-scale climate drivers periods by the Interdecadal Pacific Oscillation
(IPO) (Power et al., 1999a). During the cold phase
The El Niño Southern Oscillation (ENSO) influences of the IPO (which is La Niña-like) there is an
rainfall over much of Victoria on year-to-year time increased tendency for positive IOD events to
scales. During its El Niño phase, Victoria generally occur in conjunction with La Niña, which lessens
experiences hotter and drier conditions, especially the higher rainfall usually associated with La Niña
in winter and spring (Power et al., 1999a). During events (Hope et al., 2017).
a La Niña, Victoria experiences cooler and wetter
conditions in winter, spring and summer (Power The Southern Annular Mode (SAM) varies on
et al., 1999a; Risbey et al., 2009; Hope et al., 2017) shorter timescales (approximately two weeks) and
(Figure 4). changes through positive, neutral and negative
phases (BoM, 2019). It has the strongest influence
The Indian Ocean Dipole (IOD) works on the same on Victorian rainfall in winter, where a positive SAM
times scale as ENSO. It influences the region to the typically indicates lower rainfall. A positive SAM in
northwest of Australia and that can in turn spring or summer tends to result in enhanced
influence Victoria’s rainfall in winter and spring, but rainfall in Victoria (Hope et al., 2017).
generally not through into summer. In its positive
phase, the IOD is generally linked to below-average Like the IOD, the SAM can enhance the influence of
rainfall in Victoria. A negative IOD typically is linked ENSO. Heavy spring rainfall in Victoria during the
to above-average rainfall (Ashok et al., 2003). major La Niña event of 2010 was enhanced by a
positive SAM. Conversely, drought conditions from
Both the IOD and ENSO have strong individual an El Niño in 2002 were drier due to a negative
influences on Victoria’s climate (Pepler et al., 2014). SAM in spring (Hope et al., 2017).
When occurring at the same time, the two drivers
may reinforce each other – the combination of an Learn more about the large-scale
El Niño and positive IOD has contributed to some
of the driest June to October periods in Victoria.
climate drivers influencing Victoria’s
Strong positive IOD events are linked to heatwaves, rainfall in the Victorian Government’s
which dry out the environment and increase the Climate Dogs animations at http://
risk of bushfires (Cai et al., 2009). agriculture.vic.gov.au/agriculture/
The year-to-year variations associated with weather-and-climate/understanding-
ENSO and the IOD are affected over longer time weather-and-climate/climatedogs.
16 Climate Science for VictoriaDepartment of Environment, Land, Water and Planning
* These drivers can act alone, combine or contradict each other.
Each event is different.
Figure 4: This figure illustrates how large-scale climate drivers influence Victoria’s climate (Illustrated by Kate Doyle, 2019).
Victoria’s Climate Science Report 2019 17Department of Environment, Land, Water and Planning
2.3 Victoria’s climate has changed
2.3.1 Warmer and drier
Victoria’s climate has warmed by just over 1.0°C since official records began in 1910 (BoM, 2019). There have
been many more warm years than cool years since the 1960s. Using the standard baseline of 1961–1990, the
last year with below-average temperature was 1996 (CSIRO, 2019) (Figure 5).
Victoria has also become drier, especially in the cooler months. Over the past 30 years, cool season rainfall
has declined compared to last century (Hope et al., 2017) (Figure 6). This is due to changes in global wind and
ocean movements in the Australian region that are consistent with global warming, although natural
variability is also likely to be a factor.
Victoria’s average temperature has increased
Temperature (°C) difference
2
1
0
-1
-2
1920 1940 1960 1980 2000
Figure 5: Observed average annual temperature in Victoria from 1910–2018 from the
Bureau of Meteorology compared to the 1961–1990 baseline average (CSIRO, 2019).
Anyone under the
age of 23 who has
always lived in Victoria
has never experienced
a year of below-average
temperature.
18 Climate Science for Victoria8–9 Above ave
4–7 Average
Department of Environment, Land, Water and Planning
2–3 Below ave
1 Very muc
Lowest on
Observed rainfall change in Victoria for the last 30 years (1989–2018/19)
Rainfall decile rangesrainfall
Warm season
Highest on record
10 Very much above average
8–9 Above average
4–7 Average
2–3 Below average
Rainfall decile ranges
1 Very much below average
Highest on record
Lowest on record
10 Very much above average
8–9 Above average
4–7 Average
2–3 Below average
1 Very much below average
Cool season rainfall Lowest on record
Figure 6: Maps showing warm season (November–March) and cool season (April–October) rainfall deciles. The maps show
how the rainfall total over the past 30 years (1989–2019) for the given months compares to every 30-year period in the
historical record. For example, decile 1 (very much below average) shows areas where rainfall over the past 30 years is in
the lowest 10% of all such 30-year periods in the full range of long-term records back to 1900 (BoM, 2019).
Victoria’s Climate Science Report 2019 19Department of Environment, Land, Water and Planning
Victoria has also experienced an overall increase in the frequency of unusually hot days (Figure 7).
Extreme heat events already cost the Victorian economy on average $87 million a year,
and this cost is projected to rise as heatwave events become more frequent (Natural
Capital Economics, 2018)
Unusually hot weather
The number
20
Number of unusually hot days per year
of unusually hot
days in Victoria
has increased
15
10
5
0
1910 1920 1930 1940 1950 1960 1970 1980 1990 2000 2010
Figure 7: Days per year when Victorian average temperature is ‘unusually hot’. Unusually hot days are those above the
99th percentile of each month from the years 1910 to April 2019 (BoM, 2019).
2.3.2 Changing climate drivers Changes in weather systems that have been linked
to global warming include:
It is also possible that the large-scale drivers
associated with natural rainfall variability in Victoria • a southerly shift in the mid-latitude storm track
are changing, resulting in less rainfall from low- that brings rainfall to Victoria in the cooler months
pressure systems and cold fronts than in the past of the year (Hope et al., 2015)
(Pepler, 2018). However, the complex interactions
• an intensification of the sub-tropical ridge that
between natural climate variability and climate
is linked to drier conditions, and has an influence
change mean that the large-scale climate drivers
on the amount of rain associated with the
influence the weather patterns very differently,
mid-latitude storm track (Grose et al. (2015b)
depending on the season. This may result in, for
example, rainfall reducing in some seasons, but • an expansion of the Hadley Cell (Nguyen, 2015),
increasing in others. possibly contributing to reduced cool-season
rainfall and enhanced summer rain (Hope et
Due to the influence and interactions of large-scale
al., 2017).
climate drivers, decadal and year-to-year rainfall
variability is still a dominant feature of Victoria’s In recent decades there has also been a trend
climate within the overall drying trends. Victoria has towards a positive SAM in winter that has
experienced extended dry periods, such as during contributed to reduced cool-season rainfall
the Millennium Drought (from 1997 to 2009), and (Hope et al., 2017).
seen occasional extremely wet years (e.g. 2010 and
2016) (Hope et al., 2017), due to natural variability, 2.3.3 Sea level
however global warming may have also been
a factor. To put this in context, palaeoclimate Sea level rises due to ice sheets on land melting and
archives (e.g. tree rings, ice cores, corals and sea water expanding as it warms. However, sea level
sediment records) suggest that the Millennium does not rise uniformly and varies locally due
Drought covered a larger area and was longer differences in coastal topography and nearshore
than any other drought in southern Australia over processes. Tide gauges show that Victoria’s mean
the past 400 years (Freund et al., 2017). sea level has been increasing, with average
20 Climate Science for VictoriaDepartment of Environment, Land, Water and Planning
increases between 1.57 cm and 5.31 cm per decade and fuel (based on factors including recent
between 19931 and 2017. Melbourne (recorded at temperature and rainfall). Although considerable
Williamstown), has the longest continuous record of year-to-year variability also occurs, there is a trend
observations in Victoria, and reported an average in more recent decades towards a greater number
increase in mean sea level of 1.95 cm per decade of very high fire danger days in spring (Figure 8).
(that is, approximately 2 mm per year) since 1966.
2.3.5 Snow
2.3.4 Fire danger
A decline in snow accumulation and the extent
There has been an increase in dangerous fire of snow cover has been observed since the 1950s
weather and the length of the fire season across across the Victorian Alps, with the largest declines
southern Australia since the 1950s (BoM and CSIRO, during spring (Timbal et al., 2016). These changes
2018). Fire weather in Victoria is largely measured are closely linked to increasing daily maximum
using the Forest Fire Danger Index (FFDI). This index temperatures in winter (Davis, 2013), which is
estimates the fire danger on a given day based on projected to continue to increase in the future.
observations of temperature, humidity, wind speed
The number
Spring bushfire weather of very high fire
danger days
25
Number of spring days over 25 FFDI
occurring in spring
in Victoria has
increased
20
15
10
5
0
1978 1983 1988 1993 1998 2003 2008 2013 2018
Figure 8: The number of very high fire danger days in spring has increased. The chart shows the number of days with FFDI
greater than 25 (very high fire danger) in Victoria in spring for the years (1978–2018) (BoM, 2019).
Impact of the changing climate on streamflow
Across the state, there have been significant reductions in streamflow. An analysis conducted
in the Victorian Climate Initiative (VicCI) (Hope et al., 2017) found that the declines varied
between about 25% and 75% (1997–2014 compared to 1975–1997), with relative declines typically
larger in western Victoria, and smaller in the alpine areas. While the Millennium Drought was a
large factor in the reduction in rainfall over the past 20 years, it was influenced by both natural
variability and climate change.
1 1993 is chosen as a start point as this is the start date of the Bureau's Australian Baseline Sea Level Monitoring Program (ABSLMP).
See: http://www.bom.gov.au/oceanography/projects/abslmp/abslmp.shtml. Data from non-ABSLMP gauges are held by the Bureau of
Meteorology but operated by third parties.
Victoria’s Climate Science Report 2019 21Department of Environment, Land, Water and Planning
3.0
Understanding
climate science
In a changing climate, the climate experienced over the
long-term past is no longer a good indicator of the climate
we can expect in the future. Instead, we rely on climate
models to project possible future climates.
Climate models help us to understand the 3.1.1 Model resolution
changes that are already happening and plan
for the changes to come. There is a high level Global climate models typically use a grid cell size
of consensus around the science underpinning of 100–200 km, so they can adequately represent
these models to provide robust projections the national to regional scale changes in climate.
of the future climate. All locations within a grid cell are modelled as having
the same climate, so large-scale features like fronts
are represented, but the resolution is too coarse to
3.1 Modelling the future climate represent individual thunderstorms, or to represent
Climate scientists use climate models to create the interactions between weather and topography
simulations of the Earth’s climate system to help in mountainous regions.
us understand our changing climate. The models
To better represent local climate distinctions
are a complex series of mathematical equations
and future weather, simulations from global
based on the fundamental laws of physics that
climate models can be downscaled to produce
simulate the dynamics of the atmosphere, oceans
higher-resolution simulations for local areas.
and ice. The simulations they produce indicate
Downscaling can improve the representation
how temperature, rainfall, wind and other
of extreme events and the influence of landscape
climate variables can change over a region, for
features like mountains, coasts and urban heat
different greenhouse gas concentrations.
islands on the local climate. There are two main
types of downscaling: statistical and dynamical.
In statistical methods of downscaling, local climate is
represented by establishing a statistical relationship
between broader-scale and local-scale variables.
In dynamical downscaling, a regional climate model
contains the same underlying physics as global
climate models but can be processed at a higher
spatial resolution in order to better resolve weather
phenomena and regional influences over a smaller
area (CSIRO, 2019).
This is demonstrated in Figure 9 where downscaling
global climate model simulations to a 5 km x 5 km
scale can better represent the mountains in the
Victorian alpine regions (CSIRO, 2019).
22 Climate Science for VictoriaDepartment of Environment, Land, Water and Planning
Downscaled projections show local features
GCM 150 km RCM 50 km RCM 5 km
Figure 9: Topography of Victoria as represented in a typical global climate model (GCM about 150 km), intermediate
downscaling model (CSIRO’s modelling at 50 km) and the VCP19 modelling at 5 km, the height scale extends to 2000 m
above sea level (CSIRO, 2019).
Table 1: Features of the Representative Concentration Pathways (IPCC, 2013)
Likely 2080–2100
global average
Concentration temperature
of CO2 in 2100 (°C above pre- Global greenhouse gas Data availability
RCP (parts per million) industrial levels) emissions pathway for Victoria
Ongoing high greenhouse
8.5 936 3.2 to 5.4 Local-scale data available
gas emissions
Lower emissions, achieved
by application of some Limited data available
6.0 673 2.0 to 3.6
mitigation strategies and globally
technologies
4.5 538 1.7 to 3.2 Emissions peak around 2040 Local-scale data available
Emissions peak around 2020, Lower resolution data
2.6 421 0.9 to 2.3
then decline rapidly available
3.1.2 Representing emissions 3.1.3 Global modelling efforts
The concentration of greenhouse gas emissions The World Climate Research Programme’s Coupled
is an important component of climate modelling. Model Intercomparison Project (CMIP) is a global
Because we do not know what social, economic modelling experiment that facilitates the analysis of
and technological pathways (which determine climate model performance. Simulations submitted
greenhouse gas emissions) will be followed over to CMIP follow a standard framework, which allows
time, climate scientists use a set of four standard the simulations to be compared. These simulations
emissions scenarios (Representative Concentration are used by climate scientists across the world.
Pathways or RCPs, see Table 1) to project
Phase 5 of the project (CMIP5) incorporated over 40
a reasonable range of possible future climates.
global climate models that represent both oceanic
Having consistent emissions scenarios allows
and atmospheric processes. This modelling formed
comparison between studies and validation of
the basis for the Intergovernmental Panel on Climate
results. Considering the results from multiple RCPs
Change (IPCC) Fifth Assessment Report (IPCC, 2013).
allows us to plan for a range of possible futures,
A new global modelling effort, CMIP6, has seen
making sure that our responses are robust across
improvement in the way the models represent the
different future scenarios.
weather systems, clouds and aerosols. The results
from these models will form the foundation of the
IPCC’s Sixth Assessment Report due in 2021.
Victoria’s Climate Science Report 2019 23Department of Environment, Land, Water and Planning
3.2 Climate science assessment Every two years, CSIRO and BoM also publish
a State of the Climate report that synthesises current
The IPCC is a United Nations body tasked with climate observations and science. The 2018 report
evaluating the global state of knowledge of the (BoM and CSIRO, 2018) notes:
science and processes of climate change, the
vulnerability of natural and human systems to • Australia’s average temperature has increased
climate change, options for reducing greenhouse by more than 1°C since 1910.
gas emissions and adapting to the changes. • Extreme heat events have increased in frequency.
IPCC assessment reports are drafted by large
teams of leading scientists, drawing on the work • Cool season rainfall (April to October) across
of thousands of researchers, and extensively southeastern Australia has declined since the
reviewed by 194 governments across the world late 1990s.
before being published.
• Extreme fire weather has increased
In 2013, the IPCC released its Fifth Assessment in frequency and duration.
Report (IPCC, 2013) on the current and future
state of the climate system, based on CMIP5 models. • Sea levels have risen, leading to increased
The report made several important conclusions: inundation risk for coastal areas.
• Greenhouse gas emissions have markedly The Earth Systems and Climate Change Hub,
increased because of human activity. established in 2015 under the Australian
Government’s National Environmental Science
• Human influence has been detected in: Program, is a partnership between CSIRO,
BoM and universities. It aims to improve our
–– warming of the atmosphere and the ocean understanding of how the Australian climate has
–– changes in the global water cycle changed and may change in the future, as well
building the utility of climate change information
–– reductions in snow and ice and projections.
–– global mean sea level rise
3.4 Climate science for Victoria
–– changes in some climate extremes.
A major focus of Victorian Government support
• It is extremely likely that human influence for climate science over the past decade has
has been the dominant cause of the observed been to build our understanding of how climate
warming since the mid-20th century. change will affect Victorian water resources. In
addition, to help support statewide adaptation
• Continued emission of greenhouse gases will
planning, new local-scale future climate projections
cause further warming and changes in all
have also been produced for Victoria.
components of the climate system.
The Victorian Climate Initiative (VicCI), was a tailored
The IPCC also releases occasional special
program of water sector research, which built on
reports. The Special Report on the Impacts
earlier research including the South East Australian
of Global Warming of 1.5°C above Pre-industrial
Climate Initiative (SEACI) and looked at past, present
Levels (IPCC, 2018) reported on the practical
and future climate and hydrology. Future climate
differences between 1.5°C and 2°C of global
projections produced as part of the VicCI program
warming. The recent Special Report on Climate
are based on the CMIP5 models using statistical,
Change and Land (IPCC, 2019a) outlines the
empirical and dynamical methods of downscaling
adverse effects of climate change on food security
(e.g. Potter et al., 2016). To continue to provide the
and terrestrial ecosystems, and the contribution
Victorian water sector with tailored climate and
of climate change to land degradation.
hydrology research and guidance, the Victorian
Government is currently investing in the Victorian
3.3 National climate projections Water and Climate Initiative (VicWaCI) to gain further
insights into the challenges that climate change
In 2015, following the release of the IPCC Fifth
poses to water resources. For more information, see
Assessment Report (IPCC, 2013), the Commonwealth
https://www.water.vic.gov.au/climate-change.
Scientific and Industrial Research Organisation
(CSIRO) and the Australian Bureau of Meteorology In 2016, as part of the Victorian Government’s
(BoM) released climate change projections for VicCI program, BoM released a summary of climate
Australia which, like the IPCC Fifth Assessment science for Victoria, presenting the state of
report, used modelling from CMIP5. Victoria is knowledge on Victoria’s past, present and future
represented in these national projections as part climate (Timbal et al., 2016). The future climate
of the Murray Basin and Southern Slopes regions information was based on the 2015 national-scale
(CSIRO and BoM, 2015). projections (CSIRO and BoM, 2015).
24 Climate Science for VictoriaDepartment of Environment, Land, Water and Planning
These projections were also the basis for the Victorian Government’s
Climate-ready Victoria publications, released in 2016.
A new Victorian Government program has provided local-scale
climate projections for Victoria. The Victorian Climate Projections
2019 (VCP19), developed by CSIRO’s Climate Science Centre,
are statewide dynamically downscaled climate projections
at a 5 km x 5 km spatial resolution to the 2090s.
High-resolution outputs are important for Victoria due
to the state’s varied topography and long coastline,
and allow us to better understand changes in our
alpine regions, coastal areas and agriculture regions.
Projections are available at short time intervals
(e.g. hourly), which is important for understanding
extreme weather events, such as localised intense
rainfall. The VCP19 project describes how the
climate of Victoria may respond to global
warming under the IPCC’s medium and high
emissions scenarios (RCP 4.5 and 8.5).
The scenarios were chosen to provide
a range of possible futures to assess
the risks of climate change and inform
appropriate adaptation decisions.
In VCP19, the new local-scale
projections are presented
alongside results from previous
modelling work. In order to
understand the full range
of possible future climates,
it is necessary to consider
all available modelling for
Victoria, and to regularly
update our estimates
with the newest
generation of models
(e.g. CMIP6).
The new VCP19 projections complement
rather than replace or supersede
existing projections, as they all represent
possible futures. Using a range of
projections increases the robustness
of climate change planning. Some sets
of projections are particularly suited
to certain purposes, such as the VicCI
projections for water supply planning.
Victoria’s Climate Science Report 2019 25Department of Environment, Land, Water and Planning
4.0 Victoria’s
future climate
Climate projections provide a representation of a possible
future climate that can be used in planning and decision
making when they are interpreted correctly. Projections for
Victoria indicate the state is likely to become hotter and drier
in the future, but the timing and extent of changes will vary
across regions. Projections are always given as a range, so also
provide detail about the less likely but still plausible scenarios.
This section explains how to interpret projections and The projected temperature increase is calculated by
presents a summary of the latest climate projections the difference between a climate model’s future and
for Victoria out to the 2090s, including the VCP19 baseline values for a given emissions scenario.
local-scale climate projections, results from VicCI
research and national lower-resolution projections. What the given range of results represents may
vary from study to study. It may represent the
spread of results across all the models used, the
4.1 Interpreting projections 10th to 90th percentile result or another range
entirely. Before using the range for policy and
There is a lot of meaning wrapped up in
decision making it is important to be clear about
projections statements. To use climate change
what the range shows.
projections appropriately, it is important that
they are interpreted correctly. Confidence in projections is determined by how
well we understand the physical climate processes,
Consider this example:
how well those processes are simulated in climate
By the 2090s, average maximum temperatures
models, agreement between climate models and
are projected to increase by 2.8 to 4.3°C compared
if projected changes are consistent with recent
to 1986–2005 (high confidence).
observed trends. Projections with higher confidence
The first thing to be aware of is that climate can inform choices more definitely.
projections are not predictions or forecasts.
They cannot provide specific timing and sequences 4.2 Major climate influences
of changes, but instead provide a possible range
for given climate variables. 4.2.1 Weather systems
Similarly, the future years given in climate
The westerly winds and associated weather systems,
projections (e.g. 2030, 2090) represent a period,
such as the subtropical jet, are projected to weaken
centred on that year. The Victorian projections
over Australia and/or move further south (Grose et
use a 20-year period. Looking at our example,
al., 2017a; Grose et al., 2019a).
‘by the 2090s’ means the average maximum
temperature for the period 2080 to 2099. Fewer blocking highs in the Tasman in winter are
projected in the future (e.g. Grose et al., 2017) meaning
To measure a change, you need something to
less rainfall for eastern Victoria. The projection of
measure it against, so all projections are a change
blocking highs in summer is less clear (CSIRO, 2019).
relative to a baseline period. Consistent with the
IPCC, projections in this publication use 1986–2005
as the baseline, unless otherwise noted. It is difficult
These changes are expected to contribute
to define a baseline that represents the ‘current’ to a decline in Victoria’s cool season rainfall,
climate, so it is important to understand which potentially leading to reduced runoff into
period has been used as the reference (or baseline) rivers and dams, and less reliable filling of
from which to measure future changes. our water storages.
26 Climate Science for VictoriaDepartment of Environment, Land, Water and Planning
Figure 10: This figure illustrates the projected changes that will influence Victoria’s future climate, including the expansion
of the Hadley Cell, the intensification and southward shift of the sub-tropical ridge, which may contribute to reduced winter
rainfall (Illustrated by Kate Doyle, 2019).
Victoria’s Climate Science Report 2019 27Department of Environment, Land, Water and Planning
4.2.2 Climate drivers 4.3 Temperature
ENSO and IOD will remain major factors affecting 4.3.1 Average temperature
the climate of Victoria, including the possibility of
more extreme El Niño and La Niña events (Cai et al., Victoria’s climate will continue to warm, with
2015), and a change to its influence on rainfall (Power maximum and minimum temperatures increasing
et al., 2013; Power and Delage, 2018). However, the over this century (very high confidence).
future of ENSO is unclear, partly because climate
models cannot simulate it reliably (Cai et al., 2015). By the 2030s, average temperatures in Victoria
are projected to increase by between 0.55°C and
Similarly, the projected continuation of the current 1.3°C when compared to 1986–2005 (Figure 11),
trend of SAM spending more time in the positive and changes under all RCPs are similar.
phase (especially in winter) may contribute to rainfall The increase in average temperatures also
decline in Victoria (CSIRO, 2019). translates to an increase in extreme temperatures
(see section 4.3.2) and more frequent hot days
As the Indian Ocean warms, the nature of the IOD
(see section 4.5.1). Comparison of the recent
and/or its influence on Victoria’s rainfall could
observed warming and the projections suggests
change (CSIRO, 2019). A shift towards a more positive
that Victoria is tracking towards the upper limit
IOD (Cai et al., 2013) is also associated with a drier
of the projections (see Figure 12).
climate (CSIRO, 2019).
Victoria is expected to continue to get warmer
4.0
Temperature (°C) difference from
1850–1900 average
3.5
2070
3.0
2.5
2050
2.0
1.5 2050 2070
2030
1.0
0.5
0.0
-0.5
-1.0
1920 1940 1960 1980 2000 2020 2040 2060 2080
Climate models - historical RCP8.5 RCP2.6 RCP8.5 and RCP2.6 overlap
Climate models – historical RCP8.5 RCP2.6
Observed Baseline 2030 2050 2070
Figure 11: Average annual temperature of Victoria in observations and models relative to the pre-industrial era, showing
the highest emissions pathway (RCP 8.5) and the lowest (RCP 2.6) separately. The thicker lines show the 20-year average
temperature from the average of all models for each time period (CSIRO, 2019).
28 Climate Science for VictoriaDepartment of Environment, Land, Water and Planning
Observed temperature in Victoria is tracking towards the upper limit of projections
1.50
Temperature (°C) difference from
1961–1990 average
1.00
0.50
0.00
-0.50
-1.00
1950 1960 1970 1980 1990 2000 2010 2020 2030
Projected range Observed Running mean
Figure 12: Comparison of the observed average annual temperatures for Victoria with the projected range of change.
Shown are observed temperature difference from 1961-1990 average (thin black line) plus the 10-year running average
(thicker line), and the projected temperature change to 2030 across climate models and emissions scenarios (relative
to a 1986–2005 baseline period). For more details on the method, see Grose et al. (2017b) (CSIRO, 2019)..
Despite this overall warming trend, we will still warming to 2°C, then Victoria is also expected to
experience cold days, cool months, and short-term warm by around 2°C in line with the global average.
trends of little warming or even cooling in the future This is in contrast to other places in the world that
due to natural variability. will warm by much more (e.g. the Arctic) or less
(e.g. the Southern Ocean) than the global average.
After 2030, the projected change in temperature
depends strongly on the greenhouse gas emissions There are differences in projections between the
pathway that the world follows. By the 2050s, local and global-scale models that demonstrate
average temperatures in Victoria are projected to be that there are important local-scale processes that
1.4 to 2.4°C warmer under a high emissions scenario act to affect temperature that cannot be captured
(RCP 8.5) or 0.9 to 1.8°C warmer under a medium by global models. For example, for Gippsland
emissions scenario (RCP 4.5) compared to 1986– in spring, under a high emissions scenario
2005 (Figure 12). By the 2090s, average temperatures by the 2090s, the upper range of average annual
in Victoria are projected to be 2.8 to 4.3°C warmer temperature change from global models was
under a high emissions scenario (RCP 8.5) or 1.3 to 3.9°C, but local-scale projections suggest the
2.2°C warmer under a medium emissions scenario change could possibly reach 5.1°C. However,
(RCP 4.5) compared to 1986–2005 (high confidence). more analysis of this result needs to be done
However, if the world succeeds in matching before we have high confidence in this projection.
aspirations under the Paris Agreement to limit global
Victoria’s Climate Science Report 2019 29Department of Environment, Land, Water and Planning
4.3.2 Extreme temperatures
Changes to extreme temperatures are generally thought to increase
by a similar magnitude as the average temperature, but with important
regional exceptions where they can increase by more. For Victoria, new
regional modelling suggests that under high emissions, extreme daily
maximum temperatures could increase by as much as twice the rate of
increase in the average maximum temperatures, and very large increases
in high winter daytime and night-time temperatures are possible. This is found
in climate model simulations with the greatest rainfall decrease, where a drier
environment contributes to hotter extremes. For example, under high emissions
by the 2090s, parts of Victoria could experience days of up to 55°C in summer
and 33°C in winter (CSIRO, 2019).
While more work is needed to provide confidence in this result, it is in line with global
projections that suggest an increased likelihood of “smashing” temperature records
in the future (Power and Delage, 2019).
Very hot days can damage infrastructure and crops, and cause heat
stress among vulnerable people and animals, as well as testing the
resilience of health and emergency services and the provision of utilities.
An increased risk of frost is possible in some regions and seasons, such as spring, due to
an increase in cold clear nights, at least in the short to medium term. In the long term, higher
temperatures will tend to prevent frosts even on clear nights, leading to an overall decrease
in their occurrence.
Climate extremes are by definition rare events, so accurately determining their current
and future frequency and intensity is difficult and highly dependent on having a long record
of climate observations.
Observed winter rainfall in Victoria is tracking towards the drier
end of projections
800
Rainfall (mm)
700
600
500
400
300
200
1950 1960 1970 1980 1990 2000 2010 2020 2030
Projected range including decadal variability Observed Running mean
Figure 13: Observed rainfall averaged over Victoria (Australian Water Availability Project; thin black line) plus the 10-year
running mean (thicker line), and the projected rainfall change to 2030 across climate models and emissions scenarios
(relative to a 1986–2005 baseline period) (dark grey shading) plus an indication of decadal variability (light grey shading;
one standard deviation of 10-year running average from the observations). For more details on the method, see Grose et al.
(2017b) (CSIRO, 2019).
30 Climate Science for VictoriaYou can also read