Wairau Lagoon Subtidal Survey 2021 - Marlborough District Council June 2021 Prepared for - Marlborough District ...
←
→
Page content transcription
If your browser does not render page correctly, please read the page content below
Wairau Lagoon
Subtidal Survey 2021

Prepared for

Marlborough District Council
June 2021

Salt Ecology
Report 068
  For the environment
  Mō te taiao
RECOMMENDED CITATION
Roberts KL, Stevens LM, Southwick M, Forrest, BM. 2021. Wairau Lagoon Subtidal Survey 2021. Salt Ecology
      Report 068, prepared for Marlborough District Council, June 2021. 67p.

Cover photo: Subtidal macrophyte beds in Big Lagoon

                                                                                             For the People
                                                                                             Mō ngā tāngata
Wairau Lagoon
                         Subtidal Survey 2021

                                        Prepared by

                         Keryn Roberts, Leigh Stevens,
                      Megan Southwick and Barrie Forrest

                                             for

                         Marlborough District Council
                                       June 2021

                         keryn@saltecology.co.nz, +64 (0)21 029 48546
                                   www.saltecology.co.nz

For the environment
Mō te taiao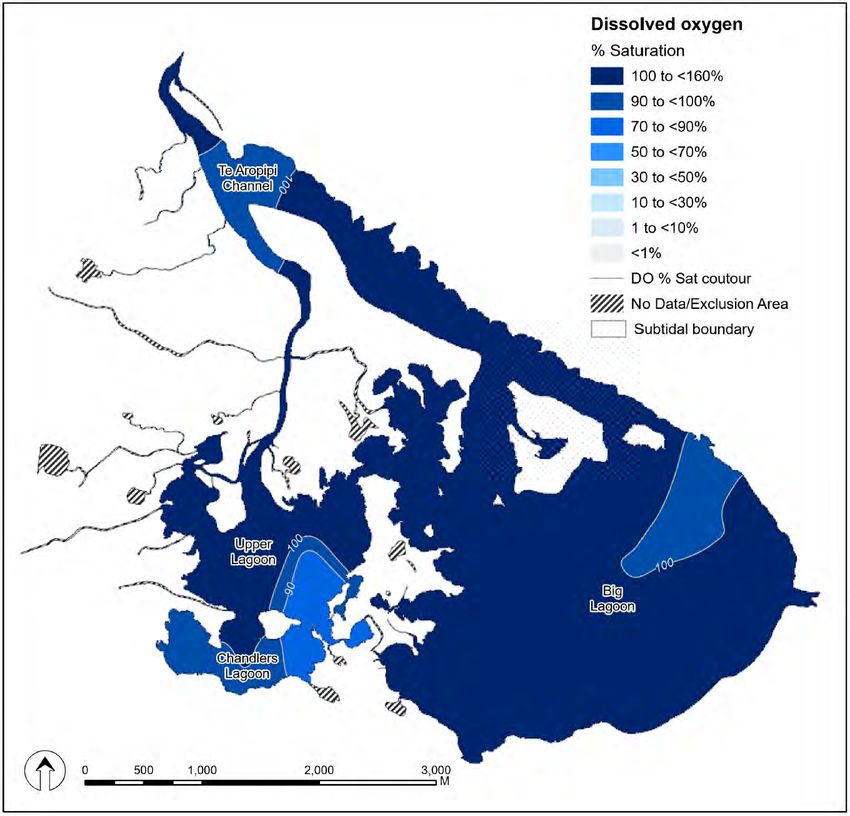
GLOSSARY
aRPD         Apparent Redox Potential Discontinuity
ETI          Estuary Trophic Index
GIS          Geographic Information System
HEC           High Enrichment Conditions (eutrophic area)
MDC           Marlborough District Council
NEMP         National Estuary Monitoring Protocol
SOE          State of the Environment (monitoring)

ACKNOWLEDGEMENTS
Many thanks to Oliver Wade (MDC) for field assistance and review comments on the draft report and to Chris
Owen (Southern Waterways) for his expert boat work and field assistance. The tools used to produce GIS
summaries and maps were developed by Megan Southwick (Salt Ecology). Sally O’Neill and the Salt Ecology
team undertook the macrofauna sample processing, and Sarah Hailes and Barry Greenfield (NIWA) the
taxonomic identifications. Wendy Nelson and Roberta D’Archino (NIWA) provided identifications of the
filamentous algae. The feedback from Te Rūnanga a Rangitāne o Wairau on the draft report was also much
appreciated.

                                                                                               For the People
                                                                                               Mō ngā tāngata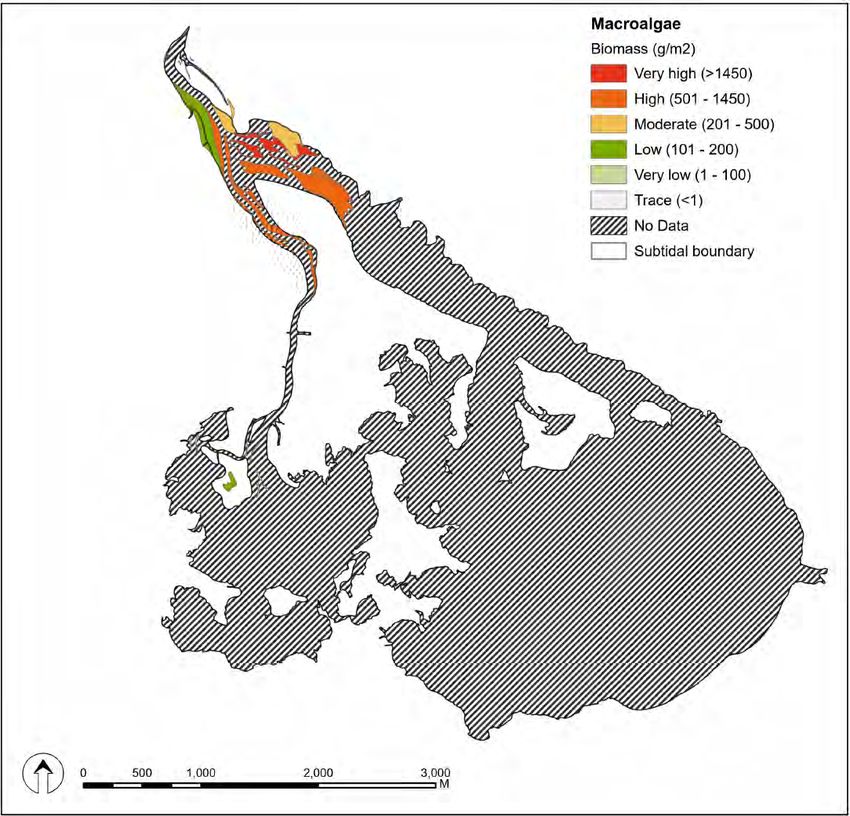
TABLE OF CONTENTS
1.        INTRODUCTION .................................................................................................................................................................................................... 9
  1.1  Background to Wairau Lagoon................................................................................................................................................... 10
2. METHODS .............................................................................................................................................................................................................. 13
  2.1      Overview .................................................................................................................................................................................................. 13
  2.2      Broadscale mapping methods ................................................................................................................................................... 13
     2.2.1    Substrate classification .............................................................................................................................................................. 13
     2.2.2    Macroalgae ....................................................................................................................................................................................... 14
     2.2.3    Seagrass .............................................................................................................................................................................................. 14
     2.2.4    Macrophytes .................................................................................................................................................................................... 15
     2.2.5    Filamentous algae ........................................................................................................................................................................ 15
  2.3      Subtidal survey ..................................................................................................................................................................................... 15
     2.3.1    Water column indicators .......................................................................................................................................................... 17
     2.3.2    Sediment indicators .................................................................................................................................................................... 17
     2.3.3    Macrofauna....................................................................................................................................................................................... 19
  2.4      Data recording and QA/QC .......................................................................................................................................................... 19
  2.5      Assessment of estuary condition .............................................................................................................................................. 19
3. RESULTS .................................................................................................................................................................................................................. 21
  3.1      Broadscale mapping ......................................................................................................................................................................... 21
     3.1.1    Bathymetry ....................................................................................................................................................................................... 21
     3.1.2    Subtidal substrate......................................................................................................................................................................... 22
     3.1.3    Intertidal substrate ....................................................................................................................................................................... 24
     3.1.4    Subtidal macroalgae ................................................................................................................................................................... 25
     3.1.5    Subtidal macrophytes ................................................................................................................................................................ 28
     3.1.6    Subtidal filamentous green algae ...................................................................................................................................... 30
  3.2      Water quality .......................................................................................................................................................................................... 31
     3.2.1    In situ parameters ......................................................................................................................................................................... 31
     3.2.2    Phytoplankton ................................................................................................................................................................................ 33
     3.2.3    Water column nutrients............................................................................................................................................................ 34
  3.3      Sediment quality ................................................................................................................................................................................. 34
     3.3.1    Sediment Grainsize ...................................................................................................................................................................... 35
     3.3.2    Total organic carbon and nutrients ................................................................................................................................... 35
     3.3.3    The Metals and Metalloids ...................................................................................................................................................... 36
     3.3.4    Sediment Oxygenation ............................................................................................................................................................. 36
  3.4      Macrofauna ............................................................................................................................................................................................. 37
4. KEY FINDINGS...................................................................................................................................................................................................... 41
5.        SUMMARY ............................................................................................................................................................................................................. 44
6.        RECOMMENDATIONS..................................................................................................................................................................................... 44
7.        REFERENCES CITED .......................................................................................................................................................................................... 45

For the environment
Mō te taiao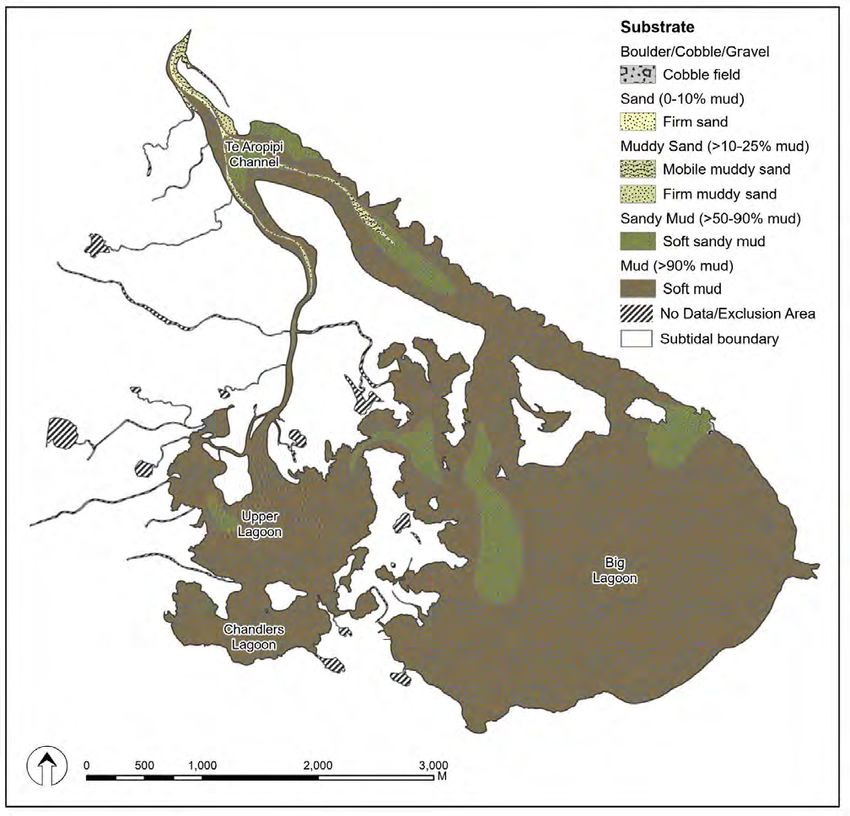
APPENDICES
Appendix 1. Broadscale habitat classification definitions ................................................................................................................... 48
Appendix 2. Information supporting condition ratings ....................................................................................................................... 50
Appendix 3. Macrophyte species identification ....................................................................................................................................... 51
Appendix 4. RJ Hill Laboratory methods ....................................................................................................................................................... 52
Appendix 5. Water column & sediment quality data ............................................................................................................................. 53
Appendix 6. Phytoplankton Results.................................................................................................................................................................. 54
Appendix 7. Raw macrofauna data April 2021........................................................................................................................................... 57
Appendix 8. Substrate validation ....................................................................................................................................................................... 58
Appendix 9. Spot locations for water quality, broad scale mapping and bathymetry ..................................................... 59
Appendix 10. Ground truthing Wairau Lagoon April 2021 ................................................................................................................ 61
Appendix 11. Areas excluded from the presentation of data .......................................................................................................... 62
Appendix 12. 2015 broad scale mapping extent ..................................................................................................................................... 63
Appendix 13. Monitoring recommendations ............................................................................................................................................ 64
FIGURES
Fig 1. Location of Wairau Lagoon. ..................................................................................................................................................................... 10
Fig 2. Wairau Lagoon and surrounding catchment land use classifications from LCDB5 (2017/18) database. 12
Fig 3. Visual rating scale for percentage cover estimates for macroalgae, seagrass and macrophytes. ............... 14
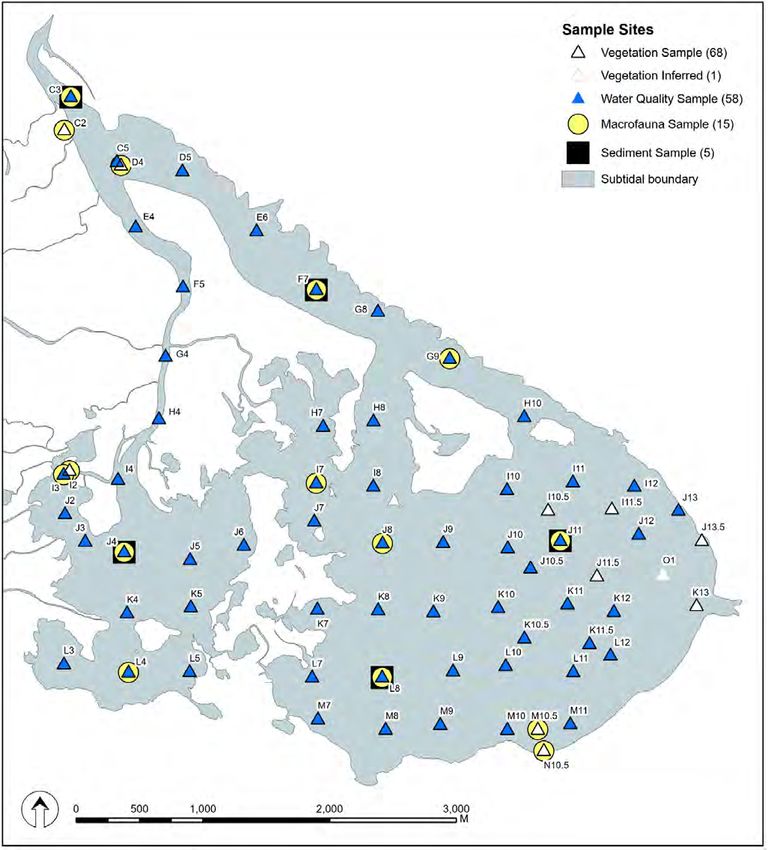
Fig 4. Location of sampling points in Wairau Lagoon.. ......................................................................................................................... 16
Fig 5. Wairau Lagoon Bathymetry, April 2021 (corrected to low tide on the day of sampling*). ............................... 21
Fig 6. Map of subtidal substrate in Wairau Lagoon, April 2021. ...................................................................................................... 23
Fig 7. Distribution and percent cover of subtidal macroalgae in Wairau Lagoon, April 2021. ..................................... 25
Fig 8. Distribution and biomass of subtidal macroalgae in Wairau Lagoon, April 2021. ................................................. 27
Fig 9. Distribution and cover of subtidal macrophytes in Wairau Lagoon April 2021....................................................... 28
Fig 10. Distribution and cover of subtidal filamentous green algae in Wairau Lagoon, April 2021.......................... 30
Fig 11. Spatial representation of salinity (ppt) in the Wairau Lagoon, April 2021. ............................................................... 31
Fig 12. Spatial representation of dissolved oxygen (% saturation) in the Wairau Lagoon, April 2021. ................... 32
Fig 13. Spatial representation of phytoplankton (chl-a) concentrations in the Wairau Lagoon, April 2021........ 33
Fig 14. Sediment macrofauna taxon richness and abundance per site. .................................................................................... 37
TABLES
Table 1. Summary of catchment land cover (LCDB5 2017/18), Wairau Lagoon. .................................................................. 11
Table 2. Description of water column, sediment and habitat indicators used in Wairau Lagoon 2021 ................ 18
Table 3. Condition ratings used to characterise estuarine health.................................................................................................. 20
Table 4. Summary of dominant subtidal substrate, Wairau Lagoon April 2021. ................................................................... 22
Table 5. Summary of subtidal macroalgal cover, Wairau Lagoon April 2021.......................................................................... 25
Table 6. Summary of subtidal macrophyte cover, Wairau Lagoon April 2021. ...................................................................... 28
Table 7. Summary of filamentous algae cover, Wairau Lagoon April 2021 .............................................................................. 30
Table 8. Sediment grainsize, nutrient, aRPD, trace metal and metalloid data for five composite samples. ........ 34
Table 9. Sediment grainsize, nutrient, aRPD, trace metal and metalloid data for five sites in April 2021.. ............ 36
Table 10. Summary of sites within an aRPD condition rating band for each substrate type. ....................................... 36
Table 11. Description of the sediment-dwelling species that were consistently the most abundant ................... 40
Table 12. Dominant broad scale features as a percentage of subtidal area, Wairau Lagoon 2021........................... 41
Table 13. Summary of key broad scale indicator results and ratings. .......................................................................................... 41
Table 14. Condition rating for sites that represent the worst 10% in the estuary................................................................ 43
For the People
Mō ngā tāngata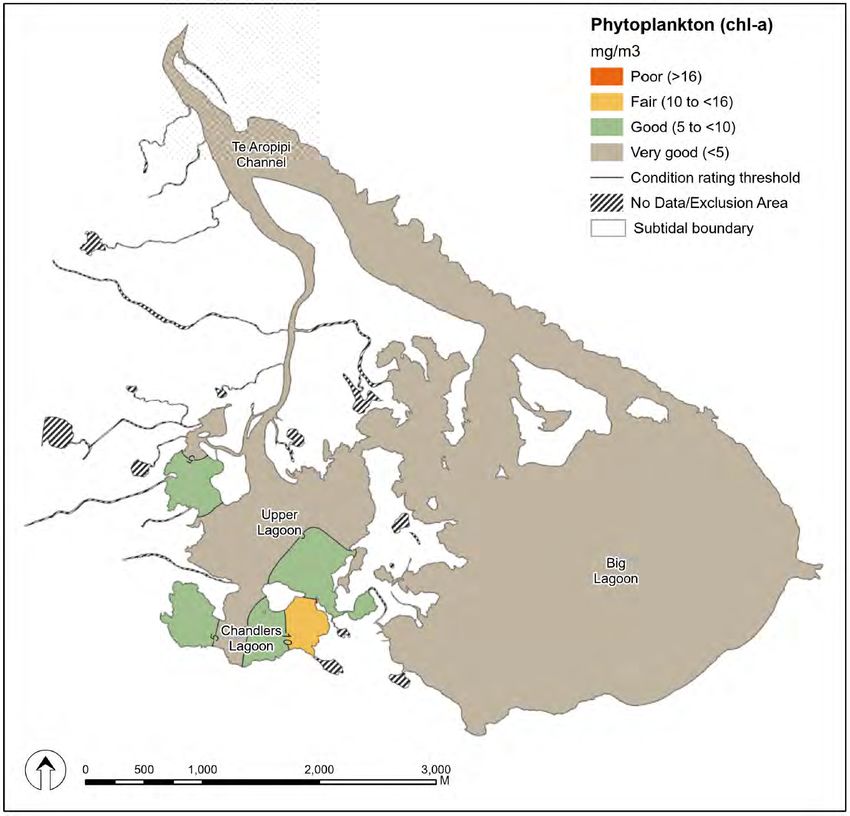
SUMMARY
Background
The Wairau Lagoon (also known as Waikārapi or Vernon Lagoons), east of Blenheim, is comprised of three
shallow (
Summary of key indicator results and ratings

Indicator                                           Unit                          Site                     Value                      2021 Rating
Broad scale indicators (estuary-wide)
Mud-dominated substrate       % of estuary area >50% mud                   98.5                                                             Poor
Intertidal Seagrass           % decrease from baseline                     100                                                              Poor
High Enrichment Conditions ha                                             ~480                                                              Poor
High Enrichment Conditions % of estuary                                    ~30                                                              Poor
Water quality indicators (representing the most impacted 10% of the estuary)
Dissolved oxygen (DO)              mg/L            Upper Lagoon (J4)      11.91                                                         Very Good
Phytoplankton (chl-a)             mg/m   3
                                                 Chandlers Lagoon (L5)     14.1                                                            Fair
Total Nitrogen                    mg/m   3
                                                   Upper Lagoon (J4)       370                                                             Fair
Total Phosphorus                  mg/m3            Upper Lagoon (J4)        73                                                             Poor
Sediment indicators (representing the most impacted 10% of the estuary)
Mud content                          %              Big Lagoon (L8)        95.2                                                            Poor
aRPD depth                          mm            73% of sites sampled
1. INTRODUCTION                                                  A typical way of modifying the NEMP approach for
                                                                 the assessment of estuarine lagoons is to use transect
Marlborough District Council (MDC) undertakes                    or grid-based site sampling, combined with the
long-term monitoring of the coastal marine area as               assessment of broad and fine scale metrics. These
part of its State of the Environment monitoring                  approaches and metrics can be repeated over time
programme. Since 2011, the estuarine component                   and scaled up or down to address specific issues, as
has focused on establishing baseline measures of                 necessary.
ecological condition in representative estuaries and             Broad scale measures include synoptic mapping of
bays throughout the region (e.g. Kaiuma,                         estuary depth, salinity or temperature stratification,
Mahakipawa, Havelock, Waikawa, Okiwa, Anakiwa,                   benthic substrate type, macrophyte, seagrass and
Mahau, Tuna, Duncan, Harvey, Broughton, Ngakuta,                 macroalgal cover, as well as delineating the spatial
Shakespeare, Whatamango) using methods                           extent and composition of phytoplankton. Fine scale
described in the National Estuary Monitoring                     measures include in situ water and sediment quality
Protocol (NEMP; Robertson et al. 2002a-c).                       measurements, in particular dissolved oxygen, and
The NEMP is intended to provide resource managers                the depth to the apparent sediment Redox Potential
with a scientifically defensible, cost-effective and             Discontinuity (aRPD).
standardised approach for monitoring the ecological              The addition of the subtidal components to NEMP
status of estuaries. The results provide a valuable              monitoring have been previously shown to be a
basis for establishing a benchmark of estuarine                  robust way to quickly describe estuarine lagoon
health in order to better understand human                       habitat and characterise trophic status (e.g. Forrest &
influences, particularly catchment influences related            Stevens 2019a-c; Stevens & Robertson 2012; Stevens
to the input of nutrients and muddy sediments, and               et al., 2020).
against which future comparisons can be made. The
                                                                 The current report describes the methods and results
NEMP approach involves two main types of survey:
                                                                 of subtidal monitoring undertaken at Wairau Lagoon
Broad scale mapping of estuarine intertidal habitats.            on 19-22 April 2021 (Fig. 1). The primary purpose of
This type of monitoring is typically undertaken every            the work was to characterise the presence and extent
5 to 10 years.                                                   of macrophytes, macroalgae and fine sediments,
Fine scale monitoring of intertidal estuarine biota              determine the presence of subtidal stratification or
and sediment quality. This type of monitoring is                 phytoplankton blooms, and assess the overall trophic
typically conducted at intervals of 5 years after                state of the estuary.
initially establishing a baseline.
This report describes the assessment of the Wairau
Lagoon (a.k.a. Waikārapi or Vernon Lagoons), a large
estuary that discharges to Cloudy Bay east of
Blenheim. Unlike most other estuary types in the
region, the Wairau Lagoon comprises a group of
shallow inter-connected lagoons that receive
variable levels of freshwater flushing and is artificially
open to the sea. When open the estuary is influenced
by tidal changes in water level and intrusion of saline
waters. Partial constriction of the estuary entrance
due to longshore drift can reduce flushing increasing
the lagoons susceptibility to nutrient retention and
eutrophication.
The intertidal broad and fine scale NEMP approaches
outlined above have been applied in Wairau Lagoon
in a previous survey by Berthelson et al. (2015).
However, in estuarine lagoons, such as Wairau,
symptoms of nutrient enrichment (eutrophication)
and excessive sedimentation tend to express most
strongly in sub-tidal areas, therefore monitoring
                                                                 Wairau Lagoon, shags roosting in lower estuary (bottom)
approaches in addition to those described in the
NEMP are needed to fully characterise this type of
estuary.

For the environment
Mō te taiao                                                  9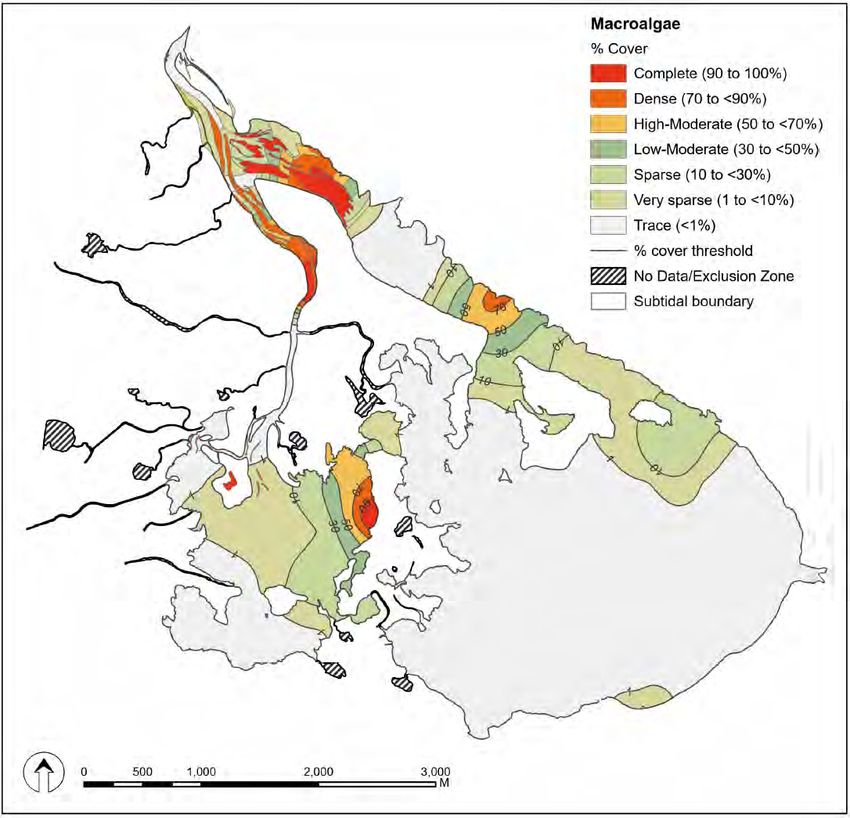
1.1   BACKGROUND TO WAIRAU LAGOON                               catchment have all altered the natural
                                                                geomorphological, hydrological and ecological
Previous reports (e.g. Berthelsen et al., 2015; Davidson
                                                                nature of the lagoon system (Berthelsen et al., 2015).
et al., 2011; Hayward et al., 2010; Knox 1983 & 1990;
                                                                Up until 1958, large beds of the native seagrass
Walls 1976) present background information on
                                                                ‘horse’s mane weed’ (Ruppia sp.) were present in Big
Wairau Lagoon, which is paraphrased (and expanded
                                                                Lagoon, before declining (Walls 1976). Ruppia is a
in places) below.
                                                                keystone species in that is helps to stabilise sediment,
Wairau Lagoon, east of Blenheim, is comprised of
                                                                oxygenate water and sediment, maintain high water
three shallow (
1983; 1990; Berthelsen et al., 2015). However, Ulva
was not recorded in 2015, suggesting its abundance
and distribution in Wairau Lagoon changes over time
(Berthelsen et al., 2015). Anecdotal reports indicate
the red macroalgae Agarophyton chilense (formerly
known as Gracilaria chilensis) appeared more recently
in the estuary (Berthelsen et al., 2015). In 2015,
Agarophyton covered 22ha (6% of the intertidal area)
and 85ha of the subtidal habitat, with dense attached
beds prominent in the Te Aropipi Channel near the
entrance (Berthelsen et al., 2015).
Salt marsh bordering Wairau Lagoon is extensive and
dominated by extensive areas of low-growing
herbfield species glasswort (Sarcocornia
quinqueflora), and smaller areas of taller rushland. Upper lagoon salt marsh extent 1966 (left) and 2019 (right).
Historically, large tracts of salt marsh have been Image source Retrolens and Google Earth.
cleared or drained for pasture or localised
infrastructure development (e.g. the Blenheim Table 1. Summary of catchment land cover
Wastewater Treatment Plant – WWTP; see photos). (LCDB5 2017/18), Wairau Lagoon.
Remaining salt marsh, while extensive, is
compromised in many areas by reduced connectivity LCDB (2017/18) Catchment Land Cover Ha %
with the main estuary due to the presence of flood 1 Built-up Area (settlement) 1671 2.9
banks and flapgates on drains to prevent seawater 2 Urban Parkland/Open Space 307 0.5
inflow. Furthermore, the modified margins limit both 6 Surface Mine or Dump 38 0.1
the habitat currently available for salt marsh, and the 16 Gravel or Rock 104 0.2
20 Lake or Pond 203 0.3
ability for it to naturally migrate inland in response to
21 River 167 0.3
predicted future sea level rise. 30 Short-rotation Cropland 1119 1.9
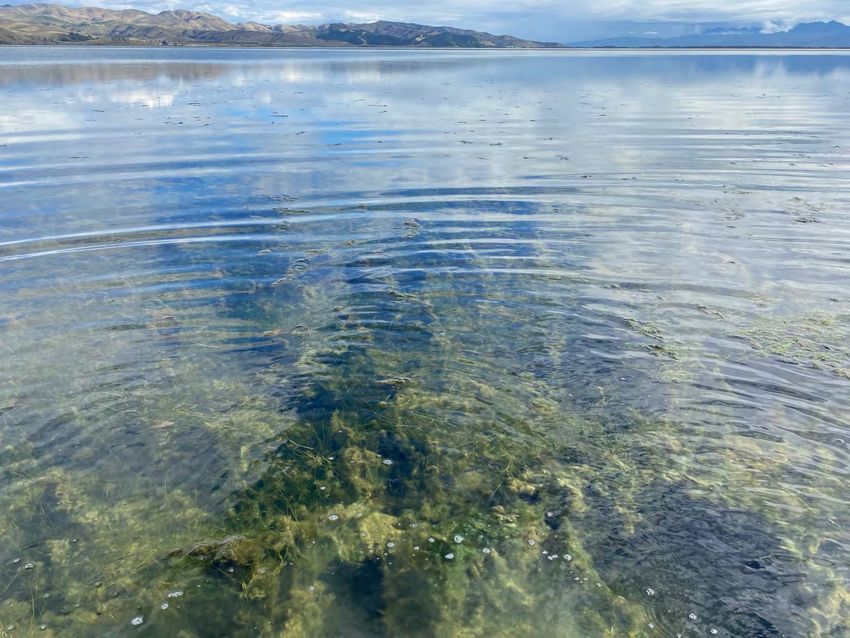
The 58,555ha surrounding catchment is dominated 33 Orchard/Vineyard/Other Perennial Crop 13867 23.7
by high producing pasture to the south (41%) and 40 High Producing Exotic Grassland 24032 41.0
orchard/vineyard or other perennial crops (24%) to 41 Low Producing Grassland 2550 4.4
the north. The steeper upper catchment is 43 Tall Tussock Grassland 736 1.3
dominated by manuka and/or kanuka (10%), 45 Herbaceous Freshwater Vegetation 198 0.3
fragments of indigenous forest (3%) and low 46 Herbaceous Saline Vegetation 520 0.9
50 Fernland 839 1.4
producing grassland in the foothills (4%); see Fig. 2,
51 Gorse and/or Broom 589 1.0
Table 1). Note, the lagoon catchment was considered 52 Manuka and/or Kanuka 5869 10.0
to exclude the Wairau River catchment upstream of 54 Broadleaved Indigenous Hardwoods 1592 2.7
the diversion as most of the river flow was assumed 58 Matagouri or Grey Scrub 94 0.2
to discharge directly to Cloudy Bay and bypass the 64 Forest - Harvested 70 0.1
lagoon. 68 Deciduous Hardwoods 254 0.4
69 Indigenous Forest 1715 2.9
71 Exotic Forest 1958 3.3
Grand Total 58555 100
The Wairau Lagoon, however, remains a nationally
significant ecological area with over 90 species of
birds recorded including endangered, vulnerable, or
rare species and several fish species (including
flounder and eels). The lagoon and bar system is also
of very high archeological significance being one of
the oldest known sites of Maori habitation in New
Zealand (Knox 1983). The lagoon has natural
Herbfield species glasswort (Sarcocornia quinqueflora)
(ecological and geological), cultural and social values.
For the environment
Mō te taiao 11that are, both regionally and nationally, significant.
Fig 2. Wairau Lagoon and surrounding catchment land use classifications from LCDB5 (2017/18)
database.
For the People
12 Mō ngā tāngata2. METHODS were visited and assessed using a combination of
grab sampling (custom-built hoe) or wading, with
2.1 OVERVIEW water and sediment quality measurements used to
characterise estuary health.
The focus of the current survey of Wairau Lagoon was Where there was a distinct change in either substrate
to map the dominant subtidal habitat features or vegetation cover, additional stations were added
(substrate and vegetation) and quantify the at higher resolution to better delineate the
ecological condition of the subtidal reaches using a boundaries between features (i.e. ~250m resolution).
suite of environmental indicators (Table 2). Where At 68 sites, substrate type and the percent cover of
applicable, the current survey was compared to any macroalgae, seagrass, macrophyte or
previous assessments, e.g. Berthelsen et al. (2015); filamentous algae species were recorded. Water
Knox (1983 & 1990). quality and sediment quality measures were also
collected at 58 sites, as described in Section 2.3.
2.2 BROADSCALE MAPPING METHODS
For areas where water clarity allowed direct visual
The type, presence and extent of substrate, observation (primarily shallow areas near the
macroalgae or seagrass reflects multiple factors, entrance), vegetation and substrate features were
including the combined influence of sediment drawn directly onto laminated aerial photographs,
deposition, nutrient availability, salinity, water quality, with station data recorded electronically in the
clarity and hydrology. As such, broad scale mapping Fulcrum app (see section 2.4). The broad scale
provides time-integrated measures of prevailing features were subsequently digitised into ArcMap
environmental conditions that are generally less 10.6 shapefiles using a Wacom Cintiq21UX drawing
prone to the small-scale temporal variation tablet and combined with field notes and
associated with instantaneous water quality georeferenced photographs. From this information,
measures. habitat maps were produced showing the dominant
Assessment criteria, developed largely from previous estuary features, e.g. macroalgae, and its underlying
broad scale mapping assessments, were used to help substrate type.
assess estuary condition (e.g. Fig. 3, Table 3). For subtidal areas that could not be directly
Additional details on specific broad scale measures observed, the sample data were imported into GIS
are provided below. While the intertidal areas, salt (ArcMap 10.6) and interpolated using the ‘Spline with
marsh and the terrestrial margin were observed Barriers’ tool. Combined with a barrier polygon
during the survey detailed mapping was outside the representing the subtidal boundary (see Appendix
scope of the current study and therefore the 11), point data values for salinity (ppt), dissolved
methods are not described here. oxygen (% saturation), phytoplankton (mg/m3), total
NEMP broad scale methods (Appendix 1) were used macroalgae (% cover), total macrophyte (% cover)
to map and categorise estuary substrate and and filamentous green algae (% cover) were used to
vegetation. The mapping procedure combines the create an output raster with a cell size of 10 metres
use of aerial photography, detailed ground truthing, for each layer.
and digital mapping using Geographic Information Contours along classification breaks were created
System (GIS) technology. Broad scale mapping was using the ‘Contour’ tool for each raster surface. These
undertaken using 0.2m/pixel rural aerial photos delineated areas were cross-checked against field
flown in 2015/16 and sourced from ESRI online New observations and used to calculate vegetation
Zealand imagery. Ground truthing was undertaken summary statistics. This method provides a probable
by experienced scientists who assessed the estuary area of cover based on the comprehensive grid
on foot and by boat to map the spatial extent of sampling undertaken.
dominant vegetation and substrate (see Appendix
10). Because of the large size (>1000ha) and shallow 2.2.1 Substrate classification
nature of the lagoon, a lightweight flat-bottomed Appendix 1 summarises the key NEMP classes used
Huntercraft lake boat with a recessed outboard jet to define estuarine substrate in the current report.
motor was used for the majority of the sampling Substrate classification is based on the dominant
(Southern Waterways). surface features present; e.g. rock, boulder, cobble,
As poor water clarity was anticipated to preclude gravel, sand, mud. Sand and mud substrates were
direct visual assessments for much of the subtidal divided into sub-categories based on sediment
area, a 500m grid system was overlain on the lagoon ‘muddiness’ and assessed by an experienced field
(see Fig. 4). At each designated station, subtidal areas observer taking into account the textural and
For the environment
Mō te taiao 13firmness characteristics of the substrate. The field- entrainment (>30mm rooted depth) status was
based assessment was subsequently cross-checked recorded.
against the results of grainsize (percent mud/ sand/
gravel) analyses at 7 locations (see Appendix 8). The
primary indicator used to assess sediment mud
impacts is the area (horizontal extent) of mud-
dominated sediment.
Eroded bed of Agarophyton on the intertidal flat of Te Aropipi
Channel
Site L3 substrate type soft mud (>90% mud)
Underwater photo of dense subtidal Agarophyton
2.2.2 Macroalgae 2.2.3 Seagrass
The NEMP provides no guidance on the assessment The NEMP provides no guidance on the assessment
of macroalgae beyond recording its presence when of seagrass beyond recording its presence when it is
it is a dominant surface feature. When present, the a dominant surface feature. Consequently, the mean
mean percent cover of discrete macroalgal patches percent cover of discrete seagrass patches was
was visually assessed using the 6-category percent visually assessed based on the 6-category percent
cover rating scale presented in Fig 3 as a guide. In cover rating scale presented in Fig 3.
representative patches biomass (wet weight) and
Fig 3. Visual rating scale for percentage cover estimates for macroalgae (top), seagrass (middle) and
macrophyte (bottom). Modified from FGDC (2012).
For the People
14 Mō ngā tāngata2.2.4 Macrophytes 2.3 SUBTIDAL SURVEY
The NEMP provides no guidance on the assessment
Water and sediment quality were recorded at 58
of macrophytes. As such, the relative abundance of
subtidal sites, distributed in a grid system as
and percent cover of different macrophyte species
discussed in Section 2.2 (see Fig 4, Appendix 9). For
was recorded using the categories in Fig 3 as a guide.
logistical and safety reasons, sampling of the upper
The method has been previously applied in other
lagoons was primarily conducted on the incoming
lagoon surveys (e.g. Forrest & Stevens 2019a-c).
tide. The tidal range at the Wairau Bar (estuary
entrance) across the four days of sampling was 0.29-
2.2.5 Filamentous algae
1.37m, reflecting neap tides, the predicted spring
The cover of filamentous algae was recorded using
tidal range for the area is 0.03-1.65m (NIWA Tide
the principles outlined in the previous sections and
Forecaster).
the percent cover categories in Fig 3. As filamentous
At all sites, the subtidal habitat was assessed by either
algae were commonly present growing as an
epiphyte on other vegetation, it was assessed wading or by sampling from a boat, to measure the
independently of seagrass or macrophytes to ensure following variables:
that the presence of all taxa were recorded. • Water depth
• Secchi disk clarity
• Surface and bottom water quality variables:
temperature, salinity, pH, dissolved oxygen,
chlorophyll-a
• Thermocline depth (if present)
• Halocline depth (if present)
• Substrate type
• Depth in the sediment of the apparent Redox
Potential Discontinuity (aRPD)
• At five sites (C3, F7, J4, J11 and L8) a sample was
collected for water quality (nutrient
concentrations) and sediment quality (i.e. heavy
metals, nutrients, organic content)
• At two sites (F7 and J11) a phytoplankton
sample was collected
• At 15 sites (C2, C3, D4, F7, G9, I2, I3, I7, J4, J8, J11,
L4, L8, M10.5, N10.5) the macroinvertebrate
assemblage was assessed
Surface view (top), underwater photo (middle) and hoe
sample (bottom) of Ruppia sp. with of epiphytic filamentous
algae Big Lagoon, standing on the boulder bank looking toward the
lagoon
For the environment
Mō te taiao 15Fig 4. Location of sampling points in Wairau Lagoon. The legend denotes the information and/or samples
collected at each site.
Wairau Bar entrance at high tide
For the People
16 Mō ngā tāngata2.3.1 Water column indicators Sediment analyses
At sites C3, F7, J4, J11 and L8 a composite sediment
In situ parameters
sample from three separate grabs (~250g in total)
At each sampling location, water quality measures
was collected from the sediment surface (to 20mm
were taken from ~20cm below the water surface. For
depth). Sediment samples were placed directly into
sites >0.5m deep a bottom measurement ~20cm
laboratory supplied sample containers, stored on ice,
above the bottom sediment surface was taken to
and sent to RJ Hill Laboratories for analysis of:
assess whether there was any salinity or temperature
stratification. Water column measures of pH, salinity, • Particle grain size (% mudTable 2. Description of water column, sediment and habitat indicators used in Wairau Lagoon 2021
Water quality indicators
Secchi depth visibility Field indicator of water clarity and potential for light penetration into the water
column.
Chlorophyll-a (phytoplankton) Field measure that provides a proxy indicator for phytoplankton biomass.
Water column nutrients Total nitrogen (TN) and total phosphorus (TP) concentrations help to characterise the
trophic status of shallow lakes and lagoons.
Dissolved oxygen Field indicator of oxygen saturation (algal productivity) or depletion (organic decay).
Salinity Field indicator of the extent of seawater influence.
Sediment indicators
Sediment grain size Indicates the relative proportion of fine-grained sediments that have accumulated.
Sediment nutrients & organic Total nitrogen (TN), total phosphorus (TP and Total Organic Content (TOC) reflect the
matter enrichment status of the estuary and potential for algal blooms and other symptoms
of enrichment.
Trace metals Common toxic contaminants (arsenic, copper, chromium, cadmium, lead, mercury,
nickel, zinc) generally associated with human activities.
Depth of apparent redox Subjective time-integrated measure of the enrichment state of sediments according
potential discontinuity layer to the visual transition between oxygenated surface sediments and deeper
(aRPD) deoxygenated black sediments. The aRPD generally gets closer to the sediment
surface as organic matter loading increases.
Biological indicators
Macrofauna The abundance, composition and diversity of macrofauna, especially the infauna
living with the sediment, are commonly used indicators of estuarine health.
Habitat indicators
Macrophytes Shallow lakes and lagoons with low nutrient status may have the entire bed covered
by macrophytes, with the cover decreasing as a system becomes increasingly
nutrient enriched and eutrophic. As enrichment increases, epiphytic plants, or
growths of opportunistic benthic macroalgae in the case of lagoons, may become
more prevalent and macrophyte abundance may decline.
Opportunistic Macroalgae Opportunistic macroalgae are a primary symptom of estuary eutrophication (nutrient
enrichment). They are highly effective at utilising excess nitrogen, enabling them to
out-compete other seaweed species and, at nuisance levels, can form mats on the
estuary surface that adversely impact underlying sediments and fauna, other algae,
fish, birds, seagrass, and salt marsh.
Entrance to the Big Lagoon, Wairau Lagoon
For the People
18 Mō ngā tāngata2.3.3 Macrofauna (Zeldis et al. 2017). The ETI provides screening
The abundance, composition, and diversity of guidance for assessing where an estuary is
macrofauna, especially the infauna living within the positioned on a eutrophication gradient. It includes
sediment, are commonly used indicators of estuarine site-specific thresholds for aRPD, dissolved oxygen,
health. Sediment to ~150mm deep from at least and phytoplankton concentrations, generally using
three separate grabs was collected from 15 sites (see spot measures from within the most degraded 10%
Fig. 4) and combined to make a composite sample of of the estuary. We adopted the ETI thresholds for
~2L. Where needed, additional grabs were collected present purposes except for;
until the required sediment volume was obtained. i. % mud we adopted the refinement to the ETI
Collected sediment was placed within a 0.5mm sieve thresholds described by Robertson et al. (2016);
bag, which was gently washed in site water to
ii. aRPD we modified the ETI ratings based on the
remove fine sediment. Because of the sampling
US Coastal and Marine Ecological Classification
methodology (grab sample rather than core) the
Standard Catalog of Units (FGDC 2012);
assessment is only intended as a qualitative measure
to assess the health of the benthic community and Furthermore, an assessment of water column
prevailing sediment conditions. nutrients was made using the National Policy
The retained animals were subsequently preserved in Statement for Freshwater Management (2020)
a 75% isopropyl alcohol and 25% seawater mixture attribute tables for Total Nitrogen and Total
for later sorting by Salt Ecology staff and taxonomic Phosphorus, acknowledging that the results from a
identification by Sarah Hailes and Barry Greenfield, one-off survey do not meet the statistical
NIWA. The macrofauna present in each sample, as requirements of the attribute.
well as the range of different species (i.e. richness) As many of the scoring categories in Table 3 are still
and their abundance, are well-established indicators provisional, they should be regarded only as a
of ecological health in estuarine and marine soft general guide to assist with interpretation of estuary
sediments. health status. Accordingly, it is major spatio-temporal
changes in the rating categories that are of most
2.4 DATA RECORDING AND QA/QC interest, rather than their subjective condition
descriptors (e.g. ‘poor’ health status should be
Field measurements were recorded electronically in
regarded more as a relative rather than absolute
templates that were custom-built using software
rating).
available at www.fulcrumapp.com. Pre-specified
constraints on data entry (e.g. with respect to data
type, minimum or maximum values) ensured that the
risk of erroneous data recording was minimised. Each
sampling record created in Fulcrum generated a GPS
position for that record (e.g. a sediment sample).
Data analysis, statistics and graphing were carried out
in R version 4.0.3 and GIS ArcMap 10.6. Water and
sediment samples sent for analysis at RJ Hill
Laboratories were tracked using standard Chain of
Custody forms, and results were transferred
electronically to avoid transcription errors.
2.5 ASSESSMENT OF ESTUARY CONDITION
In addition to our expert interpretation of the data,
results are assessed within the context of established
or developing estuarine health metrics (‘condition
ratings’), drawing on approaches from New Zealand
and overseas. These metrics assign different
indicators to one of four colour-coded ‘health status’
bands, as shown in Table 3.
View across the eastern end of Big Lagoon
The condition ratings used in the current report were
derived primarily from the Estuary Trophic Index (ETI;
Robertson et al. 2016b) and subsequent revisions
For the environment
Mō te taiao 19Table 3. Condition ratings used to characterise estuarine health. See footnotes and Appendix 2 for explanation of the origin or derivation of the different metrics. Indicator Unit Very good Good Fair Poor Broadscale Indicators 1 Intertidal seagrass % decrease from baseline
3. RESULTS                                                              For illustrative purposes, the GIS-based spline
                                                                        interpolation was used to highlight relative
3.1     BROADSCALE MAPPING                                              differences in water depth to assist in understanding
                                                                        potential explanatory variables with regard to the
3.1.1 Bathymetry                                                        presence of macrophytes (Fig. 5). Because the data
Fig 6 shows the approximate low tide depth of                           used for bathymetry were based on random grid
Wairau Lagoon recorded at each of the sampling                          sampling sites, there is no information on depth
stations. Not unexpectedly, the Upper Lagoon areas                      between points. Because the open lagoon areas
were very shallow: Big Lagoon max. depth 0.6m,                          were relatively uniform this approach is likely
Chandlers Lagoon max. depth 0.2m and Upper                              representative in the lagoons. However, the narrow
Lagoon max. depth 0.3m, and the lagoons showed                          and deeper Te Aropipi Channel areas were not
little variation in depth. Deeper water was confined                    targeted by the grid sampling stations and therefore
to the relatively narrow channels of the lower estuary.                 the interpolated depth contours do not accurately
                                                                        reflect mid-channel depths or capture gradients in
                                                                        depth between the mid-channel and the bank.

Fig 5. Wairau Lagoon Bathymetry, April 2021 (corrected to low tide on the day of sampling*).
*Time and depth were collected in Wairau Lagoon at each grid sampling point. Depth was corrected to low tide based on time using the rule of
twelfths. The minimum low tide height in the lagoon was delayed when compared to the estuary entrance, therefore the correction assumed a 2-
hour lag time for low tide in the lagoons and a 1-hour lag-time for low tide in the channels based on observations in the field.
For the environment
Mō te taiao                                                        21
3.1.2 Subtidal substrate
Table 4 and Fig 6 show subtidal substrate in the
Wairau Lagoon was dominated by mud (>90%
sediment mud content), with small component of
cobble and gravel field. The latter was largely present
as a narrow band along the edge of the Wairau Bar
boulder bank overlapping with the intertidal margin.
Below ~0.5m deep, there was a sharp transition to
soft or very soft muds. In areas where current flows
were higher relative to surrounding areas in the
lagoon, there was generally a reduction in mud
content, but sediments remained mud-dominated
(>50-90% mud). Within the narrow channels Gravel/cobble on lagoon margin
subjected to regular flushing, sediments were
relatively firm. However, deposition of fine sediments
was apparent on the margins of the shallow subtidal
channels, and within submerged salt marsh or
macroalgae.
Because of the dominance of fine sediment in the
lagoons, any disturbance of the seabed results in
waters becoming turbid. Given the relatively large
fetch and shallow depths present, wind generated
waves are likely to result in turbid conditions for
much of the time. This in turn is likely to limit the
areas that rooted macrophytes are able to establish,
as a consequence of light limitation in deeper areas.
Dense macrophyte cover suppresses sediment re-suspension
However, rooted macrophytes can grow in areas and traps fine sediment helping maintain clear waters
where light does not regularly reach the bottom if
they extend far enough from the seabed toward the
surface to get sufficient light. In this situation, the
presence of macrophytes can have a strong influence
on the turbidity by stabilising the sediments with
their root masses, dampening the effects of waves
and facilitating the trapping and deposition of
suspended sediment. Such influences provide a
positive feedback beneficial to macrophyte growth.
However, where rooted macrophytes are lost, there
is often a rapid cascading effect where the loss of
sediment stabilisation quickly leads to turbid
conditions where macrophytes can no longer grow Turbid water column due to resuspension of fine sediments
(Turner & Shwarz 2006 and references therein).
Table 4. Summary of dominant subtidal substrate,
Wairau Lagoon April 2021.
Substrate Class Ha %
Cobble field 1.9 0.2
Firm Sand (0-10% mud) 3.4 0.3
Mobile Muddy Sand (>10-25% mud) 9.4 0.8
Firm Muddy Sand (>10-25% mud) 4.6 0.4
Soft Sandy Mud (>50-90% mud) 113.1 9.2
Soft/Very soft Mud (>90% mud) 1093.3 89.2
Total 1226 100
Example of soft mud substrate in Big Lagoon
For the People
22 Mō ngā tāngataShallow water with clear (left) and turbid (right) water column. Note the very small change in wave energy needed to resuspend fine sediment Fig 6. Map of subtidal substrate in Wairau Lagoon, April 2021. For the environment Mō te taiao 23
3.1.3 Intertidal substrate                                         90%) and firm mud (>90% mud). This is consistent
While not a focus of the current report, intertidal flats          with lower flow velocities in lagoons and settling of
close to the estuary entrance and along the true right             fine sediments. Trapping of fine sediment in adjacent
bank of the Te Aropipi channel were dominated by                   salt marsh would also contribute to the higher mud
firm muddy sand (mud content 10-25%) and mobile                    content in the area.
sands (mud content 50%).
Based on photos in Berthelsen et al., (2015), the
change in substrate appears to be due to scouring of
fine sediment from the intertidal flats since 2015
rather than any difference in classification. Soft sandy
muds remained relatively widespread near the
channel in shallow subtidal areas.

                                                                   Eroding banks contribute fine sediment to the estuary
Intertidal flats on Te Aropipi channel near Cawthron Site C

Closer to the Big Lagoon entrance, in Chandlers                    Hard substrates (i.e. gravel and cobble) were localised
Lagoon and Upper Lagoon, the intertidal areas were                 to the margin connected to the boulder bank
predominantly firm sandy mud (mud content >50-                     separating the lagoon and the ocean.

                                                                                                                  For the People
                                                              24                                                  Mō ngā tāngata
3.1.4 Subtidal macroalgae Table 5. Summary of subtidal macroalgal cover, Table 5 and Fig 7 summarise macroalgal cover in Wairau Lagoon April 2021. Wairau Lagoon for April 2021. As discussed in the methods, in turbid subtidal waters which could not Percent Cover Category Ha % be directly visually assessed, macroalgal extent was Complete (>90%) 21.8 1.8 mapped by spatial interpolation from grab sampling Dense (70 to
The results (Table 5, Fig. 7) show that macroalgal          (Plew et al. 2020), indicating the current growths are
cover was 1450g/m2 as ‘bad’

                                                                                                             For the People
                                                       26                                                    Mō ngā tāngata
The recent reduction of subtidal beds also appeared
to be mirrored in the intertidal zone. Berthelsen et al.
(2015) reported that beds of macroalgae
(Agarophyton) covered ~21ha (6% of the intertidal
area) and were located primarily on the intertidal flats
of the true left bank near Site C, and the western end
of Budges Island.
However, it appears there has been significant
scouring on the intertidal flats near the entrance
compared to previous surveys with no appreciable
intertidal beds of macroalgae present in April 2021
(see adjacent photos).
Photos showing unvegetated intertidal flats on the true right
(top) and true left (bottom) west of Budges Island
Fig 8. Distribution and biomass of subtidal macroalgae in Wairau Lagoon, April 2021.
For the environment
Mō te taiao 273.1.5 Subtidal macrophytes Lagoon, Upper Lagoon or the lower Te Aropipi Table 6 and Fig. 9 summarise macrophyte cover in Channel. Wairau Lagoon in April 2021. Extensive beds of horse’s mane weed (Ruppia) were recorded in Big Table 6. Summary of subtidal macrophyte cover, Lagoon, particularly in the east. Complete cover Wairau Lagoon April 2021. (>90%) was recorded across 54.6ha or 4.5% of the subtidal area and >50% cover was recorded across Percent cover category Ha % 198.8ha or 16.2% of the subtidal area. Sparse growth Absent or trace (
Beach-cast Ruppia, present adjacent to mapped beds           No seagrass (Zostera muelleri) was recorded from the
but absent elsewhere, suggests the current mapping           estuary in 2021 (either subtidally or intertidally). This
has likely delineated all the major areas of                 is consistent with the findings of Berthelsen et al.
macrophyte growth in the lagoon.                             (2015) who hypothesised that hydrodynamic
                                                             changes,        increased      sedimentation,        and
                                                             displacement by macroalgae led to the significant
                                                             loss of previous seagrass. However, as it is unclear
                                                             where the previously reported seagrass beds were
                                                             located, it is not possible to easily determine which
                                                             factors may be primarily responsible for either the
                                                             absence or loss of seagrass.

Ruppia at Site J12 mixed with filamentous algae

The presence of dense and extensive macrophyte
beds was unexpected based on the previous lagoon
survey by Berthelsen et al. (2015) who hypothesised
the presence of subtidal vegetation (e.g. seagrass or
macrophytes) in the lagoon was improbable due to
the likely soft mud nature of benthic sediments and
reduced light at the seabed caused by poor water
clarity. However, extensive beds of Ruppia were
recorded in Big Lagoon in 1958, and while declining
after that time (Wells 1976), Ruppia was observed by
Knox (1983). It is highly unlikely that the Ruppia
recorded in April 2021 are beds that have newly
established since 2015. They more likely reflect beds
that have persisted over time, but due to a
combination of limited sampling effort, difficulty of
access, and study scope and objectives, have simply
not been observed.
                                                             Complete (>90%) filamentous algae cover, Site I11

                                                             Looking down at the extensive macrophyte cover and
                                                             filamentous algae in Big Lagoon
Dense Ruppia with epiphytic filamentous algae growth

For the environment
Mō te taiao                                             29
3.1.6 Subtidal filamentous green algae dense mats or growing epiphytically (see photos on Table 7 and Fig. 10 summarise filamentous green previous page). The extent and cover of filamentous algal cover. It was by far the most widespread plant algae reflects significant degradation of the lagoon. in the lagoon growing as smothering mats on bare sediments and epiphytically on Ruppia and Table 7. Summary of filamentous algae cover, macroalgae. The filamentous algae were a mix of two Wairau Lagoon April 2021 main species, Cyanophyceae a filamentous blue- green algae and Cladophora, with Cyanophyceae Percent cover category Ha % being the most abundant. Complete cover (>90%) Complete (>90%) 219.8 17.9 was recorded across 219.8ha or 17.9% of the subtidal Dense (70 to
3.2     WATER QUALITY                                      Big Lagoon, flushing appears limited with more
                                                           saline water concentrated in these areas (salinity
3.2.1 In situ parameters                                   range 26.2 – 28.7‰; Fig. 11). Upper Lagoon is
In situ water quality parameters are summarised in         influenced by several small freshwater inputs which
Figs 11, 12 and 13 with raw data in Appendix 5.            contribute to a decrease in the measured salinity
Temperature ranged from 12.2 to 17.3oC in the              range from 25.9 to 22.3‰. In Big Lagoon, where
surface waters of Wairau Lagoon, with cooler               dense macrophyte cover was recorded, salinity
temperatures monitored in the morning and                  ranged from 20.9 to 24.7‰. Marginally lower
temperature increasing throughout the day. There           salinities in the macrophyte beds likely reflect
was no vertical stratification of temperature.             reduced circulation, where water velocities are
                                                           dampened by the macrophytes, and flushing is
Salinity ranged from 13.7‰ near a freshwater inflow
                                                           reduced.
up to 29.6‰ on the incoming high tide. In sheltered
parts of Chandlers Lagoon and the western side of

Fig 11. Spatial representation of salinity (ppt) in the Wairau Lagoon, April 2021.

For the environment
Mō te taiao                                           31
Dissolved oxygen was over-saturated (>100%
saturation) at 49 of the 58 water quality sites (Fig. 12).
Dissolved oxygen is controlled by several factors;
including, stratification, physical aeration and
production and consumption processes (i.e.,
photosynthesis and respiration). Consistent with the
macrophytes, filamentous algae, macroalgae and
phytoplankton recorded in the lagoon, the dissolved
oxygen concentrations likely reflect high rates of
photosynthesis, a process where plants produce
oxygen. Dissolved oxygen concentration ranged
from 7.4 to 13.7mg/L a condition rating of ‘very
good’. However, it is important to note that over-
saturation of oxygen can indicate strong diurnal
fluctuations in oxygen may occur if plants utilise Epiphytic filamentous algae growing on Ruppia, both plants
more oxygen at night than they produce during the can produce oxygen through photosynthesis
day.
Fig 12. Spatial representation of dissolved oxygen (% saturation) in the Wairau Lagoon, 2021.
For the People
32 Mō ngā tāngata3.2.2 Phytoplankton Fig. 13 groups the measured phytoplankton (chlorophyll-a) concentrations in Wairau Lagoon into condition bands (Table 3) and presents data spatially. Raw data are presented in Appendix 5. The main channels and Big Lagoon were rated ‘very good’ indicating chlorophyll-a was low (
3.2.3 Water column nutrients                                      likely utilised by macrophytes and filamentous algae
A grab sample was analysed for water column                       in the area. In contrast water clarity was poor at Site
nutrient concentrations at five sites (C3, F7, J4, J11            L8 in Big Lagoon where no vegetation was present.
and L8 – Fig. 4). Total Nitrogen (TN) in the Upper                Most of the TP was made up of particulate
Lagoon (J4) was rated ‘fair’ and the two sites in the             phosphorus consistent with visible suspended
Big Lagoon (L8 and J11) were rated ‘good’ (Table 8).              sediments and DRP was below detection, a rating of
At these sites TN comprised of particulate and                    ‘good’. The two channel sites (C3 and F7) were rated
organic nitrogen with dissolved inorganic nitrogen                ‘good’ for TP with DRP ranging from 31 to 55% of TP.
(DIN) contributing
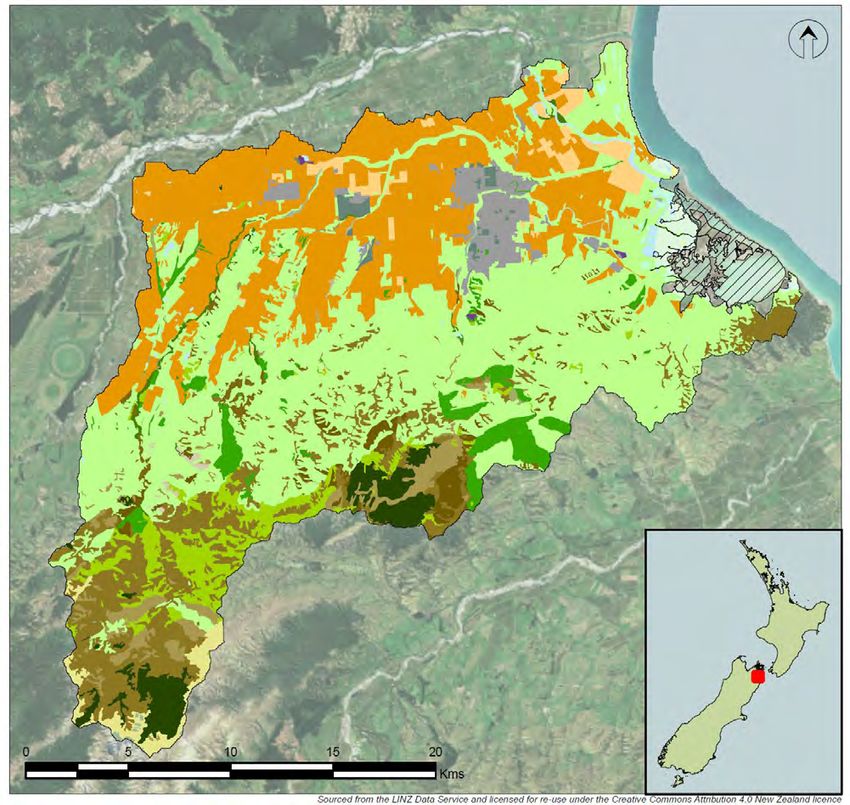
3.3.1 Sediment Grainsize
In Upper Lagoon (J4) and Big Lagoon (L8 and J11) the                                                              J4
mud content was high, a condition rating of ‘poor’.
These areas represent depositional zones. Site F7
represents a site within deepest part of the wide
channel connected to Big Lagoon. At this site the
mud content was high (75.8%; a condition rating of
‘poor’). Site C3, in the Te Aropipi Channel between
the lagoon and the estuary was sand-dominated and
had a low mud content, a condition rating of ‘good’.
This is consistent with the high flow velocities
through the narrow channel and limited settling of
fine sediments in this area.

3.3.2 Total organic carbon and nutrients                                                                           L8
In general, lower mud content corresponded to
lower Total Organic Carbon (TOC) and nutrients (TN
and TP). In Upper Lagoon (J4) and the Ta Aropipi
Channel site closest to Big Lagoon (F7), TOC was
rated ‘very good’ and TN ‘good’. TP was lower than
the muddiest sites, however no condition rating has
been developed for sediment TP.
The two Big Lagoon sites (J8 and J11) had moderate
TOC and TN, a condition rating of ‘fair’. TP ranged
                                                                                                                 J11
between 620 – 640mg/kg. The high levels of TOC and
nutrients are correlated with a very high mud
content (>95% mud). Although the source of
sediment inputs will contribute to its quality, higher
TOC and nutrient concentrations recorded in the Big
Lagoon compared to other parts of the estuary
indicate a possible internal source of carbon and
nutrients (i.e., decomposing algae and macrophytes)
in this area.                                                                                                     C3
In Te Aropipi Channel (C3), the sand dominated site
had lower TOC (a condition rating of ‘very good’), TN
(a condition rating of ‘good’) and TP (no rating
available).

                                                                                                                   F7

                                                              Sediment quality sites corresponding to the sites in Table 5

For the environment
Mō te taiao                                              35
You can also read