CHARLES COUNTY NUISANCE &
URBAN FLOOD PLAN
                   10.2020
←
→
Page content transcription
If your browser does not render page correctly, please read the page content below
CHARLES COUNTY NUISANCE &
URBAN FLOOD PLAN
10.2020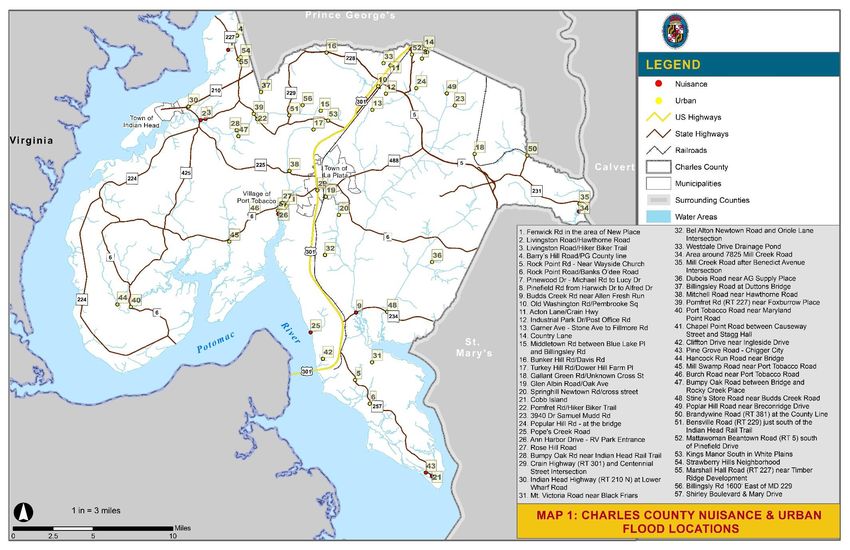
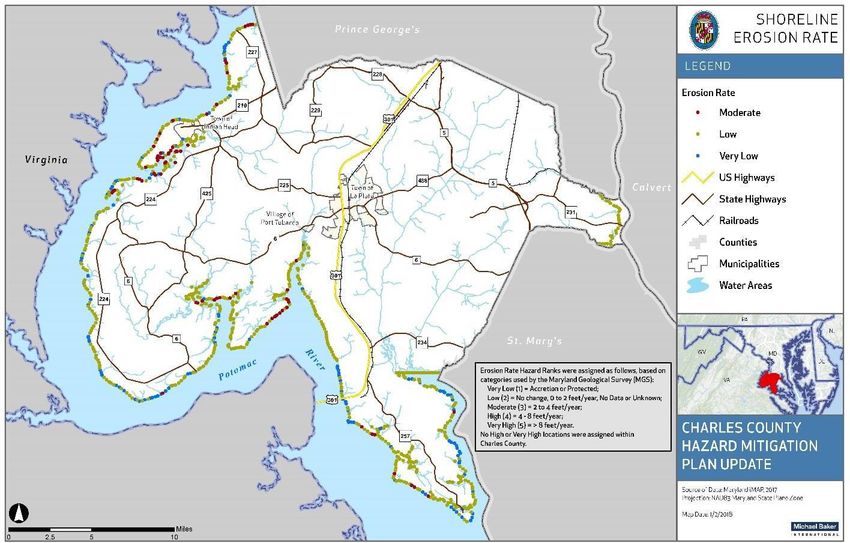
Table of Contents
Introduction                                                   1
Charles County Nuisance and Urban Flooding Problem Statement   1
Nuisance Flooding Plan and Considerations                      1
Plan Purpose and Goals                                         3
Nuisance and Urban Flood Plan and
2018 Charles County Hazard Mitigation Plan                     4
Nuisance and Urban Flooding Stakeholder Group                  4
Nuisance and Urban Flooding Public Outreach Efforts            5
Nuisance and Urban Flooding ArcGIS StoryMap                    6
Nuisance and Urban Flooding ArcGIS Podcast                     7
Additional County Climate Action & Resiliency Efforts          7
Identification of Nuisance and Urban Flood Areas               10
Nuisance Flood Areas                                           25
Identification of Flood Thresholds, Water Levels,
& Conditions                                                   27
Flood Insurance Study (FIS)                                    27
Tidal Gauge Data                                               27
Tidal Gauge Data vs Flood Insurance Study Discussion           28
Sea Level Rise and Shoreline Erosion                           28
Stormwater & Drainage Ordinances & Improvements
Projects                                                       32
Stormwater Management Ordinance                                32
Storm Drainage Ordinance                                       32
Stormwater Management and Impervious Surface                   33
Drainage Improvement Projects                                  33
Nuisance & Urban Flood Response, Preparedness, &
Mitigation                                                     35
Drainage Improvement Plan & Project Prioritization
Criteria                                                       56
Implementation & Monitoring                                    57
Continuous Communication with the Public                       57
Appendix
Appendix 1. NCEI Storm Event Data- Charles County Roadway
Flooding Events                                             58

Tables
Table 1. Nuisance and Urban Flood Locations                 13
Table 2. Nuisance and Urban Flooding Preparedness,
Response, & Mitigation                                      37

Maps
Map 1. Charles County Nuisance and Urban Flood Locations    12
Map 2. Charles County Nuisance Flood Locations              26
Acknowledgements
This planning project has been made possible by grant
funding from the EPA, provided by Maryland Department of
Natural Resources through the Grants Gateway.

County Commissioners:
  Rueben B. Collins, II
  Bobby Rucci
  Gilbert O. Bowling, III
  Thomasina O. Coates
  Amanda M. Stewart

Stakeholders:
  Department of Emergency Services
  Department of Planning & Growth Management
  Department of Public Works
  Maryland Emergency Management Agency
  MD State Highway Administration
  Charles County Volunteer Fire & EMS Associations
  Port Tobacco River Conservancy
  Town of La Plata
  Town of Indian Head
  Charles County Media Services
  Charles County Sheriff’s Office
  College of Southern Maryland

Consultants
  Maryland Environment Services
  Michael Baker International
  Smith Planning & Design

  This project has been funded wholly or in part by the United
   States Environmental Protection Agency under assistance
    agreement CB96358501 to the Maryland Department of
   Natural Resources. The contents of this document do not
 necessarily reflect the views and policies of the Environmental
 Protection Agency, nor does the EPA endorse trade names or
 recommend the use of commercial products mentioned in this
                            document.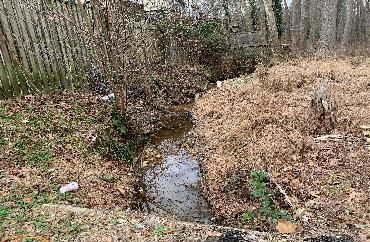
Charles County Nuisance & Urban Flooding Plan 2020

                                                     Introduction
                                                     The purpose of the nuisance flood plan is to identify sources of nuisance and urban flooding,
                                                     analyze flood hazards, and recommend actions to reduce flooding and increase community
                                                     resiliency. While it was recommended that all jurisdictions within Maryland’s Coastal Zone
                                                     develop a Nuisance Flood Plan, Charles County recognizes both nuisance and urban flooding
                                                     within this document. It is crucial to address both nuisance and urban flooding to increase
                                                     resiliency, as both types of flooding affect the county.

                                                     Charles County Nuisance and Urban Flooding Problem Statement
                                                     Charles County, Maryland is experiencing flooding outside mapped floodplains with increasing
                                                     frequency, including both nuisance and urban flooding. Nuisance flooding is associated with
                                                     high tides that flow back through the stormwater system, increasing/raising the level of
                                                     groundwater, and overtopping the banks and edge of waterways. Nuisance flooding is an
                                                     indicator of rising water levels in the Chesapeake Bay and its tributaries. Areas that were
                                                     previously dry now flood during high tides because the water elevation is high enough to lap over
                                                     the banks of waterways and to enter stormwater systems through outfalls that were previously
                                                     high enough to prevent backflow, while allowing outflow. Urban flooding is due to a variety of
                                                     issues related to development: increased impervious surface, disruption of natural watershed
                                                     flows and functions, undersized and aged stormwater infrastructure, and changing weather
                                                     patterns which exacerbate the inadequacies of older stormwater systems and the fragmented
                                                     watersheds. Urban flooding reflects decades of development that has outstripped the capacity of
                                                     stormwater infrastructure and disrupted the natural flow and discharge of watersheds.
                                                     Additionally, many stormwater systems are beyond their expected useful life and in need of
                                                     repair and replacement. These challenges are compounded by what is becoming the new
                                                     normal: an increase in the frequency and intensity of storms caused by higher global
                                                     temperatures that increase evaporation in the ocean and atmosphere, creating more favorable
                                                     conditions for heavier and more frequent precipitation. Increased runoff can contribute more
                                                     nutrients, contaminants (e.g. oil, gasoline, antifreeze, among others) and sedimentation into the
                                                     waterways and ultimately the Bay.

                                                      Nuisance Flooding Plan and Considerations
                                                       There is recognition by Maryland lawmakers, local and state governments, and citizens that tidally
                                                       driven nuisance flood events are happening with more frequency. While nuisance flooding may
                                                       not pose a serious threat or result in major damage, it interrupts and causes impacts to daily
                                                       routines and can negatively impact commerce. Pursuant to Maryland House Bill 1427 (2019), §3-
                                                       1018(b) and (c), on or before Oct. 1, 2020, a local jurisdiction that experiences nuisance flooding
                                                       (NF) shall develop a plan to address nuisance flooding. In addition, a local jurisdiction shall update
                                                       the plan every five years; publish the plan on the local jurisdiction’s website; and shall submit a
                                                       copy of the plan to the Maryland Department of Planning (Planning). This legislation is an update
                                                       to Senate Bill 1006 and House Bill 1350 (2018). It is recommended that all jurisdictions, including
                                                       municipalities, within Maryland’s Coastal Zone develop a Nuisance Flood Plan even if they do not
                                                       meet the requirements of the legislation. Charles County is located within the Maryland’s Coastal
                                                       Zone and is within the Chesapeake Bay Watershed Area.

                                                                                                                                                   1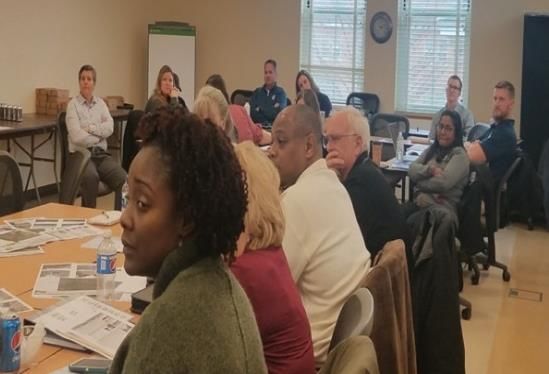
Charles County Nuisance & Urban Flooding Plan 2020

                                                     Charles County, Maryland is experiencing flooding outside mapped floodplains with increasing
                                                     frequency, including both nuisance and urban flooding.

                                                       Nuisance Flooding

                                                                  High Tide

                                                            2020 Sea Level

                                                       Nuisance flooding is associated with high tides that flow back through the stormwater system,
                                                       increasing/raising the level of groundwater, and overtopping the banks and edge of waterways.
                                                       Nuisance flooding is an indicator of rising water levels in the Chesapeake Bay and its tributaries. Areas
                                                       that were previously dry now flood during high tides because the water elevation is high enough to lap
                                                       over the banks of waterways and to enter stormwater systems through outfalls that were previously
                                                       high enough to prevent backflow, while allowing outflow outside mapped floodplains with increasing
                                                       frequency, including both nuisance and urban flooding.

                                                       Nuisance flooding is defined in §3-1001 of the Natural Resource Article of the Maryland Annotated
                                                       Code as “high-tide flooding that causes public inconvenience.”

                                                       Urban Flooding

                                                             Backed up Storm Sewer + Runoff

                                                       Urban flooding is associated with precipitation events and is due to a variety of issues related to
                                                       development: increased impervious surface, disruption of natural watershed flows and functions,
                                                       undersized and aged stormwater infrastructure, and changing weather patterns which exacerbate
                                                       the inadequacies of older stormwater systems and the fragmented watersheds. Urban flooding
                                                       reflects decades of development that has outstripped the capacity of stormwater infrastructure and
                                                       disrupted the natural flow and discharge of watersheds.

                                                       Additionally, many stormwater systems are beyond their expected useful life and in need of repair and
                                                       replacement.

                                                                                                                                                          2
Charles County Nuisance & Urban Flooding Plan 2020

                                                     Plan Purpose and Goals

                                                     The Plan will identify the sources and locations of nuisance and
                                                     urban flooding, present an analysis of both hazards (e.g.
                                                     frequency, duration, depth of flooding, and effects), and provide
                                                     recommended actions to reduce flooding and increase
                                                     community resiliency. Developing the Plan will help make
                                                     Charles County safer and more resistant to flood damage by
                                                     nuisance and urban flooding. The Plan will also fulfill the
                                                     requirements set forth in Maryland House Bill 1427 (2019),
                                                     §3-1018(b) and (c), which requires on or before October 1,
                                                     2020, that all local jurisdictions that experience nuisance
                                                     flooding must develop a nuisance flood plan to address that
                                                     flooding and update the plan every five years. To maintain the
                                                     mandated update cycle, the Plan will be appended to become            Source:
                                                     part of the County’s 2018 Hazard Mitigation Plan Update, which        https://dnr.maryland.gov/ccs/Doc
                                                     must also be updated every five years.                                uments/NuisanceFloodPlan.pdf

                                                                To develop a Nuisance and Urban Flooding Plan that will be adopted as a new
                                                                Chapter into the Charles County Hazard Mitigation Plan.

                                                                To have the plan methods and format be a template that can be used by other
                                                                jurisdictions to use create their own nuisance and urban flooding plan.

                                                                To integrate the plan’s mitigation actions into other County plans, programs, and
                                                                land-use regulation to comprehensively address and resolve the issue.

                                                                To use a of variety of mitigation actions to address issues, including, but not
                                                                limited to: education and outreach, planning, stormwater improvements,
                                                                watershed/stream restoration, green infrastructure solutions, best practices which
                                                                may include both construction (capital) and ordinance/zoning-related (noncapital)
                                                                projects.

                                                                                                                                                   3
Charles County Nuisance & Urban Flooding Plan 2020

                                                     Nuisance and Urban Flood Plan and 2018 Charles County
                                                     Hazard Mitigation Plan
                                                     As part of the 2018 Charles County Hazard Mitigation Plan, various flood
                                                     mitigation action items were identified for implementation over the next
                                                     five-year planning cycle. One such action item pertinent to the Nuisance
                                                     Flood Plan (NFP) is as flows:

                                                     Action Item: Identify roadways/bridges that frequently flood and
                                                     mitigate to ensure ingress and egress.

                                                     Through the development of the Nuisance and Urban Flood Plan this
                                                     2018 hazard mitigation plan action item is being completed. In addition,
                                                     upon completion the Nuisance and Urban Flood Plan that will be             Source:https://www.charlescountymd.
                                                     adopted as a new Chapter into the Charles County Hazard Mitigation         gov/sites/default/files/es/em/Charles
                                                                                                                                %20County%202018%20HMP.pdf
                                                     Plan.

                                                     Nuisance and Urban Flooding Stakeholder Group
                                                     This group included representation from various sectors of the County government,
                                                     municipalities, the business community, neighborhood associations, and other stakeholders
                                                     identified by the County. The Stakeholder Group guided planning efforts and assisted with
                                                     community support and outreach efforts. Participants included representatives from the
                                                     following:

                                                           Department of Emergency                                      Port Tobacco River
                                                           Services;                                                    Conservancy
                                                           Planning and Growth                                          College of Southern
                                                           Management;                                                  Maryland
                                                           Public Works includes                                        Maryland Emergency
                                                           Transportation, Capital                                      Management (MEMA)
                                                           Services, & Utilities;                                       Maryland Department of
                                                           Elected Officials;                                           Transportation (MDOT)
                                                           County & Municipal                                           Public Schools/Board of
                                                           Representatives;                                             Education
                                                           Transportation;                                              Soil Conservation
                                                           Community Stakeholders;                                      Chamber of Commerce;
                                                           Port Tobacco Village                                         and,
                                                           Town of La Plata                                             Charles County Volunteer
                                                           Town of Indian Head                                          Fire.

                                                     The initial meeting of the Nuisance and Urban Flooding Stakeholder Group was held on 20
                                                     February 2020. Agenda items included:

                                                           Project Scope, Schedule, & Expectations
                                                           Climate Change Literature Review & Context

                                                                                                                                                        4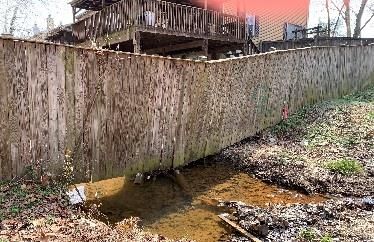
Charles County Nuisance & Urban Flooding Plan 2020

                                                           Work Session Coastal Flooding & Sea Level Rise Group Work & Report Out
                                                           • Site Specific Problem Statement & Description;
                                                           • Preparedness;
                                                           • Response; and,
                                                           • Mitigation.
                                                           Public Outreach Strategy

                                                     Additional information gathered during the initial stakeholder meeting, as well as modifications
                                                     to previously collected data was collected. This information was then integrated into the plan
                                                     document and the ArcGIS StoryMap.

                                                     Nuisance and Urban Flooding Public Outreach Efforts
                                                     Including the public is an important part of the planning process. A robust public engagement
                                                     component was key to the success of this planning process. Outreach was woven throughout
                                                     the planning process for developing the Charles County Nuisance and Urban Flooding Plan.

                                                     Public outreach efforts focused on the following:
                                                      1. Informed the community about the Plan and provided an opportunity to gather information
                                                          from the community about nuisance and urban flooding,
                                                      2. Communicated flood risk and sought input on solutions members of the community
                                                          wanted to see implemented to reduce flooding, and a final meeting
                                                      3. Communicate flood preparedness actions that individuals can take to reduce their flood
                                                          hazard, the Plan mitigation strategy for carrying out the identified solutions and plan
                                                          implementation.

                                                     The nuisance and urban flood website was developed to communicate with the public and
                                                     provide information on the planning process. In addition, social media outreach specific to the
                                                     plan was conducted across all platforms. Analytics collected from the Charles County Media
                                                     Services are shown below:

                                                     Facebook
                                                        • General Posts (5 Posts) > 10,718 Reach, 53 Reactions, 3 Comments, 22 Shares, 299
                                                          Post Clicks
                                                        • Aug. 14 Map Your Flood Video > People reached: 942, Reactions: 7, Shares: 8, Post
                                                          Clicks: 20
                                                        • Aug. 19 Map Your Flood Video > People reached: 329, Comments: 1, Post Clicks: 4

                                                                                                                                                  5
Charles County Nuisance & Urban Flooding Plan 2020
• Aug. 20 Nuisance Vs Urban Flooding Video > People reached: 418, Share: 1, Post
Clicks: 7
• Aug. 31 Nuisance Vs Urban Flooding Video > People Reached: 563, Post Clicks: 1
Twitter
• General Posts: (6 Posts) > 3681 Impressions, 57 Engagement (reactions, retweets etc.)
• Aug. 13 Map Your Flood Video > 311 Impressions, Detail expands: 11, Link Clicks: 1,
Profile Clicks: 1
• Aug. 13 Nuisance Vs Urban Flooding Video > Impressions: 282, Detail expands: 3, Link
Clicks: 2
NextDoor
• 2 Posts, 5738 Impressions, 5 Reactions, 2 Comments
YouTube
• Map Your Flooding (:30s) 116 views / Avg.View 0:20 (68.6%)
• Nuisance vs Urban Flooding (:40s) 34 views / Avg. View 0:21 (54.1%)
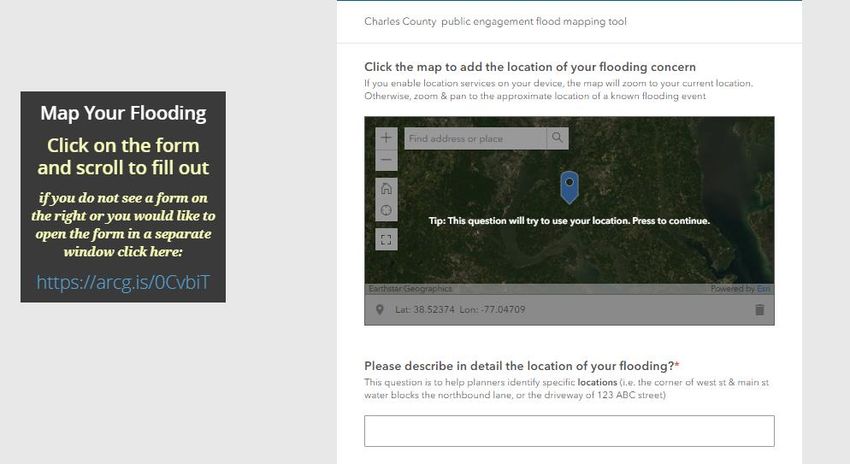
Nuisance and Urban Flooding ArcGIS StoryMap
As part of this planning
initiative, an ArcGIS StoryMap
was developed. An ArcGIS
StoryMap is a web-based
application that enables users
to acquire information through
stories with custom maps that
inform and engage.
Information on upcoming
public events related to the
Plan, was posted under
What’s Happening Now on
the Get Involved tab. In
addition to public events, the
public was able to show the Nuisance and Urban Flooding ArcGIS StoryMap
Team where they have https://maryland.maps.arcgis.com/apps/Cascade/index.html?appid
=7bb024fa03ff46a58e07323e16bdb7f1
experienced nuisance and
urban flooding using the map
provided at Map Your Flooding (link) and adding a note describing the size, depth, duration,
the weather, or any other flood characteristics that they thought were important for the Team to
know.
Under the Department of Emergency Services’ “Emergency Preparedness” webpage, the
Nuisance and Urban Flooding ArcGIS StoryMap has been added. The public is encouraged to
access the ArcGIS StoryMap to learn more about nuisance and urban flooding in Charles
County. In addition, the StoryMap provides an opportunity for the public to provide feedback
and the ability to map their flood issues.
6Charles County Nuisance & Urban Flooding Plan 2020
Nuisance & Urban Flooding Podcast
Charles County Government has
introduced a series of podcasts, “Charles
County Unscripted.” Podcast subscribers
can tune in and listen to county stories,
news, and information at home or on the
go, on any mobile device. County staff
interview a variety of guests who provide
an inside look at the people, places, and
events that shape Charles County
Government and our community. One of
the podcast programs, “Inside Your County Government,” explores the range of services the
government provides. During the planning process, Michele Lily, Director of Emergency
Services participated in the “Nuisance/Urban Flood Podcast.
Description of Podcast
We talk with Michelle Lilly, Director of Emergency Services, about what nuisance and urban
flooding are and the department’s efforts to develop the County's Nuisance Flood Plan.
To participate in the comments and include a location in the County you see flood, please visit the
Map Your Flooding Survey website or email Flooding@CharlesCountyMD.gov
For more information on the flood plan, visit the Nuisance and Urban Flooding Storymap webpage.
Additional County Climate Action & Resiliency Efforts
Charles County Government is working to reduce greenhouse gas emissions, transition to 100
percent renewable electricity, improve sustainability in county operations, and educate the
county workforce on climate change mitigation and adaptation measures.
Charles County is one of three vanguard counties in the state working with the University of
Maryland Center for Global Sustainability on a project called Resiliency Planning and
Financing for Maryland Counties. The goal of the project is to develop Resilience Action Plans
to establish planning and financing systems in pursuit of climate change resilience. The effort
includes elements such as:
• The essential role of multi-community collaboration and coordination.
• Ensuring resilience efforts address needs of the most vulnerable populations.
• Integrating resilience planning into every aspect of local government operation.
• Approaching resiliency as a community asset rather than an obligation.
• Addressing the limitation of fiscal resources and understanding how to prioritize actions
among multiple departments and stakeholders.
• Aligning priorities and resources with community goals to jumpstart the resiliency process.
7Charles County Nuisance & Urban Flooding Plan 2020
County government planning efforts are underway for construction projects for solar arrays on
county-owned land that will offset more than 100 percent of electricity needs for county
buildings and facilities. The county has worked to reduce greenhouse gas emissions by
utilizing appropriate landfill covers and upgrading the current passive collection system to one
that actively captures emissions. Additionally, several measures have been instituted to
increase the recycling rate to 46 percent, added to a 4 percent source-reduction-credit, equals
a total-waste-diversion rate of 50 percent.
Shoreline restoration along the Potomac and Wicomico Rivers has also been prioritized with
the completion of a scientific assessment that identified 153 sites along 27 miles of shoreline in
most need of restoration for ecological services benefits, including storm surge buffering,
carbon sequestration, wetlands restoration, and habitat creation.
Three high priority actions that can be cross referenced and integrated into the County’s
Nuisance and Urban Flood Plan include:
1. Mitigate roads for current and future flood predictions.
Strategy: Coordinate investments to mitigation roads for future climate conditions.
Performance measure: The number of roads that have been protected against future flooding
events.
Performance target: Provide mitigation for one flooded road location per fiscal year.
Possible actions include the following:
• Target coordination with the Maryland State Highways Administration to work
collaboratively on a plan to harden roads to withstand flood events using the Urban &
Nuisance Flooding Plan as the guide to prioritizing actions.
• Prioritize drainage (stormwater management) projects through a planned analysis of
Countywide projects & prioritization.
• Add flood gauges, for safety, to areas prone to flooding.
• Post-pandemic review remote teleworking policies.
2. Maintain operation of County-owned roadways that are susceptible to sea level rise
or flooding (nuisance or otherwise).
Strategy: Fortify vulnerable roadways against flooding and sea level rise by raising the
roadbed; improving drainage/stormwater management in the public right-of-way; and
improving drainage/stormwater management in flood-prone areas.
Performance measure: A certain percentage of flood and sea level rise prone roads
hardened and mitigated; a certain number of gallons of stormwater managed by new projects.
Performance target: Set target of 10% of flood and sea level rise prone roads fortified by
2030; 50% by 2040; 100% by 2050; and 50% of all stormwater managed on-site by 2030,
100% by 2050.
• Possible actions include the following:
• Identify sea level rise and flood prone roads.
• Develop priority list for road mitigation.
• Develop priority list for stormwater management improvements. This list should be
available soon from work underway with the Maryland Environmental Service.
• Construct improvements beginning with the highest priority.
8Charles County Nuisance & Urban Flooding Plan 2020
3. Improve SWM features (repair, maintain, and upgrade as needed).
Strategy: Improve SWM structure resiliency by prioritizing structures in flood prone areas and
taking appropriate action to include upgrades, retrofits, and repairs.
Performance measure: Percent of SWM structures improved.
Performance target: 10% of prioritized SWM structures improved by 2030, 25% by 2040,
50% by 2050.
Possible actions include the following:
• Identify stormwater structures that require retrofit (per 2010 regulations) and develop a
priority list.
• Research known areas of flooding and add to priority list for retrofit/upgrade/repair.
• Develop a public outreach plan to educate Homeowner Associations (HOAs) and
stormwater structures owners about maintenance and repair procedures.
• Determine which stormwater feature projects could utilize watershed funding and
benefit County's MS4 goals.
9Charles County Nuisance & Urban Flooding Plan 2020
Identification of Nuisance and Urban Flood Areas
As an initial step in the data gathering process, flood event data was obtained from the
National Center for Environmental Information (NCEI) and is included in Appendix 1. This data
was reviewed to aid in the determination of nuisance and urban flood locations. Additional
information gathered by the Department of Emergency Services of known flood areas resulted
in a listing of roadways and intersections. This listing was used to develop a flood location
map. Staff from Department of Emergency Services and Department of Planning and Growth
Management along with consultants working on the planning project conducted a tour of
identified nuisance and urban flood areas on January 23, 2020. Twenty-seven nuisance and
urban flood locations were identified. Additional information gathered during the flood
identification site visits included a description per site and a site photograph.
The initial meeting of the Nuisance and Urban Flooding Stakeholder Group was held on
February 20, 2020. During the meeting, stakeholders reviewed preliminary information
gathered by the core planning team, which included nuisance and urban flood locations sites 1
thru 27. In addition to reviewing and updating of the initial identified flood locations, the
stakeholders in attendance identified twenty new flood locations, sites 28 thru 48, which have
been added to Table 1 and depicted on Map 1. Furthermore, distinction was made between
those sites identified as nuisance or tidally influenced flood and urban flooding. Nine of the
forty-eight sites were considered nuisance flooding and are depicted on Map 2.
Site Example
Site #1: Fenwick Road in the area
of New Place is a nuisance flood
location and is impacted by the
Pomonkey Creek.
10Charles County Nuisance & Urban Flooding Plan 2020
TABLE 1. NUISANCE AND URBAN FLOOD LOCATIONS
MAPS 1 & 2
11Charles County Nuisance & Urban Flooding Plan 2020 12
TABLE 1: NUISANCE AND URBAN FLOOD LOCATIONS
                                                                                       Water Level      State/County/
Identifier          Location Name                     Source of Flooding
                                                                                         Mark             Municipal
             Fenwick Road in the area of
                                               Nuisance - Pomonkey Creek                2 feet         County
             New Place
             Description: Located in the northwestern portion of the county, Fenwick
             Road is in close proximity to Pomonkey Creek and. Mill Swamp is also
             adjacent to Fenwick Road. Several low points along the roadway allows
    1
             water to overtop the roadway. Also, the road is at the same level as the
             creek. High tides heavy rains and flooding can render the road impassable.
             This area of the road that floods is in a “bowl” and the excessive water is
             partly is due to upstream developments and a limited outfall Flooding
             occurs along Fenwick Road between New Place and Ward Place.
             Livingston Road                   Nuisance - Tributary #1 to
             (RT 224) at Hawthorne Road Mattawoman Creek; storm surge,                  1-2 feet       State
             (RT 225)                          high tide and heavy rain events
             Description: Due to a very low spot on
             Livingston Road (RT 224), water overtops the
             roadway frequently. A tributary to the
    2
             Mattawoman Creek intersects at this site. A
             wetland is located along the road. Also, a
             culvert is located at the intersection of
             Livingston and Hawthorne Roads, which may
             be blocked by overgrown vegetation. Beaver dam issues are also
             exacerbating the flood issue. In the past, flooding has caused the entire roadway to close for 2 days.
             Livingston Road (RT 224) at Nuisance - Tributary #2 to
                                                                                        1-2 feet       State
             Indian Head Rail Trail            Mattawoman Creek
             Description: The low area on Livingston Road floods during high tide. This low area
             is at the Indian Head Rail Trail. The trail floods causing water to flow across
    3        Livingston Road. A tributary to the Mattawoman Creek is near this area. Flooding in
             this area is also contributed to by the wetland that floods mentioned in Site #2.

             Barry’s Hill Road near Old
                                               Urban - Mill Swamp                      1-2 feet        County
             Marshall Hall Road
             Description: Barry Hill Road is adjacent to Mill Swamp. The road elevation
             is nearly level with the water elevation on both sides of the road. Drainage
    4        north from Mill Swamp to the Potomac River may be limited by blocked
             culverts or poor conveyance. There are two access points into the area
             and signage indicating “Flood Area” is located along the side of the road.
             Flooding at this site is also contributed to by beavers located downstream
             on a private property.
                                               Nuisance & Urban - Flash Flood;
             Rock Point Road (RT 257) in                                               Less than 1
                                               Piccowaxen Creek & Wicomico                             State
             the area of Wayside Church                                                foot
                                               Creek
             Description: Low section of the road allows overtopping during a heavy rain event.
             Ditchley Prong in close proximity to the area. Route 257 is located within the
    5
             floodplain. During severe weather events, all of the road and structures are
             underwater. Complete destruction after an event.

                                                                                                                13
Water Level State/County/
Identifier Location Name Source of Flooding
Mark Municipal
Rock Point Road (RT 257)
Nuisance & Urban - Flash Flood 2 – 2.5 feet State
near Banks O’dee Road
Description: This poorly constructed, low-lying road that floods during
heavy rain events resulting in road closure. Flooding occurs up to 500
6 yards north of the intersection on Route 257. There is poor drainage and
agriculture runoff at this site exacerbating the flood conditions. Tide levels
also affect this area. This site is one of the top 5 road issues in the county.
Pinewood Drive from
Urban 3 feet County
Michael Road to Lucy Drive
Description: This site is in a large housing development, Pinefield
Neighborhood, that experiences stormwater issues during heavy rain
7 events. Flood elevations increase closer to Pinewood Drive; up to 5 feet.
Pinefield Road from Harwich 1-2 feet
Urban County
Drive to Alfred Drive average
Description: Pinefield Road is in a large
housing development and has been identified
as a priority area for urban flooding.
8 Stormwater issues causes flooding in this area
during heavy rain events. Storm system
collections denoted by catch basins are
located on corners only resulting in a limited
conveyance network. Flood depths are
between 3-5 feet during a major storm event.
Budds Creek Road (Rt 234) Nuisance - Allens Fresh Run –
-- State
near Allens Fresh Run Tributary to Wicomico River
Description: The Allen’s Fresh Bridge on Budds Creek Road experiences
tidal flooding. The Allens Fresh Run drains into the Wicomico River, which
9 is in close proximity.
After Hurricane Lee, mitigation projects included improvements to the
bridge. Only an issue during a major tropical storm or hurricane event.
Old Washington Road and Less than 1
Urban - Tributary #1 to Piney Branch State
Pembrooke Square foot
Description: Old Washington Road and Pembrooke
Square flood due to stormwater issues and impervious
surface. A tributary to the Piney Branch may also be a
10 possible flood source. Conveyance is poor across MD
925 Old Washington Rd and downstream that leads to
backups and topping of swale. (Wetland-Piney Branch)
14Water Level State/County/
Identifier Location Name Source of Flooding
Mark Municipal
Acton Lane near Crain Hwy Urban – Flash Flood Events 2 feet County
Description: Stormwater issues and a low section on Acton Lane results in flooding
during a heavy rain event. Only the right lane next to the credit union floods with up to
2 feet of water. One lane road.
11
Water Level State/County/
Identifier Location Name Source of Flooding
Mark Municipal
Industrial Park Drive and
Urban 1-2 feet County
Post Office Rd Intersection
Description: Unnamed tributary enters a
culvert north of Post Office Road and exits into
channel north of the Southern MD Workforce
Services property. Dense urban area
12
associated with MD 301 up-stream leads to
high volumes of runoff during rain events.
Excessive flows will typically top the culvert on
the north side of Post Office Drive and flood
the intersection and then discharge into the channel on the south side. Also, a large controlled SWMP is
located upstream. Note: This may be related to site #10, Piney Branch Wetland.
Garner Avenue between
Less than 1
Stone Avenue to Fillmore Urban County
foot
Road
Description: Garner Avenue is in the St. Charles Neighborhood.
Stormwater issues cause flooding in the Carrington subdivision. All roads
13
drain to channel located in residents’ back yards. Box culverts are located
along streets and at intersections that drain under the residential
properties (front to back) to a drainage channel. Kerrick Swamp next to
Fillmore Road. Drainage improvements were completed recently.
Country Lane near Temi Urban - Tributary of Mattawoman
3-4 feet County
Drive Intersection Creek; Stream Flooding
Description: Country Lane is in the Pinefield Neighborhood and floods due
to stormwater issues. System can’t manage rainfall and gets overwhelmed
14 due to lots of impervious surface. The bridge into the Pinefield
neighborhood is stormwater issue as well. Pinefield Road and Orleans
Lane to Alfred Lane had 3-4 feet of standing water from a rain event in July
2019. Stormwater or Sewer repairs currently in process. Drainage
improvement projects have been developed.
Middletown Road between
Less than 1
Blue Lake Place and Urban County
foot
Billingsley Road
Description: Stormwater issues results in flooding along Middletown Road.
There is a drainage ditch along the road, which overflows during heavy
rain events. Most of Middletown Road and Turkey Hill Road are flooded
15
routinely. It is common to have water on the road daily. Flooding occurs
frequently near roundabout. Drainage improvements in process with
installation of a roundabout. Issue near roundabout, SWM structures dead
end and have nowhere to go. May need to partner with landowner to
mitigate.
15Water Level State/County/
Identifier Location Name Source of Flooding
Mark Municipal
Bunker Hill Road near Davis Less than 1
Urban - Piney Branch County
Road foot
Description: Davis Road is bridged over Piney
Branch and then runs along Bunker Hill Road
where a small stormwater management pond
controls some of the road run off from the
16 intersection of Bunkers Hill Road and Berry
Road. Piney Branch crosses Berry Road,
draining into the Mattawoman Creek.
Combined drainage from roads and adjacent
developments have led to an increase in flooding in this area. Minor improvements made with the
addition of a small stormwater management pond. Mainly floods during a major storm event. During
major storm events, bridge has been under 2 to 3 feet of water.
Turkey Hill Road Urban - Port Tobacco Creek 1-2 feet County
Description: Multiple areas along Turkey Hill Road are affected by flooding.
A culvert is located right next to road; however, the road washes out during
heavy rain events.
17
Improvements have been completed and no new reports of flooding.
Gallant Green Road near
Urban – Swanson Creek 1 foot County
Truman Manor Lane
Description: Flooding occurs near Truman Manor Lane. One side of the
road is impacted by flooding; however, water recedes quickly. Old pipes
18 are rotting and decaying.
Glen Albin Road intersection
Urban 1-2 feet County
with Oak Avenue
Description: Water flows from Glen Oak Court and Oak Avenue into the
intersection with Glen Albin Road. Stormwater issues cause flooding
19 during heavy rain event. Issues began after new housing development was
began.
Springhill Newtown Road
Urban - Clark Run Tributary 3 feet County
intersection with Glen Albin
Description: Flooding occurred near Ashely Ridge Place. An improvement
project was completed 5 years ago. However, this area is still an issue.
20 Road elevation is too low, and the bridge is not adequate. Newtown to
Glen Albin -rushing water, major run-off and silt issues
16Water Level State/County/
Identifier Location Name Source of Flooding
Mark Municipal
2 or more feet
Cobb Island (MD 254) at
Nuisance - Neale Sound at approach to State
Bridge Approach
bridge
Description: Flooding occurs at the approach
to bridge. The Crab Houses located on both
21 sides of the road are Repetitive Loss
Properties. Flood events prevents residents
from evacuating the Island. Island topography
has many low-lying areas characterized with
dips in roadway and drainage patterns leading
to Potomac River through culverts.
Pomfret Road (RT 227) at
Urban 2 feet/4-5 feet State
Indian Head Rail Trail
Description: Stormwater issues at the intersection of Pomfret Road and
the Indian Head Rail Trail cause flooding during heavy rain events. Flood
22 water depths on the road are at 2 feet. However, flood depths on the
shoulder are 4 to 5 feet due to a major drop off between the road and
shoulder. This area is a low spot that all water drains to. Flood water
comes from various directions to this area and water backs up to the
Mattawoman Creek. Guardrail recommended. Erosion issues at this site.
3940 Dr. Samuel Mudd
Urban 1 foot County
Road
Description: Drainage ditch alongside of Dr. Samuel Mudd Road and flows
through a culvert at the driveway. Devils Nest crosses under a small bridge
23 south location. Flooding is the result of stormwater issues.
Over 200 feet of drainage pipe was recently replaced. Issue should be
resolved.
Poplar Hill Road between
St. Peters Church Road and Urban - Tributary #1 to Jordan
1-2 feet County
Mattawoman Beantown Swamp
Road (at the bridge)
Description: Low section in the road with a culvert running under roadway.
24 Stormwater issues cause roadway flooding.
Less than 1
Pope's Creek Road Nuisance - Potomac River County
foot
Description: Flooding occurs at the Pope’s
Creek Road bridge abutments. This area is
25 not restricted when flooded, there are 2
access points into the area. Crab House is a
Repetitive Loss Property. Signs of high tide
and debris can be seen on the shoulder of the
road.
17Water Level State/County/
Identifier Location Name Source of Flooding
Mark Municipal
Ann Harbor Drive at RV Park
Nuisance - Port Tobacco River 1-2 feet Private
Entrance
Description: Properties are in violation of floodplain ordinance. Entire resort
is under water during flood event with no evacuation plan (trailers are not
26 relocated prior to event). Flooding occurs at the entrance of the RV Park.
The canal area that drains to the Potomac River overtops the road during a
high tide.
Rose Hill Road Urban - Wetland 1-2 feet County
Description: Rose Hill Road floods at
intersection with Port Tobacco Road with 1-2
ft of water across road. Abandoned blocked
culvert on West side of road that allows flow
27
under Rose Hill Road into Port Tobacco
Creek. Also, low sections of road are
impacted by the adjacent wetland. Area is
improving since the beavers have been
removed.
Bumpy Oak Road near Indian
Urban – Pond/Mattawoman Creek 1-2 feet County
Head Rail Trail
A pond is located in the northeast corner of the Bumpy Oak Road and
Indian Head Rail Trail intersection. Mattowoman Creek is in close
proximity. The road elevation is only a few feet higher than the water
28
surface elevation of the pond. Heavy rain events cause the pond to rise
and overtop the road.
Crain Highway (RT 301) and Less than 1
Urban State/Town
Centennial Street Intersection foot
Located in the Town of LaPlata, this area experiences flooding due to
stormwater issues.
29
Indian Head Highway (RT
Urban – Major Storm Events 1-2 feet State/County
210 N) at Lower Wharf Road
Limited access school buses when flooded. Stormwater issues cause
flooding in this area.
30
18Water Level State/County/
Identifier Location Name Source of Flooding
Mark Municipal
Mt. Victoria Road near Black Less than 1
Urban County
Friars foot
Limited access school buses when flooded. Wide area affected,
approximately 10 to 15 feet.
31
Bel Alton Newtown Road and
Urban 1-2 feet County
Oriole Lane Intersection
Limited access for school buses when flooded. Drainage pond located in
the field along Bel Alton Newtown Road and across from Oriole Lane.
32
Out of Banks:
Westdale Drive Townhomes Urban County
4 feet
A stream channel and drainage area behind
the townhomes on Westdale Drive. Flooding
33 of this channel is causing damage to the
townhomes.
Area around 7825 Mill Creek
Nuisance – Patuxent River 2 foot County
Road
Tidal flooding from the Patuxent River affects this area. This area of Benedict is
surrounded by a cove of the east side and Patuxent River on the west.
34
Mill Creek Road after
Urban 2 foot County
Benedict Avenue Intersection
Flooding in 2 locations; before and after the firehouse.
35
19Water Level State/County/
Identifier Location Name Source of Flooding
Mark Municipal
Dubois Road near AG Supply
Urban – Denton Run 2 feet County
Place
Denton Run intersects with Dubois Road. During heavy rain events, flood
waters overflow onto the roadway.
36
Billingsley Road at Duttons
Urban - Mattawoman Creek 3-5 feet County
Bridge
Flood waters from the Mattawoman Creek overflow onto the roadway near the
bidge.
37
Mitchell Road near Less than 1
Urban County
Hawthorne Road (RT 225) foot
Only one side of the road is inundated.
38
Pomfret Road (RT 227) near Less than 1
Urban - Mattawoman Creek State
Foxburrow Place foot
Flooding occurs near the bridge during storm events. The Mattawoman
Creek traverses Pomfret Road at this site location.
39
Port Tobacco Road (MD 6)
Urban - Nanjemoy Creek 2-2.5 feet State
near Maryland Point Road
Roadway flooding occurs near the bridge that crosses Nanjemoy Creek.
40
20Water Level State/County/
Identifier Location Name Source of Flooding
Mark Municipal
Chapel Point Road between
Less than 1
Causeway Street and Stagg Urban – Heavy Rain Events County
foot
Hall
Runoff issues cause roadway flooding during heavy rain events.
41
Clifton Drive near Ingleside Less than 1
Urban – Clifton Creek County
Drive foot
The floodplain to Clifton Creek is adjacent to Clifton Drive on one side of
the road, while a wetland is located on the other.
42
Pine Grove Road - Chigger Less than 1
Nuisance – Neale Sound County
City foot
Flooding in this area is a common nuisance since the road is within close
proximity to the Neale Sound.
43
Hancock Run Road near Less than 1
Urban – Beaverdam Creek County
Bridge foot
A beaver issue is causing Beaverdam Creek to flood the roadway during
heavy rain events.
44
Mill Swamp Road near Port Less than 1
Urban – Mill Run & Burgess Creek County
Tobacco Road (RT 6) foot
A large wetland is located adjacent to Mill Swamp Road. Burgess Creek traverses
the road as well. Low road elevation allows water to overflow from the wetland
during storm events.
45
21Water Level State/County/
Identifier Location Name Source of Flooding
Mark Municipal
Burch Road near Port Less than 1
Urban – Wetland County
Tobacco Road (RT 6) foot
A large wetland is located along both sides of Burch Road.
46
Bumpy Oak Road between
Urban - Tributary No. 5 to Less than 1
Bridge and Rocky Creek County
Mattawoman Creek foot
Place
Tributary Number 5 to Mattawoman Creek runs parallel with this section of road.
47
Stine’s Store Road near Less than 1
Urban – Gilbert Swamp Run County
Budds Creek Road (RT 234) foot
Gilbert Swamp Run traverse Stine’s Store Road and flows into Newport
Run after the bridge.
48
Poplar Hill Road near
Urban - Zekiah Swamp Over 3 feet County
Breconridge Drive
Description: Zekiah Swamp flows under the bridge located along Popular
Hill Road. This site experienced extremely fast-moving water overtopping
49 the roadway during a July 2020 heavy rain event. First time swift water has
been seen at this location.
Popular Hill bridge is currently under design for a rebuilt by the State.
Brandywine Road (RT 381)
Urban – Swanson Creek Over 3 feet State
at the County Line
Description: During the July 2020 heavy rain event,
flooding occurred on Brandywine Road near the county
line. Extremely fast-moving water from both the County
50 Line Creek and Swanson Creek overtopped the bridge.
Measurements taken after the event determined the total
flood water length, encompassing the bridge, was
approximately 540’. First time swift water has been seen
at this location and swift water rescues were necessary for
past 2 events.
22Water Level State/County/
Identifier Location Name Source of Flooding
Mark Municipal
Bensville Road (RT 229) just
south of the Indian Head Urban – Heavy Rain Events 1-2 feet State
Rail Trail
Description: This section of road is a steep hill,
with a blind curve, leading to the Indian Head
Rail Trail crossing. Due to the lack of a
51
drainage system, the roadway floods during
heavy rain events. Numerous wrecks with
fatalities have occurred at this location due to
the roadway conditions. Old Womans Run
flows under the roadway just north of the trail
crossing.
Mattawoman Beantown Road
(RT 5) south of Pinefield Urban - Heavy Rain Events 1-2 feet State
Drive
Description: Amongst these addresses: 2290,
2270, 2262, 2254, and 2246 Mattawoman
Beantown Road, a deep ponding develops in the
52
right lane of the road during heavy rains. This is
partially due to the storm drainage collection
boxes along Mattawoman Beantown Road, which
are blocked with growth, debris, and trash. Public
Works flushed the drainage system; however,
system should be monitored.
Kings Manor South in White Less than 1
Urban State/County
Plains foot
Description: The neighborhood in Kings Manor South has dealt with
flooding due to drainage issues reported by the public as “design flaws” that
53 occurred in the development of the neighborhood. Some minor work has
been completed to address the drainage problem, such as remodeling and
modernizing the current drainage system. However, the issues with the
drainage system persists resulting in flooding. Port Tobacco Creek and a
tributary surround the neighborhood.
Strawberry Hills
Urban 1-2 feet County
Neighborhood
Description: Several locations within the Strawberry Hills
Neighborhood have been impacted by flooding. These
locations are as follows: 6808 Lantana Drive, 6908 Arbor
54 Lane, 6858 Arbor Lane, and the intersection of Woodbury
Drive and Heather Drive. The beginning section of Arbor
Lane also experiences flooding during heavy rain events.
Flooding at these locations is due to drainage system
issues. In addition, flooding has occurred at the intersection of Woodbury Drive and
Heather Drive and is due to drainage system maintenance issues.
Marshall Hall Road (RT 227)
Less than 1
near Timber Ridge Urban - Heavy Rain Events State
foot
Development
Description: The riprap and geotextile washed away
along Marshall Hall Road during a heavy rain event,
55 blocking culvert pipes causing the roadway to flood. The
storm drain discharge at the Timber Ridge new
construction site and Strawberry Hill subdivision is
causing severe flooding, erosion and damage. Note, this
is the first time this event has been reported, therefore
should be monitored.
23Water Level State/County/
Identifier Location Name Source of Flooding
Mark Municipal
Billingsley Rd 1600’ East of Less than 1
Urban County
MD 229 foot
Description: Stream crossing flooding due to undersized pipe and need of
road fill. A tributary to Pole Branch traverses the roadway at this site.
56
Shirley Boulevard & Mary
County
Drive
Description: Culvert under Shirley Boulevard. Canal located between
Shirley Boulevard and Mary Drive.
57
Tidal issues – Storm surge rises causing flooding
24Charles County Nuisance & Urban Flooding Plan 2020
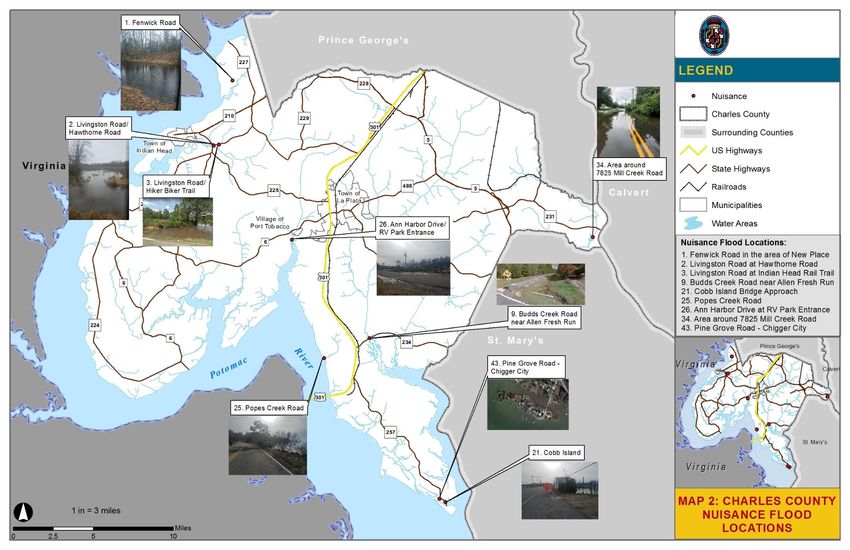
Nuisance Flood Areas
Analysis of the forty-eight identified flood locations depicted and listed on Map 1 indicates that
nine of these flood locations are tidally influenced and categorized as nuisance flood areas.
These locations include:
• Fenwick Road in the area of New Place;
• Livingston Road at Hawthorn Road;
• Livingston Road low area near the Indian Head Rail Trail;
• Allen’s Fresh Bridge on Budds Creek Road;
• Cobb Island/MD 254 bridge approach;
• Pope’s Creek Road bridge area; and,
• Ann Harbor Drive - RV Park Entrance;
• Area around 7825 Mill Creek Road; and,
• Pine Grove Road-Chigger City.
All nine-nuisance flood location are listed in Table 1 and depicted on Map 2.
25Charles County Nuisance & Urban Flooding Plan 2020 26
Charles County Nuisance & Urban Flooding Plan 2020

                                                     Identification of Flood Thresholds, Water Levels, & Conditions
                                                     Flood Insurance Study (FIS)
                                                     According to the Charles County Flood Insurance Study (FIS) revised
                                                     May 4, 2015, the principal flood problems of Charles County are coastal
                                                     areas that are vulnerable to tidal flooding due to major storms such as
                                                     hurricanes and nor’easters. Both of these storm types generate strong
                                                     winds that can push large volumes of water inland. The severity of tidal
                                                     flood damage depends on various factors, such as topography, the rate
                                                     floodwater rises, depth and duration, wave action exposure, and
                                                     quantity and type of structures or infrastructure within the floodplain. As
                                                     such, the Potomac River, Patuxent River, and the Wicomico River are
                                                     the primary sources of flooding in Charles County.                            Source: FEMA MAP Service Center

                                                     The timing of the maximum storm surge in conjunction with the normal tidal cycle can play an
                                                     important role in the extent of tidal flooding. Mean tidal ranges within the Potomac and
                                                     Patuxent Rivers are generally in the 1.5 feet range. Prolonged easterly or southeasterly winds
                                                     typically increase tidal elevations while northwest winds typically lower tidal elevations. The
                                                     storm surge in the Patuxent, Potomac, and Wicomico Rivers affects approximately 6, 115, and
                                                     21 miles respectively, of Charles County coastline. As previously mentioned, storm surges in
                                                     combination with mean high or mean higher-high tides can result in more severe and
                                                     extensive tidal flooding.

                                                     Tidal Gauge Data
                                                     The National Oceanic and Atmospheric
                                                     Administration (NOAA) maintains and
                                                     operates tidal gauge and
                                                     meteorological stations throughout the
                                                     region. The closest NOAA gage to Charles County is located at the Naval Surface Warfare
                                                     Center (NSWC) at Dahlgren, Virginia. These gauges record a plethora of information such as
                                                     tides/water levels, tide predictions, sea level trends, extreme water levels, and various other
                                                     meteorological observations.

                                                     Tidal gauges can be useful to compare tidal fluctuations and peak events with the still-water
                                                     floodwater elevations for calculated storm events as reported in the FIS. For example,
                                                     according to the FIS, the Potomac River at the U.S. Route 301 Bridge has a 100-year (1%
                                                     annual chance) flood elevation of 5.8 feet (NAVD88). Tide gauges use reference values called
                                                     datums. In general, a datum is a base elevation used as a reference from which to determine
                                                     heights or depths. A tidal datum is a standard elevation defined by a certain phase of the tide.
                                                     The NAVD88 datum value at the Dahlgren gage is 1.02. This allows a comparison between
                                                     the FIS and gauge data, given that the tidal gage is sufficiently close to flooding source
                                                     location.

                                                                                                                                                          27
Charles County Nuisance & Urban Flooding Plan 2020
Tidal Gauge Data vs Flood Insurance Study Discussion
The maximum recorded tide at the Dahlgren gauge was 5.01 on September 18, 2018.
Therefore, converting the gage datum to the flood elevation during that September flood would
result in an elevation of 3.99 feet (NAVD88). According to the FIS, a 10-year (10% annual
chance) tidal flood event at the U.S. 301 Bridge would be at an elevation of 4.1 feet. It would
be reasonable to state that the September 18 tidal gauge measurement was approximately a
10-year flood event. Additionally, the table below illustrates the top ten highest and lowest
recorded tidal events for the Dahlgren gauge provided in the NAVD88 datum over the last 5
years. Note that the top ten highest recorded gauge measurements are all within a span of 0.7
feet.
TABLE 3: HIGHEST AND LOWEST VALUES - DAHLGREN, VA - STATION ID: 8635027
Station: 8635027 Begin Date: 19800218
Name: Dahlgren End Date: 20200218
Product: High/Low Units: Feet
Datum: NAVD Quality: Verified
Rank Highest Highest Date Zone Lowest Lowest Date Zone
1 3.99 20180910 07:30 GMT -4.42 20180105 04:36 GMT
2 3.84 20180909 19:18 GMT -4.12 20180303 01:54 GMT
3 3.62 20191012 18:42 GMT -3.74 20180302 16:06 GMT
4 3.47 20191012 06:24 GMT -3.57 20180303 15:00 GMT
5 3.46 20180307 11:06 GMT -3.45 20180303 15:00 GMT
6 3.44 20151004 00:06 GMT -3.23 20170315 04:06 GMT
7 3.41 20151005 00:36 GMT -3.22 20180104 17:54 GMT
8 3.36 20151004 12:18 GMT -3.15 20180106 18:48 GMT
9 3.32 20180910 20:00 GMT -3.10 20180107 18:36 GMT
10 3.29 20180911 08:30 GMT -3.09 20190121 15:06 GMT
Source: https://tidesandcurrents.noaa.gov/stationhome.html?id=8635027 NOAA Tides & Currents-Dahlgren, VA - Station ID:
8635027
This exercise can be utilized to approximately correlate recorded tidal gauge data to known
flood elevations for 10-, 50-, 100-, and 500-year storms as calculated within an FIS. However,
the limitations of this technique must be taken into consideration. Specifically, the proximity of
the tide gauge, or gauges, to the flood location is critical as mean ranges of tides vary from
location to location even along the same river.
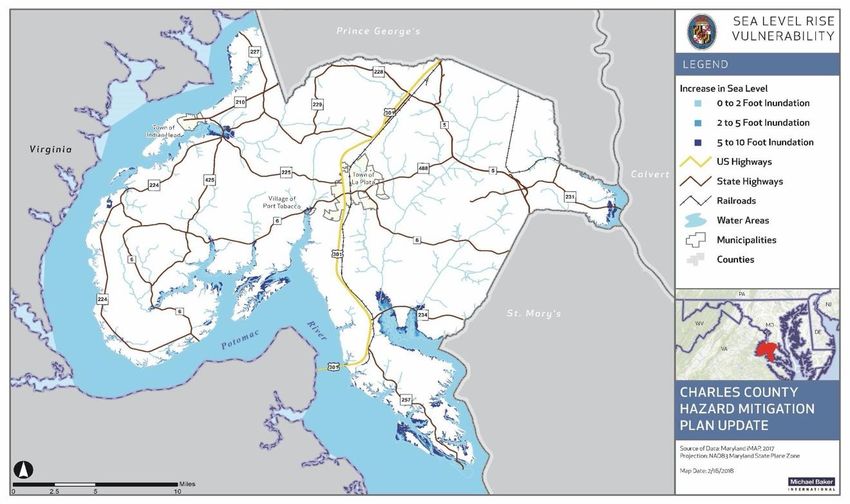
Sea Level Rise and Shoreline Erosion
Figure 3.3.5.8 from the 2018 Charles County Hazard Mitigation Plan Update, depicts the
potential sea level rise impacts on Charles County, and shows that some areas have the
potential to experience 5 to 10 foot inundation. Sea level rise impacts are projected to have the
greatest impacts to areas surrounding the Mattawoman Creek, the Nanjemoy Creek, the
Potomac River, and the Wicomico River.
28Charles County Nuisance & Urban Flooding Plan 2020
Source: 2018 Charles County Hazard Mitigation Plan Update
Additionally,tide gauge measurements in the Chesapeake Bay and Mid-Atlantic region show
that sea level along Maryland’s coastline has risen at an average rate of 3-4 mm per year, or
approximately one foot per century. This rate is nearly double the global average, and reflects
both global sea level rise and local land subsidence. Research indicates that land subsidence
in southern Maryland is the result of postglacial crustal movement, sediment loading, tectonic
activity, and possibly groundwater withdrawals (Maryland DNR, 2001; MGS, 2016). Future
rates of sea level rise along Maryland’s coastline are also expected to exceed the global
average, resulting in a rise of 2-4.2 feet by 2100, if greenhouse emmission continue to
increase (2018 Sea Level Rise Projections for Maryland). The potential of sea level rise to
exacerbate erosion rates requires careful consideration of this factor in any shoreline erosion
control plan.
Shoreline erosion is a continuous process that is highly spatially variable and temporally
episodic. The basic progression of erosion from wave action includes: A) attack by waves, B)
erosion of a bank and beach causing undercutting, C) slumping of the bank, and D) removal,
transportation, and deposition of bank sediments along shorelines. The natural drivers of this
process include weather, soil composition, topography, bathymetry (water depth), and fetch
(the distance traveled by wind or waves across open water). Shoreline erosion tends to be
greatest when storms amplify wind and wave action, and where soils are loose, slopes are
steep, near-shore waters are deep, and fetch is large. In Charles County, the shoreline is
highly vulnerable to nor’easters, tropical storms and hurricanes, particularly when these storms
last 24 to 48 hours and are accompanied by high winds and storm surges. Storms of this type
can amplify several high tide cycles, inundating protective beaches and marshes and
subjecting upland areas to the brunt of the destructive wave energy. The results can include
damage to shoreline stabilization projects and severe erosion of land masses.
29Charles County Nuisance & Urban Flooding Plan 2020
Source: 2018 Charles County Hazard Mitigation Plan Update
The U.S. Army Corps of Engineers (USACE) found that 31 percent of tidal shorelines in
Charles County are experiencing some erosion, with 7 percent experiencing significant erosion
rates of two feet per year or more (USACE, 1990). Subsequent studies by the Maryland
Geological Survey (MGS) estimated shoreline erosion by comparing recently mapped
shorelines (1988-1995) to historical maps. These studies divided Maryland’s shoreline into
segments of 80 meters or more, generalized erosion rates into four categories, and assigned
each shoreline segment to the most representative category. According to data made available
through the Maryland Coastal Resiliency Assessment, the MGS found approximately 9% of
the County’s coastline to be subject to significant erosion rates of two feet per year or more
(The Nature Conservancy, 2016). As shown in Figure 3.3.3-1, the areas subject to significant
erosion are concentrated near the Indian Head peninsula, the mouth of Nanjemoy Creek, and
the mouth of Port Tobacco River.
The man-made drivers of shoreline erosion include land use and erosion control projects.
Shoreline erosion tends to be greatest where upland areas generate significant runoff, and
where adjacent shorelines are hardened with erosion control measures (such as revetments
and bulkheads). Poorly designed erosion control measures accelerate shoreline erosion by
reducing the supply of sediment to adjacent beaches, removing natural features that dampen
wave action, or otherwise interrupting natural shoreline processes.
High shoreline erosion rates pose a significant threat to property owners, the public, and the
County’s natural resources - placing valuable land and assets at greater risk of storm damage.
These assets include homes, businesses, historic and cultural sites, archaeological sites,
recreational beaches, productive farmland, utilities, bridges, and roads. Shoreline erosion also
contributes to the degradation of water quality and habitat. The nitrogen and phosphorus
30Charles County Nuisance & Urban Flooding Plan 2020
carried with eroded sediments can exacerbate summertime dead zones in the Chesapeake
Bay and tidal Potomac, and the sediment itself can smother important aquatic resources and
fill navigational channels used for commerce and recreation.
Finally, the risk of shoreline erosion is expected to increase in the future due to more intense
weather events and rising sea levels driven by climate change. Both factors contribute to
erosion by amplifying natural coastal processes. For example, as sea level rises, storm surges
will extend further into the coastal zone, exposing upland areas to destructive wave energy
with greater frequency.
In September of 2018, the Final Assessment and Shoreline
Management Plan for Reaching NPDES Municipal Separate Storm
Sewer System Permit (MS4) Goals for Charles County, Maryland was
completed. The plan reported that generally, the County’s shorelines on
the open Potomac River are subject to winddriven wave forces that
caused shoreline erosion ranging from low to severe. Shorelines along
the lateral waterbodies are somewhat less exposed to wave action,
except shore reaches near their mouth. This Plan put the natural
process of shoreline erosion into perspective as to potential long-term
impacts to upland banks, land loss, and the consequent input of
sediments and nutrients into the Chesapeake Bay. Priority was given to
eroding shorelines with high erosion rates and those with potential
infrastructure impacts. Eroding upland banks and shoreline morphology
were addressed holistically in the context of the overall shoreline management plan.
This study yielded management strategy recommendations that addressed shoreline erosion
on a reach basis. The impacts of “no action” at the shoreline were also considered. This plan
employed the strategy of living shorelines as a best management practice for shore
stabilization. Living shorelines are shore protection strategies that are relatively non-intrusive
to natural surroundings yet effective within the context of long-term shoreline erosion control.
They consist of a combination of stone structures, particularly sills and/or breakwaters along
with sand nourishment which create a stable substrate for establishing wetland vegetation.
This living shoreline approach utilizes stable marshes and beaches for shore protection, which
are the preferred alternatives for shore protection, and can provide a platform for long-term
coastal resiliency in the face of sea level rise.
31You can also read