5.8 HURRICANE & TROPICAL STORM - New Jersey Office of ...
←
→
Page content transcription
If your browser does not render page correctly, please read the page content below
5.8 HURRICANE &
TROPICAL STORM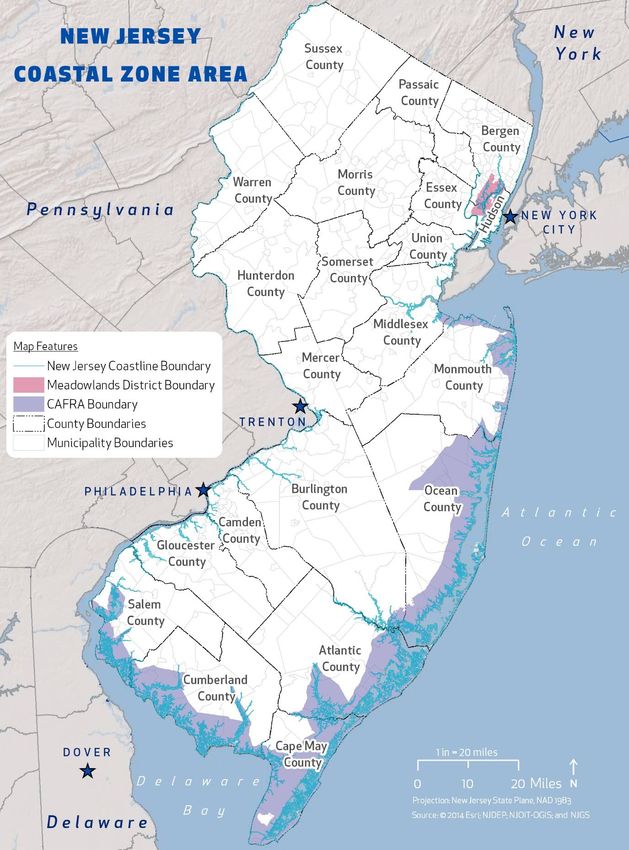
SECTION 5.8 HURRICANE AND TROPICAL STORM
5 . 8 . 1 HA ZA R D D E S C RI P TI ON
A tropical cyclone is a rotating, organized system of clouds and thunderstorms that originates over tropical or
sub-tropical waters and has a closed low-level circulation. Tropical depressions, tropical storms, and hurricanes
are all considered tropical cyclones. These storms rotate counterclockwise in the northern hemisphere around
the center and are accompanied by heavy rain and strong winds (NOAA, 2013). Almost all tropical storms
and hurricanes in the Atlantic basin (which includes the Gulf of Mexico and Caribbean Sea) form between June
1 and November 30 (hurricane season). August and September are peak months for hurricane development.
The average wind speeds for tropical storms and hurricanes are listed below:
A tropical depression has a maximum sustained wind speeds of 38 miles per hour (mph) or less
A tropical storm has maximum sustained wind speeds of 39 to 73 mph
A hurricane has maximum sustained wind speeds of 74 mph or higher. In the western North Pacific,
hurricanes are called typhoons; similar storms in the Indian Ocean and South Pacific Ocean are called
cyclones.
A major hurricane has maximum sustained wind speeds of 111 mph or higher (NOAA, 2013).
Over a two-year period, the United States coastline is struck by an average of three hurricanes, one of which
is classified as a major hurricane. Hurricanes, tropical storms, and tropical depressions may pose a threat to
life and property. These storms bring heavy rain, storm surge and flooding (NOAA, 2013). The cooler waters
off the coast of New Jersey can serve to diminish the energy of storms that have traveled up the eastern
seaboard. However, historical data show that a number of hurricanes/tropical storms have impacted New
Jersey, often as the remnants of a larger storm hitting the Gulf or Atlantic coast hundreds of miles south of
New Jersey but maintaining sufficient wind and precipitation to cause substantial damage to the State.
Tropical cyclones affect New Jersey the most during the month of September, though the State has
experienced tropical cyclones throughout the hurricane season, excluding November. Because of peak
warmth in water temperatures in September, storms usually affect New Jersey during this time (Bucholz and
Savadove, 1993). Each element of the hurricane and tropical storm hazard is described below, as the impacts
relate to New Jersey:
Flooding can cause severe damage in New Jersey during tropical cyclones. Flooding and flash floods
brought by the torrential rains of a hurricane may be dangerous threats. Rain delivered by a tropical
storm can amount to almost nothing to as much as 15 inches in two to three days. Hurricane Diane
(1955) caused little damage as it moved onto the continent, but long after its winds subsided,
it brought floods to Pennsylvania, New York and New England that killed 200 persons and cost an
estimated $700 million in damage. In 1972, Hurricane Agnes fused with another storm system, flooding
streams and river basins in the Northeast with more than 1 foot of rain in less than 12 hours, killing
117 people and causing almost $3 billion in damage. In 1999, Hurricane Floyd brought an average
of seven inches of rain to New Jersey, with a maximum rainfall total of 14.13 inches in Little Falls. A
maximum storm surge of 7.36 feet was reported in Cape May. Overall, Floyd caused $250 million in
damages and six deaths in New Jersey. In 2011, Hurricane Irene caused approximately $1 billion in
damages and seven deaths in the State. Rainfall totals averages seven inches with a maximum
of 9.85 inches in Cranford. In 2012, Superstorm Sandy brought an average of 2.78 inches of rain, with
a maximum total of 10.29 inches in Cape May. A maximum wind gust of 78 mph was reported and a
storm surge of 8.57 feet in Sandy Hook. Overall, Sandy caused $30 billion in damages and 12 deaths in
New Jersey (New Jersey Office of Emergency Management [NJOEM] 2011).
It is estimated that 90% of deaths and most property damage near the coast during hurricanes
are caused by storm surge. Storm surge occurs when coastal waters are pushed toward shore and
5.8 - 1- 1
5.8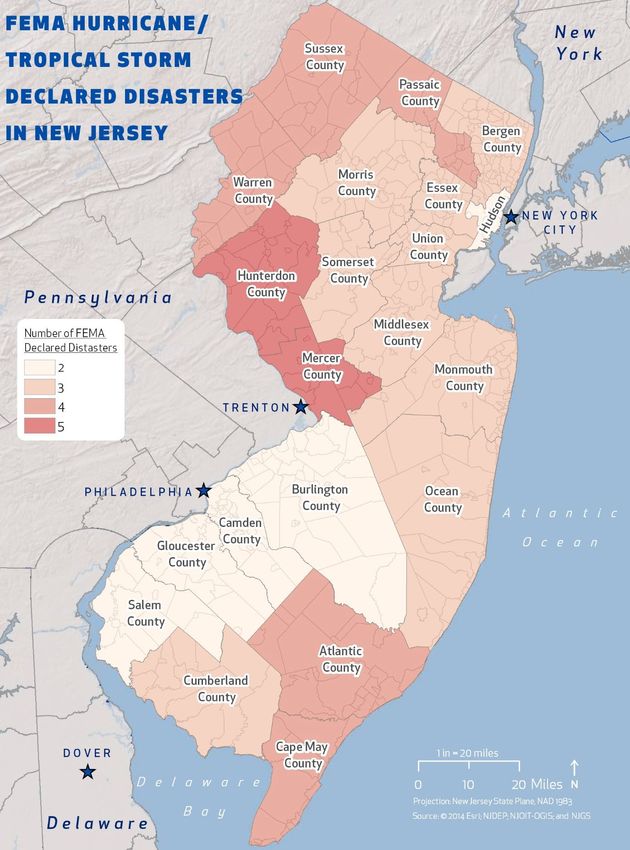
held above mean sea level. Depending on storm size, characteristics and distance from the shoreline,
the storm can raise the sea level of along 50 or more miles of coastline by 20 or more feet. The higher
sea level, along with the wind-enhanced hammering of waves, act as a giant bulldozer sweeping
everything in its path. Additionally, still-water damage to inundated structures and facilities is
exacerbated by the harmful effects of saltwater. Structures, once salted, will remain more susceptible
to moisture, leading to mildewing and corrosion of the structure and all contents that came in contact
with the saltwater (NJOEM, 2011).
High wind speeds occur in a narrow ring usually extending 20 to 30 miles from the wall of the eye of
a hurricane. Minor damage begins at approximately 50 miles per hour (mph) and includes broken
branches. Moderate damage, such as broken window and loosed shingles begins around 80 mph, and
major structural damage and destruction begins at 100 mph. For some structures, wind force alone is
sufficient to cause total destruction. Mobile homes with their lack of foundation, light weight, and
minimal anchoring make them particularly vulnerable to hurricane winds. Some hurricanes spawn
tornadoes that contribute to the damage delivered by hurricanes. Tornadoes are discussed in the
thunderstorms and tornadoes section of this report. Winds to the east of the storm track typically
cause more damage. New Jersey, typically to the west of the storm track, tends to suffer less damage
than Long Island (NJOEM, 2011).
Hurricanes and tropical storms often occur at the same time. Because of this, officials assign short, distinctive
names to the storms to avoid confusion among weather stations, coastal bases, and ships at sea. Since 1953,
Atlantic tropical storms have been named from lists originated by the National Hurricane Center. Currently,
they are maintained and updated by the World Meteorological Organization. The list of names in the table
below are used in rotation and recycled every six years. For example, the 2014 list will be used again in 2020.
The only time there is a change in the list is if the named storm was so costly or deadly that the future use of
it would be inappropriate. If that occurs, the World Meteorological Organization committee will select a
new name to replace the one removed from the list. If all the names in a season's list have been used, later
storms are named for Greek letters, in alphabetical order. A storm is given a name once its winds reach a
speed of 40 mph. In addition to the Atlantic list of names, there are ten other lists corresponding to other
storm-prone regions of the world (NOAA 2013c). Table 5.8-1 lists the tropical cyclone names for 2017 through
2022.
Table 5.8-1 Tropical Cyclone Names for the Atlantic
2017 2018 2019 2020 2021 2022
Arlene Alberto Andrea Arthur Ana Alex
Bret Beryl Barry Bertha Bill Bonnie
Cindy Chris Chantal Cristobal Claudette Colin
Don Debby Dorian Dolly Danny Danielle
Emily Ernesto Erin Edouard Erika Earl
Franklin Florence Fernand Fay Fred Fiona
Gert Gordon Gabrielle Gonzalo Grace Gaston
Harvey Helene Humberto Hanna Henri Hermine
Irma Isaac Imelda Isaias Ida Ian
Jose Joyce Jerry Josephine Joaquin Julia
Katia Kirk Karen Kyle Kate Karl
Lee Leslie Lorenzo Laura Larry Lisa
Maria Michael Melissa Marco Mindy Matthew
Nate Nadine Nestor Nana Nicholas Nicole
Ophelia Oscar Olga Omar Odette Otto
5.8 - 2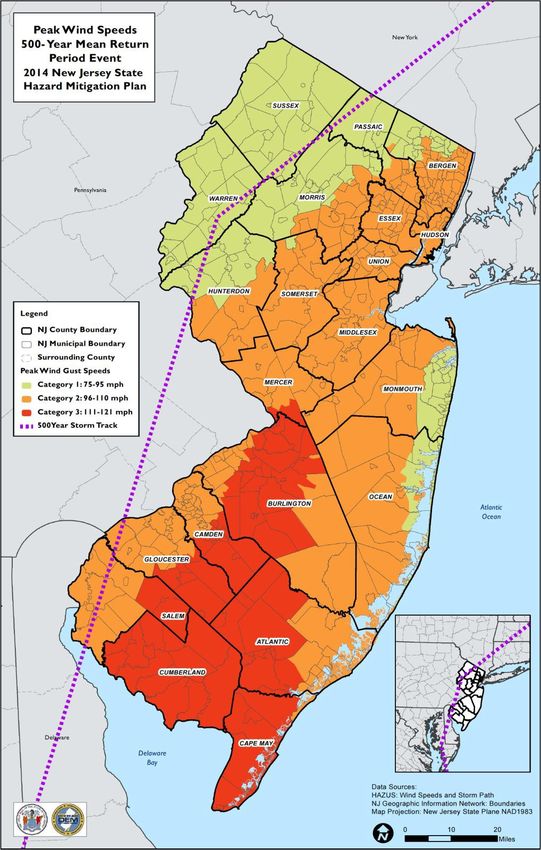
2017            2018    2019        2020        2021     2022
   Philippe     Patty       Pablo       Paulette   Peter     Paula
   Rina         Rafael      Rebekah     Rene       Rose      Richard
   Sean         Sara        Sebastien   Sally      Sam       Shary
   Tammy        Tony        Tanya       Teddy      Teresa    Tobias
   Vince        Valerie     Van         Vicky      Victor    Virginie
   Whitney      William     Wendy       Wilfred    Wanda     Walter
Source: NOAA, 2017

Tropical Storm
A tropical storm system is characterized by a low-pressure center and numerous thunderstorms that produce
strong winds and heavy rain (winds are at a lower speed than hurricane-force winds, thus gaining its status as
tropical storm versus hurricane). Tropical storms strengthen when water evaporated from the ocean is
released as the saturated air rises, resulting in condensation of water vapor contained in the moist air. They
are fueled by a different heat mechanism than other cyclonic windstorms such as Nor’easters and polar lows.
The characteristic that separates tropical cyclones from other cyclonic systems is that at any height in the
atmosphere, the center of a tropical cyclone will be warmer than its surroundings; a phenomenon called
“warm core” storm systems (NOAA, 1999).
The term "tropical" refers both to the geographical origin of these systems, which usually form in tropical
regions of the globe, and to their formation in maritime tropical air masses. The term "cyclone" refers to such
storms' cyclonic nature, with counterclockwise wind flow in the Northern Hemisphere, and clockwise wind
flow in the Southern Hemisphere. The opposite direction of the wind flow is a result of the Coriolis force
(National Weather Service [NWS], 2010).
According to NOAA, tropical storms and tropical depressions, while generally less dangerous than hurricanes,
can be deadly. The winds of tropical depressions/storms are usually not the greatest threat; rather, the rains,
flooding, and severe weather associated with the tropical storms are what customarily cause more significant
problems. Serious power outages can also be associated with these types of events (NOAA, 1999).
According to an article in Science Daily, while tropical storms can produce extremely powerful winds and
torrential rain, they are also able to produce high waves, damaging storm surges, and tornadoes. They develop
over large bodies of warm water and lose their strength if they move over land because of increased surface
friction and loss of the warm ocean as an energy source. This is why coastal regions can receive significant
damage from a tropical cyclone, while inland regions are relatively safe from receiving strong winds. Heavy
rains, however, can produce significant flooding inland, and storm surges can produce extensive coastal
flooding up to 25 miles from the coastline.
As per the United States Naval Observatory, one measure of the size of a tropical cyclone is determined by
measuring the distance from its center of circulation to its outermost closed isobar. If the radius is less than
two degrees of latitude, or 138 miles, then the cyclone is "very small" or a "midget". A radius between three
and six latitude degrees or 207 to 420 miles are considered "average-sized". "Very large" tropical cyclones
have a radius of greater than eight degrees or 552 miles.
5.8.1.2 HURRICANE
A hurricane is a tropical storm that attains hurricane status when its wind speed reaches 74 or more miles an
hour. Tropical systems may develop in the Atlantic between the Lesser Antilles and the African coast or may
develop in the warm tropical waters of the Caribbean and Gulf of Mexico. These storms may move up the
Atlantic coast of the United States and impact the eastern seaboard or move into the United States through
the states along the Gulf Coast, bringing wind and rain as far north as New England before moving offshore
and heading east.

                                                                                                                   5.8 - 3- 3
                                                                                                                     5.8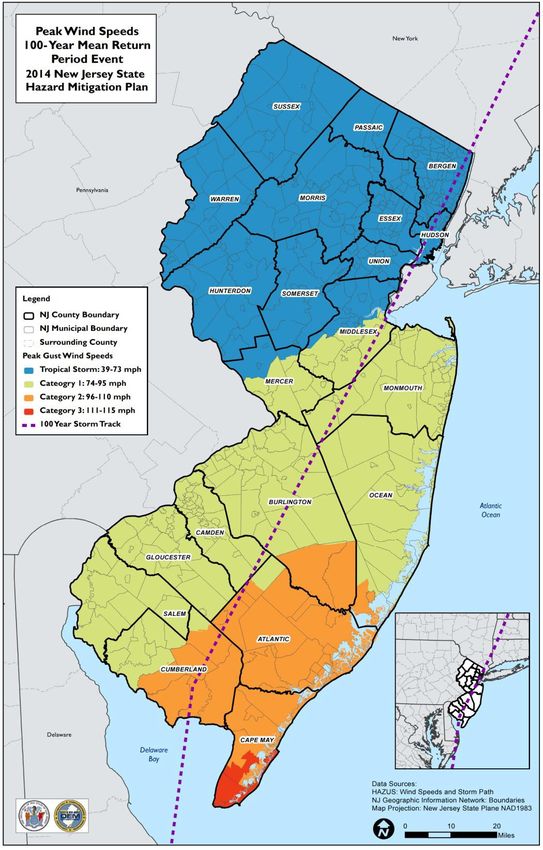
Because of its northern location on the Atlantic coastline, direct hits by storms of hurricane strength have a
          relatively low probability of impacting New Jersey, compared to the Southern coastal and Gulf States. It is
          possible, though rare, for the entire State to be impacted by hurricanes. Wind and surge effects tend to
          be concentrated in coastal areas of New Jersey, as well as specific riverine regions that may experience
          storm surge backwater effects.
          A hurricane is a storm system with sustained winds of greater than 74 mph. Storms of this intensity develop a
          central eye that is an area of relative calm and the lowest atmospheric pressure. Surrounding the eye is a
          circulating eye wall and the strongest thunderstorms and winds (NJOEM, 2011).
          Storm Surge
          Storm surges inundate coastal floodplains by dune over wash, tidal elevation rise in inland bays and harbors,
          and backwater flooding through coastal river mouths. Strong winds can increase in tide levels and water-
          surface elevations. Storm systems generate large waves that run up and flood coastal beaches. The combined
          effects create storm surges that affect the beach, dunes, and adjacent low-lying floodplains. Shallow, offshore
          depths can cause storm-driven waves and tides to pile up against the shoreline and inside bays.
          Based on an area’s topography, a storm surge may inundate only a small area (along sections of the northeast
          or southeast coasts) or storm surge may inundate coastal lands for a mile or more inland from the shoreline.
          Figure 5.8-1 depicts storm surge.
          F i g u r e 5 . 8 - 1 Storm Surge

          Source: FEMA 2010

          5 . 8 . 2 L OC ATI O N
          New Jersey and its coastal communities are vulnerable to the damaging impacts of major storms along
          its 127 miles of coastline. New Jersey’s coastal zone includes portions of eight counties and 126 municipalities.
          The coastal boundary of New Jersey encompasses the Coastal Area Facility Review Act (CAFRA) area and
          the New Jersey Meadowlands District. The coastal area includes coastal waters to the limit of tidal influence
          including: the Atlantic Ocean (to the limit of New Jersey's seaward jurisdiction); Upper New York Bay,
          Newark Bay, Raritan Bay and the Arthur Kill; the Hudson, Raritan, Passaic, and Hackensack Rivers, and the tidal
          portions of the tributaries to these bays and rivers. The Delaware River and Bay and other tidal streams of the
          Coastal Plain are also in the coastal area, as is a narrow band of adjacent uplands in the Waterfront
          Development area beyond the CAFRA area. Figure 5.8-2 shows New Jersey and the highlighted coastal zone
          area.

5.8 - 4
Figure 5.8-2 New Jersey Coastal Zone Area

Source: New Jersey Department of Environmental Protection, 2012

                                                                  5.8 - 5- 5
                                                                    5.8
In addition to the coastal zone, the entire State may be vulnerable to hurricanes and tropical storms,
depending on the storm’s track. The coastal areas are more susceptible to damage caused by the combination
of both high winds and tidal surge. Inland areas, especially those in floodplains, are also at risk for flooding
because of heavy rain and winds. The majority of damage following hurricanes and tropical storms often
results from residual wind damage and inland flooding, as was demonstrated during recent tropical storms.
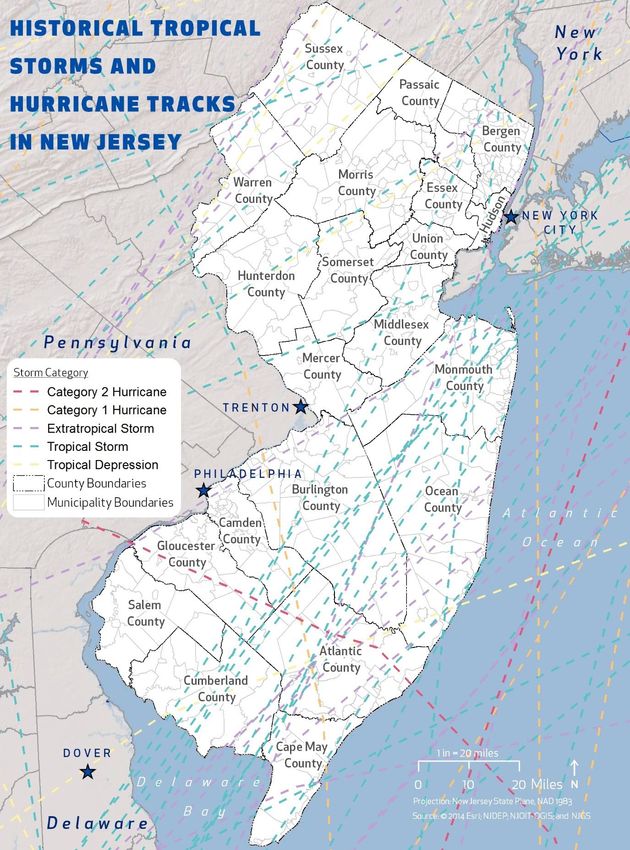
NOAA’s Historical Hurricane Tracks tool is a public interactive mapping application that displays Atlantic
Basin and East-Central Pacific Basin tropical cyclone data. This interactive tool catalogs tropical cyclones that
have occurred from 1842 to 2011 (latest date available from data source). Figure 5.8-3 displays tropical
cyclone tracks for New Jersey; however, the associated names for some of these events are unknown.
Between 1856 and 2011, New Jersey has experienced in excess of 70 tropical cyclone events. These events
tracked within 65 nautical miles of the State.
5.8 - 6
F i g u r e 5 . 8 - 3 H i sto ri c al T ro p i c a l Sto rm an d H urri c ane T rac ks 18 56 – 2 01 3

Source: NOAA, 2013

                                                                                                        5.8 - 7- 7
                                                                                                          5.8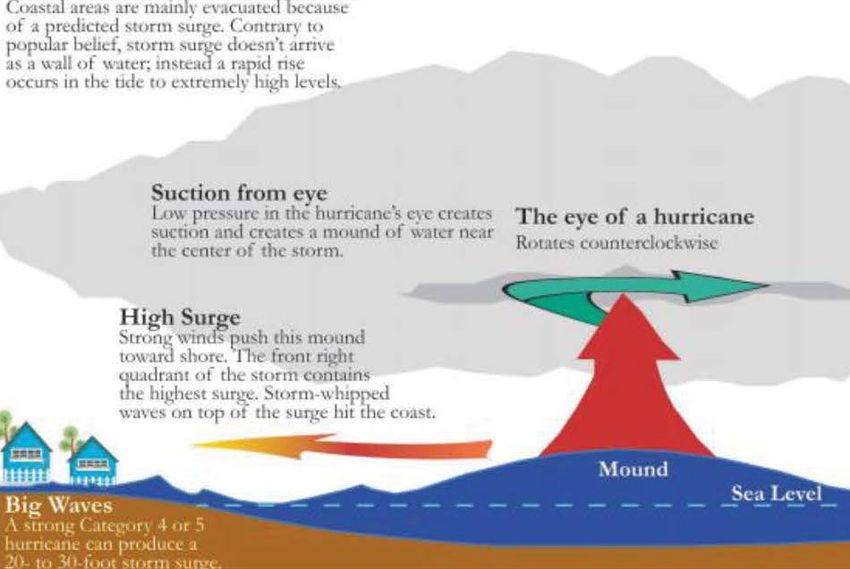
As noted, inundation from storm surge has devastating impacts on the State’s coastal communities. The
          United States Army Corps of Engineers (USACE), in cooperation with FEMA, initially prepared Sea, Lake and
          Overland Surge from Hurricanes (SLOSH) inundation maps. SLOSH maps represent potential flooding from
          worst-case combinations of hurricane direction, forward speed, landfall point, and high astronomical tide. It
          does not include riverine flooding caused by hurricane surge or inland freshwater flooding. The mapping was
          developed for the coastal communities in New Jersey using the computer model to forecast surges that occur
          from wind and pressure forces of hurricanes coastline topography. In New Jersey, hurricane category is the
          predominant factor in worst-case hurricane surges. The resulting inundation areas are grouped into Category
          1 and 2 (dangerous), Category 3 (devastating), and Category 4 (catastrophic) classifications. The hurricane
          category refers to the Saffir/Simpson Hurricane Intensity Scale, summarized below.

          5.8.3 EXTENT
          The extent of a hurricane is categorized in accordance with the Saffir-Simpson Hurricane Scale. The Saffir-
          Simpson Hurricane Wind Scale is a 1-to-5 rating based on a hurricane’s sustained wind speed. This scale
          estimates potential property damage. Hurricanes reaching Category 3 and higher are considered major
          hurricanes because of their potential for significant loss of life and damage. Category 1 and 2 storms are still
          dangerous and require preventative measures (NOAA, 2013). Table 5.8-2 presents this scale, which is used to
          estimate the potential property damage and flooding expected when a hurricane makes landfall.
          Table 5.8-2 The Saffir-Simpson Scale
             Categor
                           Wind Speed (mph)      Expected Damage
             y
                                                 Very dangerous winds will produce some damage: Homes with well-
                                                 constructed frames could have damage to roof, shingles, vinyl siding, and
             1             74-95 mph             gutters. Large branches of trees will snap, and shallowly rooted trees may be
                                                 toppled. Extensive damage to power lines and poles likely will result in power
                                                 outages that could last a few to several days.
                                                 Extremely dangerous winds will cause extensive damage: Homes with well-
                                                 constructed frames could sustain major roof and siding damage. Many
             2             96-110 mph            shallowly rooted trees will be snapped or uprooted and block numerous roads.
                                                 Near-total power loss is expected with outages that could last from several
                                                 days to weeks.
                                                 Devastating damage will occur: Homes with well-built frames may incur major
                                                 damage or removal of roof decking and gable ends. Many trees will be
             3 (major)     111-129 mph
                                                 snapped or uprooted, blocking numerous roads. Electricity and water will be
                                                 unavailable for several days to weeks after the storm passes.
                                                 Catastrophic damage will occur: Homes with well-built frames can sustain
                                                 severe damage with loss of most of the roof structure and/or some exterior
                                                 walls. Most trees will be snapped or uprooted, and power poles downed.
             4 (major)     130-156 mph
                                                 Fallen trees and power poles will isolate residential areas. Power outages will
                                                 last weeks to possibly months. Most of the area will be uninhabitable for
                                                 weeks or months.
                                                 Catastrophic damage will occur: A high percentage of framed homes will be
                                                 destroyed, with total roof failure and wall collapse. Fallen trees and power
             5 (major)     >157 mph
                                                 poles will isolate residential areas. Power outages will last for weeks to
                                                 possibly months. Most of the area will be uninhabitable for weeks or months.
          Source: NOAA, 2013

          Storm Surge
          Mean Return Period
          In evaluating the potential for hazard events of a given magnitude, a mean return period (MRP) is often used.
          The MRP provides an estimate of the magnitude of an event that may occur within any given year based on

5.8 - 8
past recorded events. MRP is the average period of time, in years, between occurrences of a particular hazard
event, equal to the inverse of the annual frequency of exceedance (Dinicola 2009).
Figure 5.8-4 and Figure 5.8-5 show the estimated maximum three-second gust wind speeds that can be
anticipated in the study area associated with the 100- and 500-year MRP events. These peak wind speed
projections were generated using Hazards U.S. Multi-Hazard (HAZUS-MH) model runs. The estimated
hurricane track used for the 100- and 500-year event is also shown. The maximum three-second gust wind
speeds for the State range from Tropical Storm to Category 3 hurricane speeds for the 100-year MRP event.
The maximum three-second gust wind speeds for the State range from Category 1 to Category 3 hurricane
speeds for the 500-year MRP event. The associated impacts and losses from these 100-year and 500-year
MRP hurricane event model runs are reported in the Vulnerability Assessment presented in Section 5.8.2.
Figure 5.8-4 Wind Speeds for the 100-Year Mean Return Period Event

Note: Map from 2014 plan used as placeholder

                                                                                                                5.8 - 9- 9
                                                                                                                  5.8
Figure 5.8-5 Wind Speeds for the 500-Year Mean Return Period Event
Note: Map from 2014 plan used as placeholder
Storm Surge
Typically, storm surge is estimated by subtracting the regular/astrological tide level from the observed storm
tide. Typical storm surge heights range from several feet to more than 25 feet. The exact height of the storm
surge and which coastal areas will be flooded depends on many factors: strength, intensity, and speed of the
hurricane or storm; the direction it is moving relative to the shoreline; how rapidly the sea floor is sloping
along the shore; the shape of the shoreline; and the astronomical tide. Storm surge is the most damaging
5.8 - 10when it occurs along a shallow sloped shoreline, during high tide, in a highly populated, and developed
area with little or no natural buffers (for example, barrier islands, coral reefs, and coastal vegetation).
The most common reference to a return period for storm surges has been the elevation of the coastal flood
having a one-percent chance of being equaled or exceeded in any given year, also known as the 100-
year flood. Detailed hydraulic analyses include establishing the relationship of tide levels with wave heights
and wave run-up. The storm surge inundation limits for the one-percent annual chance coastal flood event
are a function of the combined influence of the water surface elevation rise and accompanying wave
heights and wave run-up along the coastline.
The risk of storm surge elevations higher than seven feet exists along certain coastal segments of Oregon,
Washington, and Alaska; and in every coastal state from Texas to New Jersey. A storm surge associated with
storms of longer recurrence intervals may result in more storm surge flooding, higher water levels, larger
waves, and an increased likelihood of dune overwash, wave damage, and possible breaching of barrier islands.
5 . 8 . 4 PRE VI O U S O CC U RRE NC E S AND L O SS E S
Hurricane/tropical storm and coastal/storm surge events that occurred in New Jersey between 1950 and 2017
are detailed in Table 5.8.3. Table 5.8-3 includes events discussed in the 2014 Plan, events provided by the
Office of the New Jersey State Climatologist (ONJSC), and new events that occurred between 2012 and 2017.
With documentation for New Jersey being so extensive, not all sources have been identified or researched.
Therefore, Table 5.8-3 may not include all events that have occurred throughout the State. Highlighted in
detail below are losses associated with Superstorm Sandy – one of the worst storms to have ever hit New
Jersey or the nation in recent history.
5.8.4.1 SUPERSTORM SANDY
The effects of Superstorm Sandy on New Jersey in 2012 were severe, with economic losses to businesses of
up to $30 billion. Superstorm Sandy, the most intense storm of the 2012 Atlantic hurricane season, formed in
the Caribbean Sea north of Panama on October 22, 2012. The strengthening hurricane moved northwards,
severely impacting areas of and around the Greater Antilles. As it curved towards the New England region,
the hurricane degenerated into an extra-tropical cyclone and shortly afterwards the massive storm made
landfall in New Jersey on October 29.
Over two million households in the state lost power in the storm, 346,000 homes were damaged or destroyed,
and 37 people were killed. Storm surge and flooding affected a large swath of the state. Governor Chris
Christie said the losses caused by Sandy were, "going to be almost incalculable...The devastation on the Jersey
Shore is probably going to be the worst we've ever seen.” While moving ashore at Atlantic City, Sandy dropped
heavy rainfall that reached 11.62 inches in Wildwood Crest. Its landfall was accompanied by high winds, and
the highest recorded wind gust in the state was 90 mph at a station just across the border from Staten Island,
New York.
Damages
As Governor Christie predicted, the Jersey Shore suffered the most severe winds and surf from Superstorm
Sandy and the most damage from the storm. Mantoloking was especially hard hit, suffering severe "wash
over" including the creation of two new, temporary inlets. Approximately two dozen oceanfront houses in
Mantoloking were completely removed from their foundations and destroyed. The Belmar boardwalk was
destroyed, along with Perth Amboy's marina and waterfront. Much of the Casino Pier in Seaside Heights and
nearby Funtown Pier in Seaside Park collapsed into the ocean due to intense waves. Most of the rides in these
amusement parks were destroyed, including roller coasters.
The seaside communities on Long Beach Island were among the hardest-hit as well. Scores of homes and
businesses were destroyed, and the storm surge deposited up to four feet of sand on island streets, making
them impassable. Governor Christie issued a mandatory evacuation on October 28th, and residents and
5.8 - 11
5.8 - 11business owners were prohibited from returning until November 10th. While no fatalities recorded on Long
Beach Island, preliminary damage estimates suggest between $750 million and $1 billion in damages occurred
on the island alone.
By November 12th, homeowners of Ortley Beach still had not been allowed onto the Barrier Island to check
on their properties. Ortley Beach was declared "Ground Zero" because of the unbelievable amount of
devastation.
Superstorm Sandy created an insurmountable amount of riverine flooding. New Jersey's communities along
the west side of the Hudson River (an area dubbed the Gold Coast by real estate marketers), were flooded by
the storm surge through New York Bay and into the Hudson River. There were massive power outages in
Bayonne, Jersey City, Hoboken, Weehawken, North Bergen, and Edgewater, forcing the evacuation of
patients from Palisades Medical Center.
Half of Jersey City lost power, while large sections of the city's downtown, including City Hall and the Jersey
City Medical Center, flooded and had to be evacuated. As high tide approached the Hudson River and
overflowed the wall at Exchange Place. Around the same time, Liberty Harbor spilled into the southern part
of Marin Boulevard. Both breaches caused water to rush down Columbus Drive and Marin Boulevard where
they met near the Historic Downtown. From there, the flood spread throughout the low-lying areas of Jersey
City.
Half the city of Hoboken was flooded, and the city government evacuated two of its fire stations. Hoboken's
mayor asked for National Guard help. By late night October 30th, an estimated 20,000 people were stranded
in Hoboken, surrounded by water. The New Jersey National Guard was deployed and began assisting in
rescues on October 31st. Additionally, Weehawken fared no better. The downtown neighborhood known as
the Shades incurred terrible damage, with nearly every resident forced to temporarily relocate.
In the early morning of October 30th, authorities in Bergen County, New Jersey, were evacuating residents
after a berm overflowed and flooded several communities. Chief of Staff for the Bergen County Executive,
said there were up to five feet of water in the streets of Moonachie and Little Ferry. Also, Sayreville, a
community along the Raritan River, faced rising flood waters from the storm surge entering Raritan Bay, which
forced the evacuation and rescue of dozens of residents by the Sayreville water rescue team. The Oyster
Creek Nuclear Generating Station in Lacey Township was placed on alert when storm waters around the plant
rose six feet above normal.
Fires that had destroyed about 14 homes on October 29th in Mantoloking restarted in the early morning of
October 31st, possibly fueled by natural gas. In Morristown, sustained winds peaked at 40 mph with gusts to
68 mph. Other peaks gusts included 88 mph in Montclair, 80 mph in Clifton, 78 mph in Newark, 74 mph in
Point Pleasant, and 61 mph in Basking Ridge. Gusts along Long Beach Island peaked between 75-90 mph.
Many buildings and homes were damaged especially to siding and roof surfaces and hundreds of trees were
downed across the state.
Energy
Governor Christie said on the morning of October 30th, that some 2.4 million households in the state were
without power. No timetable was given on the restoration of power to these customers, although some
estimates mentioned a week would be needed before a full damage assessment could be made.
On November 2th, 1.6 million customers were still without power, down from 2.7 million. Unfortunately, by
November 3rd, 31% of homes and businesses in the state did not have electricity.
On the morning of November 5th, reported customers in the state without electricity were:
Jersey Central Power & Light: 382,000
5.8 - 12 Public Service Electric & Gas: 375,000
Atlantic City Electric: 606
Rockland Electric Company: 19,224
On the morning of November 6th, more than 582,000 homes and businesses in the state still did not have
power:
Public Service Electric & Gas: 310,000 remain without service
Jersey Central Power & Light: 257,884 outages, mainly in Monmouth and Morris counties
Orange & Rockland: 13,913 remain without service
Atlantic City Electric: 227, mostly in Atlantic County
On the morning of November 7th, winds from a nor'easter delayed restoration of electricity. Federal safety
rules prevent line crews working in bucket trucks when winds are greater than 40 mph. About 396,000 homes
and businesses remained without service.
Public Service Electric & Gas: 190,400 remain without service.
Jersey Central Power & Light: 190,278 remain without service mainly in Monmouth
and Morris counties
Orange & Rockland: 10,744 remain without service.
Atlantic City Electric: 4,488 remain without service.
At approximately, 6 a.m. EST on November 9th, about 265,000 homes and businesses were without power in
the state because of Sandy and the subsequent nor'easter.
In the aftermath of the storm, many gas stations were closed, and people lined up for hours to get gasoline.
According to the American Automobile Association, on November 2th, about 60% of the gas stations in New
Jersey were closed. On the night of November 2th, Governor Christie took action to prevent a fuel shortage
and ease the problem of extended wait times and lines at gas stations by signing Executive Order 108,
declaring a limited state of energy emergency with regard to the supply of motor fuel and implementing odd-
even rationing for gasoline purchases in 12 New Jersey counties. Odd-even fuel sales took effect in the
following counties at noon on November 3rd: Bergen, Essex, Hudson, Hunterdon, Middlesex, Morris,
Monmouth, Passaic, Somerset, Sussex, Union, and Warren counties. This ended at 6 a.m. EST on November
13th.
Table 5.8-3 Past Occurrences of Tropical Storms and Hurricanes in New Jersey 1950 - 2017
Counties
Date(s) of Event Event Type Description
Affected
Average rainfall amounts were 1.07 inches. Maximum
September 11-12, 1950 Hurricane Dog Statewide
rainfall total was 4.34 inches at the Canton station.
Average rainfall amounts were 1.29 inches. Maximum
August 20-21, 1950 Hurricane Able Statewide rainfall total was 3.5 inches at the Freehold Marlboro
(Monmouth County) station.
Average rainfall amounts were 2.42 inches. Maximum
August 31-September
Hurricane Able Statewide rainfall total was 5.64 inches at the Oak Ridge Reservoir
1, 1952
(Morris County) station.
Average rainfall amounts were 1.13 inches. Maximum
2/4/1952 Tropical Storm Statewide
rainfall total was 1.99 inches at the Vineland station.
Average rainfall amounts were 1.23 inches. Maximum
Hurricane
August 14-15, 1953 Statewide rainfall total was 5.98 inches at the Tuckerton (Ocean
Barbara
County) station.
5.8 - 13
5.8 - 13Counties
Date(s) of Event Event Type Description
Affected
Average rainfall amounts were 0.35 inch. Maximum rainfall
October 15-16, 1954 Hurricane Hazel Statewide
total was 1.24 inches at the Pleasantville station.
Average rainfall amounts were 3.55 inches. Maximum
September 10-11, 1954 Hurricane Edna Statewide
rainfall total was 6.38 inches at the Lakehurst station.
Average rainfall amounts were 2.61 inches. Maximum
August 30-31, 1954 Hurricane Carol Statewide rainfall total was 5.25 inches at the Midland Park (Bergen
County) station.
September 19-20, Average rainfall amounts were 0.65 inch. Maximum rainfall
Hurricane Ione Statewide
1955 total was 4.17 inches at the Berlin station.
Average rainfall amounts were 2.91 inches. Maximum
August 17-19, 1955 Hurricane Diane Statewide rainfall total was 8.1 inches at the Sussex (Sussex County)
station.
Average rainfall amounts were 6.28 inches. Maximum
August 12-13, 1955 Hurricane Connie Statewide rainfall total was 10.89 inches at the Canistear Reservoir
(Sussex County) station.
September 27-28, Average rainfall amounts were 0.47 inch. Maximum rainfall
Hurricane Flossy Statewide
1956 total was 3.41 inches at the Shiloh station.
Average rainfall amounts were 0.06 inch. Maximum rainfall
August 28-29, 1958 Hurricane Daisy Statewide total was 0.4 inch at the Belmar/Bass River State Forest
station.
September 27-28, Average rainfall amounts were 1.68 inches. Maximum
Hurricane Helene Statewide
1958 rainfall total was 3.41 inches at the Shiloh station.
Average rainfall amounts were 0.99 inch. Maximum rainfall
September 30-
Hurricane Gracie Statewide total was 2.87 inches at the Oak Ridge Reservoir (Morris
October 1, 1959
County) station.
Average rainfall amounts were 0.9 inch. Maximum rainfall
July 10-11, 1959 Hurricane Cindy Statewide total was 8.43 inches at the Belleplain SF (Cape May
County) station.
Average rainfall amounts were 4.91 inches. Maximum
rainfall total was 8.99 inches at the Hammonton (Atlantic
County) station. Maximum wind gust of 100 mph was
observed in Wildwood (Cape May County). Maximum storm
9/12/1960 Hurricane Donna Statewide surge of seven feet was reported in Long Branch
(Monmouth County). Tides were 5.7 feet above normal.
Considerable damage to piers and beach front homes.
Hurricane Donna caused three fatalities and $6.9 million in
damages in New Jersey.
Average rainfall amounts were 3.65 inches. Maximum
July 29-30, 1960 Hurricane Brenda Statewide
rainfall total was 6.27 inches at the Cedar Grove station.
Average rainfall amounts were 1.62 inches. Maximum
rainfall total was 5.6 inches at the Tuckerton (Ocean
September 20-21 and
Hurricane Esther Statewide County) station. Maximum wind gust of 68 mph was
25, 1961
observed in Atlantic City (Atlantic County). High surf and rip
tides were also reported.
Average rainfall amounts were 2.14 inches. Maximum
rainfall total was 4.85 inches at the Pemberton (Burlington
August 28-29, 1962 Hurricane Alma Statewide
County) station. Maximum wind gusts were below 20 mph.
High surf and rip tides were reported.
Average rainfall amounts were 0.72 inch. Maximum rainfall
October 16-18, 1964 Hurricane Isabell Statewide total was 2.01 inches at the Belleplain SF (Cape May
County) station. Maximum wind gusts were below 20 mph.
5.8 - 14Counties
Date(s) of Event Event Type Description
Affected
Average rainfall amounts were 0.44 inch. Maximum rainfall
September 13-14, total was 2.9 inches at Hightstown station. Maximum wind
Hurricane Dora Statewide
1964 gusts were below 20 mph. High surf and rip tides were
reported.
Average rainfall amounts were 0.18 inch. Maximum rainfall
total was 0.91 inch at the Bass River State Forest station.
June 12-13, 1966 Hurricane Alma Statewide Maximum wind gusts of 26 mph in Atlantic City (Atlantic
County). Maximum storm surge of 4.5 feet was reported in
Atlantic City (Atlantic County).
The average rainfall for this event was 0.26 inch, with a
maximum of 0.94 inch at the Lakehurst station. A maximum
wind gust of 39 mph in Atlantic City (Atlantic County). High
September 15-17, 1967 Hurricane Doria Statewide
surf and rip tides were associated with this storm. Three
boaters drown on their way to Boston as a result of this
event.
The average rainfall for this event was 0.19 inch, with a
Hurricane
August 19-21, 1969 Statewide maximum of 1.25 inches at the Fortescue (Cumberland
Camille
County) station. Maximum wind gusts were below 20 mph.
The average rainfall for this event was 0.58 inch, with a
September 8-9, 1969 Hurricane Gerda Statewide maximum total of 1.78 inches at the Fortescue (Cumberland
County) station. Maximum wind gusts were below 20 mph.
The average rainfall for this event was 7.09 inches, with a
maximum total of 10.29 inches at the Little Falls (Passaic
County) station. A maximum wind gust of 54 mph was
reported at Atlantic City (Atlantic County). A maximum
August 27-29, 1971 Hurricane Doria Statewide
storm surge of 5.3 feet was also reported at Atlantic City
(Atlantic County). Total damages in New Jersey were
estimated at $772 M. Three deaths were attributed to this
event.
The average rainfall for this event was 0.23 inch, with a
maximum total of 1.64 inches at the Sea Brooks Farms
October 2-4, 1971 Hurricane Ginger Statewide (Cumberland County) station. Maximum wind gusts were
below 20 mph. High surf and rip tides were associated with
this storm.
The average rainfall for this event was 3.4 inches, with a
maximum total of 6.44 inches at the Canton station.
June 21-25, 1972 Hurricane Agnes Statewide Maximum wind gusts were below 20 mph. Total damages in
New Jersey were estimated at $15 M. One death was
attributed to this storm.
The average rainfall for this event was 0.28 inch, with a
September 3-4, 1972 Hurricane Carrie Statewide maximum total of 1.73 inches at the Cape May (Cape May
County) station. Maximum wind gusts were below 20 mph.
The average rainfall for this event was 5.45 inches, with a
September 24-28, maximum total of 8.94 inches at the Hightstown (Mercer
Hurricane Eloise Statewide
1975 County) station. Maximum wind gusts were below 20 mph.
High surf and rip tides were associated with this event.
The average rainfall for this event was 0.08 inch, with a
June 30-31, 1975 Hurricane Amy Statewide maximum total of 0.63 inch at the Morris Plains (Morris
County) station. Maximum wind gusts were below 20 mph.
The average rainfall for this event was 0.02 inch, with a
October 27-28, 1975 Hurricane Hallie Statewide maximum of 0.3 inch at the Fortescue station. Maximum
wind gusts were below 20 mph.
5.8 - 15
5.8 - 15Counties
Date(s) of Event Event Type Description
Affected
The average rainfall for this event was 2.66 inches, with a
maximum of 5 inches at the Mays Landing (Atlantic County)
station. A maximum wind gust of 90 mph was reported at
August 9-10, 1976 Hurricane Belle Statewide
Ship Bottom. A maximum storm surge of 8.85 feet was
reported in Atlantic City (Atlantic County). New Jersey had
approximately $50 million in damages from this event.
The average rainfall for this event was 1.32 inches, with a
Tropical
September 16-18, 1976 Statewide maximum of 3.44 inches at the Oak Ridge Reservoir (Morris
Depression #8
County) station. Maximum wind gusts were below 20 mph.
The average rainfall for this event was 0.11 inch, with a
September 7-8, 1977 Hurricane Clara Statewide maximum total of 1.03 inches at the Jersey City (Hudson
County) station. Maximum wind gusts were below 20 mph.
The average rainfall for this event was 0.04 inch, with a
September 10-11, 1977 Hurricane Babe Statewide maximum total of 1.22 inches at the Hammonton (Atlantic
County) station. Maximum wind gusts were below 20 mph.
The average rainfall for this event was 0.26 inch, with a
July 15-16, 1979 Hurricane Bob Statewide maximum total of 1.92 inches at the Hightstown (Atlantic
County) station. Maximum wind gusts were below 20 mph.
The average rainfall for this event was 0.37 inch, with a
Hurricane
July 29-30, 1979 Statewide maximum of 2.05 inches at the Princeton Water Work
Claudette
station. Maximum wind gusts were below 20 mph.
The average rainfall for this event was 0.47 inch, with a
Hurricane
September 14-16, 1979 Statewide maximum of 1.25 inches at the High Point Park (Sussex
Frederic
County) station. Maximum wind gusts were below 20 mph.
The average rainfall for this event was 2.94 inches, with a
maximum of 5.83 inches at the Ringwood (Passaic County)
station. A maximum wind gust of 54 mph was reported in
September 6-8, 1979 Hurricane David Statewide
Trenton (Mercer County). High surf and rip tides were
associated with this storm. This event caused a tornado
outbreak in New Jersey.
The average rainfall for this event was 0.48 inch, with a
Tropical
November 15-17, 1981 Statewide maximum of 1.35 inches at the Cape May (Cape May County)
Depression #12
station. Maximum wind gusts were below 20 mph.
The average rainfall for this event was 0.02 inch, with a
Tropical Storm
June 19-20, 1982 Statewide maximum of 0.27 inch at the Atlantic City (Atlantic County)
#2
station. Maximum wind gusts were below 20 mph.
The average rainfall for this event was 1.25 inches, with a
September 30-
Hurricane Dean Statewide maximum of 2.35 inches at the Newark (Essex County)
October 2, 1983
station. Maximum wind gusts were below 20 mph.
The average rainfall for this event was 1.92 inches, with a
July 26-27, 1985 Hurricane Bob Statewide
maximum of 3.52 inches at the Canistear
Reservoir (Sussex County) station. Maximum wind gusts
were below 20 mph.
The average rainfall for this event was 0.2 inch, with a
August 19-20, 1985 Hurricane Danny Statewide maximum of 2.32 inches at the Cape May (Cape May
County) station. Maximum wind gusts were below 20 mph.
The average rainfall for this event was 0.51 inch, with a
September 23-25,
Hurricane Henri Statewide maximum of 2.27 inches at the Belvidere (Warren County)
1985
station. Maximum wind gusts were below 20 mph.
5.8 - 16Counties
Date(s) of Event Event Type Description
Affected
The average rainfall for this event was 3.69 inches, with a
maximum of six inches at the Charlotteburg Reservoir
(Passaic County) station. A maximum wind gust of 45 mph
was reported at Ocean City (Cape May County). A maximum
September 27-28,
Hurricane Gloria Statewide storm surge of 1.4 feet was reported at Ventor City Pier.
1985
Gloria paralleled the coast of New Jersey, downing trees
and leaving 230,000 people without power. Approximately
100,000 coastal residents were evacuated. New Jersey had
approximately $14.7 million in damages from this event.
The average rainfall for this event was 0.14 inch, with a
Hurricane
June 8-9, 1986 Statewide maximum of 0.6 inch at the Pottersville (Morris County)
Andrew
station. Maximum wind gusts were below 20 mph.
The average rainfall for this event was 0.89 inch, with a
maximum of 3.32 inches at the Split Rock Pond station. A
Hurricane maximum wind gust of 54 mph was reported in Atlantic City
August 18-19, 1986 Statewide
Charley (Atlantic County). A maximum storm surge of 1.65 feet was
reported at Atlantic City (Atlantic County). Two deaths
were attributed to this event.
The average rainfall for this event was 0 inch, with a
Hurricane
August 7-8, 1988 Statewide maximum total of 0.7 inch at the High Point Park (Sussex
Alberto
County) station. Maximum wind gusts were below 20 mph.
The average rainfall for this event was 0.88 inch, with a
August 29-30, 1988 Hurricane Chris Statewide maximum total of 2.19 inches at the High Point Park (Sussex
County) station. Maximum wind gusts were below 20 mph.
The average rainfall for this event was 0.43 inch, with a
September 22-24, maximum total of 2.83 inches at the Belleplain SF (Cape
Hurricane Hugo Statewide
1989 May County) station. Maximum wind gusts were below 20
mph.
The average rainfall for this event was 0.55 inch, with a
October 14-15, 1990 Hurricane Lili Statewide maximum total of 2.28 inches at the Canoe Brook (Essex
County) station. Maximum wind gusts were below 20 mph.
The average rainfall for this event was 1.25 inches, with a
maximum total of 3.16 inches at the Millville (Cumberland
August 18-19, 1991 Hurricane Bob Statewide
County) station. Maximum wind gusts were below 20 mph.
High surf and rip tides were associated with this event.
The average rainfall for this event was 0.91 inch, with a
maximum total of 2.83 inches at the Belleplain SF (Cape
September 26-27, Hurricane
Statewide May County) station. Maximum wind gusts were below 20
1992 Danielle
mph. High surf and rip tides were associated with this
event. Two boaters drown from this storm.
The average rainfall for this event was 0.03 inch, with a
maximum total of 0.26 inch at the Atlantic City
September 1-2, 1993 Hurricane Emily Statewide
International Airport (Atlantic County) station. Maximum
wind gusts were below 20 mph.
The average rainfall for this event was 1.09 inches, with a
August 17-19, 1994 Hurricane Beryl Statewide maximum total of 3.82 inches at the Sussex (Sussex
County) station. Maximum wind gusts were below 20 mph.
The average rainfall for this event was 0.2 inch, with a
Hurricane
November 17-19, 1994 Statewide maximum total of 1.07 inches at the Cape May (Cape May
Gordon
County) station. Maximum wind gusts were below 20 mph.
5.8 - 17
5.8 - 17Counties
Date(s) of Event Event Type Description
Affected
The average rainfall for this event was 0.21 inch, with a
June 7-8, 1995 Hurricane Allison Statewide maximum total of 2.04 inches at the Millville (Cumberland
County) station. Maximum wind gusts were below 20 mph.
The average rainfall for this event was 0.79 inch, with a
August 6-8, 1995 Hurricane Erin Statewide maximum total of one inch at the Belleplain SF (Cape May
County) station. Maximum wind gusts were below 20 mph.
The average rainfall for this event was 2.36 inches, with a
October 5-7, 1995 Hurricane Opal Statewide maximum total of 4.92 inches at the Sussex (Sussex
County) station. Maximum wind gusts were below 20 mph.
The average rainfall for this event was 0.54 inch, with a
June 20-22, 1996 Hurricane Arthur Statewide maximum total of 2.3 inches at the Mays Landing (Atlantic
County) station. Maximum wind gusts were below 20 mph.
Bertha was an unusually long-lasting and strong supercell.
The average rainfall for this event was 2.94 inches, with a
maximum total of 6.59 inches at the Estell Manor (Atlantic
July 13-15, 1996 Hurricane Bertha Statewide County) station. A maximum wind gust of 55 mph was
reported at Harvey Cedars. A maximum storm surge of 2.27
feet was reported at Atlantic City (Atlantic County). One
death was reported in New Jersey because of Bertha.
The average rainfall for this event was zero inches, with a
maximum total of 0.07 inch at the Sussex (Sussex County)
August 31-September Hurricane
Statewide station. Maximum wind gusts were below 20 mph. High
2, 1996 Edouard
surf and rip tides were associated with this event. There
were two deaths in New Jersey because of Edouard.
The average rainfall for this event was 1.1 inches, with a
maximum total of 2.72 inches at the Lambertville
September 7-9, 1996 Hurricane Fran Statewide
(Hunterdon County) station. Maximum wind gusts were
below 20 mph.
The average rainfall for this event was 1.69 inches, with a
Hurricane maximum total of three inches at the Canistear Reservoir
October 9-10, 1996 Statewide
Josephine (Sussex County) station. A maximum wind gust of 70 mph
was reported at Atlantic City (Atlantic County).
The average rainfall for this event was 3.32 inches, with a
July 24-26, 1997 Hurricane Danny Statewide maximum total of 7.76 inches at the Cranford (Union
County) station. Maximum wind gusts were below 20 mph.
The average rainfall for this event was zero inches with a
August 28-29, 1998 Hurricane Earl Statewide maximum total of 0.02 inch at the Moorestown (Burlington
County) station. Maximum wind gusts were below 20 mph.
The average rainfall for this event was 0.08 inch, with a
maximum total of 0.92 inch at the Estell Manor (Atlantic
9/5/1998 Hurricane Bonnie Statewide
County) station. Maximum wind gusts were below 20 mph.
High surf and rip tides were associated with this event.
The average rainfall was 1.22 inches for this event.
Maximum rainfall totaled 5.59 inches at the Greenwood
September 5-9, 1999 Hurricane Dennis Statewide Lake (Passaic County) station. Maximum wind gusts were
less than 20 mph. High surf and rip tides were also reported
from this storm.
5.8 - 18Counties
Date(s) of Event Event Type Description
Affected
The Raritan River basin experienced record flooding as a
result of Floyd's heavy rains, 4.5 feet higher than the
previous record flood crest. Bound Brook, New Jersey, was
especially hard hit by a record flooding event: a 42-foot
flood crest, 14 feet above flood stage, sent 12 feet of water
on Main Street, and drowned three people. Manville, New
Jersey was hit nearly as hard, with record-breaking floods
coming from the Raritan River and the nearby Millstone
September 16-17, 1999 Hurricane Floyd Somerset River, which join in Manville. Princeton University in
Princeton, New Jersey, for several days declared municipal
tap water unsafe to drink, advised students in dorms not to
shower, and provided bottled drinking water. Overall,
average rainfall totals for Hurricane Floyd was 7.05 inches
with maximum rainfall total of 14.13 inches reported in Little
Falls. Maximum storm surge was 7.36 feet in Cape May.
New Jersey had $250 million in damages and six deaths
from this event.
The average rainfall total was 0.39 inch for this event, with
October 18-19, 1999 Hurricane Irene Statewide a maximum total of 2.5 inches at the Brant Beach Haven
station. Maximum wind gusts were below 20 mph.
Hurricane Gordon caused heavy precipitation in west
central and southwest New Jersey, causing poor drainage
September 19-20, Hurricane flooding in low-lying areas. The heaviest rain fell in Mercer
Mercer
2000 Gordon County and caused some minor flooding along the
Assunpink Creek. Roadway flooding along U.S. Route 130
was reported in Collingswood.
The average rainfall total was 2.38 inches for this event,
with a maximum total of 4.62 inches at the Canoe Brook
June 15-19, 2001 Hurricane Allison Statewide station. Another source indicated 4.86 inches of rain fell in
Howell. A maximum wind gust of 36 mph was reported in
Atlantic City (Atlantic County).
The maximum rainfall total of 0.08 inch was recorded at the
September 10-12,
Hurricane Gustav Statewide New Milford station. A maximum wind gust of 60 mph was
2002
reported in Keansburg.
The average rainfall total for this event was 1.72 inches, with
10/12/2002 Hurricane Kyle Statewide a maximum total of 4.71 inches at the Rahway station.
Maximum wind gusts were below 20 mph.
Tropical Storm
9/13/2003 Statewide Caused up to three inches of rain across the State.
Henri
Tropical Storm Isabel produced strong power outage
producing winds, moderate tidal flooding along the
Delaware Bay and the Delaware River and erosion and
rough surf along the shore. Two deaths were directly
attributed to the storm. In Warren County, a 34-year-old
Atlantic, woman died in Independence Township when a tree landed
September 18-19, Tropical Storm
Cape May, and crushed the vehicle in which she was riding. In Cape May
2003 Isabel
Warren County, a 51-year-old man drowned in the rough surf off of
Wildwood Crest. Winds gusted up to 62 mph in New Jersey
and downed countless numbers of trees, tree limbs and
power lines. It was one of the worst power outages on
record for area utilities. Jersey Central Power and Light
reported that 220,000 of its customers lost power while
5.8 - 19
5.8 - 19Counties
Date(s) of Event Event Type Description
Affected
Conectiv Energy reported about 162,000 of its customers
lost power. While tide heights along the ocean side only
reached minor levels, wave action caused considerable
beach erosion, especially in Cape May and Atlantic
Counties. Overall, average rainfall totals for Hurricane
Isabel was 0.93 inch and the maximum rainfall of 2.46 was
reported at the Ringwood (Passaic County) station. A
maximum wind gust of 62 mph was reported at Ship John
Shoal. Maximum storm surge of 10.6 feet was recorded in
Burlington. Strong waves eroded beaches along the coast.
New Jersey had $25 million in damages and one fatality as a
result from this Event
Average rainfall totals were 0.09 inch and the maximum
August 3-4, 2004 Hurricane Alex Statewide rainfall total of 1.89 inches at the West Deptford station.
Maximum wind gusts were below 20 mph.
Average rainfall totals were 0.1.26 inches and the maximum
Hurricane
August 14-16, 2004 Statewide rainfall of 3.49 inches was reported at the Ringwood
Charley
station. Maximum wind gusts were below 20 mph.
Hurricanes Average rainfall totals were 0.48 inch and the maximum
August 30-31, 2004 Gaston and Statewide rainfall of 4.06 inches was reported at the Indian Mills
Hermin station. Maximum wind gusts were below 20 mph.
Hurricane Northern Extra-tropical storm dropped around three inches of rain in
9/8/2004
Francis New Jersey northern New Jersey.
9/17/2004 Hurricane Ivan Essex Dropped 5.5 inches of rain in Maplewood.
Hurricane Passed to the south of the State as an extra-tropical storm,
9/28/2004 Statewide
Jeanine causing up to five inches of rainfall across New Jersey.
Passed to the southeast of the State, causing rip currents
Southeast and strong waves. In Point Pleasant Beach, New Jersey,
August 11-16, 2005 Hurricane Irene
New Jersey lifeguards made 150 rescues in a three-day period. Many
beaches banned swimming because of the threat.
Hurricanes Maria Rip currents from storms killed one and seriously injured
September 7-8, 2005 Statewide
and Nate another.
Wilma brought an average rainfall of 1.2 inches, with a
October 24-25, 2005 Hurricane Wilma Statewide maximum rainfall total of 2.66 inches in Atlantic City
(Atlantic County). Wind gusts were below 20 mph.
The interaction between the remnants of the storm and a
strong high-pressure system produced intense wind gusts
of up to 81 mph in Strathmere (Cape May County). The
storm also dropped heavy rainfall, totaling to a maximum of
4.92 inches in Margate. The winds and rain down trees and
Tropical Storm Atlantic, power lines, resulting in power outages. Overall, Ernesto
9/3/2006
Ernesto Cape May brought an average of 1.13 inches of rain, with a maximum
total of 4.03 inches at the Belleplain SF (Cape May County)
station. Another source indicated a maximum rainfall
amount of 4.92 inches in Margate. A maximum wind gust of
81 mph was reported in Strathmere (Cape May County).
High surf and rip tides were reported as well.
5.8 - 20Counties
Date(s) of Event Event Type Description
Affected
Tropical Storm Hanna brought heavy rain and strong winds
in New Jersey as well as some minor tidal flooding in Cape
May County, up Delaware Bay, and into the Delaware River
on September 6. Rain moved into the region around noon
EDT, fell heavy at times during the late afternoon and early
Tropical Storm
9/6/2008 Cape May evening and ended during the late evening. Storm totals
Hanna
ranged from around two to around five inches with the
highest amounts in northern New Jersey. The strongest
winds occurred during the afternoon in the southern part of
the State and the evening in the northern part of the State.
The highest reported wind gust was 58 mph.
Average rainfall total of 1.77 inches for this event with a
maximum rainfall total of 6.49 inches at the Estell Manor
August 22-23, 2009 Hurricane Bill Statewide (Atlantic County) station. Maximum wind gusts were below
20 mph. High surf and rip tides were associated with this
event.
A maximum rainfall total of 0.04 inches was reported at the
Cape May station. A maximum wind gust of 65 mph was
September 3-4, 2010 Hurricane Earl Statewide reported in Cape May (Cape May County). High surf and rip
tides were also reported. The storm caused two fatalities in
New Jersey, both because of the rough surf from Earl.
Hurricane Irene moved made its second landfall as a
tropical storm near Little Egg Inlet along the southeast
New Jersey coast at around 5:35 a.m. on August 28, 2011
Irene brought tropical-storm force winds, destructive
storm surge, and record-breaking freshwater inland
flooding across northeast New Jersey that resulted in three
deaths, thousands of mandatory, and voluntary evacuations
along the coast and rivers from surge and freshwater
flooding, and widespread power outages that lasted for up
to two weeks. The storm surge of three to five feet caused
moderate-to-severe tidal flooding along the ocean side and
August 27-28, 2011 Hurricane Irene Statewide
moderate tidal flooding in Delaware Bay and tidal sections
of the Delaware River. Major flooding occurred on the
Raritan, Millstone, Rockaway, and Passaic Rivers. Overall,
Irene brought an average rainfall total of 7.03 inches with a
maximum rainfall total of 9.85 inches in Cranford (Union
County). Another source indicated a maximum rainfall total
of 11.27 inches in Freehold. A maximum wind gust of 65 mph
was reported in Cape May (Cape May County). A maximum
storm surge of 4.63 feet was reported in Sandy Hook. Irene
caused approximately $1 billion in damages in New Jersey
and seven deaths in the State.
Remnants of Tropical Storm Lee brought three to eight
inches of rain to many parts of New Jersey. The heavy rain
Burlington,
caused flooding, mainly in west and northwest New Jersey.
Remnants of Camden,
Most of the damage was reported along the Delaware
September 7-10, 2011 Tropical Storm Cape May,
River, where two homes were destroyed, 24 suffered major
Lee Atlantic,
damage, 249 suffered minor damage, and 28 others were
Ocean
affected. Many roads were closed throughout the State
because of flooding. Freshwater surge caused moderate
5.8 - 21
5.8 - 21Counties
Date(s) of Event Event Type Description
Affected
tidal flooding along sections of the Delaware River. The
State had approximately $11.5 million in damage.
Hurricane Sandy was the costliest natural disaster by far in
the State of New Jersey. Record-breaking high tides and
wave action combined with sustained winds as high as 60 to
70 mph with wind gusts as high as 80 to 90 mph to batter
the State. Statewide, Sandy caused an estimated $29.4
billion in damage, destroyed or significantly damaged
30,000 homes and businesses, affected 42,000 additional
structures, and was responsible directly or indirectly for 38
deaths. A new temporary inlet formed in Mantaloking
(Ocean County) where some homes were swept away.
About 2.4 million households in the State lost power. It
would take two weeks for power to be fully restored to
October 26 -
Hurricane Sandy Statewide homes and businesses that were inhabitable. Also
November 8, 2012
devastated by the storm was New Jersey’s shellfish
hatcheries including approximately $1 million of losses to
buildings and equipment, and product losses in excess of
$10,000 at one location alone. Overall, average rainfall
totals were 2.78 inches with a maximum rainfall of 10.29
inches at the Cape May (Cape May County) station. Another
source indicated a maximum rainfall total of 12.71 inches in
Stone Harbor (Cape May County). A maximum wind gust of
78 mph was reported in Robbins Reef. A maximum storm
surge of 8.57 feet was reported in Sandy Hook. Hurricane
Sandy caused approximately $30 billion in damages in New
Jersey and caused 12 deaths in the State.
Tropical Storm The storm caused heavy rains that knocked out power and
6/1/2013 Statewide
Andrea flooded streets. Maximum sustained winds were 45mph.
Tropical Storm Locally heavy rains across New Jersey caused minor street
October 56, 2013 Statewide
Karen flooding.
To the east
The storm produced moderate rainfall along the coast of
7/4/2014 Hurricane Arthur of New
New Jersey. Wind forces remained generally low.
Jersey
While the storm passed well offshore of the state, it
Hurricane Off the
8/28/2014 generated strong waves and rip currents that killed 2
Cristobal coast
people in Sandy Hook.
Tropical Storm The remains of the storm passed through New Jersey
6/21/2015 Statewide
Bill dropping heavy rain but causing no damage.
Hurricane Northeast Inches of heavy rain and winds caused downed tree limbs,
10/28/2015
Patricia New Jersey power outages and flooding throughout the state
Hurricane Off the Strong waves and minor coastal flooding occurred along
9/5/2016
Hermine coast the coastline
Hurricane
10/8/2016 Statewide Brought light rain to the state.
Matthew
Strong winds were brought to portions of the state. Many
powerlines and trees were downed in parts of southern and
Tropical Storm
6/24/2017 Statewide central New Jersey. Two tornados related to the storm
Cindy
touched down in Howell Township, New Jersey damaging
various buildings locally.
5.8 - 22You can also read