Warrnambool STP Upgrade Project - Works Approval Application Response to Section 22 Notice (3) - Notice to supply further information, February ...
←
→
Page content transcription
If your browser does not render page correctly, please read the page content below
Warrnambool STP
Upgrade Project
Works Approval Application
Response to Section 22 Notice (3) - Notice to
supply further information, February 2021

June 2021
Contents
Contents ............................................................................................................................... 2
1.0       Introduction ................................................................................................................ 3
2.0       Nominated or nameplate capacity of the plant ............................................................ 3
3.0       Quantitative Microbial Risk Assessment ..................................................................... 3
4.0       Revised discharge limits ............................................................................................. 4
5.0       Clarity of the application ............................................................................................. 5
6.0       Attachments ............................................................................................................... 5

                                                                                                                          2|Page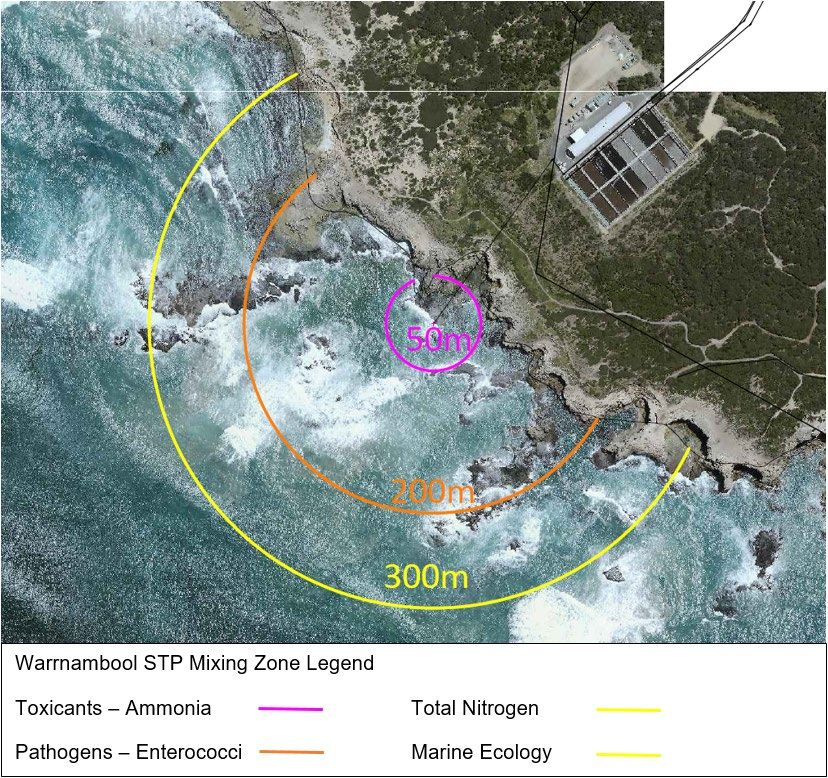
1.0 Introduction
This report outlines our response to the Section 22 – Notice to supply further information (26
February 2021). This notice was issued following an EPA assessment of the responses for
two previous Section 22 Notices relating to the Works Approval Application for the
Warrnambool Sewage Treatment Plant (STP) Upgrade Project.
A summary of the responses to the notice is outlined below. Further details are contained in
the attached documents and our Works Approval Application.
2.0 Nominated or nameplate capacity of the plant
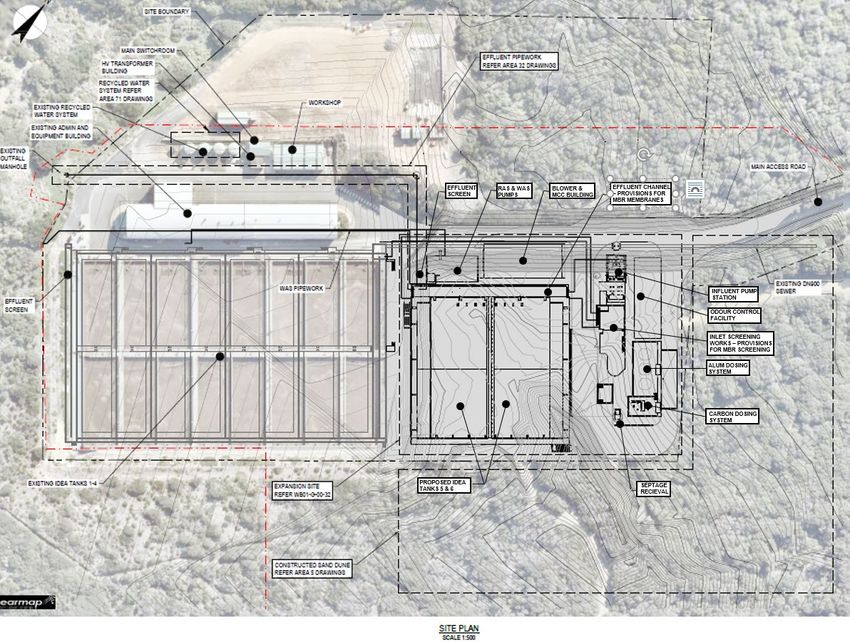
The proposed upgrade of the Warrnambool STP is based on two additional intermittently
extended aeration (IDEA) reactors. The system was selected as the preferred treatment
process due to its robustness and suitability for accommodating the variability in influent
associated with trade waste contributions. The treatment process has had a proven track
record at the Warrnambool STP site since the original plant’s construction in 1996 1.
Throughout the design process, much consideration has been given to addressing potential
risks associated with the construction and operation of the Warrnambool STP upgrade. N+1
redundancy principles have been included for critical equipment and components such as
pumps, screens, aeration system sludge and solids systems.
Post the proposed upgrade for the Warrnambool STP, the new nameplate capacity for the
site will be defined as 27.9ML/d. This value has been selected for the anticipated 2040
hydraulic and load scenarios based on the application of standard design principles.
Further information regarding the nameplate capacity and the summary of the design work
to establish this value are provided in Attachment 1.
3.0 Quantitative Microbial Risk Assessment
In response to the first Section 22 Notice (1) to supply further information (7 August 2020),
we engaged consultants GHD, to prepare a Quantitative Microbial Risk Assessment
(QRMA). The intent of this work was to further assess human health risks associated with
the discharge of treated effluent from the Warrnambool STP at Thunder Point.
In the latest Section 22 Notice (3) (26 February 2021), the EPA raised additional concerns
with regard to the QRMA, specifically around pathogens associated with animal slurries
which the Warrnambool STP receives from two of its trade waste customers.
In consultation with the EPA’s senior microbial health risk advisor, GHD reviewed additional
literature to assess the potential risks associated with animal slurries that would form a small
portion of the trade waste at Warrnambool. Specifically, pathogenic strains of E. coli were
considered, including the enterohaemorrhagic E. coli group (EHEC) including the O157:H7
serotype.
Conclusions of the additional literature review concluded:
• The recreational water quality risks from EHEC were estimated for the discharge
using literature inputs and compared with the risks from the other reference
pathogens in this report.
1
Wannon Water acknowledges that in more recent times, there have been some compliance issues that the proposal is
intended to address.
3|Page
• EHEC is not used as a standard reference pathogen in risk assessments using the
Australian water recycling guidelines (AGWR 2006, 2020), and the literature inputs
used to form assumptions for this assessment may not be from the most applicable
sources. Some caution is advised in the interpretation of the assessed risks, in
comparison with the other assessed pathogens.
• Under normal treatment conditions, EHEC risks were estimated to be similar to those
from the other reference pathogens. Specifically, these risks were calculated to be
less than the Cryptosporidium risks, but greater than the Campylobacter risks.
• Under conditions where no treatment was assumed, EHEC risks were estimated to
be similar to the Cryptosporidium risks, and greater than the Campylobacter risks.
The original QRMA report has been updated with the inclusion of two additional appendices
(appendix C and D) discussing the risks associated with pathogenic E. coli in animal waste
inputs to the Warrnambool sewage system. Refer to Attachment 2 for further information.
4.0 Revised discharge limits
As part of the original submission, we included a revised discharge table to be incorporated
into the upgraded Warrnambool STP discharge licence. This table was based on empirical
modelling undertaken by GHD.
In response to the EPA’s Section 22 (2) Notice (14 September 2020), and following
additional extensive modelling and assessment of reference / background water quality
(calculated in accordance with SEPP 2018), we proposed a revised table.
Additional information was sought by the EPA in the Section 22 (3) Notice regarding the
proposed upgrade. To address the latest concerns, a full review of all the Warrnambool
STP’s EPA licence conditions was undertaken, focusing more broadly than just the
discharge table.
Consideration was given to the human health risk assessment, 3D Hydrodynamic modelling,
dilution / plume modelling, chemical dosing analysis to achieve mixing zone reductions, and
assessment of the current environmental literature and standards along with comprehensive
background water quality data.
We have now developed a new discharge table with mixing zones that are as small as
reasonably practicable, accompanied by some new and modified licence clauses that aim to
protect the beneficial uses of the receiving environment. Some of the key changes include:
• Discharge table:
o A reduction in the licence flow value, corresponding to anticipated 2030 flows.
o Introduction of 90th percentile values for parameters where there is no impact
to the environment from one-off exceedance (non-toxicant parameters),
which is anticipated to align with future licence conditions that will trigger
notifications that treatment plant performance is not optimised
o A change from concentration to loads for nutrients to better reflect the
contribution to the receiving environment.
Capping Total Nitrogen discharged loads to 450kg/d, ensuring
concentrations decrease as future flows increase and discernible
impacts on the beneficial uses are confined to 300 metres.
Capping Total Phosphorous discharged loads to 590kg/d, reducing
the frequency and amount of chemical dosing required. In turn this will
4|Page
reduce truck movements and minimise the impact on our customers,
                      the local community and the environment indirectly.
   •   Mixing zones
          o Reducing the radius for toxicants from 300 metres to 50 metres, significantly
              tightening up the licence for potential environmental impacts
          o Maintaining a 300 metre radius for parameters impacting on the marine
              ecology
          o Reducing the radius for pathogens from 300 metres to 150 metres, halving
              the distance that presents risks to human health for water-based recreation
              activities
          o Maintaining the 300 metre radius for Nitrogen compounds which is a practical
              approach that allows the plant to service the region’s vital food industries
              without compromising the environment.
          o Ensuring the discharge does not cause an impact beyond the mixing zone on
              the beneficial use “water dependent ecosystems and species that are largely
              unmodified.” This will ensure the environment is protected from all stressors
              on the receiving environment.

The revised licence discharge table, proposed mixing zone table, licence conditions and
further explanations are provided in Attachment 3.

5.0     Clarity of the application
We submitted the original Warrnambool STP Upgrade Project Works Approval Application in
February 2020. Through the EPA’s internal assessment and following consultation with the
local community, additional technical information has been provided to address the concerns
and any technical enquiries.

Additional detailed modelling, increased investigation into risks, analysis of background
water quality and further assessment of technical information has allowed the upgrade
proposal to be strengthened, ensuring we can continue to provide an essential service to
the greater region and protect the environment.

No key physical aspects or components of the project have been modified, a testament to
the robustness of the original submission. Rather some key changes have been made to the
proposed licencing arrangement and to the operation of the upgraded STP.

The EPA subsequently requested a final document that summarises the application taking
into account all information presented throughout the Works Approval process. This
document can be found in Attachment 4.

6.0     Attachments

   1) Warrnambool STP Upgrade - EPA Section 22(3) Notice Item 1 Response Memo
   2) Human Health Risk Assessment for Warrnambool STP Upgrade Memo
   3) Warrnambool STP Upgrade - EPA Section 22(3) Notice Item 3 Response Report
   4) Warrnambool STP Upgrade – EPA Works Approval Application Summary Application

                                                                                 5|Page
Attachment 1 - EPA Section 22(3) Notice Item 1 Response Memo
4 May 2021
To Wannon Water
Copy to
From Mark Trickey Tel +61 3 52731833
Subject Warrnambool STP Upgrade – EPA Section 22(3) Job no. 3136788
notice preliminary draft response
To assist in the assessment of the works approval application for the Warrnambool STP Upgrade,
EPA has requested additional information via a Section 22(3) Notice to Supply Further Information.
The purpose of this email is to provide information to support Wannon Water’s response to Item 1 of
this notice.
1 Nameplate Capacity of Warrnambool STP Upgrade
1.1 Design background
The proposed upgrade of the Warrnambool STP is based on two additional intermittently extended
aeration (IDEA) reactors. This process was selected as the preferred process as it is robust and
suitable for accommodating the variability in influent associated with trade waste contributions since
construction in 1996.
The primary objectives for the process design of the Warrnambool STP upgrade were to:
Accommodate future domestic and industrial growth within the region
Provide sufficient treatment capacity to accommodate the design flows and loads and achieve
effluent quality requirements
Provide flexibility to accommodate variability in predicted influent profiles, including:
– Low carbon:nitrogen ratios 1
– Elevated phosphorus
Provide the ability to operate the system with new and existing IDEA reactors offline
Include provisions and allowances for the future conversion of the IDEA reactors into a membrane
bioreactor (MBR) based process.
Further information relating to design parameters and redundancy, process risks and nameplate
capacity is contained in the following sections.
1
One of the key contributing factors to “dirty decant” events and elevated effluent nitrogen as previous reported by Wannon
Water in the response to EPA Section 22(2)
3136788-22055-945/3136788-LET_GHD response to EPA S22(3).docx1.2 Key design parameters and redundancy A summary of the influent design basis for the Warrnambool STP upgrade is presented in Table 1, and a summary of key design parameters and infrastructure/equipment redundancy is presented in Table 2 for key areas of the plant. Table 1 Warrnambool STP design influent sewage flows and loads Parameter Unit Daily Average Flow ML/D 27.9 COD kg/d 17,760 BOD kg/d 8,880 TKN kg/d 3,350 TP kg/d 1,040 TSS kg/d 12,230 1.3 Risk assessment Significant consideration has been given to addressing potential risks associated with the construction and operation of the Warrnambool STP upgrade. This is reflected in the design documentation and hazard and operability study (HAZOP) completed for the project. To assist with responding to EPA’s Section 22(3) notice a risk assessment outlining some of the potential process risks is presented in Table 3. The risk assessment highlights that all biological treatment plants can be impacted by influent quality, hydraulic loads, equipment failure etc. There is an inherent risk, as there is with all biological treatment processes, that process performance and effluent quality can be impacted when sufficient quantities of waste that is toxic to the treatment process microbiology enters the treatment plant. Typically, this risk is low due to the dilution provided by the general volume of wastewater entering the treatment plant. In addition, as outlined in the risks assessment the Warrnambool STP upgrade has several mitigation measures that will minimise the risk of poor effluent quality. As noted in Wannon Water’s response to EPA Section 22(2) notice, the inclusion of carbon (sugar) dosing to mitigate one of the primary causes of recent “dirty decants” is a critical control measure. This has already been identified by Wannon Water and a temporary carbon dosing system has been commissioned at the Warrnambool STP. In summary, the proposed equipment and infrastructure redundancies for the upgraded plant (as summarised in Table 2) are consistent with best practice principles. On that basis the design of the Warrnambool STP upgrade to the nominated name plate capacity as outlined above is considered appropriate. 3136788-22055-945/3136788-LET_GHD response to EPA S22(3).docx
Table 2 Summary of design basis and redundancy for each plant area
Plant Area Infrastructure Design Design Duty/Basis Comment on redundancy
horizon
PRELIMINARY TREATMENT
Influent Pump station • 4 No. (3 Duty / 1 Standby) pumps 2065 • PWWF: 960 L/s 4 pump sets in a duty/assist/assist/standby configuration
Automatic changeover to standby pump will maintain full influent flow
to the plant up to the design duty point
Inlet works • 2 No. (1 Duty/1 Standby) fine screens 2065 • PWWF: 960 L/s Fine screens: 1 duty/1 standby arrangement
• Provisions for future installation of MBR pre-treatment Automatic changeover and rotation of screens
screens:
– 3 No. (2 Duty/1 Standby) ultrafine screens
Flow distribution • 1 No. flow distribution structure and flow meters 2065 • Existing IDEA tanks 1-4: 640 L/s Controlled and monitored distribution of flow to new and existing IDEA
system tanks
• New IDEA tank 5: 220 L/s
• New IDEA tank 6: 220 L/s Flow distribution chamber modelled (computation fluid dynamics) for
three scenarios:
– No IDEA tanks offline
– One IDEA tank offline
– Two IDEA tanks offline
(if required following commissioning to manage excess plant
capacity under current flows)
SECONDARY TREATMENT
IDEA tank • 6 No. (4 No. existing and 2 No. new) 2040 • Peak loads: IDEA tank can be taken offline and flow balance across remaining five
tanks i.e. provides additional redundancy compared with existing
• Existing IDEA tank volume: 7.3 ML @ TWL/tank – Organic load: 11,960 kg BOD/d
system
• New IDEA tank volume: 8.4 ML @ TWL/tank – Nitrogen load: 4,010 kg TKN/d
Design basis considers one tank being offline under design conditions
• Max MLSS: 4,000 mg/L (at 20 – 25 days sludge age)
Design includes provisions for diurnal peaking factors
• Aeration demand: 800 kg O2/hr
Aeration system • Existing: 6 No. blowers (5 Duty/1 Standby) 2040 • Existing IDEA tanks: 800 kg O2/hr Existing and new aeration system based on N+1 configuration
• New: 4 No. blowers (3 Duty/1 Standby) • New IDEA tanks: 600 kg O2/hr Automatic changeover to standby blower to maintain full aeration
• Fine bubble diffusers capacity to the process
Note that only one of the 2 new IDEA tanks will be in aeration mode at
a time
3136788-22055-945/3136788-LET_GHD response to EPA S22(3).docxPlant Area Infrastructure Design Design Duty/Basis Comment on redundancy
horizon
Chemical dosing • 1 No. carbon (sugar) storage and dosing system 2040 • Carbon: 40 L/hr Dosing pumps in a duty/assist/assist configuration
• 1 No. alum storage and dosing system • Alum: 20 L/hr Carbon (sugar) dosing enables plant to accommodate variability in
influent composition and potential settleability and nitrogen removal
limitations
Alum dosing enables chemical phosphorus removal and can assist
with poor settleability if required
Treated effluent • Existing and new IDEA tanks: 2065 • Flow: 560 L/s Full redundancy (N+1) provided by manual effluent screening system
screens Manual screening system in an N+1 configuration to enable one
– 1 No. duty mechanical screen
screen to be removed for cleaning
– 2 No. (Duty/Standby) manual screens
SLUDGE & SOLIDS HANDLING
Sludge recycle 3 No. (Duty/Assist/Assist/Standby) pumps 2040 Recycle ratio: 3:1 Recycle pumps in an N+1 configuration
Further redundancy provided by combined recycle i.e. recycle to
individual or separate IDEA tanks
Sludge wasting 2 No. (Duty/Standby) pumps 2040 • WAS: 180 m3/h Recycle pumps in an N+1 configuration
Sludge wasting pumps designed based on 16 hr/d and 5 d/week,
providing additional redundancy
Sludge dewatering • 1 No. existing belt filter press (BFP) 2040 • WAS: 180 m3/h BFP and centrifuge in a N+1 configuration
• 1 No. existing centrifuge Sludge wasting pumps designed based on 16 hr/d and 5 d/week,
• Provisions for future centrifuge(s) installed by 2040 to providing additional redundancy
accommodate increasing solids production
3136788-22055-945/3136788-LET_GHD response to EPA S22(3).docx1.4 Nameplate capacity
The nameplate capacity of wastewater treatment plants can be defined using various parameters
including flow, equivalent population (ep) or load (e.g. kg COD/d). Furthermore, while defining the
nameplate capacity of a plant using flowrate provides an indication of “capacity”, understanding the
strength of the wastewater (and therefore loads) is also important.
For Warrnambool, the nameplate capacity for the upgraded STP can be stated as 27.9 ML/d.
This nameplate capacity is reflective of the design flows and loads adopted for the Warrnambool STP
upgrade, and some of the key design basis values included below. Comments relating to the
consideration of upset events is also included in Section 1.4.3.
1.4.1 Design basis
The upgraded Warrnambool STP has been designed to accommodate the influent profile outlined in
Table 1, and a comparison of the key design criteria with the following typical process design
parameters for an intermittent activated sludge process is presented in Table 4:
Solids retention time (SRT), days
Mixed liquor suspended solids (MLSS), mg/L
Hydraulic retention time (HRT), h
From the values presented in Table 4, it could be concluded that the design values adopted for the
Warrnambool STP could be considered somewhat conservative when compared with typical design
values. This approach provides a dual benefit:
It provides an increased level of robustness for the site to accommodate the variability in influent
due to the significant trade waste contributions
It enables one IDEA tank to be taken offline for maintenance (e.g. replacement of the aeration
diffusers) as discussed below.
This comparison further supports the nameplate capacity defined above.
Table 3 Comparison on Warrnambool STP design with typical design parameters*
Scenario SRT (days) MLSS (mg/L) HRT (h)
Typical 10 – 30 3,000 – 5,000 20 – 30
Current 25 – 30 4,000 – 5,000 32 - 43
Future (6 IDEA tanks) 20 - 25 4,000 31 - 40
(5 IDEA tanks) 17 - 23 4,000 26 - 33
* Metcalf and Eddy, “Wastewater Engineering Treatment and Reuse”, 4th edition, 2003
3136788-22055-945/3136788-LET_GHD response to EPA S22(3).docxTable 4 Warrnambool STP Process Risk Assessment
Hazard Identification Current Risk Rating Revised Risk Rating
Mitigation Measures
Significance Significance
Item No. Scenario/Event Description Existing Controls (Current System) Likelihood Consequence Likelihood Consequence
of Risk of Risk
Enhanced influent screening with
Discharge of nurdles or other similar plastics Trade waste controls, septage tanker delivery
1 2 4 Medium Warrnambool STP upgrade, effluent screening 2 1 Low
to the Warrnambool STP sewerage network controls, community awareness programs
with two (2No.) standby screens
Variability in STP influent - low Upgrade includes carbon dosing system with
2 carbon:nitrogen ratio insufficient for nitrogen Trade waste controls 5 2 Medium equipment redundancy to manage influent 1 2 Low
removal composition to achieve nitrogen limits
Upgrade includes carbon dosing system with
equipment redundancy to manage influent
composition to achieve nitrogen limits
Variability in STP influent - significant rapid
Alum dosing system also available to assist
3 reduction in carbon loads - impacts STP Trade waste controls 5 3 High 1 3 Low
during periods of poor settleability
biomass and results in poor settleability
Upgrade provides increase hydraulic capacity
and ability to return poor effluent quality
("dirty "decant") to plant inlet
In parallel with upgrade, trade waste
agreements will be reviewed & renewed to
Variability in STP influent - rapid changes due reflect discharge licence change. Increased
4 Trade waste controls 5 3 High 1 3 Low
to industry fluctuations, shutdowns, etc ability to enforce breaches ensuring major
customers reduce targeted parameters
maintaining overall STP compliance
Major process equipment failure - Pumps and
Existing plant major process equipment
5 blowers - impacting process control and 2 3 Low No further measures required 3 3 Medium
provides N+1 redundancy
effluent quality
Solids handling system has equipment
Major process equipment failure - solids Upgrade provides increase hydraulic capacity
redundancy
6 dewatering system - unable to waste solids 1 3 Low and ability to return poor effluent quality 1 3 Low
Mobile solids dewatering systems can be
leading to poor settleability ("dirty "decant") to plant inlet
mobilised if required
Process monitoring equipment failure -
7 impacts process performance leading to poor Duty turbidity/solids meter for effluent channel 3 2 Medium No further measures required 3 2 Medium
effluent quality
Site generator available for critical process Upgrade included new generator for critical
8 Power supply failure 3 2 Medium 3 2 Medium
equipment process equipment
3136788-22055-945/3136788-LET_GHD response to EPA S22(3).docx1.4.2 Maintenance scenarios The “nameplate capacity” of wastewater treatment plants is not typically based on having a treatment train or reactor offline. This is considered to be an “unusual” event and is often associated with planned major maintenance activities that are undertaken very infrequently. The most common example of reactors being taken offline is to enable aeration diffuser replacement. This is typically undertaken at Warrnambool every 5 – 7 years, and has been since the plant was commissioned. The works typically involve taking each reactor offline for a period of approximately 4-6 weeks i.e. the plant operates with one tank offline for a total period of approximately 16-24 weeks. In future, Wannon Water will continue to plan for major maintenance events such as diffuser replacement so as to avoid impacts on effluent quality. Furthermore, it is noted that following completion of the upgrade, taking one IDEA tank offline will also reduce the additional loading placed on the remaining IDEA tanks compared with the current system (a key consideration when considering the robustness of upgrade options), further adding to the robustness of the plant. Irrespective, it is not considered typical for the nameplate capacity of wastewater treatment plants to be based on periods where part of the plant is taken offline for maintenance. 1.4.3 Upset condition Defining the nameplate capacity of a plant during or based on an “upset” condition is not considered standard practice. As noted above and in the risk assessment, the Warrnambool STP is a biological treatment process. The process is considered robust and has proven to be resilient over the past 20 years, however significant variability in influent conditions has led to “upset” conditions and “dirty decant” events. The inclusion of a carbon (sugar) dosing system and alum dosing to enhance settleability in the Warrnambool STP upgrade will mitigate this risk in future. Therefore the nameplate capacity stated above is considered appropriate. 3136788-22055-945/3136788-LET_GHD response to EPA S22(3).docx
Attachment 2 - Human Health Risk
Assessment for Warrnambool STP Upgrade
Memo
7 June 2021
To Chris Mahoney
Copy to Mark Trickey
From Malcolm Warnecke Tel
Subject Human Health Risk Assessment for Warrnambool Job no. 3136788-39
STP upgrade – Rev 3
1 Background
EPA Victoria has provided Wannon Water with a draft Section 22(1) Notice to Supply Further
Information, regarding the proposed ocean discharge for the Warrnambool Sewage Treatment Plant
(STP). To support the existing application, Wannon Water is required to provide additional information,
including the provision of a Human Health Risk Assessment (HHRA) of the proposed discharge. This
assessment should address but not be limited to the following:
An assessment of pathogens that may be present in the wastewater that the treatment plant receives
(including trade waste)
Details of the STP treatment process and Log Reduction Values (LRVs) for the different types of
pathogens achieved through the treatment process to determine the likely pathogen levels in the
effluent
Define the populations that may be exposed, their exposure pathway (including consumption of fish
and shell fish) and estimated pathogen/surrogate levels at the point of exposure. Determine what the
fate of these pathogens is likely to be, considering dilution factors, die-off and local hydrodynamic
conditions
Estimate the risk of illness for the exposed populations
Provide a health risk assessment of “dirty decant” events which includes the contributing factors, the
likelihood, and the consequences for exposed populations.
Consideration of both median and low wave height conditions.
2 Methodology
The requirements described by EPA Victoria have been addressed with a Quantitative Microbial Risk
Assessment (QMRA). The QMRA examines the concentrations of reference pathogens from the STP
through the pathways that can lead to potential exposure of those pathogens to the local population.
The general format for the QMRA is that described in the AGWR (2006) and WSAA (2015) and based on
discussions with EPA. This format allows clarity with the assumptions used, the transparent calculation of
pathogen risks and of concentrations of pathogens through the exposure pathways examined, and the
ready update of calculations in the event that the assumptions are subsequently updated. Where
applicable, quantitative values for assumptions have been drawn from AGWR (2020).In addressing the specific requirements noted by EPA Victoria, the QMRA has included the following:
The standard reference pathogens (Cryptosporidium, norovirus and Campylobacter) used in AGWR
(2020) have been examined, with the default concentrations of these pathogens in sewage also
drawn from this source. The Warrnambool sewerage catchment contains a substantial proportion of
trade waste, which can be expected to dilute the concentration of pathogens present in the influent to
the STP; an estimate of the dilution has been calculated in the assessment.
A further reference pathogen (E. coli O157:H7) has been included, to examine pathogen risks from
cattle saleyard discharges to the sewerage catchment.
STP treatment processes expected to reduce pathogen concentrations includes secondary treatment.
The default LRVs for secondary treatment from Table 3.3 (AGWR, 2020) have been applied to
determine the likely pathogen concentrations in the STP effluent.
The exposure pathways by which human populations could potentially be exposed to pathogens
sourced from STP effluent include primary contact recreation at a nearby beach, offshore diving and
similar activities, and the consumption of fish and shell fish caught in the local area. The
concentration of pathogens at the point of exposure have been estimated for each pathway
examined, including the effects of dilution, pathogen die-off and local hydrodynamic conditions.
The risk of illness for exposed populations have been estimated and expressed as DALYs. Dose
response information for the reference pathogens has been drawn from AGWR (2020).
An examination of ‘dirty decant’ events has been included as a scenario within the overall
assessment. The scenario has been incorporated into the assessment through removal of the
pathogen LRVs from treatment processes that would be applicable under normal operation.
Discussion around the contributing factors, an estimate of likelihood of occurrence based on these
factors, and the quantitative effects on the health risk assessment has also been included.
The assessment includes median wave height and low wave height scenarios, to incorporate the
effects of local hydrodynamic conditions.
The outputs of the QMRA include estimated pathogen concentrations in the discharge mixing zone, at
Shelly Beach, located approximately 450 m to the northwest of the STP discharge point, and at Stingray
Beach, located to the east of the discharge point. The risks of illness from exposure at these location for
reference pathogens expressed in DALYs are additional QMRA outputs. In order to provide some
context as to the relative risk of pathogen concentrations, the results of a brief literature search
summarising Cryptosporidium concentrations in various recreational waters has been included. As a
comparative risk expressed in DALYs, the health based target for drinking water favoured by WSAA is a
risk of 10-6 DALYs per person per annum.
2.1 Dilution of STP influent
The Warrnambool STP incoming wastewater comprises a combination of domestic sewage and trade
waste. Trade waste can be expected to contain similar or smaller pathogen concentrations than domestic
sewage, or no pathogens at all, depending on the nature of the industry and the trade wastes generated.
Whilst sewerage catchments can usually be expected to contain some industrial inflows, which would
contribute some dilution of the default pathogen concentrations in sewage, the proportion of trade wastein the Warrnambool catchment is significant, and the effect of this on pathogen concentrations in the STP
influent has been estimated here.
In the Warrnambool sewerage catchment, the trade waste inflows are sourced from inputs related to
primary production, including abattoir, saleyard and dairy inputs. The concentrations of pathogens from
these sources can vary widely and be site-specific, and there is an absence of local monitoring data from
the individual inputs. The following assumptions have been made about the trade waste inflows:
None of the trade waste inflows contain human-sourced inputs, and so are not expected to contain
human-specific enteric viruses.
Effluent from abattoirs contain slurries and animal faeces. There is little literature data on pathogen
abundance in abattoir wastewaters, however pathogen concentrations have been assumed to be
similar to raw sewage for the purpose of this QMRA (see Appendix C for further discussion of this,
and Appendix D for a QMRA of the cattle wastes inputs). The Warrnambool abattoir trade waste
inflows are processed with fine screening and dissolved air flotation (DAF) treatment. DAF has been
demonstrated to remove 1.7-2.5 logs of protozoa in drinking water treatment (Edzwald et al, 2001),
and with similar indicative removal rates to bacterial pathogens when included in multi-treatment
barriers (such as AGWR 2020, Table 3.3). Due to this treatment process, pathogen concentrations in
this trade waste inflow are expected to be 2 logs less than domestic sewage.
The Warrnambool dairy site does not host live animals, and receives bulk milk and water for
processing. The transmission of Cryptosporidium via raw milk has been reported in the literature
(such as Ursini et al, 2020), however the potential concentration of this pathogen in milk would be
expected to be orders of magnitude less than in sewage. Additionally, the Warrnambool dairy trade
waste inflows are processed through an anaerobic reactor and with induced air flotation (IAF), which
is expected to have similar indicative pathogen removal rates as treatment using DAF. Pathogen
concentrations in this trade waste inflow are expected to be at least 2 logs less than domestic
sewage, and probably substantially less than this estimate. The concentrations of these pathogens
from the dairy inflows have been assumed to be zero for the purpose of this QMRA.
The Warrnambool saleyard inflows can be expected to contain protozoa and bacterial pathogens. The
default concentrations of these pathogens in sewage (2,000 Cryptosporidium oocysts per litre, and
7,000 Campylobacter per litre) have been used to estimate these inputs in the QMRA. This estimate
was supported by literature estimates of cattle pen manure in Australia (Klein et al, 2010) and the
estimation of dilution from suspended solids data monitoring, as described in Appendix D.
Inflow data for the sewerage catchment are reported to the Essential Services Commission, from which
recent data has been summarised in Table 1. This includes data for each of the three years 2017/18,
2018/19 and 2019/20, and the combination of these years.Table 1 Sewerage catchment inflows from industrial and domestic properties
2017/18 2018/19 2019/20 3 year average
Median daily inflow 14.6 ML 15.0 ML 14.9 ML 14.8 ML
Industrial annual inflow 40% 41% 41% 41%
Domestic annual inflow 60% 59% 59% 59%
The combined industrial and domestic inflows for the three reported years include ~41% industrial
inflows, and ~59% domestic inflows. This represents a dilution of the pathogen inputs from domestic
sources by a factor of ~0.59. The industrial inflows include a median inflow from saleyards of 0.3 ML/day,
inflows from domestic sources plus the saleyards constitute ~61% of the total inflows.
The proportion of trade waste inflows in sewerage catchments elsewhere is generally substantially
smaller than in the Warrnambool catchment. For example, collated reporting data for NSW utilities allows
the calculation of the proportion of trade waste in total sewage inflows (NSW DPI, 2017). Using data for
utilities of >10,000 properties where metered trade waste inflows have been reported (Table 15 of cited
reference), the proportion of trade waste ranges from 0.09% to 22.5%, with a median proportion of 4.1%.
Using the NSW data estimate to calculate what can be expected in sewage with default pathogen
concentrations, with an adjustment for the proportion of domestic inflows present in Warrnambool, the
pathogen concentrations in Warrnambool sewage can be calculated as follows:
Viruses: Default concentration x 1.041 x 0.59 = Default concentration x 0.61
Bacteria and Protozoa: Default concentration x 1.041 x 0.61 = Default concentration x 0.64
These calculated modifiers have been applied as dilution factors for the assumed pathogen
concentrations in the STP influent.
The estimated inflows to the sewerage catchment have been projected to 2040 to inform the design of
the Warrnambool STP upgrade. Inflows are predicted to increase to 27.9 ML/d, comprising 12.5 ML/d
(45%) domestic sources and 15.4 ML/d (55%) from industrial sources (GHD 2018, Table 2). The median
saleyard inflow volume of 0.3 ML/day remains unchanged in this projection, but reducing to 1% of the
greater volume of total inflows. The inflows from domestic sources plus the saleyards constitute
12.8 ML/day, 46% of the total inflows.
This reduced proportion of domestic inflows in 2040 leads to an estimated virus concentration in the STP
inflow of 1.041 x 0.45 = 0.48 x the default virus concentration in sewage. Similarly, bacteria and protozoa
concentrations are also estimated as 1.041 x 0.46 = 0.48 x their default sewage concentrations.
2.2 STP treatment processes
The STP includes secondary treatment, which provides a reduction of pathogen concentrations. From
AGWR (2020), the removal of 0.5 LRV for protozoa and 1 LRV for bacteria and viruses is described as
the default estimate for this treatment type.
The STP has infrequently experienced ‘dirty decant’ events, where the treatment processes have been
incompletely effective. It is assumed that this has resulted in the discharge of effluent containing greaterpathogen concentrations. The effects of dirty decant events have been examined as separate scenarios
in this QMRA, with the expected LRV from treatment process reduced to zero.
2.3 Dilution of STP discharge
The dilution achieved within and beyond the existing licenced mixing zone was predicted using a
calibrated and validated 3D hydrodynamic and wave model (GHD 2020). The model produces
predictions of dilution in the form of dilution distributions for summer and winter simulation scenarios at
the edge of the 300 m regulatory mixing zone for both current and future/design flow (27.9 ML/d)
conditions. The dilution distribution curves are conservatively calculated on the basis of the minimum
dilution anywhere along the mixing zone edge or at a point for each model timestep.
Estimates of annual dilution are produced by combining the model outputs from the summer
(representative calm wave conditions) and winter (representative energetic wave conditions) simulations.
The combination of these two periods is assumed to reflect typical annual conditions. Therefore, for the
purpose of this investigation the following assumptions were adopted:
Adopt minimum dilution distribution estimates as the basis for dilution
Assume 50th percentile dilution from the annual dilution estimate to represent “median” wave
conditions
Assume 5th percentile dilution from the annual dilution estimate to represent “low” wave conditions
Further to the information above, a comparison of indicator organism (enterococci) information is
presented in Table 2 to provide an indication of pathogen log reductions achieved within and at the edge
of the mixing zone. This has been considered further in Section 4.1 to compare estimated concentrations
with actual data.
Table 2 Indicator organism log reduction within the Warrnambool STP mixing zone
Location Enterococci
Warrnambool STP effluent discharge 2,000 orgs/100 mL
(2013 – 2020 Median) (N = 153)
Wannon Water outfall monitoring data 1 – 5 orgs/100 mL
Monitoring
(2013 – 2020 Median)* (N=40)
@ 300 m
Log reduction
> 3 logs
Wannon Water outfall monitoring data 0 - 3 logs
* Range represents the median concentrations from the eastern and western sampling sites at the edge of
the 300 m mixing zone
** Range represents the range of concentrations from the sampling sites 140 m west and 130 m east of the
discharge point
*** N = number of samples taken at sampling sitesIn summary, Table 2 includes indicator concentration data from sites 300 m and 130-140 m from the
discharge point. Most of the sampling data is from the 300 m sites, and log reductions of >3 log for
enterococci are calculated for those sites. As described in Section 2.4, a distance of 150 m from the
discharge point has been used to estimate dilution in the mixing zone, so the monitoring data from points
130 m and 140 m from the discharge point have also been considered, as more representative of dilution
at that distance. From these monitoring data, log reductions of >3 log for enterococci were estimated at
the shorter distance.
2.4 Dilution in the mixing zone
The STP discharge EPA licence mixing zone has a radius of 300 m around the discharge point. In order
to examine water conditions within the zone, the mid-point distance of the radius (i.e. 150 m) has been
used to calculate the amount of dilution in that area. The most realistic recreational activity in the vicinity
of the outfall resulting in exposure to the discharge is considered to be fishing and/or diving in the mixing
zone, so the figure for dilution in the mixing zone has been used for the QMRA calculations. Based on
information provided by Wannon Water we understand that this typically occurs over the summer months
and limited to 3-4 days per month due to poor weather/swell (refer Section 2.5.2 for further details about
ocean conditions in this area).
The estimated dilution at 150 m from the discharge point has been calculated under four relevant
conditions, including low and median wave height, and discharge rates based on current (2020) flow
rates and those projected for 2040. The resultant estimated dilutions are summarised in Table 3.
Table 3 Dilution within the mixing zone (GHD 2020)
Discharge flow Wave height Dilution factor Dilution (%)
15 ML/day (2020) Low wave height 142-fold 0.7%
27.9 ML/day (2040) Low wave height 81-fold 1.23%
15 ML/day (2020) Median wave height 438-fold 0.29%
27.9 ML/day (2040) Median wave height 257-fold 0.39%
During low wave height conditions, less mixing can be expected, resulting in less dilution. The dilution
resulting from low and median wave height have been estimated so as to compare the quantifiable
difference between these conditions as scenarios in the QMRA.
Similarly, the discharge rates typical for 2020 (15 ML/day) and projected for 2040 (27.9 ML/day) will
result in different dilution rates in the mixing zone, and are examined in the QMRA as scenarios.
2.5 Dilution from discharge point to recreational areas
Two recreation areas were considered as part of the QMRA:
Stingray Bay
Shelly Beach.2.5.1 Stingray Bay
Stingray Bay is a high use swimming beach located at the mouth of the Merri River. It is located
approximately 1,500 m southeast from the STP discharge point. There is vehicle access from
Breakwater Road.
It should be noted that as Stingray Bay is situated at the mouth of the Merri River, pathogens present in
the riverine flows could be expected to have some effect on Stingray Bay. No consideration of the
presence of pathogens in Merri River flows have been made in the estimation of pathogen
impacts in this QMRA.
Drawing on the 3D hydrodynamic modelling presented in GHD (2020), the amount of dilution of the
discharge at Stingray Beach was calculated. Variables for these calculations included the discharge flow
rate (15 ML/day and 27.9 ML/day), and low and high wave height conditions. The calculated dilution
rates are summarised in Table 4.
Table 4 Dilution from discharge point to Stingray Beach
Discharge flow Wave height Dilution factor Dilution (%)
15 ML/day (2020) Low wave height 2229-fold 0.045%
27.9 ML/day (2040) Low wave height 1240-fold 0.081%
15 ML/day (2020) Median wave height 21,264-fold 0.0047%
27.9 ML/day (2040) Median wave height 14,714-fold 0.0068%
2.5.2 Shelly Beach
Shelly Beach is located approximately 450 m northwest from the STP discharge point. Shelly Beach is
the nearest “beach” but it does not have car park access. We understand the beach is accessible from
Thunder Point carpark, approximately 1,200 m east as shown in Figure 1. The beach is advised as
“unsuitable for safe swimming”1 due to strong, permanent rips.
1
Surf Life Saving Australia, Beachsafe Website (https://beachsafe.org.au/beach/vic/warrnambool/warrnambool/shelly)Figure 1 Access to Shelly Beach However, Wannon Water has advised that swimming does occur here, although this is more likely at the western end of the beach, which is a greater distance from the discharge point. It is understood that swimming is relatively uncommon, as there are many other local beaches that can be accessed with a much shorter walk. Drawing on the 3D hydrodynamic modelling in GHD (2020), with variables for low and high wave heights, and discharge flow estimates for 2020 and 2040, the calculated dilution rates are summarised in Table 5. Table 5 Dilution from discharge point to Shelly Beach Discharge flow Wave height Dilution factor Dilution (%) 15 ML/day (2020) Low wave height 918-fold 0.11% 27.9 ML/day (2040) Low wave height 563-fold 0.18% 15 ML/day (2020) Median wave height 1706-fold 0.059% 27.9 ML/day (2040) Median wave height 1080-fold 0.093% 2.6 Pathogen die-off in the marine environment From the empirical modelling summarised in GHD (2019), the time of exposure in the marine environment of pathogens has been estimated. This is based on the conservative assumption of current speed as 1 cm/sec. Transit time for 150 m, as the mid-point of the mixing zone radius, has a residence time of 15,000 seconds, or approximately 4.2 hours. Transit time for 450 m, as the distance to Shelly Beach, has a 45,000-second residence time, or approximately 12.5 hours.
The prevailing currents in the Warrnambool region typically flow continuously from west to east. It has
been assumed in the QMRA that this flow pattern is the case for the discharge. As Shelly Beach is
located to the northwest of the discharge point, the flows from the discharge point would typically be
away from the beach. To account for this, the assumed exposure time for pathogens has been increased
to 24 hours. This is considered conservative, and it is expected that the actual time for flows against the
prevailing current would typically be greater than this.
The distance to Stingray Bay is greater than that for Shelly Beach, however the prevailing flows from the
discharge point can be expected to be towards Stingray Bay. To account for this, the assumed exposure
time for this beach has also been estimated at 24 hours.
Pathogen die-off rates in surface waters can vary considerably between organism types, as well as from
the effects of local environmental conditions, such as temperature and the amount of sunlight. The rate is
often expressed as a T90 value, which is the time in days for a 1 log10 reduction in pathogen
concentration, or as a decay rate describing the proportion of reduction per day.
Murphy (2017) summarises pathogen die-off rates from literature for a range of microorganisms, under
different environmental conditions. Rates for pathogen survival in salt water, for organisms relevant to
this QMRA, are summarised in Table 6.
Table 6 Selected microbial die-off rates in salt water (drawn from Murphy, 2017)
Organism Temperature Exposure T90 Die-off/day Reference
Noro G1 9-11 °C Dark 3.58 0.47438
Noro G1 9-11 °C Sunlight 3.72 0.4615
Noro G1 16-18 °C Dark 2.49 0.60336
Noro G1 16-18 °C Sunlight 0.9 0.92257 Flannery et al.
Noro G2 9-11 °C Dark 4.23 0.41978 (2013)
Noro G2 9-11 °C Sunlight 3.5 0.48205
Noro G2 16-18 °C Dark 1.71 0.73986
Noro G2 16-18 °C Sunlight 0.85 0.93339
Cryptosporidium 20-25 °C Dark 56 to 120 0.04 to 0.019 Sidhu et al. (2015)
E. coli 16.8 °C Sunlight 1.7 0.74191 Ahmed et al.(2014)
Of the values in Table 6, the T90 values are as expressed in the literature, and the Die-off/day rates have
been calculated from the T90 values2. The organism specific rates drawn from Table 6 are as follows:
The norovirus rates from warmer temperatures (16-18 °C) have been used in preference to the colder
temperatures (9-11 °C) as these better reflect the ambient temperatures in the receiving water.
Exposure to sunlight is assumed. The die-off rates for G1 and G2 noroviruses are similar under
these conditions, so a mid-range die-off rate of 0.93/day has been used in the QMRA.
The Cryptosporidium T90 value is derived from an exposure study in brackish groundwater, rather
than in marine waters with solar exposure. Murphy (2017) identifies Cryptosporidium persistence in
salt water as a significant data gap in microbial die-off rates. The range of values described can be
expected to be quite conservative when applied to marine conditions. The most conservative die-off
rate of 0.04/day has been used in the QMRA.
No study of the persistence of Campylobacter in salt water was found in Murphy (2017), or
elsewhere. The persistence of this pathogen in other surface waters is less than that calculated for
E. coli. In absence of data for Campylobacter persistence in salt water, a die-off rate of 0.74/day for
E. coli has been substituted in this case as a conservative estimate. The E. coli rate has also been
applied to estimate the persistence of E. coli O157:H7.
2.7 Pathogen exposure and dose response
Pathogen exposure through primary contact recreation has been estimated as an ingested volume of
100 mL per exposure event. Suppes et al (2014) quantified pool water ingestion rates, with 25 of 38
swimmers ingesting some pool ranging from 0.9 to 105.5 mL per hour of recreation. It is likely that the
amount of water ingested while swimming would be less in salt water than in fresh water, so this estimate
2
Die-off/day calculated from Nt/N0 = 10-k.t, where Nt = number of organisms at time t, N0 = number of organisms at time 0, k = die-
off/day constant, and t = time in days.is regarded as conservative. The effect of this assumption on the calculated risk estimates is further discussed in section 4.1. Pathogen exposure and the resultant risk have been calculated for a single event. There are various pathogen-specific factors relating to dose response that are incorporated into the QMRA, including the probability of infection per organism, the proportion of infections that lead to illness, and the assignment of DALYs per case of an illness. DALYs are a mechanism to express the severity of impact of an illness, weighting the impact between 0 for good health and 1 for death, and multiplied by the years of duration of the effect. The assumed values for all of the dose response effects have been drawn from AGWR (2020), the estimates for these values have progressively developed over the last 20 years or more. They have been transparently included in the QMRA, to allow updating at a later date should the understanding of these estimated values develop further in the future. 2.8 Fish and shellfish consumption As there is no known commercial harvesting of fish and shellfish within the vicinity of the STP discharge, it is difficult to define a quantitative risk for their consumption. However, some low-level harvesting and subsequent consumption is possible, with harvesting having been previously observed. Wannon Water have reported cray pots being seen located 200 m east of the discharge point in February 2017, and of fishing activities close to the outfall. This has been examined as described in section 5, based on the QMRA results for pathogen concentrations and risks in the discharge mixing zone. 3 Dirty decant events The Wannon Water response to the EPA query about “dirty decant” events (re: Item 4 in S22 (1)) has been included here in full, to provide context about these discharges. A “dirty decant” is a partial or full discharge event where the treated effluent quality is outside of compliance with the EPA discharge licence for the plant. To be very clear, Wannon Water has never discharged untreated sewage to the ocean at the Warrnambool STP. The recent dirty decant events that the public has raised concerns to throughout the EPA WAA process of the Warrnambool STP Upgrade is of a non-conforming decant, typically where the effluent has higher turbidity including more suspended solids, as a result of poor settling performance within one of the IDEA tanks during a decanting phase of the treatment process. The so called “dirty decant” is not raw sewage, rather treated effluent with visible solids comprising of decomposed organisms that have provided the treatment of the incoming sewage, resulting in the dark colour. Apart from increased turbidity and suspended solids, the quality of the effluent is likely to have a marginally higher pathogen and nutrient levels present. The Warrnambool STP has been in operation since 1997 using the IDEA treatment process. Over that period, the exact number of non-compliant decant events are not known. In recent years, as the plant has neared its hydraulic and load capacity, there has been an increase in the frequency of these events.
4 QMRA results
4.1 Estimation of pathogen risks from recreational exposure
Estimates of the pathogen risks from primary contact recreation at Stingray Bay beach under low wave
height conditions are shown as Table 8, in Appendix A. This is regarded as the basic case for the QMRA.
The outputs from the QMRA are pathogen concentration estimates, and estimates of the overall disease
burden for each of three reference pathogen groups, expressed as disability-adjusted life years (DALYs).
For reference, these outputs are located on the green-highlighted rows of the table.
Inputs to the basic case have been varied to examine a number of other scenarios. The calculations for
these scenarios have been included as Appendix B, and include the following cases:
Risks during median wave height, instead of low wave height.
Risks from primary contact recreation in the discharge mixing zone and at Shelly Beach, instead
of at Stingray Bay beach.
Risks from a ‘dirty decant’ event, instead of during the normal operation of treatment processes.
Risks using a 2040 discharge volume (27.9 ML/d), instead of the typical current discharge.
The outputs (the green highlighted rows – the estimated pathogen concentrations in the water, and the
pathogen risks) from the various scenarios have been summarised in Table 9 and Table 10 in
Appendix A.
Some verification can be performed of the change in estimated concentrations of Campylobacter (as a
reference bacterial pathogen), between the STP effluent (448 organisms/L, Table 8) and within the
mixing zone median wave height, normal treatment, and 2020 discharge rate (1.026 organisms/L, Table
9). The dilution and one day of die-off during transit is estimated to have reduced the concentration by
437-fold, to a proportion of ~0.23% of the original effluent concentration. When compared with the
monitoring data for bacterial indicators presented in Table 2, the estimated reductions in concentration
are >3 logs for E. coli and enterococci – a reduction in concentration of >1,000-fold. The difference
between the estimated Campylobacter concentration and the lower concentrations from the monitoring
data could be attributed to conservatism of the assumptions regarding dilution and bacterial die-off,
and/or the limited amount of monitoring data available at the tested locations.
As noted in section 2.7, it has been assumed in the QMRA that a recreational exposure event involves
the ingestion of 100 mL of water. This is derived from a literature value calculated for freshwater
recreation, and is conservative for seawater recreation, although is still plausible for extreme cases such
as a swimmer in distress. A smaller volume such as 20 mL may be more typical for seawater recreation.
The effect of this assumption is linear on the calculated risk estimates; a five-fold reduction in the volume
consumed would result in a five-fold reduction in the risk estimate.
4.2 Estimation of pathogen risks from fish and shellfish consumption
As described in CEE (2017), there is currently no industrial or commercial use of coastal waters at
Warrnambool, such as aquaculture. Commercial fishing comprises rock lobster fishing and abalone
collection on rocky reefs, and it is unclear how much abalone is harvested from the Warrnambool area.There is the possibility of fish or shellfish being harvested by members of the public from within the mixing zone, which is examined further here. The major foodborne pathogens associated with fish (Novoslavskij et al, 2015) can be present in sewage, and could be consumed by fish when in waters affected by sewage, and subsequently present in the fish digestive system. However, subsequent transmission would require poor hygienic practices in handling and preparation of the fish for consumption, and consumption of the fish while raw or undercooked. The pathogens of concern are not expected to bioaccumulate in fish, or to be present in fish tissues that would be consumed, or to survive cooking of the fish. As a worst case example, contamination of the fish followed by raw consumption would not be expected to result in the ingestion of a greater number of pathogens than would be present in the tested scenario of swimming in the discharge mixing zone. This scenario included the ingestion of 100 mL of water from the mixing zone, as opposed to the sequence of events required to eat a smaller quantity of contaminated and uncooked fish. Consequently, the pathogen risk from fish consumption is regarded as the same as that scenario as a worst case, and is likely to be substantially less. Similar pathogen risks could be expected from the consumption of shellfish impacted by the discharge of treated wastewater, with the exception of virus risks. As summarised by Hassard et al (2017), shellfish bioaccumulate some viruses, including noroviruses, and processes such as post-harvest depuration are inefficient at removing viral pathogens. Noroviruses can be inactivated by cooking, however some shellfish such as oysters are often consumed raw. Oyster tissues have been demonstrated to bioaccumulate some viruses to concentrations approximately 100 times greater than the surrounding waters, suggesting the potential for the rapid bioaccumulation of noroviruses. Oysters have also demonstrated retention of norovirus for up to four weeks after exposure during a pollution event, even when the virus is no longer present in surrounding waters. As noted, oysters and other shellfish are not known to be commercially harvested in the Warrnambool area. From discussion with Wannon Water, oysters have not been mentioned in previous CEE reporting of this area, there are no personal anecdotes of oysters being present, and if present it is assumed that they would have been observed in the intertidal zone. It is possible that they could be present on rocks in the vicinity of the STP discharge, and are harvested and eaten by people able to reach this location. It is difficult to quantify the risks associated with this potential activity, however a hypothetical worst case example could include the consumption of 50-100 g of raw oysters harvested from within the mixing zone. Such a scenario could be most simply described as presenting similar pathogen risks to the ingestion of 100 mL seawater from the mixing zone, but with norovirus risks increased up to 100-fold. As described in CEE (2018), signage is maintained at the boundary of the mixing zone and near the outfall to advise the public against contact recreation within the mixing zone. 5 Comparative pathogen concentrations in recreational waters In order to provide context for the microbial risks assessed by this QMRA, there is value in comparing the assumed concentrations of pathogens in the areas described with literature values for concentrations of the same organisms. Of the reference pathogens, Cryptosporidium concentrations are the best characterised in recreational waters due to the availability of commercially available analytical methods. A small number of published studies examining Cryptosporidium concentrations in recreational waters have been examined here for comparison purposes. Whilst most of these studies are concentrations in freshwater lakes and
You can also read