Freshwater contaminant limit assessment of the regions - A Technical Paper Motu Economic and Public Policy Research - Motu ...
←
→
Page content transcription
If your browser does not render page correctly, please read the page content below
Freshwater
contaminant limit
assessment of the
regions

Suzie Greenhalgh and Leah Murphy
A Technical Paper
Motu Economic and Public Policy
Research
May 2017

Freshwater contaminant limit assessment of the regions

Document information
Author contact details
Suzie Greenhalgh
Landcare Research
GreenhalghS@landcareresearch.co.nz

Leah Murphy
Motu Economic and Public Policy Research
leahgmurphy@gmail.com

Disclaimer
This technical paper is issued alongside Motu Working Paper 17-10: “Modelling the potential
impact of New Zealand’s freshwater reforms on land-based Greenhouse Gas emissions”. All
errors, omissions, and opinions expressed are the responsibility of the authors.

Motu Economic and Public Policy Research
PO Box 24390      info@motu.org.nz        +64 4 9394250
Wellington        www.motu.org.nz
New Zealand

© 2017 Motu Economic and Public Policy Research Trust and the authors. Short extracts, not exceeding
two paragraphs, may be quoted provided clear attribution is given. Motu Working Papers are research
materials circulated by their authors for purposes of information and discussion. They have not
necessarily undergone formal peer review or editorial treatment. ISSN 1176-2667 (Print), ISSN 1177-
9047 (Online).

                                                                                                           ii
Freshwater contaminant limit assessment of the regions

Table of Contents
1   Introduction                                                                                                1

2   Methodology                                                                                                 1

3   Northland                                                                                                   2
    3.1    Freshwater Management Units                                                                          2
    3.2    The situation with N, P, sediment, E. coli contamination in Northland and priority catchments        3
    3.3    Freshwater quality limits                                                                            3

4   Auckland                                                                                                    4
    4.1    Freshwater Water Management Units                                                                    4
    4.2    Nitrogen, phosphorous, sediment, and E. coli contamination                                           4
    4.3    Mandatory requirements                                                                               4
    4.4    Freshwater quality limits                                                                            4

5   Waikato                                                                                                     6
    5.1    Nitrogen, phosphorous, sediment and E. coli contamination                                            6
    5.2    Mandatory requirements                                                                               6

6   Bay of Plenty                                                                                               7
    6.1    Freshwater Water Management Units                                                                    7
    6.2    Nitrogen, phosphorous, sediment and E. coli contamination                                            7
    6.3    Mandatory requirements                                                                               8
    6.4    Freshwater quality limits                                                                            8

7   Gisborne                                                                                                    9
    7.1    Freshwater Water Management Units                                                                    9
    7.2    Nitrogen, phosphorous, sediment, and E. coli contamination                                          10
    7.3    Mandatory requirements                                                                              10
    7.4    Freshwater quality limits in Gisborne                                                               11

8   Taranaki                                                                                                  14
    8.1    Freshwater Water Management Units                                                                   14
    8.2    Nitrogen, phosphorous, sediment, and E. coli contamination                                          15
    8.3    Mandatory requirements                                                                              15
    8.4    Other practices and non-regulatory policies of note that reduce contaminant loads                   15
    8.5    Freshwater quality limits in Taranaki                                                               15

9   Manawatu–Wanganui (Horizons)                                                                              17
    9.1    Freshwater Water Management Units                                                                   17
    9.2    Nitrogen, phosphorous, sediment, and E. coli contamination                                          18
    9.3    Mandatory requirements                                                                              18
    9.4    Other practices and non-regulatory policies of note that reduce contaminant loads                   18
    9.5    Freshwater quality limits                                                                           19

                                                                                                                iii
Freshwater contaminant limit assessment of the regions

10   Hawke’s Bay                                                                                                19
     10.1     Freshwater Water Management Units                                                                  19
     10.2     Nitrogen, phosphorous, sediment and E. coli contamination                                          19
     10.3     Mandatory requirements                                                                             20
     10.4     Freshwater quality limits                                                                          20

11   Greater Wellington                                                                                         22
     11.1     Freshwater Water Management Units                                                                  22
     11.2     Nitrogen, phosphorous, sediment, and E. coli contamination                                         23
     11.3     Mandatory requirements                                                                             23
     11.4     Freshwater quality limits                                                                          24

12   Marlborough                                                                                                26
     12.1     Freshwater Water Management Units                                                                  26
     12.2     Nitrogen, phosphorous, sediment and E. coli contamination                                          26
     12.3     Mandatory requirements                                                                             26
     12.4     Freshwater quality limits in Marlborough                                                           27

13   Nelson                                                                                                     27
     13.1     Freshwater Water Management Units                                                                  27
     13.2     Nitrogen, phosphorous, sediment, and E. coli contamination for Nelson City and priority catchments 27
     13.3     Mandatory requirements                                                                             29

14   Tasman District                                                                                            32
     14.1     Freshwater Water Management Units                                                                  32
     14.2     Nitrogen, phosphorous, sediment, and E. coli contamination                                         32
     14.3     Mandatory requirements                                                                             32
     14.4     Freshwater quality limits                                                                          32

15   Canterbury                                                                                                 33
     15.1     Freshwater Management Zones                                                                        33
     15.2     Nitrogen, phosphorous, sediment, and E. coli contamination                                         34
     15.3     Mandatory requirements                                                                             34
     15.4     Other practices and non-regulatory policies of note that reduce contaminant loads                  34
     15.5     Freshwater Quality Limits                                                                          35

16   Otago                                                                                                        1
     16.1     Freshwater Water Management Units                                                                   1
     16.2     Nitrogen, phosphorous, sediment, and E. coli contamination                                          2
     16.3     Mandatory requirements                                                                              2
     16.4     Other practices and non-regulatory policies of note that reduce contaminant loads                   3
     16.5     Freshwater quality limits                                                                           4

17   West Coast                                                                                                   6
     17.1     Freshwater Water Management Units                                                                   6

                                                                                                                  iv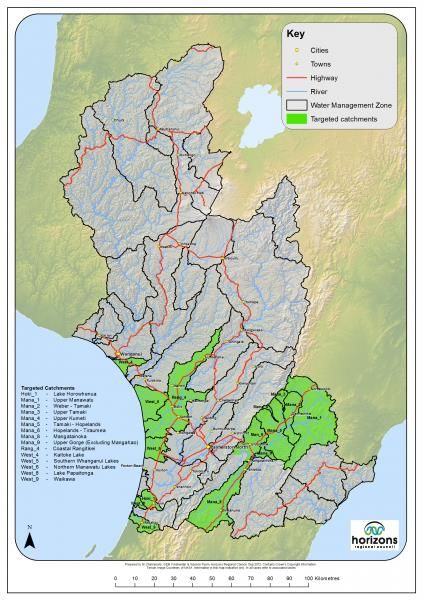
Freshwater contaminant limit assessment of the regions

     17.2    Nitrogen, phosphorous, sediment, and E. coli contamination                                          6
     17.3    Mandatory requirements                                                                              6
     17.4    Other practices and non-regulatory policies of note that reduce contaminant loads                   7
     17.5    Freshwater quality limits                                                                           8

18   Southland                                                                                                   8
     18.1    Freshwater Water Management Units                                                                   8
     18.2    Nitrogen, phosphorous, sediment, and E. coli contamination                                          8
     18.3    Mandatory requirements and other practices and policies of note that reduce contaminant loads       9
     18.4    Freshwater quality limits                                                                           9

19   Summary                                                                                                   10

References                                                                                                     13

Appendix: Approach to determining the limits for the catchments in each region                                 15

                                                                                                                  v
Freshwater contaminant limit assessment of the regions
Table of Figures
Figure 1: Manawatu-Wanganui water management zones and targeted catchments. 17
Figure 2: Greater Wellington Whaitua catchments. 23
Figure 3: Otago FMUs. 1
Figure 4: Freshwater management areas used for the purposes of this analysis 12
Table 1: Potential limit ranges for Auckland Council (% change from baseline), by water management area 5
Table 2: Agreed limit or potential limit range in Bay of Plenty Region (% change from baseline), by water management
zone 9
Table 3: Key activities as a result of farm plans in Gisborne District 11
Table 4: E. coli limits for Gisborne District 12
Table 5: Sediment limits for Gisborne District 13
Table 6: Phosphorus limits for Gisborne District 13
Table 7: Estimated limit ranges for Taranaki Region (% change from baseline) 16
Table 8: Horizons One Plan maximum cumulative nitrogen leaching losses (kgN/ha/yr) by Land Use Capability (LUC)
class 19
Table 9: Potential limit ranges for catchments in Hawkes Bay (% change from baseline) 21
Table 10: Tukituki catchment nitrogen leaching rate by Land Use Capability (LUC) class (to be calculated on a whole of
farm property or whole of farming enterprise basis) 22
Table 11: Potential limit ranges in the Greater Wellington Region (% change from baseline), by catchment 25
Table 12: Potential limit ranges in Nelson City (% change from baseline), by FMU 31
Table 13: Potential limit ranges for Tasman District (% change from baseline), by water management area 33
Table 14: Limits for water management zones in Canterbury (% change from baseline) 36
Table 15: Estimated limits based on Schedule 15 for the Otago Region (% from baseline) between 2015 and 2025 5
Table 16: Summary for the range of potential or actual regional level limits (% change from baseline) 11
vi1 Introduction
This report provides freshwater contaminant limit assessments for the regions for phosphorus,
nitrogen, E. coli, and sediment. The assessments will be used for a national modelling exercise
using New Zealand Forestry and Agricultural Regional Model (NZFARM) to help estimate impact
of the implementation of the National Policy Statement for Freshwater Management (NPS-FM)
2014 on New Zealand’s greenhouse gas emissions.
Information about freshwater management areas (including, where available freshwater
management units (FMUs)), priority catchments, relevant mandatory requirements, other
practices, and non-regulatory policies that reduce contaminant loads, and limit setting in the
regions are covered in the report. This information is used to estimate high and low scenarios
for the expected change in levels of phosphorus (P), nitrogen (N), E. coli, and sediment in the
freshwater of each region between 2015 and a future date such as 2030.
The report also includes information on baseline loads created by NIWA from the CLUES
model.
This report fulfils Milestone 5, Limit Assessment, of the study entitled: Climate Change Co-
benefits of the Freshwater Reforms. This report was revised in June 2016 but did not include
any new information on FMU delineation or limits that may have been finalised between March
and June 2016. This is primarily due to the modelling analysis in the final report being based on
the available information in March 2016.
2 Methodology
Motu Public Policy and Research (Motu), Landcare Research and AgResearch worked together
to gather this information from Regional Councils. AgResearch approached the six councils they
were already liaising with for its deliverables under a complementary project. Motu and
Landcare Research collected the data for the remaining councils. Information was collected
through in-person meetings, email and phone calls. The information we attempted to collect
from each council included:
1. A map of regional catchments and/or agreed or proposed freshwater management areas.
While all Regional and Unitary Councils will eventually have NPS-FM FMUs delineated for
their regions, not all councils have completed that process. Therefore, the map delineates
a mix of management zones, FMUs, priority catchments and other types of catchment
delineations as noted by the individual councils.
2. Any relevant water policy documentation/plans.
1Freshwater contaminant limit assessment of the regions
3. Any concerns about contamination from nitrogen, phosphorous, sediment and E. coli in
the region.
4. A list of priority catchments/FMUs where these contaminants are being actively managed
5. Specific reduction targets or limits that have been proposed or agreed for each water
management zone. In this report, we will use the limits and target terminology used in
each region. Where this is unclear or where we have manipulated the data for use in our
modelling, we will use the term ‘limits’ to refer to where existing water quality is better or
worse than the desired state. We acknowledge that many regions use the term ‘target’ as
the limit they want to reach where water quality is worse than the desired state.
6. In the event that water quality limits or targets are not yet established, a range for the
potential limits/targets for each water management zone (e.g. 5–10% decrease in
nitrogen, no change in phosphorous, 20% increase in E. coli, etc.) was specified. This
range for the potential limits is based on a percentage change in the estimated current
load (or baseline). This percentage change is either a reduction in contaminant loads or
no change in load. The current load is estimated based on 2012 land use. This is the most
current, national land-use map available. This map had previously been generated for
other national level economic analyses (Daigneault et al. in review).
7. The timeframe to achieve any limit for each water management zone.
8. Mandatory practices that landowners must undertake in any region (e.g. stock
exclusion1) as part of any regional plan or proposed regional plan.
9. Additional practices landowners are currently undertaking to reduce the different
contaminant loads in each water management zone (e.g. farm plans for erosion control).
More details on the questions asked to each regional council are provided in the
Appendix.
3 Northland
3.1 Freshwater Management Units
The FMUs for Northland are being finalised in March 2016. For the purposes of managing river
water quality, Northland Regional Council (NRC) have divided rivers into lowland rivers and hill
country rivers based on catchment slope, which appears to be the best explanatory variable for
most but not all water quality parameters. With regard to managing river water quantity, NRC
has divided the region’s rivers into four classes based on river size, climate, and proximity to
1 Note: stock exclusion is being proposed as a national requirement under the 2016 Next steps for fresh water
consultation document (http://www.mfe.govt.nz/fresh-water/reform-programme/freshwater-reforms-2016P
2coast: coastal streams, small rivers, large rivers, and warm extremely wet rivers. For lakes, NRC
has divided natural lakes into four classes: shallow (10 m) perched,
shallow window, deep window. NRC has also divided aquifers into four classes: shallow coastal,
deep coastal, other mapped, and unmapped. In addition, NRC has specified that there will be
catchment (i.e. water body) specific FMU’s across all water body types. They define catchment-
specific FMU’s as catchments where good information is available on current state and resource
use capacity with respect to local values. The council has stated that lake and aquifer FMUs will
correspond with natural catchment boundaries, but the river FMUs are based on other
variables.
3.2 The situation with N, P, sediment, E. coli contamination in Northland
and priority catchments
The main contaminants of concern in Northland’s rivers are sediment and faecal microbes (e.g.
E. coli). Nutrients are more of an issue in NRC’s dune lakes.
NRC has identified six priority catchments (Whāngārei Harbour, Mangere, Waitangi,
Poutō Peninsula, Doubtless Bay, and Ngunguru). All are considered relatively small catchments
and were selected for various reasons, however NRC has indicated that the Whāngārei Harbour
and Poutō Peninsula are the only areas with significant water quality or quantity related issues.
Catchment groups in Mangere, Waitangi, Doubtless Bay, Whāngārei, and Poutō are currently
working on catchment plans (with voluntary and regulatory elements) with a goal to have these
draft catchment plans ready by mid-2016. The Ngunguru catchment group started in November
2015 and is focused on developing an erosion and sediment management plan that is due for
completion by November 2018.
3.3 Freshwater quality limits
NRC intends to set concentration limits for the compulsory attributes in the NPS-FM. They have
no intention in the near future to set contaminant load or property scale loss limits, given the
costs and practicalities (and the lack of intervention logic) to do so.
The council anticipates that the key policies targeting improvements in river and lake
water quality are compulsory stock exclusion, slightly tighter controls on farm dairy effluent
discharges and land disturbance activities, and outreach and support for good management
practices (GMPs). Stock exclusion requirements are likely to be similar to the recent
recommendations of the Land and Water Forum. NRC does not anticipate that their existing or
new water quality controls will cause any substantial land use change. The latest Regional
Water and Soil and Coastal plans provide details on current controls that have already been
implemented in the region.
3Freshwater contaminant limit assessment of the regions
4 Auckland
4.1 Freshwater Water Management Units
Auckland Council has defined nine water management areas. These include: Manukau Harbour
(includes Mangere, Drury, Pukekohe area), Wairoa (includes Hunua Ranges), West Coast,
Waitemata, Greater Tamaki, Hibiscus coast, Maharangi, Northeast coast, and the South Kaipara
Harbour. FMUs within each water management area have not yet been defined.
4.2 Nitrogen, phosphorous, sediment, and E. coli contamination
Nitrogen is believed to be an issue in the Manukau Harbour, and it is likely that a substantial
reduction will be required to meet the NPS-FM attribute bottom lines. Sediment is the most
pressing issue in the Kaipara Harbour, as is E. coli (which is likely to be dealt with through
addressing the sediment loss). Phosphorous is generally not believed to be a current issue in the
region.
4.3 Mandatory requirements
Auckland Council has not specified any mandatory requirements for landowners in the region
beyond what is already included in the Regional Plan. They are exploring economically feasible
options to reduce nitrogen in the Manukau Harbour, which could be partially achieved through
best management practices.
Other practices and non-regulatory policies of note that reduce contaminant loads
The council did not specify any other policies of note that could help reduce contaminant
loads.
4.4 Freshwater quality limits
Potential limits for each water management area in the Auckland Region were developed in
consultation AC staff involved with NPS-FM implementation (Table 1). This limit range is
expressed as a percentage change from current loads. Note that these limits are only for changes
in agricultural and forestry sector contaminants as urban pollutants were not discussed. The
limits are also not the definitive limits for the region and are subject to change based on
additional science, council investigations and outcomes of limit setting processes.
4Table 1: Potential limit ranges for Auckland Council (% change from baseline), by water management
area
Water Nitro Phosph Sedi
E. coli Comments/notes
Mmgt Area gen orous ment
Some mangrove clearance in the
Puhiri & Mangere areas; E.coli is
naturally high; lots of houses
going in (likely to reduce
model
sediment and N); N is the big
best
problem (likely need large
Manukau practice, No
No change No change reduction to meet National
Harbour 20, 30, 40, change
Objectives Framework) but not
50 %
sure how far they can actually
decrease
reduce or is economically
feasible to reduce (fertiliser is
the issue); best thing to do is to
model best practice
Forestry operations are big in
area; one issue is going to be that
the new Forestry National
0%, 10% No
Wairoa No change No change Environmental Standard is
increase change
weaker than Auckland Council
rules so could be an increase in
sediment as a result
No
West Coast No change No change No change Mostly forestry
change
No
Waitemata No change No change No change Urban
change
Greater No
No change No change No change Urban
Tamaki change
Hibiscus No Mostly urban with a little
No change No change No change
coast change forestry inland
Significant investment in this
catchment already on improving
No
Maharangi No change No change No change ag practices but don't know if
change
they have really made a
difference
Mostly lifestyle blocks with some
Northeast No
No change No change No change sheep and beef, maybe some
coast change
wetlands going in
Sediment is the big issue, mostly
related to sheep and beef. E. coli
South
10-20% No is natural (some sheep and beef
Kaipara No change No change
decrease change E.coli but likely this will be dealt
Harbour
with when address sediment
loss)
5Freshwater contaminant limit assessment of the regions
5 Waikato
The Waikato Regional Council has only established limits and a policy to achieve these limits for
the Lake Taupo catchment. It is still undergoing the process of defining limits for the other
catchments in the region. The Healthy Rivers Wai Ora process will be defining limits for the
Waikato/Waipa catchments in May 2016. There are eight FMUs for these catchments (Healthy
Rivers 2016). As a result, this section only discusses the limits for the Lake Taupo catchment.
Freshwater Water Management Units
Lake Taupo is New Zealand’s largest lake and has very high water quality. The lake and its
catchment are within the rohe of Ngati Tuwharetoa, who own much of the land in the
catchment, including the bed of the lake. Variation 5 to the Waikato Regional Plan is focused on
protecting the existing high water clarity in Lake Taupo. It became operative in July 2011.
5.1 Nitrogen, phosphorous, sediment and E. coli contamination
The contaminant discharge of concern in Lake Taupo is nitrogen. Sources of nitrogen that can be
reduced through management are relatively limited, and primarily include human wastewater
and pastoral farming. Pastoral farming represents around 40 percent of the total load of
nitrogen to the lake, and 93 percent of the manageable load.
5.2 Mandatory requirements
Around Lake Taupo, farmers are required to prepare a Nitrogen Management Plan that
describes how the farm will be managed over the farming year within the nitrogen limit for the
property or properties, including livestock levels, nutrient applications, and feed regimes.
Freshwater quality limits in the Waikato
In 2011, Waikato Regional Plan Variation 5 – Lake Taupo Catchment became operative,
and was inserted as Chapter 3.10 of the Waikato Regional Plan.2 In the Taupo cap-and-trade
scheme, the cap restricts nitrogen use through the resource consenting process. A resource
consent, applied for by a farmer, sets the property-level nitrogen limit expressed both as a
nitrogen discharge allowance (NDA – kg/ha/yr) and total annual discharge allowance (TAND –
kg/yr). The nitrogen limit is a right to discharge diffuse nitrogen emissions, and is held by
farmers to enable them to continue farming activities. Nitrogen can be traded permanently or
through a temporary lease agreement. Trading involves formal (via the resource consent
processes) adjustments to the resource consents held by the purchaser and the seller. All
2 Information about the Lake Taupo nitrogen cap and trade scheme has been adapted from: Waikato Regional
Council, Case Study I: Lake Taupo catchment property-level nitrogen discharge limits, 2014
6resource consents have a common expiry date of 2036, and are subject to changes that may
occur as a result of reviews of the nitrogen removal target and its method of achievement.
A 20% reduction of nitrogen from municipal sewage schemes and pastoral land is
signalled in objectives and policies of the Waikato Regional Plan. This will be achieved through
Taupo District Council’s ongoing upgrades to sewage treatment, and public funded buy-back of
nitrogen through a specially formed charitable trust (Lake Taupo Protection Trust) respectively.
As of early 2014:
• All farms in the catchment have been benchmarked, nitrogen limits have been set, and farms
are now under a resource consenting system.
• The 20% reduction target has been met by the Lake Taupo Protection Trust (the Trust) – on
budget and within the time limit specified.
• The policy is on-track to achieve the environmental target of 2001 levels of water quality and
clarity by 2080.
• The market appears to be operating efficiently (Barnes & Young 2013; Duhon et al. 2015;
Kerr et al. 2015). Private trades still occurred during the time the Trust was dominant in
the market, and are expected to continue to do so.
• The monitoring regime has been established, using desk top audits of farmer-supplied
financial information, as a first filter of compliance, and a risk-based approach to the
frequency of audits and need for on farm monitoring inspections.
6 Bay of Plenty
6.1 Freshwater Water Management Units
The Bay of Plenty (BOP) Regional Council has specified nine water management zones for the
region. These include: Kaituna, Maketu and Pongakawa; Ohiwa Harbour and Waiotahi; Rotorua
Lakes; Tarawera; Tauranga Harbour; East Coast; Waioeka and Otara; Whakatane and Waimana;
and Rangitaiki.
6.2 Nitrogen, phosphorous, sediment and E. coli contamination
Waterbodies in the BOP are mostly affected by nitrogen and phosphorous. The Rotorua Lakes
area is particularly affected by nutrient discharges from diffuse sources, although there are also
some issues with sediment.
7Freshwater contaminant limit assessment of the regions
6.3 Mandatory requirements
Rules of the Rotorua Te Arawa Lakes Programme are based on the Lake Rotorua groundwater
catchment. The goal is to reduce the nitrogen load to Lake Rotorua by 320 tonnes to achieve an
annual nitrogen load to the lake of 435 tonnes by 2032 (from current load of 755 t N/y), with 70
percent of this load reduction to be reached by 2022.
The strategy to achieve this reduction target is to remove 50 t N/y through “engineering
solutions” (to remove geothermal sources of N) and 30 t N/ha through gorse removal. A further
96 t N/y from dairy and 44 t N/y from drystock will be removed through Nitrogen Discharge
Allowances (NDAs), and the remaining 100 t N/y through an incentives scheme to further
incentivise nitrogen reduction actions.
Part of an individual farm property or a farming enterprise’s nitrogen management plan
shall identify the risks of sediment and phosphorous loss and best practices to reduce those
losses shall be implemented.
Conditions set on forestry enterprises are that there is no grazing on the land, no transfer
of NDAs, and the period between harvesting and replanting is less than 2 years.
6.4 Freshwater quality limits
The BOPRC has only set limits for the Rotorua lakes (Table 2). The nitrogen limit is to be met
through reductions from the land-based sectors (such as dairy and drystock), engineering
solutions, and gorse removal. Approximately 53 percent of the total nitrogen reduction target is
expected to come directly from changes to dairy and drystock farming (a 27% reduction from
their baseline N loads). Phosphorus limits are not specifically set, but are typically based on a
lake’s target trophic level index.
The council is currently rolling out the Water Project, which will be setting the limits for
the remaining water management zones.
8Table 2: Agreed limit or potential limit range in Bay of Plenty Region (% change from baseline), by water
management zone
Water Management Nitroge Phosphoro Sedime
Zone n us nt E. coli Notes/Comments
Kaituna, Maketu and
n/a n/a n/a n/a n/a
Pongakawa
Ohiwa Harbour and
n/a n/a n/a n/a n/a
Waiotahi
42% co-benefit
No No 27% N decrease from
Rotorua Lakes decreas of N
change change drystock and dairy
e decrease
Tarawera n/a n/a n/a n/a n/a
Tauranga Harbour n/a n/a n/a n/a n/a
East Coast n/a n/a n/a n/a n/a
Waioeka and Otara n/a n/a n/a n/a n/a
Whakatane and
n/a n/a n/a n/a n/a
Waimana
Rangitaiki n/a n/a n/a n/a n/a
n/a indicates there are no limits in place for these water management zones
7 Gisborne
7.1 Freshwater Water Management Units
The proposed Gisborne Regional Freshwater Plan, published in October 2015, has only
established FMUs in the Waipaoa Catchment Plan.3 There are three FMUs proposed for this
catchment: Waipaoa Hill Country; Gisborne Urban; and Poverty Bay Flats. The largest FMU,
Waipaoa Hill Country, is largely rural and is rolling to steep hill country composed mainly of soft
sedimentary materials. Land use is predominantly pastoral grassland with scattered blocks of
exotic forestry in the upper catchment areas. Farming is a major land use activity. Hill Country
water bodies are also significant for their ecosystem health and natural character. Water quality
across this management unit is generally good although some localised water quality issues
exist and relate to specific water bodies.
Gisborne is located near the convergence of three different rivers. With the majority of the
region’s population living and working in the urban environment, the centrality of the city’s
waterways and people’s exposure to them make water quality a critical issue. The two
prominent freshwater bodies in the Gisborne Urban unit are the Taruheru River and the
3 http://consult-gdc.objective.com/portal/plans/pfwp15?pointId=s1442642545186#section-s1442642545186
9Freshwater contaminant limit assessment of the regions
Waikanae Stream. These waterways are identified as having important in-stream and indirect
amenity values including swimming, boating, and fishing. The establishment of an Urban FMU
provides a spatial context for dealing with urban challenges, such as the high proportion of hard
surfacing and the stormwater network.
The Poverty Bay Flats cover over 20 000 hectares of land around the lower Waipaoa River
valley.4 The area receives an annual rainfall of between 650 mm and 1640 mm and often
experiences drought conditions. The management unit is used intensively for arable farming,
market gardening, horticulture and viticulture. Groundwater is important to irrigation on the
Poverty Bay Flats as the Waipaoa River is often subject to low flows during summer months as
well as high sediment loading following storm events.
7.2 Nitrogen, phosphorous, sediment, and E. coli contamination
The overall purpose of the Proposed Gisborne Freshwater Plan is to guide the sustainable
management of the region's rivers, streams, lakes, wetlands, and groundwater. E. coli and
sediment have been prioritised in the region.5 Improving water quality in this region is strongly
tied to reducing erosion and reducing opportunities for faecal contamination of waterways.
River water quality is generally good in that it does not indicate high levels of nutrients, and
biological indicators are generally good.
Reducing erosion rates and the effects erosion has on waterways has long been a key
issue for Gisborne.6 Soft sedimentary rocks dominate the region. Council’s soil conservation
activities seek to mitigate or prevent soil erosion caused by historical bush clearance for
pastoral farming as well as more recent tree removal and earthworks.
7.3 Mandatory requirements
The Sustainable Hill Country Project established the requirement for tree planting or
maintaining tree cover on the most erosion-prone land. Works are to be completed and effective
tree cover established by 2021. By mid-2012, 61% of properties and 90% of the most erosion-
prone land had Works Plans completed or being progressed. The Combined Regional Land and
District Plan requires that the most erosion-prone be treated with effective tree planting or
reserve fencing.
There are existing rules for riparian areas that control earthworks, vegetation clearance
and structures. There is no regulation of stock access to waterways, and current rules allow
4 Adapted from the proposed Gisborne Regional Freshwater Management Plan
5 The summary of the situation in the region regarding contaminants has been adapted from the proposed Gisborne
Regional Freshwater Management Plan
6 Adapted from: AgResearch, Climate mitigation co-benefits arising from the Freshwater Reforms: Summary of policy
and agricultural landscape: Report prepared for MPI (Milestone Report 1), 2015
10stock entry to waterways. In comparison with other regions, the intensity of most farming
operations would not warrant a blanket stock exclusion rule in this region.
There is also a requirement for intensive land users to have farm environmental plans.7
The main activities that are expected to result from the farm plans in each FMU are listed in the
table below.
Table 3: Key activities as a result of farm plans in Gisborne District
FMU Main activities in farm environmental plans that affect nitrogen,
phosphorous, E. coli, and sediment
Waipaoa Hill Install stock crossings and stock exclusion for intensively stocked
Country locations
Move or bund and treat runoff from woolsheds
Willow and native riparian planting
Slope erosion planting of poplars
Move silage pits/offal pits to better locations
Install water reticulation systems for stock water
Gisborne Urban n/a
Poverty Bay Flats Install stock crossings and stock exclusion for intensively stocked
locations
Willow and native riparian planting
Constructed wetlands
Various horticultural practices (earthworks, harvesting methods,
fertiliser use) changes in accordance with Code of Practice for Vegetable
Growing
Growing green crops over winter rather than leaving fallow, etc., practices
for maize
7.4 Freshwater quality limits in Gisborne
The Gisborne District Council has proposed freshwater concentration limits for the Waipaoa
Catchment and is setting these limits through the development of catchment management plans.
The plans are set out in the proposed Gisborne Regional Freshwater Plan. The council wishes to
balance the limit-setting process with the NPS-FM requirement to maintain or improve the
overall quality of water within the region. Therefore the council’s approach to maintaining
water quality through the National Objectives Framework is to maintain the current state of the
attribute being measured. Improving water quality is proposed where an attribute is below a
national bottom line or where the current state does not provide for the priority values. The
freshwater targets that have been defined describe the specific changes the councilis aiming to
achieve and relate to the freshwater objectives that have been defined for the catchment. These
7 Information provided by Lois Easton by email in February 2016
11Freshwater contaminant limit assessment of the regions
targets aim to maintain or improve nitrate, ammonia, dissolved oxygen, temperature, pH,
sediment, dissolved reactive phosphorus (DRP), and E. coli in rivers. They are not yet linked to
farming activities. Specific Freshwater Targets have been proposed for the three Waipaoa
catchment FMUs. Most of the targets are aimed at increasing dissolved oxygen levels, decreasing
water temperature, and reducing E. coli levels and sediment loads. There are also targets to
reduce N and DRP concentrations in the Poverty Bay Flats FMU.
The proposed Gisborne Regional Freshwater Plan outlines the current state in a number
of sites in each FMU. The council intends to maintain the water quality of those that do not need
targets because they already meet acceptable water quality levels. When asked about the
change in expected between 2015 and 2030 for E. coli, the council provided information in
Table 4.
Table 4: E. coli limits for Gisborne District
FMU Proposed Gisborne Other comments Estimated change in
Regional Freshwater about land use, E. coli between 2015
plan – Freshwater mandatory or other and 2030 (example
targets (Gisborne activities to improve numbers only)
District Council, 2015). E. coli
Wharekopae River (in Reduce median E.coli Farm Environment 3% decrease on
Waipaoa Hill Country levels to 260 Plans, fencing median, 70%
FMU) cfus/100 ml or below subsidies decrease on 95th
and 95th percentiles to percentiles
1000 cfus/100 ml or
below by 2030
Waipaoa Hill Country n/a Farm Environment Maintain
excluding Plans for intensive
Wharekopae River land uses
Waikanae Stream at Reduce median E.coli Stormwater quality 34% decrease
Stanley Road (in levels to 540 project – urban
Gisborne Urban FMU) cfus/100 ml or below sources
for Waikanae Stream at
Stanley Road
Gisborne Urban Reduce 95th percentiles Stormwater quality 95% decrease
excluding Waikanae for E. coli levels to 1000 project – urban
Stream at Stanley cfus/100 ml or below by sources
Road 2030 for all water
bodies
When asked about the change in expected between 2015 and 2030 for sediment, the
council provided the sedimentation information outlined in Table 5.
12Table 5: Sediment limits for Gisborne District
FMU Proposed Gisborne Other comments Estimated change in
Regional Freshwater about land use, sediment between
plan – Freshwater mandatory or other 2015 and 2030
targets (Gisborne activities to improve (example numbers
District Council Sediment only)
2015)
Waipaoa Hill Country targetFreshwater contaminant limit assessment of the regions
10% improvement in median bacteria levels could be set. For nitrate and phosphorus the
council is likely to seek to maintain the current states in all locations except the Motu River
catchment. In the Motu catchment, the community is likely to expect improvements in the order
of 30% decrease in phosphorous by 2035 and perhaps 10% reduction in nitrogen.
8 Taranaki
8.1 Freshwater Water Management Units
The Taranaki does not have finalised Freshwater Management Units. However, in April 2015,
the council released a draft Freshwater and Land Management Plan for Taranaki10 that
proposed four FMU – A, B C, and D. Each FMU has similar physical and hydrological
characteristics as well as land use and community values.11 Each FMU is briefly described
below.12
8.1.1 FMU A – outstanding freshwater bodies
This FMU includes the Hangatahua (Stony) River, the Maketawa catchment immediately
upstream of but excluding the Ngatoro Stream catchment and Lake Rotokare Scenic Reserve.
These freshwater bodies mostly protected, have valuable, or increasingly valuable, habitat for
indigenous flora and fauna and many have high cultural significance.
8.1.2 FMU B – waterways on Mount Taranaki and the ring plain
The main land use in this FMU is dairying. It also includes New Plymouth and other urban areas.
High consumption and waste discharge are common in these smaller waterways.
8.1.3 FMU C – waterways on the northern and southern coastal terraces
There is intensive farming and irrigation in this FMU. In the southern coastal terraces there are
mostly short, spring-fed streams that discharge as waterfalls into the ocean. In the northers
coastal terraces there are longer rivers that are subject to large tidal ranges and naturally high
sediment loads.
8.1.4 FMU D – waterways in the eastern hill country
A large area of this FMU is in natural land cover, there is also some drystock farming and
plantation forestry. The rivers tend to carry a high sediment load as a result of the steep, easily
erodible geology.
10 http://www.trc.govt.nz/freshwater-and-land-management/
11 http://www.trc.govt.nz/assets/taranaki/environment/water/DraftPlan2015/DraftPlan-April2015W.pdf
12 Information adopted from
http://www.trc.govt.nz/assets/taranaki/environment/water/DraftPlan2015/1FMU.pdf
148.2 Nitrogen, phosphorous, sediment, and E. coli contamination13
While nitrogen, phosphorous, sediment, and E. coli all have an impact on water quality in
Taranaki, phosphorous is the contaminant of most concern, particularly where there is
intensive farming in the ring plain and the coastal terraces.
State of the Environment monitoring confirms improvement in the management of the
region’s waterways over the past 40 years. Over the past 18 years the ecological health has
improved at a number of sites, and at least 14 sites significant improvements have occurred
since 2007.
8.3 Mandatory requirements
The draft Freshwater and Land Management Plan for Taranaki proposes to require riparian
fencing and planting on intensively farmed properties (over 20 hectares) on the ring plain and
coastal terraces by 2020. Those who have not done so by mid-2020 will need a resource consent
requiring stock exclusion from waterways and completion of riparian planting. Policies and
rules are also proposed to require animal effluent to be discharged to land as a general rule.
8.4 Other practices and non-regulatory policies of note that reduce
contaminant loads
The council has two key non-regulatory programmes. First is the Taranaki Riparian
Management Programme in the ring plain and coastal terraces. It is the largest environmental
enhancement planting scheme on privately owned land in New Zealand. It has resulted in 99.5
percent of dairy farms with riparian plans and 14 000 kilometres of streambank is covered by
fencing and planting plans, and of these, 80% of streambanks are fenced, and 65% of
streambanks recommended for vegetation are protected by both established and more recent
plantings. Second, in the hill country, the council is working with farmers to promote
sustainable land management practices, with a focus on soil conservation and sedimentation on
erosion prone land. In addition, there is an industry-led initiative to promote nutrient
budgeting.
8.5 Freshwater quality limits in Taranaki
Water quality limits have not been formally set in Taranaki. The Regional Fresh Water Plan for
Taranaki is currently under review. The draft Freshwater and Land Management Plan proposes
to manage freshwater contamination through a combination of the new discharge policies and
13 Email from Chris Spurdle (Taranaki Regional Council) to Leah Murphy (Motu), 2015
15Freshwater contaminant limit assessment of the regions
rules plus the plan sets out boundaries for the region’s waterways using the National Objectives
Framework.14
The water quality limits listed in Table 7 are council estimates based on their anticipated
water quality trends by 2025. These limits take into account substantial but not complete
implementation of riparian management recommendations and diversion of ponds from
streams to land over the next 10 years. The predictions are also based on State of the
Environment monitoring trends. Findings are extrapolated from the Best Practice Dairy
Catchment Study on the Waiokura15 and applied to other ring plain streams.
Table 7: Estimated limit ranges for Taranaki Region (% change from baseline)
Phospho
FMU Nitrogen Sediment E. coli Comments/notes
rous
Pristine catchments.
Management response aims
Outstanding to maintain/protect
No No No
freshwater No change outstanding natural
change change change
body character and already
excellent to very good water
quality
Intensively farmed
catchments. Management
response aims to maintain
10–30% 20–40% 10–30% 20–40% and enhance already good
Ring plain
decrease decrease decrease decrease water quality through rules
diverting farm effluent to
land and riparian
management
Intensively farmed
Coastal 10–30% 20–40% 10–30% 20–40%
catchments. Comments as
terraces decrease decrease decrease decrease
above.
Extensively farmed
catchments on erosion
prone land. Relatively good
water quality but with
Eastern hill No 5–10% 5–10% No
sedimentation issues.
country change decrease decrease change
Largely non regulatory
responses to avoid erosion
and maintain good water
quality.
14 http://www.trc.govt.nz/assets/taranaki/environment/water/DraftPlan2015/2NOF.pdf
15 http://maxa.maf.govt.nz/sff/about-projects/search/06-029/best-practice-dairy-catchment-study.pdf
169 Manawatu–Wanganui (Horizons)
9.1 Freshwater Water Management Units
The One Plan outlines many water management zones within the Manawatu-Wanganui region
(Figure 1). The council has also listed several water management sub-zones, or priority
catchments, that are most affected by nutrient enrichment and/or bacterial contamination.
Agricultural run-off in these sub-zones is managed using a mixture of persuasion, advice and
rules.16 These water management zones predate the NPS-FM and the council will have to go
through the process of identifying FMUs for the region to meet the requirements of the NPS-FM.
Figure 1: Manawatu-Wanganui water management zones and targeted catchments.
16 http://www.horizons.govt.nz/assets/publications/about-us-publications/one-plan/Chapter-1-Setting-the-
Scene.pdf#pagemode=thumbs
17Freshwater contaminant limit assessment of the regions
9.2 Nitrogen, phosphorous, sediment, and E. coli contamination
Key issues for water quality in the region include: nutrient levels, algae growth and sediment.
Around 75% of this region is classified as hill country and 40% of this land has potential for
moderate to severe erosion. There is a need to mitigate this risk to preserve this productive
land.
The growing concern around the intensification of land use (e.g. dairy) in the region and
the effect of increased nutrient and bacterial runoff on water quality was tackled in Horizons’
regional policy document, the One Plan. For example, in the Upper Manawatu, one of the
priority catchments (Mangatainoka), the amount of nitrogen in the river is 2.5 times the
ecological limit, with 50% coming from dairy occupying less than 25% of the catchment.
Cyanobacteria (often referred to as blue-green-algae) have also been identified as an emerging
issue affecting rivers and lakes in the region.
9.3 Mandatory requirements
The One Plan is an integrated plan which guides the management of natural resources in the
Horizons Region. It weaves together the previous six separate plans and Regional Policy
Statement into one document. The One Plan provides an environmental roadmap directing how
the Council manages the Region’s resources.
The One Plan focuses on intensive farming in priority catchments and aims to manage the
effects those activities have on water quality, including as a major source of nutrients that can
cause increased levels of periphyton. New regulations require intensive farmers to apply for
consent around nutrient management.
The rules apply to various coastal catchments between Otaki and Wanganui and most of
the dairying area of the Tararua, excluding farms in the upper Mangahao and the Tiraumea
catchments, the lower section of the Rangitikei River, and Waikawa and Manakau Rivers (see
Figure 1).
9.4 Other practices and non-regulatory policies of note that reduce
contaminant loads
The Sustainable Land Use Initiative (SLUI), a non-regulatory approach, that is backed up by
regulations covering vegetation clearing and tracking, takes a ‘mountains to the sea’ approach to
prevent accelerated erosion in hill country. The initiative is underpinned by the development of
voluntary management plans. These voluntary plans provide paddock-scale best land
management advice while optimising economic return to the landowner. The first voluntary
management plan was piloted on a farm in the Pohangina Valley in 2005 and the programme is
currently being rolled out in priority areas.
18SLUI is the key instrument being used in the region to reduce sediment and associated
phosphorus losses to waterways.
9.5 Freshwater quality limits
The Horizons Regional Council has set maximum cumulative nitrogen leaching losses for
priority catchments (Table 8)17 in the One Plan. These losses vary by land use capability (LUC)
class and are imposed on the intensive land uses of dairy, horticulture, cropping, and intensive
sheep and beef. The maximum nitrogen leaching losses are intended to become gradually more
stringent over a 20-year timeframe.
There are no mandatory requirements around phosphorous, sediment or E. coli.
Phosphorous and sediment are being managed through SLUI programme.
Table 8: Horizons One Plan maximum cumulative nitrogen leaching losses (kgN/ha/yr) by Land Use
Capability (LUC) class
Year LUC1 LUC2 LUC3 LUC4 LUC5 LUC6 LUC7 LUC8
1 30 27 24 18 16 15 8 2
5 27 25 21 16 13 10 6 2
10 26 22 19 14 13 10 6 2
20 25 21 18 13 12 10 6 2
10 Hawke’s Bay
10.1 Freshwater Water Management Units
The Hawke’s Bay Region has seven major river catchments. In terms of water management
these catchments are further divided into 15 possible management areas (note the FMUs are
still not defined). The management areas include: Wairoa, Mohaka (upper, middle, and lower),
Waikere, Waihua, Esk, Tutira, Ngaruroro, Tutaekuri, Karamu, Ahuriri, Tukituki, Porangahau, and
the Southern Coast.
10.2 Nitrogen, phosphorous, sediment and E. coli contamination
Hawke’s Bay Regional Council (HBRC) has indicated that there are issues with all four
contaminants and that the severity of the effects varies across the region. Most areas that have
an issue with nitrogen are also likely to need to manage phosphorous. Sediment is a bigger issue
in the hillier areas of the catchment.
17 http://www.horizons.govt.nz/assets/publications/about-us-publications/one-plan/Chapter-14-Discharges.pdf
19Freshwater contaminant limit assessment of the regions
10.3 Mandatory requirements
The Tukituki River Catchment Plan Change 6 (hereafter Change 6) is a catchment-specific
change to the Hawke's Bay Regional Resource Management Plan that became operative in
October 2015.18 It adds new chapters specifically for the Tukituki River Catchment, and at the
same time, a number of existing chapters will no longer apply to the Tukituki River Catchment.
Among its proposals, Change 6 seeks to address specific water allocation and water quality
issues in the catchment.
Five key programmes are being developed to support the implementation of Change 6:19
1. Stock Exclusion
2. Nutrient Budgeting, phosphorus management planning and farm environmental
management plans
3. Monitoring, evaluation, reporting and improvement (MERI) Plan
4. Sub-catchment over-allocation mitigation
5. The adoption of Industry Good Practice
These programmes are based on the short-term need to provide transitional support to
landholders adapting to the new policies and rules contained within Change 6 and the medium-
term programmes to target a coordinated and collaborative approach to driving the adoption of
Industry Good Practice throughout the Tukituki Catchment. An additional programme will focus
on targeting priority sub-catchments where existing nutrient losses are beyond the proposed
targets within Change 6.
10.4 Freshwater quality limits
HBRC is in the process of setting limits for most management areas in the region. Potential limit
ranges were developed with policy staff at the councils (Table 9). These limit ranges are
expressed as a percentage change from current loads.
The priority catchments in the Tukituki catchment have set limits and targets20 and these
are listed in the Tukituki River Catchment Plan Change 6. In the priority catchments, maximum
nitrogen leaching rates are set to vary by land use capability (LUC) class (Table 10),21 which is
similar to the approach taken by the Horizons Regional Council in the Manawatu-Wanganui
18 http://www.hbrc.govt.nz/About-your-Council/Plans-Strategies/RRMP/Pages/tukituki-plan-change-6.aspx
19 http://www.hbrc.govt.nz/HBRC-Documents/HBRC%20Document%20Library/Heath%20N%202013%20-
%20Draft%20Tukituki%20Catchment%20Implementation%20Plan.pdf
20 Limits refer to where existing water quality is better than the desired numerical value and targets refer to where
the existing water quality is worse than the desired numerical value
21 http://www.hbrc.govt.nz/HBRC-
Documents/HBRC%20Document%20Library/Regional%20Plan%20Change%206%20-
%20Tukituki%20River%20Catchment%20(Operative%201%20October%202015)%20excl%20planning%20maps.
pdf
20region. The limits are not the definitive limits for the region with most subject to change based
on additional science, council investigations and outcomes of limit setting processes.
Table 9: Potential limit ranges for catchments in Hawkes Bay (% change from baseline)
Catchment Nitrogen Phosphorous Sediment E. coli
Wairoa No change No change 5–10% decrease No change
10–30%
Mohaka – upper No change No change No change
decrease
Mohaka –
No change No change No change No change
middle
Mohaka – lower No change No change 5–10% decrease No change
Waikere 0–5% decrease 0–5% decrease No change No change
Waihua 0–5% decrease 0–5% decrease No change No change
Esk No change No change No change No change
Tutira 5–15% decrease 5–15% decrease 5–15% decrease 5–15% decrease
Ngaruroro No change No change No change No change
Tutaekuri 0–10% decrease No change No change No change
Karamu No change 0–5% decrease 0–5% decrease No change
Ahuriri No change No change No change 0–5% decrease
See plan (Table See plan (Table See plan (Table See plan (Table
Tukituki
10) 10) 10) 10)
Porangahau No change No change 5–10% decrease 0–5% decrease
Southern Coast No change No change No change 0–5% decrease
21Freshwater contaminant limit assessment of the regions
Table 10: Tukituki catchment nitrogen leaching rate by Land Use Capability (LUC) class (to be calculated
on a whole of farm property or whole of farming enterprise basis)
Land LUC1 LUC2 LUC3 LUC4 LUC5 LUC6 LUC7 LUC8
Use
Class
Rate 30.1 27.1 24.8 20.7 20 17 11.6 3
(kgN/ha
/yr)
11 Greater Wellington
11.1 Freshwater Water Management Units
The Greater Wellington Regional Council (GWRC) has divided up the region into 5 catchments,
referred to a Whaituas.22 These include: Ruamahanga, Wairarapa Coast, Kapiti Coast, Te
Awarua o Porirua, and the Wellington Harbour and Hutt Valley (Figure 2). The council has
identified that these five areas place different demands on land and water resources and is
enlisting the support of local people to help understand local needs and make recommendations
on how they will be managed through Whaitua Committees. The first committee established in
December 2013 was the Ruamāhanga Whaitua Committee, followed by the establishment of the
Te Awarua o Porirua Whaitua Committee in December 2014. Both committees are still in the
process of determining the water quality limits required to meet their community values.
22 http://www.gw.govt.nz/whaitua-committees/
22Figure 2: Greater Wellington Whaitua catchments.
11.2 Nitrogen, phosphorous, sediment, and E. coli contamination
Sediment is perhaps the largest issue in most of the region. Nitrogen and phosphorous are of
some concern, although nutrient-related water quality is generally good in most water bodies. E.
coli appears to be only a concern in the Kapiti Coast. Heavy metals such as zinc and copper
contamination from industry are an issue in areas close to Wellington City.
11.3 Mandatory requirements
GWRC has not specified any mandatory requirements for landowners in the region beyond what
is already included in the Regional Plan. They have recently drafted a Proposed Natural
Resources Plan that is currently undergoing public consultation. One of the proposed activities
is stock exclusion from permanent streams, which should have a noticeable impact on water
quality.23
23 http://www.gw.govt.nz/assets/Plans--Publications/Regional-Plan-Review/Proposed-Plan/Chapter-5-Rules.pdf
23Freshwater contaminant limit assessment of the regions
11.4 Freshwater quality limits
GWRC is still in the process of setting limits for each whaitua in the region. Table 11 lists a draft
of possible limits for each whaitua based on discussions with a member of the Science team. The
limits are not the definitive limits for the region and are subject to change based on additional
science, council investigations, and outcomes of limit setting processes.
24Table 11: Potential limit ranges in the Greater Wellington Region (% change from baseline), by catchment
Whaitua Heavy
Catchments Nitrogen Phosphorous Sediment E. coli metals Comments/notes
Most sediment coming from forestry and sheep and
beef on highly erodible land; forestry rules. Should be
hopefully dealt able to deal with E.coli by keeping stock out of streams,
5–10% 15–25%
Ruamahanga with through No change n/a moving wastewater treatment plant discharge to land
decrease decrease
sediment goals (rather than water; currently 3 out of 6 wastewater
treatment plants discharge to water). For water
allocation, want to get rid of the water races
Any ag is low intensity, most area is in forestry,
typically erosion is into the sea; use of fertiliser rules -
25–35%
Wairarapa Coast No change No change No change n/a don't use fertiliser unless you can grow something; E.
decrease
coli is a public perception problem but not really
expected to be an issue
Land use mainly gardens; iwi very active in this
catchment limit setting process; E. coli mostly from
sheep and beef and pigs through overland flows; will
5–15%
Kapiti Coast No change No change No change n/a address by managing the wetland streams complex;
decrease
current loads are not high though but likely public
perception indicates they will want some sort of
improvement.
Land use mostly low intensity sheep and beef; farmland
20–30% not used so much; E.coli issue is not ag related, mostly
Te Awarua o 30–40%
No change No change No change decrease (Zn stormwater issue from dogs, etc. (should be able to deal
Porirua decrease
& Cu) with through stormwater infrastructure & restoring
habitat in streams
Wellington low P levels; N:P 20–30%
10–15% N management will be a challenge as most discharge
Harbour & Hutt ratio causes an No change No change decrease (Zn
decrease comes from market gardens, golf courses, etc.
Valley issue & Cu)
25Freshwater contaminant limit assessment of the regions
12 Marlborough
12.1 Freshwater Water Management Units
FMUs have not been formally set in Marlborough. However, they use the following catchments
for State of the Environment Reporting:24 Marlborough Sounds, Rai/Pelorus, Upper and Mid
Wairau, Lower Wairau, Opawa and South Marlborough. We use these catchments as the basis
for estimating limits in the region.
12.2 Nitrogen, phosphorous, sediment and E. coli contamination 25
Catchments are prioritised based on the annual State of the Environment monitoring report
which categorizes waterways into water quality classes (A–D). The aim is to improve (where
possible) water quality of currently marginal classed waterways to a fair class. The process
begins with a catchment-wide investigation of water quality in order to identify problem areas
and the sources of contamination. The next step for the council is to work with land-owners on
improving the water quality through targeted management.
Phosphorous and sediment issues are dealt with on an individual catchment basis with
management initiatives being based on catchment investigations. For example, the catchment
study for Doctors Creek showed that drainage-works and bank management (including stock
access) are the main contributors to increased levels of sediment and phosphorous. The council
will work with the land-owners on addressing these problems, initially on a voluntarily basis. It
is difficult to assess the possible reduction that can be achieved without mandatory
requirements.
Another catchment where sediment is a recognized problem is the Tuamarina River (with
follow-on effects on the Wairau Diversion). Investigations are currently being conducted, but it
is still unclear, what the main sources are and if and to what extend they can be managed.
Therefore the council aims for an improvement in regard to sediment load, but are currently
unable to quantify what can be achieved with the current regulatory tools.
12.3 Mandatory requirements26
Marlborough regional rules are currently under review and were due to be notified for
submission by the end of 2015, but this has still not occurred. There are some fencing
requirements, but these may change as a result of the submission process. There are no other
24 Phone discussion with Peter Hamil, December 2015
25 Excerpts from email exchanges between Steffi Henkel (NCC) and Leah Murphy (Motu), December 2015
26 Phone call with Steffi Henkel, December 2015
26You can also read