TEN YEAR PLAN 2018-2028 | HE MAHERE KAHURUTAKA 2018-2028 - Queenstown ...
←
→
Page content transcription
If your browser does not render page correctly, please read the page content below
TEN YEAR
PLAN 2018-2028 |
HE MAHERE
KAHURUTAKA
2018-2028
Consultation Document | He Tuhika Whakawhiti Kōrero

Rates impact:

                                                        2018-2028 AVERAGE PER ANNUM: 3.4%            2018/19 AVERAGE OVERALL INCREASE: 6.95%

                                                   The Big Issues:

                                                    1    QUEENSTOWN TOWN CENTRE MASTERPLAN (SCOPE AND TIMING)                   SEE PAGE 16

                                                    2    FUNDING THE QUEENSTOWN TOWN CENTRE MASTERPLAN                          SEE PAGE 19

                                                    3    PROJECT CONNECT AND LIBRARIES (CHANGES TO PREVIOUS PLANS)              SEE PAGE 21

                                                    4    WANAKA MASTERPLAN (SHAPING THE TOWN’S FUTURE)                          SEE PAGE 22

                                                    5    WATER (MAJOR CAPITAL PROGRAMME)                                        SEE PAGE 24

                                                    6    FUNDING SMALL COMMUNITIES’ WATER NEEDS                                 SEE PAGE 26
10 YEAR PLAN 2018–2028 [ CONSULTATION DOCUMENT ]

[2]
INTRODUCTION |
MAYOR AND CE
The theme of the draft 2018-28 Ten                  plan. An ambitious plan, with one      programme. This could see the
Year Plan is building momentum                      obvious constraint; we have to be      Drinking Water Treatment programme
and for this we have to be bold.                    able to afford it.                     completed within five or six years as
                                                                                           opposed to ten years, which would
Ten years from now, on our busiest                  The plan the Council has proposed      greatly improve the management
days, our population will be                        mirrors the complex needs of           of risk in this area (see Big Issue
bigger than the city of Dunedin1.                   a district in a period of rapid        4). There may also be options to
We’re already experiencing these                    growth. Many aspects of the plan       complete the Queenstown Town
numbers on peak occasions such                      are dependent on internal and          Centre Masterplan in a shorter
as New Year’s Day. Not only have                    external factors (such as Central      timeframe (currently assumed to be
we planned to be ready for that                     Government funding) to progress.       delivered over 20 years).
– our vision is that in ten years’                  These assumptions have been
time, experiencing and living in                    provided throughout the plan,          As outlined, this plan reflects
this district must be better than                   and a notable example is the           a delivery programme almost
it is today. A place where people                   Queenstown arterials programme.        three times the size of anything
can afford to live, where you don’t                 This $148.8M roading development       this Council has ever delivered.
waste time in traffic, you have great               is based on an assumed NZTA            Significant investment must be
transport options, places to enjoy,                 contribution of $119.0M (80%).         made in roading, transport, water,
relax, exercise or be enriched and                  The Council maintains this             stormwater, wastewater, car parking,
entertained. Where you can rely                     assumption is reasonable but the       and recreation. We will also need
on the infrastructure and services,                 NZTA level of subsidy will not be      more Council staff to deliver all this
and best of all, that these things                  confirmed until October 2018. It       work, and somewhere to house them
all complement the incredible                       is important to understand that        (see Big Issues). There are major
landscapes in which we live.                        the Council will need to adapt its     investments in the main centres
                                                    capital programme should the           commencing with the implementation
The challenge lay in understanding                  assumed external funding levels        of the Queenstown Town Centre
the massive investment that                         not materialise. If for example, the   Masterplan and the master-planning
legacy and growth requires of this                  external funding is significantly      process for Wanaka (commencing in
Council. Where we could, we have                    less than assumed, the Council         2018). This must also be balanced
prioritised, deferred, streamlined                  will be forced to defer elements       with the needs of our smaller and
and revised the capital programme                   of the programme. For the              rural communities, which we have
over the course of the ten years.                   Queenstown arterials project, this     tried to reflect in the plan (see Other
In the context of all that careful                  would probably mean deferring          Projects).
scrutiny we have still landed on a                  Stage 3 (Man St to One Mile link)
capital expenditure programme that                  to beyond the ten-year period.         To make sure all this remains
represents an increase of 156%                      The consequences of this are           affordable we have leveraged every
of the one we previously forecast.                  that traffic is not diverted out of    possible tool we have available to us
The proposed investment over the                    the town centre effectively and        including a new credit rating, debt,
coming ten years has gone from                      congestion continues. Many of          land sales, and government funding/
$380M to $976M. The cost of                         the town centre improvements           subsidy. With such a comprehensive
                                                    included in the current programme
                                                                                                                                     10 YEAR PLAN 2018–2028 [ CONSULTATION DOCUMENT ]

growth alone makes up for 32.5%                                                            programme, there will inevitably be a
of that programme or $317M (see                     will not be delivered (see Big Issue   rates increase (see The Numbers you
Financial Affordability).                           1). This will result in a delay in     Need to Know).
                                                    reaping the economic and amenity
More than a year ago when we                        benefits of the Queenstown Town        In addition to this, we know that
started to prepare for this plan                    Centre Masterplan for both visitors    this community cannot and must
we realised that a dramatic shift                   and the local community.               not continue to carry the burden of
in investment was crucial. As the                                                          tourism growth. We have made a
fastest growing district in New                     If however, the external funding       strong and compelling case to Central
Zealand and the country’s premier                   exceeds the assumed amounts,           Government to work with us on
tourist destination, we knew we                     the Council would be in a position     sharing this burden through existing
needed a hard look to the horizon                   to consider advancing the timing       and proposed funding mechanisms
and we knew we needed a great                       of some elements of the capital        and we have committed to continuing
                                                                                           this dialogue in the coming year (see
                                                                                           Building Momentum).
1
    Source: QLDC Growth Projections to 2058, 25 May 2017                                                                             [3]
It is important to highlight that
despite the ambitious and
challenging programme we have
included in the draft plan, as a
community we have options. We
have the option to step away from
projects or to re-prioritise. Whilst
we have to continue to provide a
safe and healthy environment and JIM BOULT MIKE THEELEN
meet our legislative requirements, Mayor, Chief Executive,
we can choose to minimise the Queenstown Lakes District Council Queenstown Lakes District Council
investment in recreation and
community; we can enable a
continuous drop in our service we have mapped out the options feedback on any aspect of the plan.
and we can allow infrastructure for each of the key issues. You In particular share your views on the
to decline and fail to meet the will find a section at the back of big issues; The Queenstown Town
demands of growth. You have the the document to assist with your Centre Masterplan (scope, timing
option to tell us that you want this submission. and funding), Project Connect and
Council to do all, some or none of Libraries, Wanaka Masterplan, Water
these projects, how to schedule Please read this document and Supply and Quality, funding Small
them, and the most appropriate see the full draft plan online Communities’ water needs. We look
way to fund them. To that extent www.qldc.govt.nz. Give us your forward to hearing from you.
RATES IMPACT OF MAJOR
BIG ISSUE CAPITAL
PROJECTS IN 2018-2028
RATES
CAPITAL RATEPAYERS INCREASE MAIN RESIDENTIAL
COST ($M) TIMING AFFECTED PER YEAR IMPACT IMPACT $
QUEENSTOWN New targeted rate:
TOWN CENTRE Properties within wider CBD
Wakatipu within wider $146 to $777 per
MASTERPLAN $327.7M 2019-2027 1.4%-30.3%
ward Queenstown annum; Outside
(scope, timing CBD area wider CBD $34 to
and funding) $179 per annum
PROJECT
CONNECT AND
District- $22 to $84
LIBRARIES $42.3 2019-2021 0.5%-3.3% District-wide
10 YEAR PLAN 2018–2028 [ CONSULTATION DOCUMENT ]
wide per annum
(changes to
previous plans)
Within Queenstown
WATER All
scheme $123 to
serviced All serviced
(meeting supply $124.6M 2019-2028 2.1%-19.0%* $265 per annum;
urban urban areas
standards) Wanaka $430 to
areas
$729 per annum
* The rating impact for water treatment is calculated for 2022/23 (year 5 of the draft plan) and reflect both the increase in operating costs and debt servicing. The
level of service component of the capital cost for Wanaka does not include any contribution from land sales which, if made, could reduce the impact significantly.
The Wanaka Masterplan Big Issue is not included above as at this stage the Council is consulting
on the investment in planning the programme ($500k) not the resulting capital expenditure.
[4]WHAT IS THE TEN YEAR
PLAN? | HE AHA KI MUA
I TE AROARO?
We prepare a Ten Year Plan every
three years in consultation with
residents from throughout the
Queenstown Lakes District. This is
the framework for how the district ANNUAL
will be developed and serviced PLAN
TEN YEAR
over the next decade, but with a
PLAN
specific focus on the next three
years. In interim years we produce
an Annual Plan to determine its
short-term budgets and projects for
the coming year. We also publish
an Annual Report that shares with
you how we’re performing against
these plans.
ANNUAL
The Ten Year Plan covers all of the COMMUNITY REPORT
services we provide as a Council OUTCOMES
and projects that we propose to
deliver or begin within the next ten
years. This includes the following;
> Buildings, venues and facilities,
such as community halls
> Transport infrastructure,
including cycleways and parking Whilst we need to keep providing INFRASTRUCTURE STRATEGY
provision for growth in the district we have
also placed a strong focus on The infrastructure strategy
> Parks and reserves maintenance and renewals so contains details of core
the levels of service you have infrastructure activities including
> Water supply, wastewater and experienced are maintained or land transportation, water supply,
stormwater improved. wastewater, stormwater and solid
waste management. The strategy
> Waste and recycling You can access the full draft can be found in Volume Two of the
Ten Year Plan document on our draft plan.
> Community services such as website at www.qldc.govt.nz.
Alternatively drop into our
10 YEAR PLAN 2018–2028 [ CONSULTATION DOCUMENT ]
libraries and sport & recreation
facilities offices in Queenstown, the
Wanaka service centre, or
> Regulatory and enforcement any of our libraries.
services, for example
dog pounds
[5]THE GROWTH CHALLENGE |
OUR PROFILE
One local
Queenstown Lakes is the fastest growing district in New Zealand. The resident
population has tripled since the early eighties. At capacity, Queenstown
Lakes currently has one local resident per 34 international visitors. To
assist with future planning in the face of this challenge, the Council has
developed comprehensive growth projections. These clearly reflect the
scale of the growth challenge we all face.
per 34
international
visitors
Average house Mean income 3
values 2
1,200k 60k
Queenstown Lakes District
New Zealand
1,000k 50k
800k 40k
600k 30k
$49,780 $57,780
400k 20k
$1,111,995 $669,565
With an average salary lower than
200k 10k the national average one of our
greatest challenges is ensuring our
district remains affordable for our
0k 0k local communities.
10 YEAR PLAN 2018–2028 [ CONSULTATION DOCUMENT ]
Growth projections (visitor and resident)
Queenstown Lakes District’s over Christmas and New Year we for the next ten to 15 years; the
population is projected to continue are already exceeding this. period this draft Ten Year Plan
growing with a 54% increase in spans. In addition to this growth in
resident population projected The district’s resident population is the resident population, growth in
between 2011 and 2031. In projected to nearly double between international visitors is expected
ten years, on a busy day, the 2018 and 2058, increasing from to continue. The magnitude,
population of the district will be an average of 38,048 residents to pattern and growth path of visitor
greater than the City of Dunedin just under 75,000 residents. The arrivals to Queenstown is unique
is today, and on our busiest days highest rate of growth is projected in New Zealand.
2
Source: QV House Price index December 2017
3
Source: Queenstown Lakes Economic Profile 2016, Infometrics
[6]AVERAGE DAY POPULATION GROWTH DURING THIS DRAFT TEN YEAR PLAN PERIOD (RESIDENTS AND VISITORS)4
2018 2028
Resident Visitor Total Resident Visitor Total
Wanaka Ward 12,491 7,945 20,436 16,650 10,129 26,779
Wakatipu Ward 25,557 16,915 42,472 32,627 21,360 53,987
Whole district 38,048 24,861 62,909 49,277 31,488 80,765
PEAK DAY POPULATION GROWTH DURING THIS DRAFT TEN YEAR PLAN PERIOD (RESIDENTS AND VISITORS)5
2018 2028
Resident Visitor Total Resident Visitor Total
Wanaka Ward 12,491 34,448 46,939 16,650 42,988 59,638
Wakatipu Ward 25,557 44,854 70,411 32,627 56,759 89,386
Whole district 38,048 79,301 117,349 49,277 99,747 149,024
AVERAGE DAY POPULATION GROWTH PEAK DAY POPULATION GROWTH
DURING THIS DRAFT TEN YEAR PLAN PERIOD DURING THIS DRAFT TEN YEAR PLAN PERIOD
(RESIDENTS AND VISITORS TOTAL)4 (RESIDENTS AND VISITORS TOTAL)5
149,024
Wanaka Ward
Wakatipu Ward
Whole district 117,349
89,386
80,765
70,411
62,909
59,638
53,987
46,939
42,472
10 YEAR PLAN 2018–2028 [ CONSULTATION DOCUMENT ]
26,779
20,436
2018 2028 2018 2028
4
Source: QLDC Growth Projections to 2058, 25 May 2017
5
Source: QLDC Growth Projections to 2058, 25 May 2017
[7]OUR VISION |
TO TATOU MOEMOEA
On behalf of our Council, our Mayor We recognise the strong desire for are the key messages wrapped
and Chief Executive have outlined vibrant communities and enduring up into the defining vision of this
a bold plan that reflects the issues landscapes. A bold plan calls for draft plan.
you’ve told us are important to you. bold leadership decisions. These
VIBRANT
COMMUNITIES BOLD
TE ORAKA LEADERSHIP
TE AMORAKI
HAPORI
ENDURING
LANDSCAPES
TOITU TE
WHENUA
COMMUNITY INFRASTRUCTURE WASTE ENVIRONMENT ECONOMY REGULATORY FINANCE LOCAL
SERVICES MANAGEMENT FUNCTIONS & SUPPORT DEMOCRACY
& FACILITIES Efficient and Quality built Sustainable & SERVICES SERVICES
effective Environmental environments that growth Communities
Efficient and effective infrastructure sustainability meet local needs management A responsive An organisation are resilient and
community facilities and low impact and respect the local organisation that consults prepared for civil
living is highly character Partnering for defence emergency
success effectively and
Communities have a valued makes sound events
good standard of living World class
landscapes are Investing decisions
and wellbeing An organisation
protected strategically that demonstrates
Communities are Enabling leadership
inclusive for all diversification An organisation
Strong cultural that considers
landscape that the District’s
inspires, preserves and partnership with
celebrates our heritage, Mana Whenua
arts and culture
Appropriate public
accessBUILDING MOMENTUM |
KOKIRITIA!
Unprecedented growth in
both resident and visitor QUEENSTOWN
numbers in our district has
presented our communities with
some significant challenges.
As outlined, our peak day One local
population in 2028 is estimated resident
to be almost 150,000 (this will
exceed the current population of
Dunedin by more than 20,000)
(see Our Growth Challenge).
Tourism is critical to the per 34
economic success of the international
Queenstown Lakes District visitors
and it is equally critical that we
hit the right balance between
meeting the expectations of
our community and visitors and
ensuring this plan is affordable.
The challenges of visitor AUCKLAND
growth faced by our ratepayers
are disproportionately high
compared to other tourism
One local
centres. The ratio of visitors to resident
residents is 34 visitors to one
resident, whereas the ratio in
Auckland is one-to-one and per 1
Christchurch three-to-one. international
visitor
The numbers are big and the
dollars are big. The programme
of delivery that this draft plan
contains is almost three times
bigger than anything this
community and this Council have CHRISTCHURCH
faced before, being just short of
a billion dollars over the next ten
years. One local
resident
10 YEAR PLAN 2018–2028 [ CONSULTATION DOCUMENT ]
The draft plan clearly reflects
the cost impact of growth
which has been assessed at per 3
$317M over the next ten years. international
This represents 32.5% of the visitors
total capital programme, whilst
24.3% is required for renewal or
replacement of existing assets
and 43.2% for increasing level of
service.
[9]The Council is submitting an If our conversations with Central
GROWTH-RELATED affordable plan but only after the Government are unsuccessful,
CAPITAL EXPENDITURE rigorous prioritisation and scrutiny traffic issues will continue to cause
(85% OF TOTAL CAPITAL EXPENDITURE
RELATING TO GROWTH) of all projects. You will find a plan snarl-ups, delays and gridlock as
that proposes a very different we look to stagger the investment.
approach to investing heavily
Roading $161.9M
in a number of our challenges, Given the big issues our community
Water Supply $64.7M including roading, transport, faces, the Council started engaging
parking, waste minimisation and last year with Central Government
Wastewater $41.6M facilities that reflect growing on the challenging cost of
Total $268.2M recreational expectations (see Big delivering tourism infrastructure
Issues). To do this we have had to that supports the NZ economy.
leverage every possible opportunity We have made a specific business
RELEVANT CORE available to Council including land case to Central Government to
INFRASTRUCTURE RENEWAL sales, debt and increasing rates enable the district to sustain
(77% OF TOTAL CAPITAL (see Financial Affordability). projected visitor growth without
EXPENDITURE RELATING TO any risk of eroding the experience.
RENEWALS)
Equally a large number of projects The previous government and the
have had to be scheduled over new government have both proved
Roading $117.9M
a long time-period. These affect open to this conversation.
Water Supply $44.6M things like the timing of our ability
to meet drinking water standards A compelling argument in the case
Wastewater $19.7M (spread from five to ten years), is the contribution Queenstown in
our ability to deliver the amenity particular makes to New Zealand’s
Total $182.2M
that world-class resorts should overall GDP. International visitors
reflect (e.g. ambitious town who come to New Zealand
LEVEL OF SERVICE INCREASE centre master-planning has had because of Queenstown spend up
(80% OF TOTAL CAPITAL EXPENDITURE to adopt a staggered approach), to $1.74 billion nationally, meaning
RELATING TO LEVELS OF SERVICE) our investment in our community Queenstown and its surrounds are
in terms of providing enough critical to the ongoing health of
Roading $198.2M recreation facilities (e.g. reducing New Zealand Inc. If the funding is
the quantity of new courts at not provided in some form then the
Community* $41.8M
Queenstown Events Centre) and Queenstown experience (in the first
Water Supply $56.4M the delivery of future infrastructure instance) will start to compromise
capacity and new schemes (e.g. the New Zealand visitor experience
Wastewater $37.9M wastewater scheme upgrades and and worse, negatively impact our
Total $334.3M Glenorchy Wastewater Scheme communities. Our communities
have been pushed out of the draft and this Council cannot afford to
* The main projects in community are the plan horizon). continue to stay ahead of these
Coronet Forest Revegetation ($10.0M, the
Wanaka Recreation Centre Extension ($3.7M) challenges, alone. QLDC considers
and the Queenstown Events Centre court The affordability of the plan relies this funding could be achieved
extensions ($8.2M). on a significant investment from through some form of visitor tax or
the New Zealand Transport Agency levy although at the moment it is
to fund $235M over ten years. not possible to do so under current
This includes an assumption in legislation. A fair balance must be
the draft plan that NZTA will fund struck.
80% of a critical Queenstown
by-pass arterial ($148.8M total As outlined, growth has seen the
cost of which $119.0M is the projected capital expenditure much
proposed NZTA share) unlocking higher than previously forecast. The
10 YEAR PLAN 2018–2028 [ CONSULTATION DOCUMENT ]
Queenstown traffic and 51% of the 2015-2025 Ten Year Plan forecast
balance of district-wide roading $380M, the draft plan shows a
(See Queenstown Town Centre 156% increase to $976M.
Masterplan). We will not know the
outcome of our assumptions until This reflects a major shift from a
October 2018 when NZTA will Council delivering ‘just in time’
confirm its commitment but we reactive infrastructure to a Council
have submitted robust business that is planning strategically to
cases to underline the absolute manage infrastructure growth.
requirement for investment. As
the Mayor and Chief Executive
have outlined, this project is not
affordable for the community alone.
[ 10 ]Financial affordability
In order to deliver the substantial capital programme included in this plan, QLDC will need to rely on borrowing. The
amount of borrowing required is significantly above the amount anticipated in the 2015-2025 Ten Year Plan. At the
end of 2017 the Council applied for a credit rating from Fitch Ratings, an international credit rating agency. This has
been granted at AA-, which enables the Council to access a higher debt limit and borrow more. Council has spent
a considerable amount of time and effort working through the Capital Programme to ensure that it is affordable,
necessary and deliverable.
This has meant that a number of projects have been deferred or omitted due to of funding and financing constraints.
It is expected that by the end of year five, external debt will have risen to $443M and by the end of the ten-year
period it will have declined to $339M. In 2015, we forecast our external debt for these years to be far lower, at
$169M and $134M respectively.
The growth portion of the Capital Programme ($317M or 32.5% of the total Capital Programme) will be largely
funded by development contributions in the long run, but must be funded primarily by debt in the first instance.
Some of this debt will be via the Housing Infrastructure Fund to allow QLDC to prepare for anticipated growth and
to direct development activities in specific areas. This allows for QLDC to spread the cost of large infrastructural
projects over the expected life of the asset.
Using debt in this way means that future residents and ratepayers contribute a fair share to the use they make of a
facility. The proposed level of borrowing is within the debt parameters in QLDC’s Liability Management Policy. The
Net Debt/Total Revenue limit has increased from 175% to 250% as a result of the credit rating process.
BORROWING LIMIT 30 JUNE 2019 30 JUNE 2020 30 JUNE 2021 30 JUNE 2022
Interest expense/ratesTHE NUMBERS YOU NEED
TO KNOW | KA TATAURAKA
The proposed average rates
increase for 2018/19 is sitting at KEY CHANGES TO THE RATING POLICY
6.95% (after allowing for growth
of 3.4% in the rates database).
1 Reflecting the impact of the 2017 Rating Revaluation (see below
This is above the 4.15% for
and Volume 2 in the Rates section)
2017/18 but follows several years
where increases were lower than
forecast. The higher increase this 2 Funding of capital costs for new water or wastewater schemes for
year reflects the need to fund the small communities (see Volume 2 in the Rates section)
comprehensive programme of
works as outlined within the draft 3 Targeted rates for water supply – extending current urban
plan. The average net (growth approach to Arthurs Point and other smaller schemes (See Volume
adjusted increase) annual increase 2 in the Rates section)
over the ten years (after allowing
for growth) is now 3.4% up from 4 Proposal for new targeted rate for the cost recovery of
the 2.8% forecast in 2015. Queenstown Town Centre Master Plan (QTCMP) – note this will
not come into effect until 2022. (see page 165 of Volume Two in
The impact of a 6.95% rates the Rates section)
increase for 2018/19 will not be
even across all property types and
locations. This is because of the
impact of targeted rates which are RATING CHANGES FOR 2018/19
often ward or scheme based. The
updated rating values from the Increase in rates for wastewater - Queenstown $38 per connection per
2017 revaluation of property values annum; Wanaka $60 and Arthurs Point $30
in the district can also impact rates
increases for the 2018/19 year. The Increase in rates for water supply - Arrowtown $20 per connection per
Council is proposing to minimise annum;
the impact of the change in values Increase in rates for the Sports, Halls and Libraries Charge of $45 per
by adjusting the differentials (how annum which impacts residential properties only.
costs are allocated by property
type) that apply to some rating Increase in rates for Wanaka Pool of $36 per annum - this is within
categories. forecast. This impacts residential properties in the Wanaka ward.
QUANTIFIED LIMIT ON RATES Increase in waste management rates of $32 for residential properties
and $42 for non-residential
It is proposed to set a rates Decrease in the uniform annual general charge (part of your General
increase limit of 10.8% gross (7% Rates) of $3 per property
net) per annum (subject to changes
in growth forecasts) for the first Decrease in rates for Alpine Aqualand of $6 per annum; this impacts
residential properties in the Wakatipu/Arrowtown wards.
10 YEAR PLAN 2018–2028 [ CONSULTATION DOCUMENT ]
three years and 9.0% gross (5.5%
net) for years four to ten. It is also
proposed that rates income will
not exceed 55% of total revenue.
The average growth rate in the
D
district is 2.8% per annum and this
PROPOSE TES
will reduce the impact of any rates E R A
increase for existing properties. AVERAG 2018/19
INCREASE
6.95%
[ 12 ]CUMULATIVE RATES IMPACT OF MAJOR LEVELS OF SERVICE PROJECTS
Project Capital expenditure Rates impact Main impact Date effective from
Queenstown Town $327.7M 1.4% to 30.3% Wider Queenstown From year 8*
Centre CBD; Wakatipu
Ward
Project Connect $42.3M 0.5% to 3.3% District-wide From year 3
Water Treatment** $124.6M 2.1% to 19.0% Serviced properties From year 5
district-wide
* The table shows the full impact in Year 8; the new rate is likely to commence in Year 4 with a lower impact and progressively increase as the capital works
are completed.
**The rating impact for water treatment is calculated for 2022/23 (year 5 of the draft plan) and reflect both the increase in operating costs and debt
servicing. The level of service component of the capital cost for Wanaka does not include any contribution from land sales which, if made, could reduce
the impact significantly.
2017 Rating Revaluation – Huge Movements
Every three years the rating accommodation has increased by The rates effects of major
valuations for the country are 65% with commercial properties projects on various properties
updated by Quotable Valuation. showing a lesser increase at 49%. by type are included in this
The new values must then be Higher valuation in one set of document (page 14).
applied for rating purposes in the properties does not mean higher
2018/19 rating year. This model is demand for services. The Council
designed to be fair and equitable. agreed that we needed to review
If valuations increase across the how we allocate cost (known as
board, then in general this will not ‘differentials’) to make sure it is fair.
greatly impact rates for individual Do you
s
properties. The figures in our proposa upport the
The Council has opted to allocate l to revis
rating d et
district show an overall value capital values for 2018/19 using
based o ifferent he
n the ne ia ls
movement of around 59% with the new rating values and new
w rating
the predominant group residential differentials because this balances valuatio
ns?
increasing by around 63%. the impact of the recent valuation.
Country dwellings show a lesser Below is a table showing the
increase at 44% whilst vacant percentage increase if we adopted
land shows the highest increase the status quo versus the preferred
at 90%. In the business sectors, revised differentials.
EXISTING DIFFERENTIALS (STATUS QUO) REVISED DIFFERENTIALS (PREFERRED)
Previous Rating Previous Rating
Allocation (based impact (overall Allocation (based impact (overall
on old values) allocation) on old values) allocation)
Accommodation 18.3% 18.8% 18.3% 18.3%
Commercial 22.6% 21.2% 22.6% 22.0%
10 YEAR PLAN 2018–2028 [ CONSULTATION DOCUMENT ]
Residential 32.7% 33.3% 32.7% 32.5%
Mixed use* 6.4% 6.5% 6.4% 6.4%
Vacant 6.5% 7.9% 6.5% 7.7%
Primary industry / rural 4.0% 3.8% 4.0% 4.0%
Country dwelling 8.5% 7.7% 8.5% 8.1%
Other 1.0% 0.9% 1.0% 0.9%
* Treated as 25% commercial or accommodation and 75% residential or country dwelling as appropriate.
[ 13 ]RATES IMPACT OF MAJOR PROJECTS BY PROPERTY TYPE
Cumulative Rating Impact Existing QTMP Impact Adjusted PC Impact Adjusted WT Impact Adjusted Total Cumulative
Total Revised Increase Total Revised Increase Total Revised Increase Total Impact
Rates Rates Rates Rates
Location Property Valuation 17/18 $ $ % 17/18 $ $ % 17/18 $ $ % 17/18 $ $ %
Type
QT/Wak Res Low 2,360 34 1.4% 2,394 22 0.9% 2,416 123 5.2% 2,539 179 7.6%
QT/Wak Res Median 2,725 54 2.0% 2,779 31 1.1% 2,810 142 5.2% 2,952 227 8.3%
QT/Wak Res High 5,041 179 3.6% 5,220 84 1.7% 5,304 265 5.3% 5,569 528 10.5%
QT/Wak Comm Low 2,426 81 3.3% 2,507 25 1.0% 2,532 121 5.0% 2,653 227 9.4%
QT/Wak Comm Median 5,925 368 6.2% 6,293 58 1.0% 6,351 230 3.9% 6,581 656 11.1%
QT/Wak Comm High 93,542 6,546 7.0% 100,088 760 0.8% 100,848 3,393 3.6% 104,241 10,699 11.4%
QT/Wak Accomm Low 3,995 138 3.5% 4,133 26 0.7% 4,159 155 3.9% 4,314 319 8.0%
QT/Wak Accomm Median 9,318 368 3.9% 9,686 52 0.6% 9,738 263 2.8% 10,001 683 7.3%
QT/Wak Accomm High 289,565 12,745 4.4% 302,310 1,459 0.5% 303,769 6,075 2.1% 309,844 20,279 7.0%
QT CBD Res Low 2,360 146 6.2% 2,506 22 0.9% 2,528 123 5.2% 2,651 291 12.3%
QT CBD Res Median 2,725 232 8.5% 2,957 31 1.1% 2,988 142 5.2% 3,130 405 14.9%
QT CBD Res High 5,041 777 15.4% 5,818 84 1.7% 5,902 265 5.3% 6,167 1,126 22.3%
QT CBD Comm Low 2,426 356 14.7% 2,782 25 1.0% 2,807 121 5.0% 2,928 502 20.7%
QT CBD Comm Median 5,925 1,597 27.0% 7,522 58 1.0% 7,580 230 3.9% 7,810 1,885 31.8%
QT CBD Comm High 93,542 28,377 30.3% 121,919 760 0.8% 122,679 3,393 3.6% 126,072 32,530 34.8%
QT CBD Accomm Low 3,995 600 15.0% 4,595 26 0.7% 4,621 155 3.9% 4,776 781 19.5%
QT CBD Accomm Median 9,318 1,593 17.1% 10,911 52 0.6% 10,963 263 2.8% 11,226 1,908 20.5%
QT CBD Accomm High 289,565 55,255 19.1% 344,820 1,459 0.5% 346,279 6,075 2.1% 352,354 62,789 21.7%
Wan Res Low 2,488 0 0.0% 2,488 25 1.0% 2,513 430 17.3% 2,943 455 18.3%
Wan Res Median 2,544 0 0.0% 2,544 27 1.1% 2,571 456 17.9% 3,027 483 19.0%
Wan Res High 3,827 0 0.0% 3,827 51 1.3% 3,878 729 19.0% 4,607 780 20.4%
Wan Comm Low 3,491 0 0.0% 3,491 31 0.9% 3,522 489 14.0% 4,011 520 14.9%
Wan Comm Median 4,818 0 0.0% 4,818 40 0.8% 4,858 639 13.3% 5,497 679 14.1%
Wan Comm High 43,912 0 0.0% 43,912 260 0.6% 44,172 6,743 15.4% 50,915 7,003 15.9%
Wan Accomm Low 4,163 0 0.0% 4,163 24 0.6% 4,187 526 12.6% 4,713 550 13.2%
Wan Accomm Median 7,006 0 0.0% 7,006 34 0.5% 7,040 732 10.4% 7,772 766 10.9%
Wan Accomm High 63,569 0 0.0% 63,569 325 0.5% 63,894 1,933 3.0% 65,827 2,258 3.6%
QT/Wak C Dwg Low 1,495 60 4.0% 1,555 33 2.2% 1,588 0 0.0% 1,588 93 6.2%
QT/Wak C Dwg Median 2,142 116 5.4% 2,258 57 2.7% 2,315 0 0.0% 2,315 173 8.1%
QT/Wak C Dwg High 4,733 343 7.2% 5,076 151 3.2% 5,227 0 0.0% 5,227 494 10.4%
QT/Wak PI Low 1,575 65 4.1% 1,640 43 2.7% 1,683 0 0.0% 1,683 108 6.9%
QT/Wak PI Median 2,782 181 6.5% 2,963 86 3.1% 3,049 0 0.0% 3,049 267 9.6%
QT/Wak PI High 5,843 474 8.1% 6,317 195 3.3% 6,512 0 0.0% 6,512 669 11.5%
Wan C Dwg Low 1,746 0 0.0% 1,746 33 1.9% 1,779 0 0.0% 1,779 33 1.9%
Wan C Dwg Median 2,189 0 0.0% 2,189 45 2.1% 2,234 0 0.0% 2,234 45 2.1%
Wan C Dwg High 3,336 0 0.0% 3,336 78 2.3% 3,414 0 0.0% 3,414 78 2.3%
Wan PI Low 1,815 0 0.0% 1,815 42 2.3% 1,857 0 0.0% 1,857 42 2.3%
Wan PI Median 3,952 0 0.0% 3,952 99 2.5% 4,051 0 0.0% 4,051 99 2.5%
Wan PI High 8,065 0 0.0% 8,065 207 2.6% 8,272 0 0.0% 8,272 207 2.6%
Res Residential QTMP Queenstown Town Centre Masterplan QT/Wak Queenstown Wakatipu
Comm Commercial PC Project Connect and Library proposal QT CBD Queenstown Central
Accomm Accommodation WT Water Treatment (supply and quality) Business District
C Dwg Country Dwelling Wan Wanaka
PI Primary industry
[ 14 ]CAPITAL COST 2018-2028 $976M
RATES VALUE
VISION ACTIVITY OPERATING COST 2018-2028 $1,395M PER $100
Vibrant Community 9% $87M
Services $27
Communities & Facilities 23% $325M
17% $167M
Water Supply $14
8% $115M
10% $99M
Wastewater $17
10% $145M
6% $55M
Stormwater $3
1% $17M
Enduring
Landscapes
49% $478M
Transport $16
13% $175M
Waste 3% $28M
$5
Management 10% $145M
0% $0
Environment $6
13% $157M
1% $9M
Economy $7
7% $101M
Regulatory 0% $1M
Functions $0
& Services 11% $155M
Bold
Leadership
Local 0% $0
$6
Democracy 4% $60M
Finance & 5% $52M
Support Services 0%
[ 15 ]THE CHALLENGES AHEAD |
KA TAERO E WHAI AKE
Maintaining vibrant, accessible Centre Masterplan, including through to 2027 that delivers
town centres is vital to keeping public transport, parking and key elements of the Masterplan.
the district liveable. This improvements for pedestrians To ensure the full programme is
particularly applies to the two in the CBD. That masterplan both affordable and logistically
main centres of Queenstown and was adopted by the Council in achievable, we anticipate the full
Wanaka. In 2017, the Council December 2017 and is progressing programme will take up to 20
engaged with Queenstown into detailed business cases for car years. In 2018 the Council will
residents to discuss locations parking options, a public transport commence a strategy for Wanaka
and options for development as hub, and the arterial routes. This (see Wanaka Masterplan below).
part of the Queenstown Town draft plan includes a programme
BIG ISSUE 1 Queenstown Town Centre Masterplan
What is planned for delivery in
this draft plan?
Projects in detail
ARTERIAL ROUTES PARKING
The quantum of investment
proposed for the Queenstown
Access to and around the CBD Pressure on parking in the
Town Centre Master Plan is
is critical to the success of the Queenstown CBD has increased
significant, totalling $327.7M
Masterplan. Residents, workers in recent years, and in December
investment in increased levels of
and visitors must be able to travel 2017 the Council implemented
service over ten years. This draft
to their destination easily, whether a range of changes to parking
plan contains funding for:
that’s in a car, on public transport charges aligned with the Otago
CBD Arterial Routes – 3 Stages or using active transport methods Regional Council’s introduction
$148.8M 2019 to 2024* such as cycling. Planned across of an improved, more affordable
three construction stages, the public transport service. By
Two Carparking Buildings
total programme carries the most increasing parking charges for
$48.0M 2019 to 2024 significant capital expenditure in the first time in seven years and
Public Transport Hub the draft plan at $148.8M. With limiting availability of free parking
$25.4M 2020 to 2023 an overall route running from spaces, the Council’s goal was
Alternative Transport Options Melbourne Street to Henry Street to change how we use public
$23.5M 2019 to 2024 (stage one), Henry Street to Man transport. However we recognise
Ferry / Water Taxi Street (stage two), and Man that alongside alternative travel
$6.1M 2021 to 2025 Street to Thompson Street (stage options, parking is still a necessity
Street Upgrades three), the programme is due for in the CBD.
completion June 2022, June 2023
10 YEAR PLAN 2018–2028 [ CONSULTATION DOCUMENT ]
$49.5M 2019 to 2026**
and June 2024 respectively. In this draft Ten Year Plan we’ve
Memorial Hall Replacement included two new parking
$10.9M 2019 to 2021 In financially planning for the buildings, which is a change to
Other small projects Queenstown arterials we have the current 2015-25 Ten Year
$15.5M 2019 to 2027 assumed a significant funding Plan. The first is a new 242-space
TOTAL contribution of 80% ($111.6M) from parking building at the current
$327.7M NZTA. Other roading developments Boundary Street car park; due
and improvements have been for completion by June 2020 at a
* Based on NZTA Funding assumptions.
assumed at a standard funding cost of $18.3M. The second is a
** The street upgrade programme could
be further advanced subject to Central assistance rate (FAR) rating of 51%. 350-space parking facility on the
Government Funding. current Ballarat Street parking site;
CBD ARTERIAL ROUTES – 3 STAGES due for completion by June 2021 at
There is no inclusion of proposed arts a cost of $25.8M. Also included is
and culture facilities but a district- $3.9M for a parking management
ESTIMATED
wide review has been included. INDICATIVE COST COMPLETION
[ 16 ]
$148.8M 2019 to 2024*Do you
sup
preferre port the
d option
to com
program plete the
me outli
the dra ned
system for the parking buildings. and priority bus lanes on Stanley WAKATIPU ft plan? in
Timing is a crucial aspect of this Street total $25.4M and have been FERRY
programme so development detailed in the draft Ten Year Plan.
has been scheduled to minimise Given the location of urban
inconvenience and take advantage TRANSPORT HUB development around Lake
of the shift from car to public and Wakatipu’s Frankton Arm, it
active transport. ESTIMATED can provide a vital lifeline in
INDICATIVE COST Queenstown’s public transport
COMPLETION
To improve the overall parking strategy as a realistic alternative to
Stanley Street
experience for commuters and access roads that are constrained
visitors, the plan also includes $25.4M 2023 by our unique landscape. We
$8.3M to invest in technology, such believe services that include water
as real-time parking information, taxis and ferries could revolutionise
variable pricing controls, way- ALTERNATIVE TRANSPORT how commuters and visitors come
finding, bike parks etc. OPTIONS into the CBD from locations such
as Frankton and Kelvin Heights.
Road-based options for transport Commencing in the financial year
CARPARK FACILITY
will always be limited by 2020/21 the draft plan includes
ESTIMATED Queenstown’s situation between $6.1M for the provision of a ferry/
INDICATIVE COST lake and mountains. So it’s water taxi network infrastructure to
COMPLETION
important to invest in alternatives be completed by mid-2025.
Boundary Street that don’t rely on the road network
$18.3M 2020 and may be more sustainable or INFRASTRUCTURE DEVELOPMENT
Ballarat Street promote a healthy lifestyle.
ESTIMATED
$25.8M 2021 INDICATIVE COST
Active transport methods, such COMPLETION
Parking management system as cycling and walking is a key Wakatipu ferry
$3.9M 2020 to 2021 part of the Queenstown Integrated
Transport System Plan and has $6.1M 2025
been a focus of Wanaka’s strategic
The cost is included in this draft travel thinking. Details of projects
but the Council is committed that deliver improved signage, QUEENSTOWN STREET
to considering whether we shared paths and upgrades to UPGRADES
can partner with private sector existing Queenstown access routes
investors to provide these buildings are closely aligned with the delivery Part of creating liveable, accessible
or alternatives. of the arterial routes, such as new town centres lies in ensuring it’s
shared cycle and pedestrian paths an environment people want to
PUBLIC TRANSPORT on Man Street and Thompson spend time in, with pedestrians
Street. A phased programme is prioritised. No significant upgrades
Following the November 2017 planned to begin in 2018 and have been made to many of the
introduction of the $2.00 bus complete in 2024 at a total cost proposed Queenstown locations
service in partnership with the of $23.5M. One notable project is for more than two decades. It’s
Otago Regional Council, QLDC an upgrade to the Park Street to timely to plan an upgrade as part
continues to encourage and Hotops Rise cycle lane at a cost of of the Queenstown Town Centre
facilitate the use of public transport $7.4M due for completion by 2020. Masterplan. The projects planned
as a sustainable alternative to as part of this upgrade programme
private car use, which includes the Beyond the town centres, QLDC ($49.5M in total) include the
development of bus priority lanes will look to identify and implement widening of footpaths on Stanley
in key corridors such as Stanley an on- and off-road connected Street and Shotover Street,
Street. For public transport to be pedestrian and cycle network (see upgrading Camp Street to include
10 YEAR PLAN 2018–2028 [ CONSULTATION DOCUMENT ]
a realistic choice for visitors and Wanaka Masterplan). This responds a new cycle lane, developing
commuters it must be efficient to a growing community vision Rees Street, Lower Brecon Street
with access to the heart of the that this network would connect: and the pedestrianised portion
town. The proposed arterial all schools; major transport hubs; of Beach Street into shared open
routes are essential in delivering residential and business areas. In spaces, and also upgrading Athol
this high quality level of service, Queenstown, destinations that are Street and Brecon Street (from the
so the programme for a new likely to be within the networks Gondola to Man Street). Details of
dedicated transport hub follows the include Arthurs Point, Fernhill, Lake costs (which assume a 41% NZTA
completion of stages one and two Hayes, Shotover Country, Frankton, subsidy) and project completions
of the arterials. This sees design Kelvin Heights, and Jack’s Point. are available in the draft plan.
and construction underway in 2021
and the new facility completed ALTERNATIVE TRANSPORT OPTIONS STREET UPGRADES
by June 2023. Costs for the
construction of a transport hub ESTIMATED ESTIMATED
INDICATIVE COST INDICATIVE COST
COMPLETION COMPLETION
$23.5M 2019 to 2024 $49.5M 2019 to 2026 [ 17 ]QUEENSTOWN COMMUNITY Although this draft plan does not
HEART include funding for built facilities COMMUNITY HEART
(the exception is funding for the
The Queenstown Masterplan replacement of the Memorial Hall ESTIMATED
INDICATIVE COST COMPLETION
identifies that the Stanley Street $10.9M, should the new arterial
site, partly Council reserve and require the hall site) it does include Memorial Hall Replacement
partly Ministry of Education land funding for planning the site ($516k). $10.9M 2019 to 2021
is the preferred location for a Further research into community
community heart, including arts needs and the future of arts and Planning
and culture facilities. The plan has culture across the district will enable $0.5M 2018 to 2019
identified that co-locating these the Council to plan how it should
facilities with the Council building respond. This is not simply about
and library will create a vibrant built structures, but will inform future
cultural centre in the CBD. decisions relating to prospective
facilities for both Wanaka and
Queenstown and define what these If the fu
nding a
may look like. not sup ssumpt
p ions are
agree th orted (NZTA) d
at Coun o
cil re-pr you
some p ioritise
rojects?
Options
Given the significance of the proposed investment and the need to partly rate fund the projects, it is important to
emphasise that the community does have options. It’s important that the community’s preferences are identified
through the submissions process. If NZTA funding assumptions are incorrect, or a Central Government partnership
eventuates to fast-track projects, it is possible to invoke options other than the preferred one (refer to Introduction).
ADDITIONAL ROADING RECREATION
INDICATIVE QLDC
DESCRIPTION WHAT’S DELIVERED ANNUAL RATE RATE
COST DEBT RATES INCREASE INCREASE
1 Complete the Partial delivery of the Masterplan, partially $327.7M $157.4M $5.0M 54.55% 24.11%
programme achieving the economic benefit of this
outlined in within the ten years
draft plan – Defers upgrades to public areas such as
the Council’s the Village Green and Earnslaw Park, plus
preferred street upgrades such as some pavement
option widening
2 Defer stage Town centre access issues only partially $243.6M $131.3M $4.0M 44.88% 16.40%
three of the addressed with high levels of traffic
arterials congestion anticipated, particularly in
programme Shotover Street
Shotover Street upgrades deferred
No investment planned for Village Green,
Earnslaw Park, St Peter’s Church
Greatly reduces the economic benefit of the
Masterplan and benefit to the community
10 YEAR PLAN 2018–2028 [ CONSULTATION DOCUMENT ]
3 Complete Full Masterplan delivered within the ten $409.5M $212.4M $7.7M 79.44% 44.83%
the full year period, realising the full economic and
programme community benefit.
4 Complete No enhancements for public transport $37.5M $28.7M $0.4M 4.85% 0.32%
minimal Only one parking building delivered
transport
Full arterial roading programme deferred
and parking
with high levels of traffic congestion
changes only
anticipated throughout the town centre
No investment planned for Village Green,
Earnslaw Park, St Peter’s Church
Street upgrades and pedestrianisation
deferred
[ 18 ]How do we propose to pay for the
BIG ISSUE 2
Queenstown Masterplan
The $327.7M Queenstown In order to ensure that future Council considered it was
Integrated Transport Strategy generations continue to pay for important to agree what would
includes some of the assumptions the benefit of the investment, a 30 be fair and equitable and who
we’ve already outlined in relation year repayment period has been would benefit the most from this
to NZTA funding. Of the total, our modelled, amounting to $3.5M per significant investment.
assumption is that the QLDC share annum (including 5% interest). This
is $157.4M in increased levels impact will not come into effect for
of service. Some elements like at least three years but we cannot
parking buildings are 100% cost consult on the programme without
recoverable (i.e. paid for by revenue consulting on how we propose to
or income) but for the balance we pay for it.
will need to apply this cost in some
form to rates.
Do you
agree w
the pre
ferred fu ith
nding
model?
Options
This draft plan contains two options for funding our share. The indicative rates increases for
the range of properties are included in the table on page 14. It should be noted that both
options have significant implications for rate increases.
1
OPTION 1: Rates recovery focused on wider CBD The increases for properties within the wider town
ratepayers (preferred option). centre area are significant in some instances
depending on the capital value. Residential
The Council has determined that the CBD would properties show increases of between 6.2% to
benefit the most from the investment. Option one 15.4%, commercial from 14.7% to 30.3%, and
is to create a new Queenstown CBD Transport accommodation from 15.0% to 19.1%. The impact
Improvement Rate. This rate seeks to recover 65% is reduced for properties outside of the wider town
of the cost from the wider CBD ratepayer and 35% centre area. Residential shows increases between
from the wider Wakatipu ratepayer. You can view 1.4% and 3.6%, commercial from 3.4% to 7.0%, and
the detailed map online (www.qldc.govt.nz) which accommodation from 3.5% to 4.4%.
highlights a definitive wider CBD zone (this includes
from Gorge Road through to One Mile and short
section of Frankton Road). This option is Council’s
preferred approach to fairly apportioning the cost of
these projects (see page 20 for indicative map).
2
OPTION 2: Apply costs to the existing Wakatipu The impact under this option would also see
Roading Rates. significant increases for some properties depending
on capital value, residential property increases would
10 YEAR PLAN 2018–2028 [ CONSULTATION DOCUMENT ]
Option two is to apply the cost to the existing be between 2.9% and 7.2%, commercial from 6.8%
Wakatipu Ward Roading Rate. This option gives no to 14.7%, and accommodation from 7.0% to 8.9%
weighting to those properties which benefit most.
(see Rates Impact of Major Projects by Property Type for full details of the rates impact)
It should be noted that these options may need to be revisited if the NZTA funding assumptions are not met.
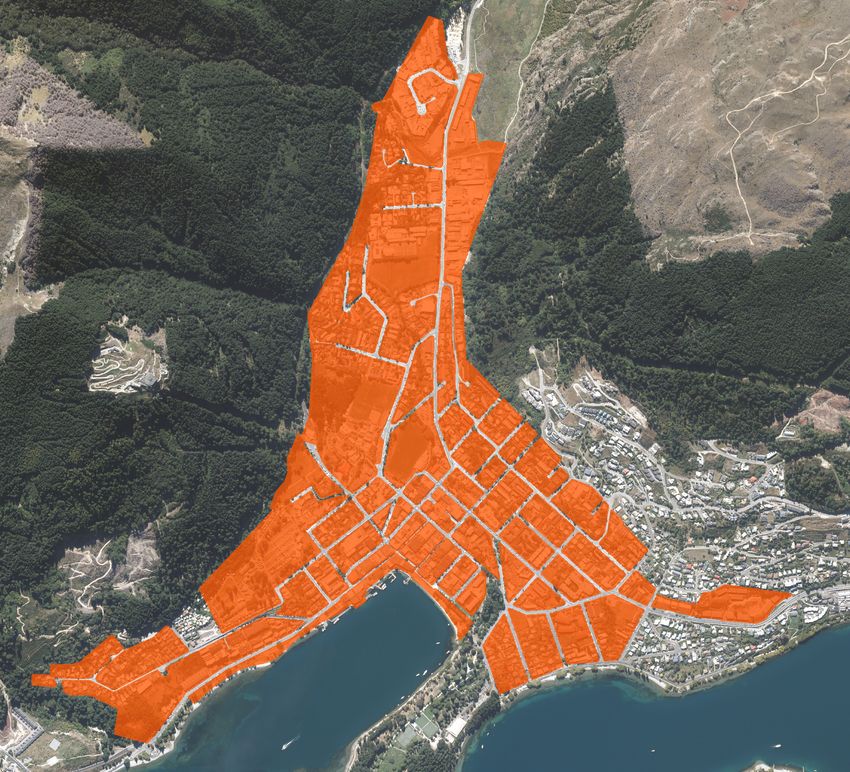
[ 19 ]WIDER CBD ZONE FOR OPTION ONE
The proposed wider CBD zone indicated above will fund 65% of the cost of the Queenstown Town Centre
Masterplan. The remaining 35% will be recovered from the wider Wakatipu ratepayer.
10 YEAR PLAN 2018–2028 [ CONSULTATION DOCUMENT ]
[ 20 ]BIG ISSUE 3 Project Connect and library proposal
Since 1989 consecutive Councils Two of the four occupied offices In 2015 the Council engaged
have considered, scoped are community-owned, including Colliers International to undertake
and designed Queenstown 10 Gorge Road (a former working a full investigation of options and
Lakes District Council office men’s club) and Stanley Street. costs, including a Frankton-based
accommodation projects but There are costs associated in office, a joint venture project, lease
none have been built. Arguably a maintaining the two owned options and community owned
community-owned property has buildings, and saving from solutions. This report formed
been historically seen as a legacy not having to lease property the basis for the February 2016
building for future generations. elsewhere. This opportunity Council decision that identified
In December 2017 the current cost is approximately $417k per the preferred office location as
Council led by Mayor Jim Boult annum. The cost of leasing staff being the Queenstown CBD,
agreed to include funding for such accommodation (Church Street developed on a Council-owned
a building in this draft Ten Year and Shotover Street), including car site. This decision has been further
Plan. The intention to address the parking leases for council fleet, is in endorsed by the current Council,
existing challenge of staff spread excess of $600k per annum. which shares the view that moving
throughout four different buildings Council activity out of the town
located in the four corners of the The Council moved into the Gorge centre (which will be followed by
CBD and the resultant less-efficient Road office in 1999. It was found to associated professional activity)
customer service delivered to our be marginally above the percentile will impact the dynamic and
community, has been signalled for earthquake prone buildings in authenticity of the CBD. This is a
through the 2016-2017 and 2017- 2015, which forced the Emergency clear Council mandate.
2018 Annual Plans. Operations Centre to be relocated
to the Queenstown Event Centre. In In 2017 the Council developed an
the same year the Council resolved indicative business case for the
that the Council building, which building under the working title of
includes the Queenstown Library Project Connect.
and Council Chamber, was not fit
for purpose. The case, which was also
considered by the Council in
December 2017, identifies that
in order to meet the future needs
of the Council a building of 4,200
square metres in floor space would
be required.
Do you
su
the fund pport
ing for a
Council
Office?
10 YEAR PLAN 2018–2028 [ CONSULTATION DOCUMENT ]
[ 21 ]Do you
agree th
should at this
include
dedicat an inter
ed Que im
library s enstown
pace?
Consolidating the Council in one CBD INTERIM LIBRARY
location will provide operational
efficiencies and the service that the Project Connect will enable Options
community deserves. capacity for an ‘interim’ library
space of approximately 600 square 1
Detailed costings for Project metres to be developed within the OPTION 1: Council-owned
Connect arrived at a figure of footprint of the proposed Council building on Council-controlled
$42.3M investment in increased building whilst a dedicated library land (preferred option)
level of service and this figure has space in the CBD is identified and
The Council has decided to
been included in the draft plan. proposed. It will also enable the
include funding for a Council-
This is a change to the 2015-2025 new building, which will include the
owned building on Council-
Ten Year Plan. The business case Council Chamber, an Emergency
controlled land in the draft
also considered site options with Operations Centre, a dedicated
plan; this is Council’s preferred
the preferred site being situated ‘one stop shop’ customer
option. Note this option does not
on Stanley Street, in line with the service hub and a library to be
necessarily preclude Council from
Queenstown Town Centre Master accessible, vibrant and very much
entering into an alternate funding
Plan. a community space.
arrangement (e.g. a joint venture,
but the level of debt will remain in
The value to the community of the draft plan).
the building will be considerably COST INCLUDING SHORT TERM
greater than this cost because (5 YEARS) LIBRARY
the Council intends building on 2 OPTION 2: Lease one building
Indicative costing $42.3M
Council-controlled land. While
the plan has fully funded the new The Council could revisit the
building, this does not preclude the EFFECT ON RATES funding decision and opt to
Council from seeking an alternate pursue the lease of one building
Increase of 0.5% to 3.3%
funding arrangement, for example a and include only lease costs in
from 2022*
joint venture. However the Council the draft plan. This would be
is required to show the true cost a shift from Council owning a
SAVINGS IN LEASE COST community asset and carries the
of the project in its accounts for
transparency, therefore the level $600,000 per annum risk of Council failing to find a
of debt shown in the draft plan suitable long-term solution in the
remains the same. In terms of CBD, as mandated.
ESTIMATED PARTIAL COST OFFSET
cost implications, councils are THROUGH SALE OF 10 GORGE ROAD
able to secure very favourable 3
loan margins through the Local $9.2M OPTION 3: Continue in multiple
Government Funding Agency leased buildings
(current weighted average 4.28% IMPACT ON DEBT
per annum). Loan funding a Council The Council could choose to
building is therefore likely to be the Increase of $33.1M continue to lease multiple spaces
most affordable way of Council across town as staff grows.
owning a building that represents * The indicative rates increases for a range
This option also carries the risk
a key community asset in the long of properties are included in the table on that Council may not be able to
page 14. continue to find suitable long-
term.
term leasing solutions in the CBD.
10 YEAR PLAN 2018–2028 [ CONSULTATION DOCUMENT ]
BIG ISSUE 4 Wanaka Masterplan
The Council prioritised the In Wanaka the population (resident in 2018 to 59,638 in 2028. That’s
Queenstown Town Centre and visitor) on an average day over 20,000 more than the current
Masterplan in 2017 to address is expected to increase from total population for the district.
urgent issues such as traffic an estimated 20,436 in 2018 to Clearly this will create a challenge
flow and visitor growth. Wanaka 26,779 in 2028. However on peak for the town in terms of traffic flow,
requires its own strategic town days during the summer season parking, waste and 3 waters.
centre masterplan to address in particular this increases from
predicted growth. an estimated average of 46,939
[ 22 ]Investigations are currently be critical that the Masterplan WANAKA PARKING
underway to commence a Wanaka programme delivers a strategic
Town Centre Masterplan and and connected approach to funded With a sustained increase in
Council has included $500k in key projects including the Wanaka visitor numbers, particularly during
the draft plan in 2018 to deliver a Active Travel Plan, the Wanaka holiday periods, parking capacity
plan. Wanaka is unique and the Lakefront Development and in Wanaka falls significantly short
approach will need to reflect and Wanaka Parking Projects. of the demand, which has knock-
capture that uniqueness. There on effects of damage to reserves
are benefits to Wanaka from being WANAKA ACTIVE TRAVEL and creates a poor experience
able to learn from the Queenstown for both residents and visitors.
model. This project will take a Wanaka is now subject to a With the possibility of subsidising
broad, strategic view from the business case around its alternative construction cost through private
outset. This will develop a “big travel (community-led) innovation partnership, $11.3M has been
picture” that includes input from to commence in 2018, and $1.5M allocated to parking improvements
the active transport communities, has been allocated across the for Wanaka in the draft Ten Year
Shaping Our Future projects, and draft plan to enable Wanaka active Plan commencing 2019-2020 and
existing plans and strategies such transport, using methods such as completing by 2024.
as Wanaka 2020. cycling. In addition to this, $4.1M
has been included for “shared
The consultation will need to mode spaces” as part of the
be inclusive giving the Wanaka Wanaka Masterplan programme, Options
community a chance to help shape and $820k for tracks development.
what their town looks like in the Similar to the Queenstown
future. We recognise it needs to alternate transport options these 1
OPTION 1: Support the
balance the needs of a growing extend beyond the Wanaka CBD
development of a Wanaka
community that is increasingly to include connections for Hawea,
Masterplan in 2018 to
seeing the pressures of a popular Albert Town and Luggate.
enable a strategic and well
tourist destination. That planning
connected approach to
has to include solutions for parking, WANAKA LAKEFRONT
Wanaka planning including
public transport, shared vehicle DEVELOPMENT
parking, active travel,
and pedestrian access, alternative
transport and the Lake
transport methods, arts and The Council previously consulted
Front Upgrade (preferred
culture, civic facilities and routes on a draft Wanaka Lakefront
option).
such as dedicated cycle pathways. Development Plan in December
2015-January 2016, detailing
Public transport services in alternative parking layouts, an 2
and around Wanaka would be events space, new boating facilities OPTION 2: Set
delivered by the Otago Regional and improved pedestrian and cycle aside investment and
Council and need to be supported ways. The final plan is due to begin wait until growth in
by a compelling business case. implementation in 2018 and $6.3M Wanaka becomes more
However any masterplan for has been allocated in the draft challenging. This option
Wanaka must accommodate a plan. runs the risk that various
public transport system given the scheduled projects
reality of a growing town with many Whilst there is a lot of support for will not be aligned and
visitors and workers travelling in the implementation of the existing complementary.
daily from Hawea, Luggate and Wanaka Lakefront Development
other outlying locations. It will Plan, it will be important to
integrate it into the Masterplan
which is likely to result in a more
COST coherent and cohesive overall Do you
10 YEAR PLAN 2018–2028 [ CONSULTATION DOCUMENT ]
develop suppor
$0.53M
design for Wanaka. There are ment of t the
some aspects of the plan that may Masterp a Wana
lan in 2 ka
be able to be separated from the enable 018 to
a
EFFECT ON RATES larger strategy that would deliver well con strategic and
nected
benefit to residents and visitors to Wana approac
Mimimal ka plan h
immediately without detracting ning?
from the big picture.
IMPACT ON DEBT
Increase of $78k
NZTA SUBSIDY
51%
[ 23 ]You can also read


