Regulations, Policies and Initiatives on E-Commerce and Digital Economy for APEC MSMEs' Participation in the Region - APEC Electric Commerce ...
←
→
Page content transcription
If your browser does not render page correctly, please read the page content below
Regulations, Policies and Initiatives on
E-Commerce and Digital Economy for
APEC MSMEs' Participation in the Region

APEC Electric Commerce Steering Group
March 2020
APEC Project: ECSG 02 2018

Produced by

Ministry of Industry and Trade

25 Ngo Quyen, Hoan Kiem, Ha Noi, Viet Nam

For

Asia-Pacific Economic Cooperation Secretariat

35 Heng Mui Keng Terrace

Singapore 119616

Tel: (65) 68919 600

Fax: (65) 68919 690

Email: info@apec.org

Website: www.apec.org

© 2020 APEC Secretariat

APEC#220-CT-01.3

** The views expressed in this paper are the views of the authors and do not reflect the views and
  policies of APEC Economies.

                                                                                                     2
TABLE OF CONTENTS

CHAPTER 1: INTRODUCTION ............................................................................................................. 5
 I. Background ....................................................................................................................................... 5
 II. Research Objectives and Research Questions ............................................................................... 5
 III. Methodology .................................................................................................................................... 5
 IV. Structure of Research ..................................................................................................................... 6
CHAPTER 2: GLOBAL AND REGIONAL DEVELOPMENT OF ............................................................ 7
E-COMMERCE AND DIGITAL ECONOMY ........................................................................................... 7
 I. Current status of and trends in e-commerce ..................................................................................... 7
 II. Current status of and trends in digital economy ............................................................................... 9
      1. Digital markets.......................................................................................................................... 10
   2. Trends in digital technologies ................................................................................................... 17
CHAPTER 3: POLICIES AND INITIATIVES FOR E-COMMERCE ..................................................... 30
AND TRADE RELATING DIGITAL ECONOMY ................................................................................... 30
 I. Policies and Initiatives for e-Commerce .......................................................................................... 30
       1. Electronic Transaction and Electronic Signature Legislation ................................................... 30
       2. Consumer Protection Legislation in E-commerce .................................................................... 34
       3. Review of Privacy, Data Protection and Cyber-crime Legislation in APEC ............................. 38
      4. Review of Dispute Resolution in APEC.................................................................................... 43
 II. Policies and Initiatives for Digital Economy.................................................................................... 47
       1. Australia ................................................................................................................................... 47
       2. Canada ..................................................................................................................................... 50
       3. China ........................................................................................................................................ 51
       4. Hong Kong, China .................................................................................................................... 52
       5. Japan ........................................................................................................................................ 52
       6. Republic of Korea ..................................................................................................................... 54
       7. New Zealand ............................................................................................................................ 55
       8. Papua New Guinea .................................................................................................................. 57
       9. Russia....................................................................................................................................... 58
       10. Singapore ............................................................................................................................... 59
       11. Chinese Taipei ....................................................................................................................... 61
       12. United States .......................................................................................................................... 62
CHAPTER 4: BEST PRACTICES AND CASE STUDIES .................................................................... 66
 I. Republic of Korea ............................................................................................................................ 66
       1. Focusing on digital skills........................................................................................................... 66
       2. Enhancing start-up entrepreneurs with enterprise-level chaebol platforms ............................. 67
       3. Establishing an important position in the innovation ecosystem .............................................. 67
 II. Australia.......................................................................................................................................... 71
CHAPTER 5: WAY FORWARDS ......................................................................................................... 75
 I. Update Domestic Legislations for Digital Economy as a Solution and Raise Consumer’s and
 Business’s Awareness ....................................................................................................................... 75
 II. Promote Coherency and Interoperability among Different Legislations ......................................... 75
 III. The Need for A Greater International Collaboration ..................................................................... 76

                                                                                                                                                         3
TABLE OF FIGURES
Figure 1: Global e-Services revenue forecast, billion US$ ................................................................... 10
Figure 2: Top 5 e-Services markets by market revenue, billion US$ ..................................................... 11
Figure 3: Global eTravel revenue, billion US$ ....................................................................................... 11
Figure 4: Top 5 eTravel markets by market revenue, billion US$ .......................................................... 12
Figure 5: Global Digital Media revenue forecast, billion US$ ................................................................. 12
Figure 6: Top 5 Digital Media markets by market revenue, billion US$ ................................................. 13
Figure 7: Global FinTech transaction value, billion US$ ........................................................................ 13
Figure 8: Top 5 FinTech markets by Digital Payments transaction value, billion US$ ......................... 14
Figure 9: Global Digital Advertising revenue forecast, billion US$ ......................................................... 15
Figure 10: Top 5 Digital Advertising markets by market revenue, billion US$ ....................................... 15
Figure 11: Global Smart Home revenue forecast, billion US$ ............................................................... 16
Figure 12: Top 5 Smart Home economies by market revenue, billion US$ ........................................... 16
Figure 13: Estimated global Connected Car revenue in billion US$ ...................................................... 17
Figure 14: Top 5 Connected Car economies by market revenue, billion US$ ....................................... 17
Figure 15: Global industrial robot sales .................................................................................................. 19
Figure 16: Growth of big data ................................................................................................................. 26
Figure 17: Forecast of Big Data market size, based on revenue, from 2011 to 2027 ........................... 26
Figure 18: Big data and business analytics revenue worldwide 2015-2022 .......................................... 27
Figure 19: Revenues from the artificial intelligence (AI) market worldwide from 2015 to 2024 ............. 28
Figure 20: the leading economy in AI patent application ....................................................................... 29
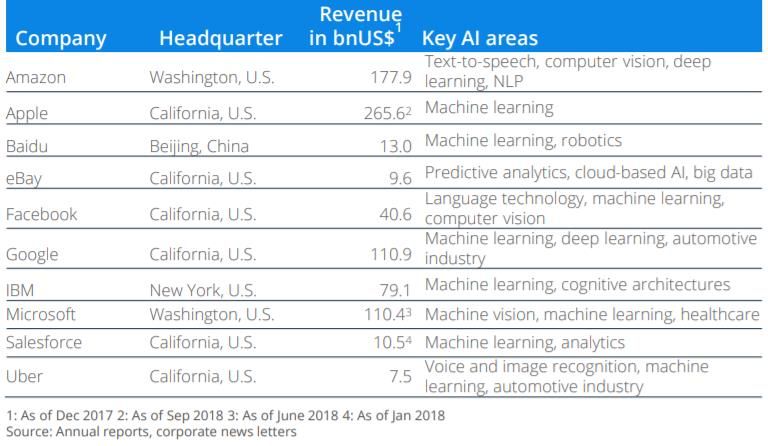
Figure 21: Comparison of selected leading AI companies ..................................................................... 29
LIST OF TABLES
Table 1: A selective taxonomy of robotics technology: what they are, what they do, and where they
work ........................................................................................................................................................ 20
Table 2: Applications of IoT in life at different levels .............................................................................. 23
Table 3: Electronic Transaction & Electronic Signature Legislation in APEC ........................................ 30
Table 4: Types of e-signatures recognized by law in APEC economies ............................................... 33
Table 5: Consumer Protection Legislation in APEC ............................................................................... 34
Table 6: Privacy – Cybercrime/Cyber security Laws and relating regulations ....................................... 38
Table 7: Dispute resolution in APEC economies ................................................................................... 44
LIST OF BOXES
Box 1: New Zealand ’s Consumer protection in e-commerce ................................................................ 37
Box 2: Case study of a SME to make innovative Internet of Things (IoT) ............................................. 68
Box 3: Case study of digital information to connect trade transactions ................................................. 73
4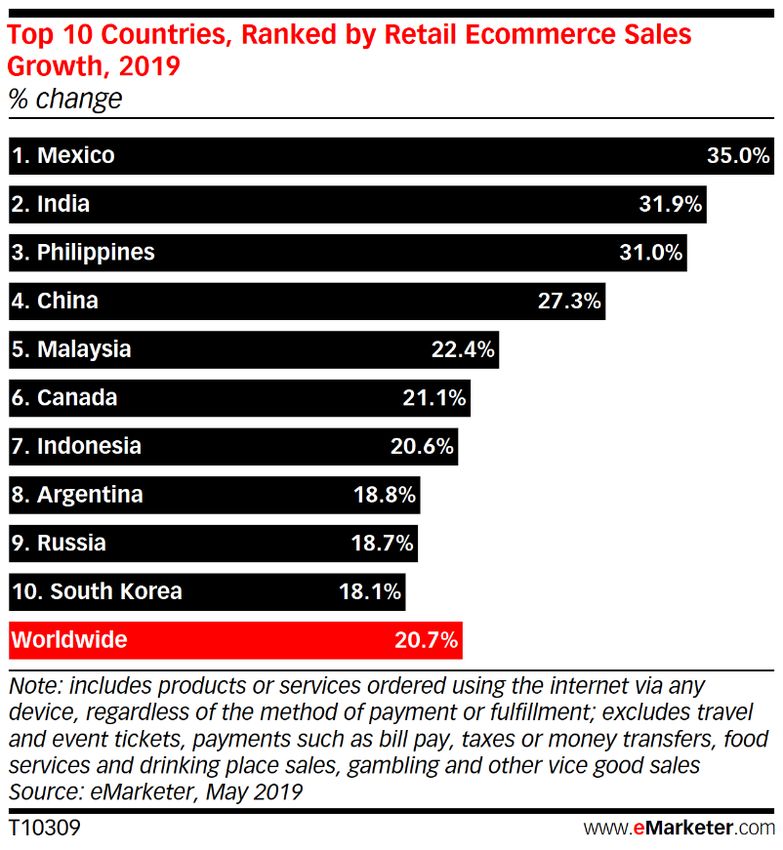
CHAPTER 1: INTRODUCTION

I. Background
Digital technologies are spreading throughout the world at a faster pace than previous waves of
technological innovation and are re-shaping business models and sectors. This transformation includes
emergence of the digital economy. Defined as “that part of economic output derived solely or primarily
from digital technologies with a business model based on digital goods or services”, the digital economy
is estimated to make up around 5% of global GDP and 3% of global employment. Indeed, the digital
economy has enabled fast revenue growth for many firms; encouraged the shift from tangible flows of
physical goods to intangible flows of data and information; enabled firms in developing economies to
connect across borders; and has thus facilitated a surge in cross-border data flows
The Asia-Pacific region is host to some of the fastest growing economies in the world with rapid rates of
e-commerce expansion and growth in digital trade. There is however within APEC a ‘digital divide’ in
the region’s infrastructure landscape, which might cause a ‘new underclass’ of the disconnected. Taking
a boarder perspective of digital divide that refers to social and economic stratification due to unequal
ability to access, adapt and create knowledge via use of information and communication technologies,
without the advantages on infrastructure, human resources, capital investment and an enabling policy
environment, the developing economies are at the danger of being left behind if the governments don’t
have proper actions to promote growth and innovation. There is a whole set of challenges are
“preventing the digital revolution from fulfilling its transformative potential” in developing economies;
including the potential outlined for digital economies. These create the backdrop of problems to which
policy solutions are required; and they will here be categorized in terms of digital infrastructural
challenges, digital ecosystem challenges (human, institutional) and digital economy dis-benefits.
The digital economy is of increasing importance to developing economies. Yet digital economy reality is
undershooting its potential in these economies, due to a series of challenges. Digital infrastructure is in
part incomplete, costly and poorly-performing. The wider digital ecosystem suffers a shortfall in human
capabilities, weak financing, and poor governance. Growth in the digital economy offers opportunities
for MSME participation in regional economies, but it is necessary to have insights on the details of the
innovative, regulatory, and incentive about e-commerce and trade related digital economy policies of
developed economies to get the advantages of the digital revolution.

II. Research Objectives and Research Questions
The research aims to provide information on policies, initiatives and best practices to develop the e-
commerce and trade related digital economy: The research draws on wide ranging desk research and
interview with experts and policymakers in developed economies to uncover successful policies to assist
and encourage MSMEs to participate in the regional market via e-commerce and trade related digital
economy.
To meet the above-mentioned objective, there is a set of questions to be address as follows:
1. What is the current status of e-commerce and digital economy development in global and regional
scale?
2. Which polices and initiatives that APEC members applied to develop e-commerce and digital
economy?
3. What are the outcomes of those polices and initiatives or how the private sector response to those
policies and initiatives?
4. What will be the policy implications for the APEC region to fully utilize the benefit of e-commerce and
digital economy?

III. Methodology
                                                                                                         5
Fieldwork researches were conducted in two members including Australia and Korea in July 2019.
During the fieldwork trips, the expert had several fruitful discussion and in-depth interview with these
members’ governmental official working in e-commerce and digital economy field. Through the
discussions and interviews, the expert collected adequate and efficient information and data concerning
2 members’ e-commerce and digital economy development experiences: what is the background of the
drafting policies process; which stakeholders involving in the preparation of policies and their role; which
implementation plans are applied at the moment and the outcome.
Desk study has also been conducted to collect and systemize available information and data to serve
the research design in particular and the research purpose in general. Information collected from various
sources such as government, organizations, reference materials available on the internet and in libraries,
etc. includes:
1. Previous studies on the development of e-commerce and digital economy
2. Information on current development of e-commerce and digital economy
3. Information on the policies and initiatives that governments applied to develop e-commerce and digital
economy

IV. Structure of Research
The report is composed of five chapters. Chapter I describes the background of the research, identifies
the research objectives, research questions, and introduces research methodology. Chapter II analyzes
the overview of the e-commerce and digital economy over the world with a focus on current trend and
development of the subject. Chapter III reviews the policies and initiatives for e-commerce and digital
economy in APEC region to provide an overall picture of which potential policies other governments
might choose to draw lessons. Chapter IV attempts to provide case studies on stakeholders from the
private sector that are active in implementing the domestic strategy of digital transformation. Chapter V
wraps up the research report with some policy implications that are applicable for members interested
in developing e-commerce and digital economy.

                                                                                                          6
CHAPTER 2: GLOBAL AND REGIONAL DEVELOPMENT OF
                    E-COMMERCE AND DIGITAL ECONOMY

I. Current status of and trends in e-commerce
According to eMarketer, the global retail market will rise by 4.5% to US$25.038 trillion in 2019. At the
same time, it represents a marked decline from the previous years, when growth rates of global retail
sales range between 5.7% and 7.5% each year1.

This retail sales slowdown over the past two years reflects growing economic uncertainty and a
dampening economic environment across economies.
It is estimated that the global retail ecommerce sales will rise 20.7% in 2019 to $3.535 trillion. Despite
its strong growth rate, 2019 will witness a decline from two years preceding that, when the industry grew
28.0% and 22.9% in 2017 and 2018, respectively. By 2021, global retail ecommerce revenue will be
estimated to stand at $5 trillion, though growth rates will see a decline to the 20% threshold beginning
in 2020.
Despite the cooling off of China’s previously hot consumer economy, Asia-Pacific will still be the fast
growing ecommerce market in 2019. The region is expected to grow 25.0% to $2.271 trillion, making up
64.3% of global ecommerce spending. Latin America and Middle East/Africa will identically experience
growth rates of 21.3%, surpassing the global average, while North America and Western Europe grow
at slower pace (14.5% and 10.2%, respectively).

1
 https://www.emarketer.com/content/ecommerce-continues-strong-gains-amid-global-economic-
uncertainty?ecid=NL1014&fbclid=IwAR2RCsXK235_TB2rosnROKLezjcpO-qX4ZdPVReir7TJXA4C77fiXcM7ogHc
                                                                                                        7
Six of the top 10 fastest-growing ecommerce economies in 2019 come from the Asia-Pacific region, led
by India and the Philippines at growth rates of more than 30% growth and followed by China, Malaysia,
Indonesia and Republic of Korea. Latin America enters the top 10 with Mexico being the fastest growing
economy with a growth rate of 35% and Argentina raking the 8th place with a growth rate of 18.8%. Even
more mature regions for ecommerce like North America (Canada, 21.1% growth) and Europe (Russia,
18.7% growth) claimed spots in the top 10.

In 2019, China will be the leader of the global B2C retail ecommerce market, with the revenue of
US$1.935 trillion which is more than three times greater than the US at the 2 nd place with a revenue of
US$586.92 billion. Since 2013 when China surpassed the US in ecommerce sales for the first time, the
economy has quickly widened the margin. On its own, China makes up 54.7% of the global ecommerce
market, a share nearly twice that of the next five economies combined.

                                                                                                      8
Three of the top 10 ecommerce markets coming from Western Europe, led by the UK ($141.93 billion),
followed by Germany ($81.85 billion) and France ($69.43 billion), but these mature markets are growing
at year-over-year rates well below the growth rate of global ecommerce.
Canada’s relatively advanced Internet market continues to record a strong growth rate of 21.1% to
$49.80 billion in 2019. Despite Canada’s overall digital maturity, logistical inefficiencies due to its
geographically dispersed population from western to eastern borders making establishment of
ecommerce distribution centres and delivery capabilities more cost-prohibitive have traditionally
hindered e-commerce. Recent improvements are now helping shift spending online at an accelerated
rate.
India is the fastest-growing ecommerce market among the top 10 with a growth rate of 31.9% to $46.05
billion in sales this year. Despite being the largest economies in the world, India’s ecommerce market is
relatively nascent largely resulting from a lower-income population and still-emerging infrastructure to
support payment and delivery.
Cross-border e-commerce

Cross-border e-commerce is also increasing in popularity with both retailers and consumers. According
to a survey by Payvision and Juniper Research in August 2017, over 80% of retail professionals
worldwide said that cross-border ecommerce has been profitable, while 31% strongly agreed with the
statement.2
A report by Zion Market Research reveals that the global cross-border B2C e-commerce revenue stood
at US$ 562.1 billion in 2018 and is expected to amount USD 4,856.1 billion by 2027, growing at a CAGR
of 27.4% between 2019 and 2027.3
According to International Post Corporation, 38% of the parcels bought cross-border in 2018 were
purchased from China. Marketplaces are the most popular for cross-border purchases. Digital retailers
from which cross-border digital buyers worldwide made their most recent cross-border digital purchase
are Amazon (23%), Alibaba (16%), eBay (14%) and Wish (10%).

II. Current status of and trends in digital economy
Digital markets have a crucial role to play in the world economy but vast differences exist in the maturity
and digital services availability in each region and even more each economy.
The European and North American economies are often highly mature in digital economy, but many of
the Asian economies are currently making progresses and catching up. The fast adoption of digital

2
    https://www.emarketer.com/content/for-many-retailers-cross-border-ecommerce-is-profitable
3
    https://www.zionmarketresearch.com/report/cross-border-b2c-e-commerce-market
                                                                                                         9
media and digital payments in these economies leads to a different usage behavior, as interacting online
and being online gains an unprecedented “normality”. This in turn leads to different market structures,
which have large impacts on the size and development of the digital markets.
But the preconditions required for successful digitalization of markets vary between economies. While
European and North American economies have very high Internet penetration rates of up to 94%, Asia
and Africa are far behind. In addition, the availability and price of Internet influences the degree of
digitalization. While the broadband subscriptions per capita and the average connection speed are on a
constant rise, a lot of people still do not have access to Internet or web-enabled devices.
1. Digital markets

This part presents an overview over a variety of digital markets, including market revenue sizes, user
developments and current trends.
1.1. E-services
Recent years have witnessed an explosion of e-service business thanks to the ubiquitous use of the
Internet and mobile phones. The e-Services market includes four segments: Online Food Delivery,
Event Tickets, Fitness, and Dating Services (Figure 1). The global e-Services revenue stood at US$ 168
billion in 2018 with Online Food Delivery accounting for the largest share, followed by Event Tickets.
Fitness and Dating Services recorded smaller revenue compared to Online Food Delivery and Event
Tickets. The same trend is seen in the years to come.
                     Figure 1: Global e-Services revenue forecast, billion US$

In terms of geography, 5 economies leading the e-services market include the US, China, India, United
Kingdom and Germany (Figure 2). The US and China remained occupy first two place during 2017 –
2018 period, far ahead of 3 remaining economies in the top 5. The e-Services market grew in these top
5 economies by more than 8% during the same period with India leading with a growth rate of 20%.

                                                                                                     10
Figure 2: Top 5 e-Services markets by market revenue, billion US$
1.2. E-travel
The e-travel market is a hot topic when it comes to digitalization and heavily disruptive changes within
traditional industries. eTravel services enable customers to choose their travel experience from various
deals offered by different providers and provide them with tools to make quick and easy comparison of
prices. Revenue in the eTravel market amounts to 944.9 billion US$ in 2019 and forecast to reach
1,228.4 billion US$ by 2023 (Figure 3). The eTravel market is composed of two segments: Online
Mobility Services and Online Travel Booking with Online Mobility Services being the largest segment
which has a market volume of US$ 520.2 billion in 2019.
Figure 3: Global eTravel revenue, billion US$
In terms of geography, 5 economies leading the e-travel market include the US, China, United Kingdom,
Japan and Germany (Figure 4). By volume, the US and China are the two largest markets during 2017
– 2018 period. The e-Travel market grew in these top 5 economies by more than 6% during the same
period, with China being the fastest growing market with a growth rate of 17%.
11Figure 4: Top 5 eTravel markets by market revenue, billion US$
1.3. Digital Media
The increasing number of mobile and streaming devices together with growing connection speed rates
have shifted consumers to digital media. Digital media market is segmented into four areas including
Video Games, Video-on-Demand, ePublishing, and Digital Music. The global Digital Media market
revenue amounts to US$141.7 billion in 2018 and is expected to reach US$173 billion by 2023 (Figure
5). Video Games are by far the biggest market in 2018 with a global revenue of US$77.3 billion,
representing 55% of the whole Digital Media market. Video-on-Demand ranks the second place in digital
market with a global revenue of US$30.5 billion in 2018, accounting almost 22% of the market. The next
smaller segment is ePublishing, contributing almost 15% of value of the total market. Digital Music is
the smallest segment in 2018 with the revenue of US$13 billion, making up 8% of the market.
Figure 5: Global Digital Media revenue forecast, billion US$
5 economies leading global media market include the US, China, Japan, United Kingdom and Germany.
These top 5 economies generated total value of US$90.5 billion and US$97.1 billion in 2017 and 2018,
12respectively. The US and China were the two largest markets during 2017 – 2018, while China and
Germany show the highest growth in digital media revenues during the same period.
Figure 6: Top 5 Digital Media markets by market revenue, billion US$
1.4. FinTech
Traditionally, customers go to banks when they need financial services. Now, thanks to the emergence
of Internet and advanced technology, FinTech has came and offered quick and convenient targeted
services with a range of financial solutions. FinTech, or Financial technology, refers to the integration
of technology into delivery of financial services by financial services companies in order to improve
activities in the sector. FinTech has been dramatically evolving in the last decade and has already
changed the way people spend, invest, and lend money.
The Fintech Market is composed of 4 segments which are Digital Payments, Personal Finance services,
Alternative Financing and Alternative Lending. The FinTech market value stood at US$4,436.4 billion in
2018 and was expected to amount to US$9,824.1 billion by 2023 (Figure 7). Digital Payments are by far
the largest segment in the global FinTech market, representing over 80% of the whole market in 2018
and the trend continues for the years to come. The second largest segment in FinTech market is
Personal Finance with steady growth during 2018 – 2023 period. Alternative Financing and Alternative
Lending are the two smallest segments with transaction values comparatively small.
Figure 7: Global FinTech transaction value, billion US$
13In digital Payment segment, China lead the market with transaction values of US$1.033 trillion in 2017
growing by 22% to US$1.264 trillion by 2018 (Figure 8). The US follows China with a transaction value
of US$810 billion in 2017 growing by 8% to US$878 billion by 2018. Japan, United Kingdom and
Germany are struggling to catch up.
Figure 8: Top 5 FinTech markets by Digital Payments transaction value, billion US$
1.5. Digital Advertising
It was reported that worldwide spending on digital advertising surpassed TV ad spending for the first
time in 2017, marking a major milestone in the world of advertising and the gap is expected to continue
to widen for the years to come.
Digital marketing includes 5 segments: Banner Ads, Video Advertising, Social Media Advertising, Search
Advertising and Online Classifieds. Digital ad spending will grow 68% from US$290.8 billion in 2018 to
US$489.7 billion by 2023 (Figure 9).
Search Advertising dominates digital advertising with a global market volume of US$105.2 billion in 2018,
accounting for 36% of the whole market. Social Media Advertising is expected to exceed Search
Advertising to become the leader of the market by 2020 with a global market volume of US$125.8 billion,
making up a market share of 37%. Social Media Advertising revenue rises to US$189.7 billion by 2023.
14Banner Advertising stood as 3rd largest segment with a volume of US$58.1 billion in 2018, being
projected to reach US$76.5 billion by 2023. Banner Ads and Online Classifieds are the two smallest
segments in Digital Advertising with revenue of US$30.3 billion and US$22.7 billion in 2018, respectively.
Figure 9: Global Digital Advertising revenue forecast, billion US$
The US is dominant economies in terms of digital advertising revenue with a volume of US$87 billion in
2017, making up 53% of total revenue of top 5 Digital Advertising economies. China ranked the 2nd
place in the top 5 and its Digital Advertising revenues increased by almost 20% from 2017 to 2018.
United Kingdom, Japan and Germany are struggling to catch up.
Figure 10: Top 5 Digital Advertising markets by market revenue, billion US$
1.6. Smart Home
The Internet of Things (IoT) technology is one of the emerging trends disrupting traditional industries.
As one of IoT applications, smart homes make life easier, comfortable and safer by enabling us to control
the temperature of our house from anywhere, turn lighting on and off or manage our movie and music
collection effortless, manage your life habits by monitoring how often you watch TV, what kind of meals
you cook in your oven, the type of foods you keep in your refrigerator, or maximize home security with
motion detectors, surveillance cameras, automated door locks, ect. The smart home market amounts to
15US$54.5 billion in 2018 and is expected to grow by 22% anually to reach US$152 billion by 2023 (Figure
11).
The Smart homes market is divided into 6 segments including Control and Connectivity, Comfort and
Lighting, Security, Home Entertainment, Energy Management, and Smart Appliances. Among these 6
market segments, smart appliances are the biggest market with a revenue of US$15.7 billion, making
up 29% of total global smart home in 2018 and continue their dominating trend in the years to come
(Figure 12).
Figure 11: Global Smart Home revenue forecast, billion US$
Top 5 Smart Home economies include the US, China, Germany, Japan and United Kingdom. The US
was the biggest Smart Home market in 2018 with a revenue of US$24 billion, far ahead that of China
which is at 2nd place. The Smart Home market is on the rise in all top 5 economies, with China growing
at the highest pace during 2017 – 2018 period.
Figure 12: Top 5 Smart Home economies by market revenue, billion US$
1.7. Connected Car
Another aspect to look into digital economy is Connected Car. Connected Car refers to the car equipped
with hard wares that enable internet connect, thus, enables the communication of the vehicle with other
connected cars, smartphones, and the environment. In 2018, there were more than 31 million connected
16cars newly registered, adding to a total of 119 million vehicles on the roads worldwide. The market
generated a revenue of US$18.7 billion in 2018 and continued to rise to US$31.5 billion by 2023.
Connected Car market is segmented into Connected Hardware, Vehicle Services and Infotainment
Services with Connected Hardware being the largest segment representing over 88% of the total market.
Vehicle Services and Infotainment Services are extremely small segments though their revenues slowly
increase during 2018 – 2023 period.
Figure 13: Estimated global Connected Car revenue in billion US$
The US is dominant in Connected Car market with revenue of US$5.5 billion and US$6.4 billion in 2017
and 2018, respectively. China earned the second place with a revenue of US$2.4 billion in 2017 and
rose 34% to US$3.3 billion by 2018. Though size of the markets is relatively small, EU economies show
subtential growth during the same period.
Figure 14: Top 5 Connected Car economies by market revenue, billion US$
2. Trends in digital technologies
The development of new technologies has led to the emergence of new markets and growth of related
industries. New technologies – called as disruptive ones that replace established technologies by
transforming an existing industry or create a new one - are likely to make changes to the manufacturing
and service sectors. Key digital technologies that have been driving forces for digital economy include:
17Advanced manufacturing, robotics and factory automation; block chain; Big data analytics; Internet of
things (IoT); artificial intelligence (AI).
Being capable of performing a variety of tasks and applications, and being more precise and consistent
than human workers, robots can replace human workers in several fields as they are used in industrial
manufacturing to the medical field. IoT can facilitate smart manufacturing through improved factory
operations. Big data provides firms with optimization measures in production, logistics and interaction
with customers. With capability to perform cognitive functions such as perceiving, reasoning, learning,
and problem solving, AI solutions are increasingly adopted across industries such as the automotive,
healthcare, education, finance, entertainment, and other industries. However, the transformative
potential of these technologies can only be fulfilled if and when these elements mature, become better
integrated, more interoperable, and broadly used (UNCTAD, 2017). This is unlikely to be a simple, even,
or rapid process. Some challenges presented by these technologies such as security or privacy issues
could hamper or even derail the development of the digital economy.
In this section, 4 technologies including Advanced manufacturing, robotics and factory automation; Big
data analytics; Internet of things (IoT); artificial intelligence (AI) will be discussed in details.
2.1. Advanced manufacturing, robotics and factory automation
Industrial robots have been around for decades, but we have witnessed the evolvement of robots over
time. In the past, industrial robots were fixed machine designed for repeating moves to completing a
task. Robotics and automation were brought into workplace in order to replace human in dirty, dull, or
dangerous jobs; to produce quality improvement by avoiding errors and minimizing variability; and to
lower manufacturing cost by replacing workers with increasing minimum wage with cheaper robots (Mc
Kinsey, 2017). Today’s industrial robots have improved their capabilities. Besides the above-mentioned
capabilities of the past, today’s most advanced robots have additional capabilities expanding their
operation in unstructured environments that we have never seen before.
Today, mobile robots are used for washing windows of skyscrapers. Flying robots are used to inspect
powerlines and pipelines, or to collect data for insurance claims. Wheeled robots are deployed to move
goods through warehouses. Robots are used combined with advanced analytics by engineers for
automation of mining processes. In the healthcare industry, they are helping doctors improve surgical
procedures. In the consumer sphere, physical robots are becoming more popular through applications
like 3D printing, drones and robotic vacuum cleaners (Accenture, 2018).
Today, we have witnessed the following trends in robot and automation:
As production of robots has increased, the prices of robot have gone down. It is estimated by
Mc Kinsey & Company, over the past 20 years (from 1990 to 2010), the average robot price has gone
down by half in real terms, and the price has fallen even further in comparison to labor costs. In order
to meet the demand from emerging economies, the production of robots is encouraged to go up and,
they are likely to become cheaper and affordable.
Until recently robotics specialist were rare and expensive. Not many robotics engineers who
were equipped with skills necessary for designing, installing, operating, and maintaining robotic
production systems were available. Today, people with such skills are available as these subjects are
widely taught in schools and colleges around the world, and courses on manufacturing technologies or
engineering design for manufacture are provided widely. Testing robotic applications is easier and
affordable for companies as software, such as simulation packages and offline programming systems,
are available, too.
Robots are becoming more intelligent. While early robots operated in structured environments,
followed the same path and could only handle limited variability and failed at tasks with small changes
in the environment, the latest generations of robots can cope with variations in the environment thanks
to advances in artificial intelligence (AI) and sensor technologies. Given a desired state of environment
as input (e.g., which items to pack into a box for robots deployed for packing boxes, the level of
18cleanliness desired for a floor for robots deployed for cleaning floors, which pipes to inspect by when for
robots deployed for inspecting pipelines), planning algorithms decide to use which of the robot’s
capabilities and how to use them (Accenture, 2018). Thanks to powerful computer technology and big
data–style analysis, they can also, for instance, check the quality of product as it is being made, and
therefore help prevent processing errors and significantly reduce the amount of post-manufacture
inspection required.
In other cases, advanced sensor technologies and the computer power to analyze the data from those
sensors enable robots to oversee complex tasks like cutting gemstones that was previously done by
highly skilled craftspeople.
As robots become more agile and aware of their surroundings, they can work alongside people.
Robots can detect human’s movements and intelligently adjust their movement to avoid a collision with
humans and ensure they can work safely side by side with people to assist them. They are now also
reprogrammable to quickly “learn” from human workers how to take on new tasks. When robots and
people can work side by side, the ability to reallocate tasks between them helps increase productivity.
Working with human colleagues, collaborative robots are contributing to reshape manufacturing
processes and workforces.
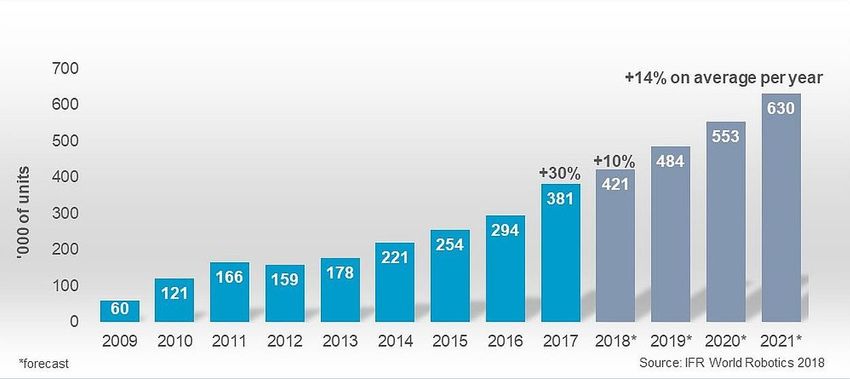
The adoption of robots has been seen in economies, especially in the developed world. According to
International Federation of Robotics, annual sales volume of industrial robots increased by 114% over
the period of 2013 - 2017. The sales value rose by 21% from 2016 to US$16.2 billion in 2017.4
Figure 15: Global industrial robot sales
According to data from the International Federation of Robotics, average of global robot density in the
manufacturing industries increased from 74 installed industrial robots per 10,000 employees in 2016 to
85 in 2017. By region, there are 106 robot units per 10,000 workers in Europe and 91 in the Americas
and 75 in Asia. Korea is the world’s largest robot adopter, with a density of 710 robots per 10,000
workers, while Singapore ranked second with 658 robots per 10,000 workers, Germany ranked third
with 322 robots, Japan ranked fourth with 308, and Sweden ranked fifth with 240. The United States
ranked seventh with 200 industrial robots per 10,000 workers. In the United States, the automation pace
is slower with a density rate of 200, thus, earning the economy the seventh place.
4
https://ifr.org/ifr-press-releases/news/global-industrial-robot-sales-doubled-over-the-past-five-years
http://www2.itif.org/2018-industrial-robot-adoption.pdf
19Table 1: A selective taxonomy of robotics technology: what they are, what they do,
and where they work
Main Typical Established New and Future
Categories Common Tasks Domain Industry Adopters Industry Adopters
Fixed and
caged
industrial
robots
Assembly
Designed to
Welding Oil and Gas, pipeline
operate Industrial products
Riveting distribution
within Industrial manufacturing
Drilling Construction
physical manufacturing Retail and consumer
Fastening All industries adopting
barriers plants Food and beverage
Die casting robotic
(includes and factories Electronics
Picking/packagin additive (3D printing)
Articulated Pharmaceutical
g/sorting manufacturing
arm,
Painting/coating
SCARA,
Cylindrical
and
Cartesian)
Collaborative robots
Designed to operate safely
around or with humans
Collaborati
ve
stationary
robots Collaborative
Quickly stationary robots Industrial products Industrial products
programma Quickly Industrial
manufacturing manufacturing
ble to programmable to manufacturing
Retail (warehouses) Retail (warehouses)
augment/su augment/suppla plants/factorie
Medicine (assisted Medicine (assisted
pplant nt manual s
surgery) surgery)
manual tasks with Warehouses
Semi-conductor Semi-conductor
tasks with humans at a Distribution
Electronics Electronics
humans at stationary site centers
Oil and gas industry Oil and gas industry
a Pipe networks
Healthcare Healthcare
stationary Drilling
Law enforcement Law enforcement
site operations
Agriculture Agriculture
Construction
Online retailers Online retailers
Collaborati Materials sites
Retail and consumer Retail and consumer
ve handling
Autonomo In-plant
us Mobile transportation
Robots Automated
(AMRs) palletizing
(designed Product/shelf
to work scanning
closely (in warehouse
with and retail
20Main Typical Established New and Future
Categories Common Tasks Domain Industry Adopters Industry Adopters
humans) environments)
and Brick-laying
automated
guided
vehicles
(AGVs)
Locales of
large-area
environmental
Unmanned surveillance
Aerial (mines,
Vehicles Unmanned forests, oil Agriculture (e.g., crops
(UAVs) for Aerial rigs, surveillance)
surveillanc Vehicles (UAVs) pipe-lines, Aerospace Power utilities (plant,
e for construction Construction transmission/
Low surveillance sites, (illustration of sites) distribution network
payload Low payload farms, etc.) Real estate inspection)
industrial industrial Warehouse/fu Oil &Gas Mining
aerial aerial drones lfillment Industrial products
drones (under 15lb) centers manufacturing
(under Airports
15lb) Energy assets
(oil rigs, wind
turbines,
power plants)
Unmanned
Aerial
Vehicles
for All industries requiring
transport delivery
High of low pay-load items
payload Last-mile delivery of
capacity Private plants parts or
Private plants and
15lb+ and premises end-user product
Retrieval and premises
(Note: 55 All other In-plant/warehouse
delivery of All other airspace
lb-payload airspace inventory
parts/packages permitting
is highest permitting management and
UAV use
permitted UAV use materials handling
by Low payload tasks now
FAA, as or carried out by
August airplanes/helicopters
2016, (e.g., spraying crops)
for
commercial
delivery
21Main Typical Established New and Future
Categories Common Tasks Domain Industry Adopters Industry Adopters
applications
)
Robotic
Exoskeleto
ns
Industrial
Wearable Assists
Assists manual manufacturing
robotics manual Industrial manufacturing
human labor (especially auto
systems human labor (especially auto sector)
(e.g., lifting, sector)
designed to (e.g., lifting, Retail & Consumer (in
gripping, Retail & Consumer (in
augment gripping, warehousing operations)
carrying) warehousing
human carrying)
operations)
physical
performanc
e
Source: Robot-ready: Adopting a new generation of industrial robots, PWC, 2018; Accenture,
2.2. Internet of Things
There is “no single, universal definition” of the IoT (Internet Society). From the perspective of technical
standardization, the IoT can be defined as a “global infrastructure for the information society, enabling
advanced services by interconnecting (physical and virtual) things based on existing and evolving
interoperable information and communication technologies”5. According to the Internet Society, the IoT
generally refers to “scenarios where network connectivity and computing capability extends to objects,
sensors and everyday items not normally considered computers, allowing these devices to generate,
exchange and consume data with minimal human intervention.” Another definition simply puts that the
IoT is “that everyday objects can be equipped with identifying, sensing, networking and processing
capabilities that will allow them to communicate with one another and with other devices and services
over the internet to achieve some useful objective” (Whitmore et al., 2015).
The potential for IoT is enormoUS International Data Corporation (IDC) forecasts there will be 25 billion
connected devices in the market by 2025 and IoT global market revenue will reach approximately $1.1
trillion in 2025. Similarly, according to Gartner, there will be 20.8 billion connected devices to be installed
and the economic value of IoT will gain $3 trillion during the same timeframe6. In its study, HP estimates
machine-to-machine connections will gain a compound annual growth rate of 18%, reaching 27 billion
by 2024.7
5
(International Telecommunications Union (ITU, 2018b) - International Telecommunications Union (ITU) (2018b), Overview of
the Internet of things, Geneva: ITU.
6
EY - Internet of Things Human-machine interactions that unlock possibilities
7
Realizing the Internet of Things: A Framework for Collective Action (WEF)
22By region, IDC Worldwide Semiannual Internet of Things Spending Guide reveals that the Asia/Pacific
region will be the global leader for Internet of Things (IoT) Spending in 2019 with around 35.7% of the
worldwide spend, followed by the United States and Western Europe with 27.3% and 21.2% of the WW
IoT Spend in 2019 respectively. China is the top spender in the region with $168.6 Billion accounted for
the year 2019 followed by Republic of Korea and India with a spending of $26.2 Billion and $20.6 Billion
in 2019 respectively.
According to IDC, in Asia/Pacific, there is considerable support and mandates from governments, such
as China, Republic of Korea, Chinese Taipei, Hong Kong, China and Singapore, to promote the
development of IoT across all major industries, particularly energy and resources, transportation,
manufacturing, agriculture, government, healthcare, and retail. In China, individual municipalities have
embarked on Smart City zones oftentimes in cooperation with local universities and businesses.
Willingness towards the implementation of 5G infrastructure will help to accelerate IoT growth of
applications that will benefit from low-latency and more bandwidth such as video-centric applications.
The IoT increasingly plays an important role, thus, is of increasing interest for both consumers and
businesses. For consumers, the IoT can improve life quality by enabling them to monitor physical fitness
and health through wearable devices or better manage their homes through smart appliances such as
smart refrigerators by providing them with spoilage alerts, visuals of the fridge and plans of their grocery
shopping from distance.
Meanwhile, the IoT can help businesses improve their operational efficiency, make factories smarter,
safer and more environmentally friendly. IoT connects the factory to several smart manufacturing
solutions running around the production, leading to dramatic improvements to production and cost
reduction. IoT allows manufacturers to track objects, to figure out consumer usage habits, and to
determine what adjustments should be made to help improve adoption and purchasing rates of the
products. Or in other words, IoT allow companies to provide customers with better experience and to
better experience and better manage their organizations and complex systems (Fleisch, 2010).8
There are various applications of IoT in life at different levels, from individuals to society (Table 2).
Table 2: Applications of IoT in life at different levels
Level Individual Community Society
Connected Cars
Smart phones Smart Cities
IoT Health devices
Wearables Smart Grids
Smart homes
Intelligent Transport
Systems
GPS, Fitbits
Event Data Recorders Smart metering;
Visa PayWave
Examples (EDRs) Smart water meters
Mastercard Paypass
Blood pressure monitors; Traffic monitoring
Employee passes
remote burglar/heating
systems
Speed, distance, airbag,
Mobile money Electricity/water
crash locations/alerts;
Data Fitness data, GPS consumption & billing;
Heart rate, blood pressure;
location-based data Traffic flow data
Diet, remote heating data
8
World Trade Report – future of the world trade)
23Individual person Speed, distance, airbag,
Authorities/regulators
Intended Immediate friends/ crash locations/alerts;
Utility companies;
Audience family; Heart rate, blood pressure,
Other citizens
banks; employers Diet, remote heating data
However, there are still some stiff challenges for wider adoption of the IoT that include security,
connectivity, and compatibility and longevity (Banafa, 2017). As security incidents such as the hacking
of baby monitors, smart fridges, thermostats, drug infusion pumps, cameras have occurred, the
deployment of connected devices in the home or office can introduce dangerous vulnerabilities and
may require the application of sufficient technical and perhaps regulatory safeguards. Connecting
millions or billions of new devices to the Internet can create serious bottlenecks
in telecommunication systems requiring companies and governments to spend on new investments to
upgrade these systems. Finally, as so many companies are competing to develop new connected
devices for both business and consumer markets, compatibility issues are likely to arise and there will
be a need to develop some standards to cope with this (WTO, 2018). 9
2.3. Big data analytics
Another trend underlying the digital revolution and shaping the digital economy is the ability to collect,
store and transfer many forms of information including text, sound, video, image and more into digital
information that can be processed by powerful computers and transmitted via fibre optic cables to a
global users. Digital information from complex data coming from anywhere and at anytime has opened
up a new era – the era of Big data.
Big data is defined by 3 characteristics: volume, velocity and variety. Volume reflects that Big data
involves analysing comparatively huge amounts of information. Velocity reflects the high speed of data
generation and change. Variety refers to the fact that Big Data can come from many different sources,
in various formats and structures.
Big data analytics refers to advanced analytic techniques, considering large and various types of
datasets to examine and extract knowledge from big data, constituting a sub-process in gaining insights
from big data process. Using advanced technologies, big data analytics includes data management,
open-source programming like Hadoop, statistical analysis like sentiment and time-series analysis,
visualization tools that help structure and connect data to uncover hidden patterns, undiscovered
correlations and other actionable insights.10 The power to analyse huge amounts of data provides us
with an unprecedented ability to make better, more insightful decisions in each of the areas needed for
growth.
Big data has been used across industries for business expansion. Amazon has made use of big data in
achieving to disrupt the traditional book market and became the leader in digital shopping. Google has
harnessed data from engine search to digital marketing in order to provide and personalize search to its
users, while Google and Facebook collect data providing opportunities for personalized and customized
marketing. Not only used by digital and data-driven enterprises, big data has been utilized by traditional
non-technological companies. General Electric, for example, has developed a cloud-based platform for
Industrial Internet application called “Predix” which provides engineers with real-time insights to
schedule maintenance checks, improves the efficiency of the machine and reduces downtime. Walmart
and many other major retailers have also benefited from applying big data analytics in the entire
business process, from supply-chain management to marketing. Netflix collects user data such as
searches, ratings, re-watched programs, and so on which help it provide its users with personalized
9
https://www.wto.org/english/res_e/publications_e/world_trade_report18_e.pdf
10
https://www.researchgate.net/publication/320771893_Big_Data_Analytics_Applications_Prospects_and_Challenges
24recommendations, suggest videos similar to the ones that has been watched or show various titles from
a specific genre. Doing such with big data, Netflix has saved $1 billion per year on customer retention.11
Big data exceeds the processing capacity of traditional relational database management systems. As
estimated by IDC, data created, replicated and consumed (in a single year) will grow dramatically from
around 3 zettabytes in 2013 to approximately 40 zettabytes by 2020 12 (Figure 16).
11
https://insidebigdata.com/2018/01/20/netflix-uses-big-data-drive-success/
12
Data included in the estimate include “images and videos on mobile phones uploaded to YouTube, digital movies populating
the pixels of our high-definition TVs, banking data swiped in an ATM, security footage at airports and major events such as
Olympic Games, subatomic collisions recorded by the Large Hadron Collider at CERN, transponders recording highway tolls,
voice calls zipping through digital phone lines, and texting as a widespread means of communications
25Figure 16: Growth of big data
Source: IDC, 2012
Big data market size grows steadily in terms of revenue. In 2018, annual revenue from the global big
data market was estimated to reach 42 billion US dollars, with projection indicating this would further
grow in the years to come (Figure 17). According to Statisca, services spending is believed to account
for the largest share of big data revenue, which is 40% of the overall market as of 2017. The major
providers of big data services include global corporations such as IBM, Splunk, Dell, Oracle, and
Accenture.
Figure 17: Forecast of Big Data market size, based on revenue, from 2011 to 2027 (in billion US
dollars)
26Source: Statista13
Figure 18: Big data and business analytics revenue worldwide 2015-2022
Source: Statista
According to Statista, the global big data and business analytics market was valued at 168.8 billion US
dollars in 2018 and is forecast to grow to 274.3 billion US dollars by 2022, with a five-year compound
annual growth rate (CAGR) of 13.2 percent (Figure 18).
2.4. Artificial intelligence
Artificial intelligence, referring to the ability of a machine to perform cognitive functions associated with
human behavior (such as perceiving, reasoning, learning, and problem solving), includes a range of
capabilities that enable AI to solve business problems.
The term “Artificial Intelligence” (AI) is not new. It was already established in the 1950s and describes
machine intelligence that is able to process, analyze, and react to input and changing situations by itself.
While simple robotic process automations only deliver a fixed set of actions, advanced AI is able to learn
from humans and past behavior and makes decisions on its own. All AI systems are composed of
sensing and processing components, while advanced AI also contains learning components. These
components are running in a never-ending cycle, leading to better decisions for the next situation.14
13
statista.com/statistics/254266/global-big-data-market-forecast/
14
https://www.statista.com/study/52194/digital-economy-compass/
27You can also read