Of the South African Institution of Civil Engineering Volume 59 Number 4 December 2017 - SAICE
←
→
Page content transcription
If your browser does not render page correctly, please read the page content below
of the South African Institution of Civil Engineering Volume 59 Number 4 December 2017
of the South African Institution of Civil Engineering
Volume 59 No 4 December 2017 ISSN 1021-2019
Publisher
South African Institution of Civil Engineering
Block 19, Thornhill Office Park,
Bekker Street, Vorna Valley, Midrand, South Africa
Private Bag X200, Halfway House, 1685, South Africa
Tel +27 (0)11 805 5947/48, Fax +27 (0)11 805 5971
http://www.saice.org.za
civilinfo@saice.org.za
Contents
Editor-in-chief
Prof Gerhard Heymann
University of Pretoria
Tel +27 (0)12 420 3627
gerhard.heymann@up.ac.za
joint Editor-in-chief
Prof Chris Clayton
University of Southampton
2 Review of climatic input data for wind load
c.clayton@soton.ac.uk design in accordance with SANS 10160-3
MANAGING Editor
Verelene de Koker A M Goliger, J V Retief, A C Kruger DOI: 10.17159/2309-8775/2017/v59n4a1
Tel +27 (0)11 805 5947, Cell +27 (0)83 378 3996
verelene@saice.org.za
12 Development of an updated fundamental
journal editorial Panel
Prof G Heymann – University of Pretoria basic wind speed map for SANS 10160-3
Prof CRI Clayton – University of Southampton
Prof Y Ballim – University of the Witwatersrand A C Kruger, J V Retief, A M Goliger DOI: 10.17159/2309-8775/2017/v59n4a2
Prof W Burdzik – University of Pretoria
Dr P Day – Jones & Wagener (Pty) Ltd
Prof J du Plessis – University of Stellenbosch 26 The effect of embedment on a foundation
Prof GC Fanourakis – University of Johannesburg
Prof M Gohnert – University of the Witwatersrand
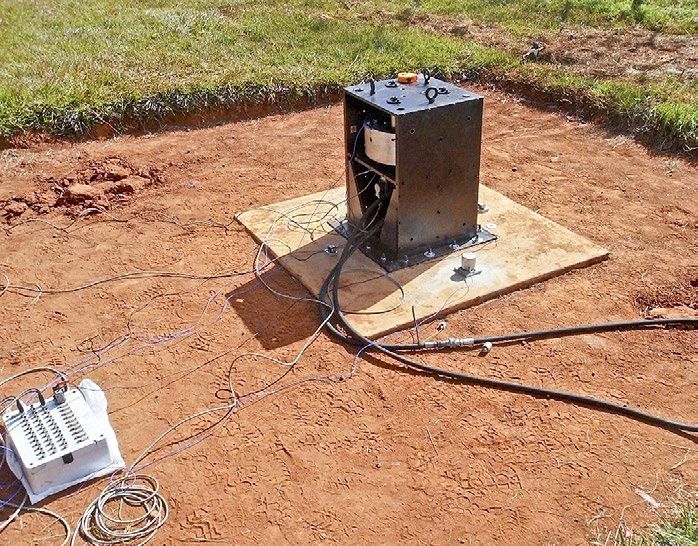
subjected to vertical vibration – a field study
Prof PJ Gräbe – University of Pretoria
Dr C Herold – Umfula Wempilo Consulting S J Mbawala, G Heymann, C P Roth, P S Heyns DOI: 10.17159/2309-8775/2017/v59n4a3
Prof A Ilemobade – University of the Witwatersrand
Prof SW Jacobsz – University of Pretoria
Prof EP Kearsley – University of Pretoria
34 Traffic characteristics and bridge
Prof C Roth – University of Pretoria loading in South Africa
Prof W Steyn – University of Pretoria
Mr M van Dijk – University of Pretoria R Lenner, D P G de Wet, C Viljoen DOI: 10.17159/2309-8775/2017/v59n4a4
Prof JE van Zyl – University of Cape Town
Prof C Venter – University of Pretoria
Prof A Visser – University of Pretoria 47 An investigation into the evidence of seasonal rainfall
Dr E Vorster – Aurecon South Africa (Pty) Ltd
Prof J Wium – University of Stellenbosch pattern shifts in the Western Cape, South Africa
Prof A Zingoni – University of Cape Town
Prof M Zuidgeest – University of Cape Town J A du Plessis, B Schloms DOI: 10.17159/2309-8775/2017/v59n4a5
Peer reviewing
The Journal of the South African Institution of 56 Application of metaheuristic algorithms
Civil Engineering is a peer-reviewed journal
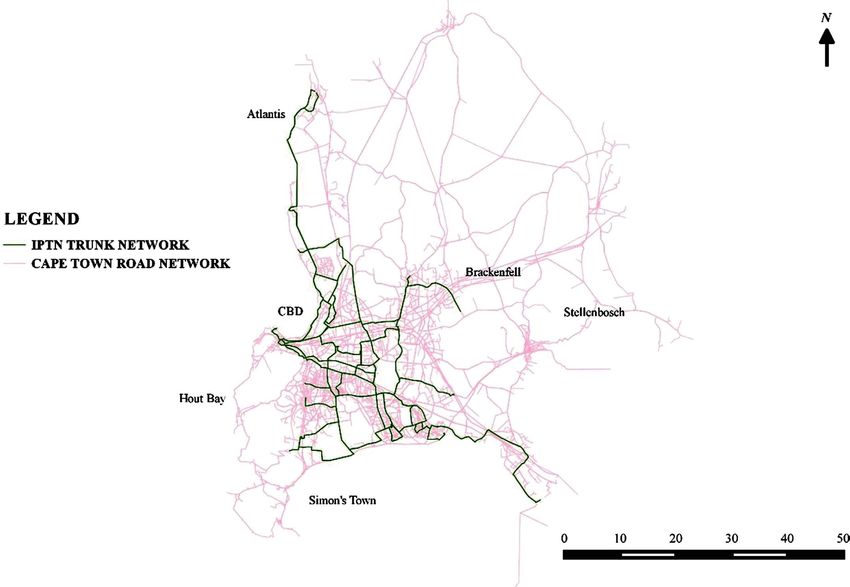
that is distributed internationally to the improvement of the MyCiTi BRT
Design and reproduction
Marketing Support Services, Ashlea Gardens, Pretoria
network in Cape Town
Printing O A Nnene, M H P Zuidgeest, E A Beukes DOI: 10.17159/2309-8775/2017/v59n4a6
Fishwicks, Pretoria
Papers for consideration should be submitted 64 An empirical preliminary prediction of heave
online at: http://journal.saice.org.za
G A Jones DOI: 10.17159/2309-8775/2017/v59n4a7
The South African Institution of Civil Engineering accepts no
responsibility for any statement made or opinion expressed
in this publication. Consequently, nobody connected with
the publication of this journal, in particular the proprietor,
the publisher and the editors, will be liable for any loss or
damage sustained by any reader as a result of his or her action
upon any statement or opinion published in this journal.
© South African Institution of Civil Engineering
Journal of the South African Institution of Civil Engineering • Volume 59 Number 4 December 2017 1
TECHNICAL PAPER Review of climatic input
Journal of the South African
Institution of Civil Engineering data for wind load design in
ISSN 1021-2019
Vol 59 No 4, December 2017, Pages 2–11, Paper 1724 accordance with SANS 10160-3
DR ADAM GOLIGER obtained his MSc degree A M Goliger, J V Retief, A C Kruger
from the Warsaw Technical University, and his
PhD and DEng degrees from Stellenbosch
University, all in Structural Engineering. Until 2016
(for more than 30 years) he was involved in With the publication of Part 3 Wind Actions of the South African Loading Code SANS 10160:2010,
research and consulting work at the CSIR (Council several issues concerning adjustments from the reference standard Eurocode EN 1991-1-4:2004
for Scientific and Industrial Research). This could not be resolved due to lack of sufficient updated background information on South
included wind-tunnel simulation and modelling
African conditions. The need for updating the map for the free field wind speed is related also
techniques, wind damage and environmental studies around buildings. For
several years he served as the South African representative on the International to the improved representation of the mixed and complex strong wind climate of the country.
Association for Wind Engineering (IAWE), and participated in various local and Furthermore, strong wind probability models are used for the reliability assessment and
international committees and research panels. He is the author or co-author of calibration of wind design procedures. Updating of the reliability provisions for the revised wind
more than 100 scientific publications and numerous technical reports. loading process was a further need identified at the time.
Contact details: This paper provides a review of the historical development of the representation of the
Council for Scientific and Industrial Research (CSIR) free field wind, used as input to design wind loading procedures for South Africa. The review
T: +27 83 660 8205 considers: (i) the historical representations of the geographic distribution of free field wind,
E: adam.goliger@gmail.com
(ii) the climatic influences considered, and (iii) the probabilistic bases for the stipulated wind
speed for the reliability provisions for design wind loads. On this basis, the background and
PROF JOHAN RETIEF, who is a Fellow of the
motivation are provided for updating SANS 10160-3:2010.
South African Institution of Civil Engineering, is
Emeritus Professor in Civil Engineering at
Stellenbosch University. His field of interest is
the development of risk and reliability as the INTRODUCTION nominally adjusted from SABS 0160:1989.
basis of design for structures, with specific
Wind loading plays a key role in the design This was mainly due to the lack of resources
applications to wind loading, structural concrete
and geotechnical practice, amongst related
of all structures, even more so as the leading to resolve the differences in strong wind
topics. He is a member of SABS TC98 Structural and geotechnical design environmental load under the relatively mild climate implemented in Eurocode provisions
standards, and is the national representative to ISO TC98 Bases of design and South African climate conditions, since snow, and South African conditions. In addition
actions on structures, and a member of various Working Groups of these TCs thermal and seismic loading are generally not there was a clear need to update the informa-
(technical committees). He holds degrees from Pretoria University, Imperial
decisive in the design of the built environment. tion on which the strong wind climate was
College, Stanford University and Stellenbosch University.
As a result, upgrading of design provisions for characterised.
Contact details: wind loading was an important consideration The nominal treatment of the wind map
Department of Civil Engineering
for the revision of the previous South African of characteristic free field wind speed (vb,0)
Stellenbosch University
Private Bag X1, Matieland, Stellenbosch 7602, South Africa Loading Code (SA-LC) SABS 0160:1989 The and apparent insufficient provision for the
T: +27 21 808 4442 general procedures and loading to be adopted reliability performance of wind loading, that
E: jvr@sun.ac.za in the design of buildings (Goliger et al 1998, may result from the anomalously low wind
2001; Goliger 1999, 2007, 2016). The outcome load partial factor (γ Q,W), was justified on the
DR ANDRIES KRUGER obtained his MSc degree was a complete revision of SANS 10160:2010 basis that the Eurocode procedures result in
from the University of Cape Town in the Basis of structural design and actions for a significant increase in design wind load in
Geographical and Environmental Sciences, and
buildings and industrial structures Part 3 comparison to previous stipulations provided
his PhD from the University of Stellenbosch in
Civil Engineering, with the research topic Wind Wind actions. (SANS 10160 was reissued in by SABS 0160:1989 (Goliger et al 2009a).
Climatology and Statistics of South Africa relevant to 2011 as Edition 1.1 to include errata, but will Furthermore, no substantial information was
the Design of the Built Environment. Since 1985 he be referred to here as dated by Edition 1). available to justify an increase of the partial
has been involved in the observation, analysis The general suitability of Eurocode EN factor (Retief & Dunaiski 2009).
and research of historical climate at the South African Weather Service. This has
1991-1-4 General actions – Wind actions, as Extensive investigations were therefore
included climate change and variability research, the authoring of general
climate publications, and other climatological studies through consultation. He reference for the new South African stan- launched to update the knowledge base on
is the author or co-author of a substantial number of scientific publications. dard on wind loading (Goliger et al 2009a), the South African strong wind climate, and
formed an important component of the deci- the statistical models used for reliability
Contact details:
Chief Scientist Department of Geography sion to base SANS 10160:2010 on appropriate assessment and calibration of design para
Climate Data Analysis & Research Geoinformatics and Meteorology Eurocode standards and parts thereof (Retief meters. The outcomes of the investigations
Department: Climate Service University of Pretoria et al 2009). The main considerations and jus- are directed towards the determination of
South African Weather Service Pretoria 0002 tifications for the adaptation of EN 1991-1-4 the geographic representation of charac-
Private Bag X097, Pretoria 0001 South Africa
to the South African wind load standard are teristic values for the free field wind speed
South Africa
T: +27 12 367 6074 presented by Goliger et al (2009b). across the country, as well as re-evaluation
E: andries.kruger@weathersa.co.za Even with the major revision of the and determination of an appropriate partial
standardised procedures for wind loading load factor for wind loading. These two
incorporated in SANS 10160-3:2010, signifi- sets of information constitute the basic
Keywords: wind loading, wind map, South Africa, probabilistic models cant components of the standard were only design parameters influencing the reliability
2
Goliger AM, Retief JV, Kruger AC. Review of climatic input data for wind load design in accordance with SANS 10160-3.
J. S. Afr. Inst. Civ. Eng. 2017:59(4), Art. #1724, 10 pages. http://dx.doi.org/10.17159/2309-8775/2017/v59n4a1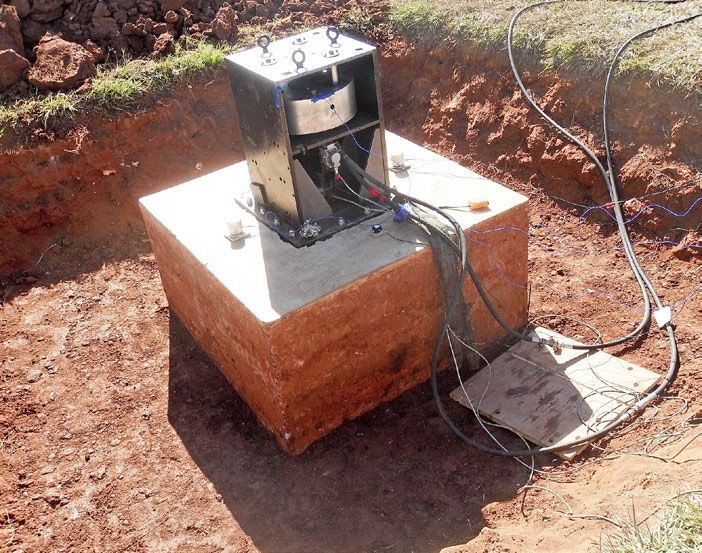
performance of structures designed in accor- 60
dance with SANS 10160-3.
In addition to the need for updating the
representation of the South African strong
wind climate, there is also the requirement
40
of accounting for the differences between
the European and South African climates.
Eurocode procedures are broadly based on
synoptic type wind storms, whilst meso-scale
convective thunderstorms and regions of 20
mixed climate, where both synoptic and
Effect of the error (%)
convective wind storms occur, are widespread
across South Africa (Kruger 2011; Kruger et
al 2010, 2012, 2013a). Such differences have 0
a bearing on the representation of gust wind
loads on structures.
In the reliability assessment of SANS
10160:2010, the probability models used for
–20
SABS 0160:1989 were maintained (Retief &
Dunaiski 2009). However, the probability
models for wind loading deviated substan-
tially from generic models accepted interna-
tionally, including differences for modelling –40
time-invariant wind engineering aspects of
wind loading. Lack of background informa-
tion and resources prevented the resolution
of anomalies in the wind load probability –60
models for SANS 10160-3:2010. –40 –20 0 20 40
This review paper provides the general Error in estimation (%)
framework for background investigations to Loading Wind speed
standardised wind loading design for South
Africa. It includes a review of critical wind Figure 1: Effect of errors in estimation of wind speed and loading parameters
engineering concepts and issues that have a
bearing on the design process. The history of p = 0.5 ∙ ρ ∙ v 2(1) Wind loads, pressures and speed
the development of mapping the characteristic As mentioned above, wind loading of struc-
free field wind speed for South Africa is where ρ is the density of the flow medium tures and their elements results from inte-
assessed, which leads up to the latest, exten- (i.e. air). grated effects of resultant pressures (pr) pro-
sively updated, maps for the characteristic gust duced by a combined effect of internal (pi)
and hourly mean wind speed. Consequently, This underlines the overriding importance of and external (pe) pressures pr = ∑(pr + pe)
the need to convert the gust wind map into a reliable estimation of the magnitude of wind acting over all surfaces. These pressures are
a suitable format that can be used in the speed applicable to the specific design situa- generated by the movement of air over and
operational design is justified. An outline is tion, which in turn is primarily determined across the structures, as affected by their
also provided of the interrelationship between by the basic regional wind speed, relevant to geometrical shape (including bulk and aspect
the fundamental strong wind climate investiga- the geographical area of concern. It has been ratio), presence of dominant openings, and
tions, characteristic wind speed, reliability widely accepted that the prediction of regional the overall aerodynamic solidity (i.e. amount
models for the wind speed and reliability-based wind speed forms the single greatest source of of porosities).
design measures. This provides the basis for error in the design process, and therefore the
reassessment of the reliability provisions for use of the most appropriate and statistically Estimation errors
SANS 10160-3 based on probability models for sound wind statistics is of utmost importance Equation 1 is, in principle, applicable to the
strong winds provided by Kruger et al (2013a), to the design (Holmes 2001). laminar flow only (under an assumption of
as proposed by Retief et al (2013). All national wind loading standards across no vorticity and acceleration) and strictly
the world contain information on the respec- speaking is rarely appropriate to built envi-
tive basic design wind speed. These reflect the ronment conditions. Nevertheless, it indi-
BASIC CONCEPTS macro-scale climate, exposure and topographi- cates the quadratic relationship between the
cal variability between regions, and are usually wind speed and pressure and, therefore, the
Regional wind speed based on statistical analyses of the wind data critical importance of a reliable estimation
Wind loading of structures and their elements captured by the respective national weather of the magnitude of wind speed applicable to
are generated by a combined effect of the service authorities. Often differences between the specific design situation.
internal and external pressures. However, con- neighbouring regions or countries can be This principle is demonstrated sche-
sidered most critically, in terms of Bernoulli’s observed – an issue that became evident during matically in Figure 1, which depicts the
equation (see Equation 1), the magnitude of the process of integrating the national maps of implications of errors introduced by
pressure ( p) on the structure is proportional the European Union (EU) member countries under- and overestimation of loading para
to the square of the wind speed (v). into a unified EU wind map (Hansen 2013). meters vs errors in wind speed magnitude.
Journal of the South African Institution of Civil Engineering • Volume 59 Number 4 December 2017 3
Zero percent reflects the actual, i.e. most Table 1: Wind velocities to be used in design (SABS 024:1952)
appropriate, values. It can be seen that an
Region Terrain type miles/hour km/hour m/s
overestimation of 30% in the magnitude of
loading parameters implies a similar increase Coastal
open country 80 129 36
in the loading effect. However, such an (10 miles inland)
built-up 70 113 31
erroneous increase in wind speed magnitude
implies about 70% increase in the loading open country 70 113 31
Inland
effect! Unfortunately, differences and incon-
built-up 60 97 27
sistencies in the order of 20% to 30% are not
uncommon in measurements and estima-
tions of the free field wind speed in full-scale
conditions (mainly due to an insufficient Highest mean hourly wind speed at 10 metres likely to be exceeded once in 50 years
geographical coverage of full-scale observa-
tion recorders and the lack of representivity 19∙4
of their measurements of the prevailing wind
Johannesburg
climate due to improper siting).
Peak gust and hourly mean Kimberley
wind speeds 22∙7
19.7 24∙7
In the design process, as reflected in all Bloemfontein
international loading manuals and standards, Durban
the magnitude of wind speed affecting a
specific structure or design situation is
determined by several factors, including 23∙8
e.g. topography, terrain roughness and
20∙1 21∙5 East London
elevation above the ground level, as well as
the surrounding environment. However, Cape Town Port Elizabeth
the primary influence relates to the general
wind climate characteristics of the geo- Wind speed in metres/second
graphical area of concern, which is typically
represented by the maps of the basic design Figure 2: E xtrapolated 50-year return period mean hourly wind speeds at 10 m elevation
wind speed. (May 1972)
Historically, most of the wind loading
design procedures followed the static load
application approach, with wind maps
Windhoek
defined in terms of the 3-sec, 50-year return
period gust, derived on the basis of extreme
35 Pietersburg
value analyses of the recorded wind data. Tsane
The SABS 0160:1989 version of the wind Mariental
Nelspruit
loading standard also included a map of Pretoria
Marques
hourly mean wind speeds for the application Mafeking
Keetmanshoop Jan Smuts
in dynamic design procedures.
Lüderitz 40 Piet Retief
Reliability-based limit states design Kuruman Kroonstad 35
The use of the partial factor limit states 45
Alexander Bay Upington Kimberley
design approach, as a reliability-based
Bloemfontein Estcourt
semi-probabilistic design approach in SABS
Okiep Prieska Durban
0160:1989 (Kemp et al 1987), was transferred
to SANS 10160:2010 (Retief & Dunaiski Kokstad
40 45 50 55 45
2009). Accordingly, the design wind load (Qd)
is expressed in terms of the partial factor for Calvinia Middelburg
Queenstown
wind loads (γ Q) and the characteristic wind Beaufort West
load (Qk) calculated from the characteristic East London
wind speed (vk), as given by Equation 2: Cape Town Bien Donne George
D F Malan Port Elizabeth
Mossel Bay
Qd = γQ Qk(2)
Figure 3: Isophlets of estimated 50-year return period gusts in m/s
Probability models for annual maximum (Louw & Katsiambirtas, year unknown)
wind speed are needed for the two design
parameters used in Equation 2. The charac- γ Q is calibrated to obtain a design wind the cumulative normal distribution func-
teristic wind speed (vk) to be implemented load at a target exceedance probability, tion. Appropriate extreme value probability
in Equation 1 is typically specified as the conventionally expressed in terms of the models are used to represent the annual
2% fractile (1:50 year return period), and target reliability βT = Φ–1(PF), where Φ is maximum wind speed.
4 Journal of the South African Institution of Civil Engineering • Volume 59 Number 4 December 2017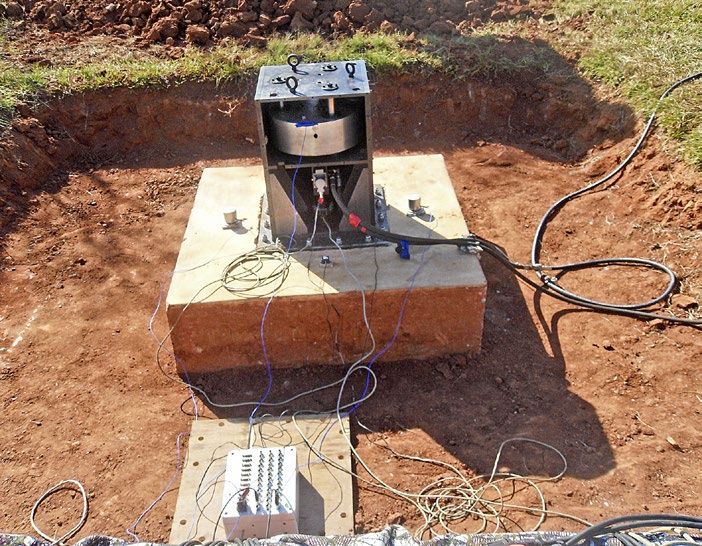
Although the probability modelling of
wind load is dominated by the inherent vari-
ability of the annual maximum wind speed, it
is imperative to also consider the uncertain-
ties of the wind engineering procedures for
converting the free field wind speed to loading
of the structure. The probability model for
wind load therefore consists of a combination
of the time-variant extreme value model for
the basic wind speed and time-invariant mod-
els for the wind speed profile at the site, wind
directionality, pressure and force coefficients,
as stipulated in some of the basic wind engi-
neering procedures.

WIND CLIMATIC DATA –
HISTORICAL PERSPECTIVE
This section highlights the background
of wind climate input data, and relevant
statistical analyses, which were reflected
in the previous versions of South African
loading standards.
                                                       Figure 4(a): Regional basic design wind speed, based on 50-year return period (SABS 10160:1980)
Early stipulations – SABS 024:1952
The development of the first South African
uniform wind loading design stipulations was
initiated by the South African Branch of the
British Institution of Structural Engineers,
and included in the Comprehensive Model
Building Regulations, Chapter 3, Loads
(SABS 024:1952). This document was devel-
oped with the assistance of and published by
the British Ministry of Works, and coincided
with the publication of the first version of
CP3: Chapter V: Part 2 in the UK (BSI 1952).
(Of interest to mention here – the very first
version of the Wind Loading Code of Practice
in the UK was published in 1944 as CP4.) At
that time (i.e. after World War II) only a few
countries across the world (e.g. Switzerland)
introduced uniform wind loading manuals.
and therefore the determination of the wind
characteristic values were largely left to the
ingenuity and expertise of the engineers who
undertook specific designs.
    The design wind velocities, which
appeared in SABS 024:1952, were stipulated
in miles per hour for coastal belt vs inland           Figure 4(b): M
                                                                     aximum hourly mean wind speed for 50-year return period and Terrain Category 2
and furthermore open country vs built-up                            (SABS 10160:1980 – Annex D)
areas, as reproduced in Table 1. The values
are referred as the “highest average velocity         this situation could, however, be considered                        two-dimensional design calculation paradigm
for a single hour which includes allowance            as broadly acceptable, keeping in mind                              based on hand calculations was hugely con-
for wind gusts”, which were extracted from            the character of developments, design and                           servative, as it ignored the three-dimensional
a publication of the then South African               construction practices which prevailed at the                       transfer of loads considered in all modern
Weather Bureau (SAWB 1949).                           time. For example, building structures were                         structural engineering software.
    It is interesting to note that the magnitude      typically of lower height (e.g. with fewer floor
of wind speeds included in Table 1 is evidently       levels), with minor dynamic sensitivity. Usage                      Initial statistical analyses
lower than that stipulated in the subsequent          of light-weight construction materials and                          The first statistical analysis of the wind cli-
versions of the Standard. For example,                glazing was limited, and no concealed sheet-                        matic data, which was identified in the process
the wind speed applicable to the design of            ing systems existed. Only positively fixed roof                     of developing the current paper, was done by
buildings in Cape Town was 31 m/s only.               sheeting with a minimum gauge of more than                          May (1972). It included a map of predicted
From a structural reliability point of view,          a millimetre was in use. Furthermore, the                           50-year return period mean hourly wind speed

                                      Journal of the South African Institution of Civil Engineering • Volume 59 Number 4 December 2017                         5
at specific geographic locations, reproduced
here in Figure 2. The map was derived from an Windhoek
extreme value analysis of the data captured by
seven wind speed recorders located at major Tsane Pietersburg
population centres. The length of the records
Mariental Nelspruit
varied between 14 and 20 years. A comment Pretoria
6 Maputo
was made in the paper that the previous
Mafeking
design values used by engineers at that time Keetmanshoop Jan Smuts
lacked any statistical background and typically Lüderitz Piet Retief
referred to the highest value of wind speed 20
Kuruman Kroonstad
recorded by the closest anemometer. Upington 25
Values of between 20 m/s and 25 m/s were Alexander Bay 25 Kimberley
predicted for the 1:50 year hourly mean wind Bloemfontein Estcourt
speed. Obvious anomalies to more recent Okiep Prieska
Durban
estimations are that the highest value of 30 25
Kokstad
24.7 m/s was estimated for Durban, 22.7 m/s for 20
Middelburg
Bloemfontein and only 20.1 m/s for Cape Town. Calvinia
In the late 1970s a subsequent statistical Beaufort West Queenstown
20
analysis of South African wind data was
East London
undertaken by Louw and Katsiambirtas (year 25
Cape Town 25 George
unknown). For this analysis, data from 16 Bien Donne Port Elizabeth
D F Malan 25
weather stations, with recording periods of Mossel Bay
between 15 and 20 years, was utilised. The
resultant isophlets of estimated 50-year Figure 5: I sophlets of estimated mean hourly wind speed in m/s in open country terrain and
return period gusts are presented in Figure 3. 100‑year return period (TMH7 1981)
It can be seen that for most of the country
wind speed greater than 45 m/s was esti-
Zimbabwe
mated, and for the area stretching between
Prieska and Beaufort-West the estimation
was as much as 55 m/s. The magnitude of Botswana
Northern Province Mozambique
wind speeds is considerably higher than pro- Pietersburg
vided by previous and subsequent maps. The 40
GP Mpumalanga
map nevertheless provides a clear geographic Namibia
Pretoria
North West Province
pattern of wind speed varying between Johannesburg Swazi-
land
35 m/s and 55 m/s.
40
Free State KZN
SABS 0160:1980 Upington Kimberley
Alexander Bay
Between the 1950s and early 1970s the Bloemfontein
Lesotho
British loading code CP3: Chapter V, Part 2: Northern Cape Durban
Wind loads underwent several revisions, but
45
largely retained its content and structure. Eastern Cape
This standard formed the basis for the GP = Gauteng Province 50
Beaufort West
m/s
KZN = KwaZulu-Natal East London
development of the SABS 0160:1980 version, 40
40
which included a map of the basic design Western Cape George
45
Cape Town Port Elizabeth
50
wind speed in terms of maximum gust
speeds (in m/s), as presented in Figure 4(a).
This map was developed on the basis of Figure 6(a): Regional basic wind speed in m/s, isophlets of 3-sec gust, estimated to be exceeded
the statistical analysis of SAWB data. The on average once in 50 years (SABS 0160:1989)
shape of the isopleths resembles that shown
in Figure 3, but with different values. It TMH7 – 1981 the 1980 version of SABS 0160. A 1989 ver-
can be seen that for most of the country a In 1981 the TMH7 Code of practice for the sion was developed, which included maps of:
wind speed of 40 m/s was stipulated, and design of highway bridges and culverts in ■■ isophlets of the Regional Basic 3 s gust
between 45 and 50 m/s for the regions South Africa was developed by the Council wind speed (at 10 m elevation, terrain
extending between Upington – Bloemfontein for Scientific and Industrial Research (CSIR) category 2, to be exceeded once in 50
– Beaufort-West. The coastal areas are not at the request of the Committee for State years), and
clearly indicated, but it can be assumed that Road Authorities. This code incorporated ■■ the maximum hourly wind speed in m/s
a wind speed of 40 m/s is applicable. a map of isophlets of estimated 1:100 year for a 50-year return period.
The code also included a map of the max- hourly wind speed, as presented in Figure 5 These maps, presented in Figures 6(a) and
imum hourly wind speed for a 50-year return (the source of this map is unknown). 6(b) respectively, were developed on the basis
period, as presented in Figure 4(b). For most of an extensive statistical analysis carried out
of the country a wind speed of 22 m/s is SABS 0160:1989 by Milford (1986a, 1986b, 1987), based on
stipulated, and 24 m/s for the entire coastal In the mid-1980s a South African Loading the data of 15 South African Weather Bureau
region (up to about 80–100 km inland). Code Committee was established to update (SAWB) weather stations, with observation
6 Journal of the South African Institution of Civil Engineering • Volume 59 Number 4 December 2017
Zimbabwe
length varying between about 15 and 40
years. These maps provide a marked simplifi-
cation of the basic wind speed, retaining only
Botswana
Northern Province Mozambique the prominent high wind speed region in the
Pietersburg central Karoo. No differentiation between
20
coastal to inland, winter to summer rainfall,
Namibia GP Mpumalanga or subtropical to semi-arid conditions are
North West Province Pretoria
Swazi-
reflected within what can be regarded as an
Johannesburg
land
envelope wind speed of 40 m/s.
20
Upington Kimberley
Free State KZN
25 Spatial coverage
Alexander Bay Of particular concern is that all wind design
Bloemfontein
Northern Cape
Lesotho
Durban maps presented in Figures 2 to 6 were based
on statistical analyses of data captured by a
20 very limited number (less than 20) of SAWB
Eastern Cape
anemometers. By comparison, similar maps
GP = Gauteng Province 30Beaufort West m/s
were developed for the Netherlands and
KZN = KwaZulu-Natal East London 20
25 25
the UK using the data from more than 50
Western Cape George
Cape Town Port Elizabeth recording stations (Wieringa & Rijkoort
30
1983; BRE 1989). A graphic comparison of
the areas of three countries and the number
Figure 6(b): Maximum hourly mean wind speeds for 50-year return period and Terrain Category 2 of recording stations are given in Figures 7(a)
(SABS 0160:1989 – Annex D) and 7(b). Integration of both distributions
indicates a significant disparity between the
spatial coverage of these countries.
1 500
This issue becomes even more relevant
when one considers the climatic diversity
of South Africa compared to the above
countries. The climates of the UK and
Netherlands are fairly uniform, and the
1 000
Area (× 1 000 km 2)
strong wind events are generated almost
exclusively by synoptic-scale frontal sys-
tems. The climate in South Africa is much
more complex and ranges from subtropical
500 (Kwazulu-Natal) and mediterranean (south-
western Cape) zones, to desert (Kalahari
in the Northern Cape). The distribution of
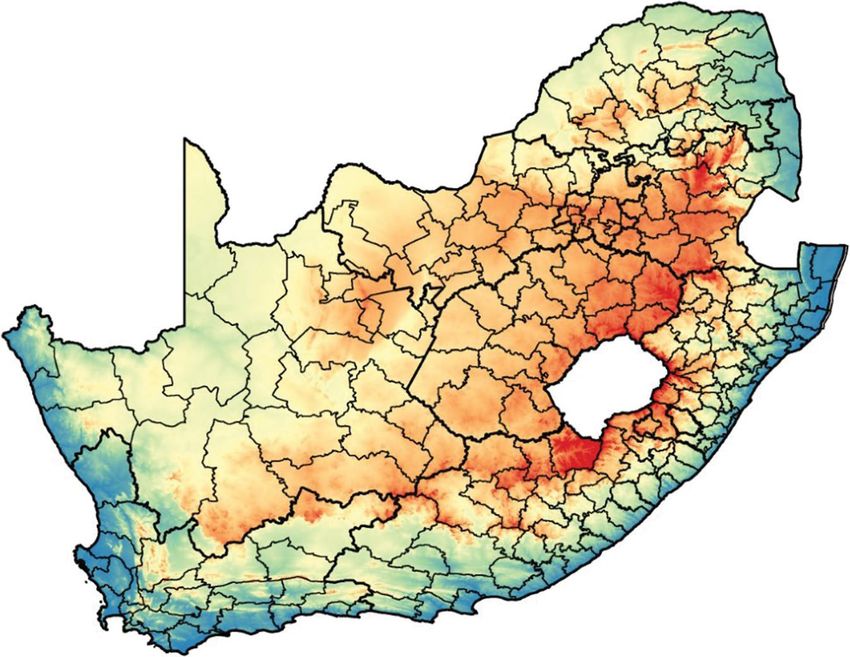
the diverse climatic zones in South Africa is
presented in Figure 8 (Kruger 2004).
0
The Netherlands United Kingdom South Africa SANS 10160-3:2010
(a) Country Considerations for using Eurocode EN 1991-
1-4:2005 as reference for SANS 10160-3:2010
60 are reviewed by Goliger et al (2009a; 2009b).
The Eurocode developers were facing a dif-
ficult task to provide a common framework
Number of wind recording stations
for integrating a variety of national design
standards of member countries, which
40 included a large diversity of stipulations.
It became a challenge to strike a balance
between uniformity and consistency of
the Eurocode and, on the other hand, to
accommodate national specifics, expertise
20
and engineering tradition. In order to cope
with this situation, some of the principal
stipulations were allocated the status of
being non-negotiable, while nationally deter-
0
mined parameters were left to be decided at
The Netherlands United Kingdom South Africa a national level by member countries, and
(b) Country incorporated into the respective national
amendments or annexes.
Figure 7: A
comparison of: (a) areas and (b) number of recording stations between The Netherlands, The stipulation regarding the fundamen-
United Kingdom and South Africa tal value of the basic wind speed, in terms of
Journal of the South African Institution of Civil Engineering • Volume 59 Number 4 December 2017 7
10-min mean (measured at 10 metres eleva-
Musina
tion in open country terrain) was assigned a
1
status of a non-negotiable clause. The selec-
tion of the averaging period was for the sake Tzaneen
Pietersburg
of compatibility with the design procedures
2 3
that account for dynamic structural response Skukuza
in the Eurocode. This approach appears to be Pretoria 5
Belfast
a reasonable compromise for the temperate
European climate with synoptic wind storms
8 14
caused by prevailing westerly wind systems, Kuruman 11
within which each country could provide for 9 10
Bethlehem
7
21 Upington 6
specific conditions. Vioolsdrif Kimberley Ladysmith
Bloemfontein 15
The South African code committee Port Nolloth Springbok Mokhotlong
Durban
decided to adopt the 10-min mean principle 16 12
19
for alignment purposes, although the pro- 17
Carnarvon
Umtata
posed SANS 10160-3 did not include any Middelburg
20
dynamic procedures. An adherence to this 13
Queenstown
stipulation created a substantial challenge East London
Oudtshoorn
in view of the diversity of the South African Cape Town
22 18 23
Riversdal
wind climate. A reanalysis of the full-scale George
24
data was not a feasible option, due to the
inherent difficulty of adequate representa- (1) Northern Arid Bushveld (9) Kalahari Hardveld Bushveld (16) Great and Upper Karoo
tion of wind speeds generated by localised (2) Central Bushveld (10) Dry Highveld Grassland (17) Eastern Karoo
(3) Lowveld Bushveld (11) Moist Highveld Grassland (18) Little Karoo
short-duration thunderstorms. The revised (4) South-Eastern Thornveld (12) Eastern Grassland (19) Western Karoo
map of the fundamental value of the basic (5) Lowveld Mountain Bushveld (13) South-Eastern Coast (20) West Coast
(6) Eastern Coastal Bushveld Grassland (21) North-Western Desert
wind speed expressed as the 10-min mean is (7) KwaZulu-Natal Central (14) Eastern Mountain (22) Southern Cape Forest
presented in Figure 9. Bushveld Grassland (23) South-Western Cape
This map was developed on the basis of (8) Kalahari Bushveld (15) Alpine Heathland (24) Southern Cape
the map included in the SABS 0160:1989
version of the code, and intuitively modi- Figure 8: Climatic regions of South Africa (Kruger 2004)
fied in consultation with the South African
Weather Service (SAWS), by taking into
account the topographical characteristics
of the southern and southwestern Karoo,
the directional prevalence of winter storms
and the distribution of the climatic regions
in South Africa (Kruger 2004). The South
African climate (i.e. also the wind climate)
is complex, in particular with regard to the
dominance of frontal winds in coastal areas
and intense thunderstorms in the interior.
These two types of strong wind events can-
not be fairly represented by a single value
of mean wind speed in terms of 10-min
averaging time. In order to overcome this
problem an actual magnitude of wind speed
of 28 m/s was obtained for coastal areas,
based on a conversion factor between hourly
and 10-min mean wind speeds (Goliger et al
2009b). Such a conversion is not applicable to
inland regions of the country dominated by
convective activities and, therefore, an effec-
tive speed of 28 m/s was adopted. A conver-
sion factor of 1.4 was then introduced in the
design procedure to bring the magnitude of
the wind gust speed close to 40 m/s.
Updated map based on strong
wind climate Figure 9: Map of fundamental value of the basic wind speed, vb,0 (SANS 10160-3:2010)
With the introduction of automatic weather
station technology to the SAWS observa- stations increased dramatically. As an climatological analyses, it became impera-
tion network in the 1990s, the number of appreciable number of the resultant data tive that updated design wind statistics be
continuously recording wind measurement sets became sufficiently long for meaningful developed. The development process (which
8 Journal of the South African Institution of Civil Engineering • Volume 59 Number 4 December 2017The direct expression of vb,0 as gust wind
speed fully accounts for the mixed South
African strong wind climate consisting of
both synoptic and convective wind storms.
The adjusted Eurocode procedure based on
a 10-min mean wind speed and a gust factor
can then be replaced by the direct calcula-
tion using the mapped gust wind speed. This
procedure will be consistent with the scope
of static equivalent wind loading provided for
in SANS 10160-3.
For various reasons the map of vb,0
shown in Figure 10 is not appropriate to be
implemented directly in the design proce-
dures – as the map incorporates a degree
of interpretation and smoothing of the
underlying information on which it is based,
it should be considered to be indicative at
best. Furthermore, the geographical repre-
sentation of vb,0 should be presented in an
unambiguous format for operational design.
The conversion of the information provided
by Figure 10 into standardised values of vb,0
Figure 10: 1:50 year gust speed developed from measured data (Kruger et al 2013b) is provided by Kruger et al (2017).
included updated data analysis methods, 1:50 year or characteristic values; and the
the consideration of the mixed strong wind reliability-based partial wind load factor. The RELIABILITY BASIS FOR WIND LOAD
climate of South Africa, and attention to main advances represented by the procedures The representation of characteristic wind
the measurement environments), as well and maps reviewed above are as follows: as speed as the fundamental value of the basic
as its results, are discussed by Kruger et al early as 1952 wind load design provided for wind speed vb,0 for structural design should
(2013a & b). wind speed based on observation of hourly be seen in the context of the reliability basis
Figure 10 presents the 1:50 year gust mean wind, converted to gust speed; differen- for wind load, as derived from the prob-
map which resulted from this process. The tiating furthermore between inland regions ability model for the annual maximum wind
number of weather stations which could be and a 16 km wide coastal strip. speed (V). The characteristic wind speed (vk)
analysed increased about five-fold, reflected The statistical analysis employed by provides the input to determine the charac-
by the increased complexity of the map May (1972) to derive 1:50 year for the major teristic wind load QW,k.
compared to earlier versions of gust maps centres of the country was followed by an The selection of appropriate extreme
presented in Figures 2, 3, 4(a) and 6(a). elaboration of the geographic distribution of value probability functions for V is exten-
Whereas previously the major part of the wind speed by Louw and Katsiambirtas (year sively discussed by Kruger et al (2013a).
country was assigned a single design gust unknown). A similar but simplified map However, the Gumbel distribution provides
speed of 40 m/s, Figure 10 indicates that the was used for the 1980 design standard, with a convenient approximation to represent the
design speed varies in a spatially complex a separate map for the hourly mean wind annual maximum wind speed V, as given by
manner from about 25 m/s to above 45 m/s. speed. Extensive wind speed probability Equation 3 in terms of y = (v – βV)/αV where
Prominent features of this map range from modelling was used by Milford (1987) for the αV is the dispersion parameter and βV the
the complex nature of the pattern around the dual assessment of the regional basic wind mode of the distribution (Holický 2009):
southwestern extreme, two regions for wind speed and wind load partial factor (Kemp et
y
speed above 40 m/s extending along a south- al 1987). Refined mapping of the 1:50 year F(y) = e–e (3)
west to northeast axis in both cases, and gust wind speed and associated probability
relatively lower wind speeds for the northern models for wind speed across the country Furthermore, the distribution parameters
parts of the country. was reported by Kruger et al (2013a & b). can be obtained from the mean (µV) and
Separate mapping of the 1:50 year hourly standard deviation (σV) of V as α = 0.78 σV
Trends in mapping the strong mean wind speed was maintained since its and βV = µV – 0.577 α. The inverse expres-
wind climate inclusion in SABS 0160:1980. sion gives the wind speed V PE as a function
From the early stages of the development of of the exceedance probability PE as:
wind speed maps for wind load design, the Assessment of design implications
main attributes to be accounted for were The implementation of the latest results in V PE = µV – σV (0.45 + 0.78 ln(–ln(1–PE)))(4)
identified as: the use of observations to characteristic gust wind speed as basic free
obtain annual extreme values; the statistical field wind speed map (vb,0), and the associ- Characteristic wind speed
analysis of the data to derive 1:50 year values; ated extreme value probability models used The characteristic wind speed (vk) is stipu-
geographic differentiation; design procedures for the mapping, need to be assessed against lated as the 2% fractile (or 1:50 year value),
based on gust wind speed, whilst a ccounting the context of referencing SANS 10160-3 which can be interpreted as the expected
for typically hourly mean wind speed; wind to Eurocode EN 1991-1-4 (Goliger et al maximum (mean) wind speed over a 50-year
speed statistics accounting for both the 2009a & b; Retief & Dunaiski 2009). reference period, where the reference period
Journal of the South African Institution of Civil Engineering • Volume 59 Number 4 December 2017 9may be related to the design service life for Table 2: Example implementation of wind load reliability modelling
‘normal’ structures. Accordingly, the char-
Parameter Cape Town Durban Johannesburg
acteristic wind speed can be derived from
Equation 4 as: µV (m/s) 27.70 26.10 24.40
σV (m/s) 4.08 2.76 3.94
vk = µV + 2.59 σV(5)
CoV V 0.15 0.11 0.16
The characteristic wind speed is therefore
significantly higher than the mean annual vk (m/s) 38.30 33.20 34.60
extreme wind and quite sensitive to the
γ Q,W 1.39 1.30 1.42
standard deviation, as determined from
extreme wind statistics.
The wind load QW can be expressed as three major metropolitan centres of the sound basis for updating the provisions for
the product of v 2 and the conversion factor country, based on data obtained from the geographic distribution of the basic free
QWE that provides for the wind engineering Kruger et al (2013a). The example demon- field wind speed. Recent information on reli-
procedures, such as the wind speed profile strates how the two reliability-based design ability modelling of wind loading, based on
and pressure coefficients. The characteristic parameters {vk ; γ Q,W } are related to the the updated probability models for extreme
wind load is then given by Equation 4, where probability model for the annual extreme wind and the design procedures used by
CoV is the coefficient of variation (σV/µV): wind speed (V). SANS 10160-3:2010, provides an opportunity
The reliability modelling does not include to reassess the design provisions (Botha
QW,k = QWE (µV + 2.59 σV)2 the uncertainties of the time-invariant wind 2016). The concurrent implementation of
= QWE µVk 2(1+ 2.59 CoV V)2(6) engineering modelling regarding the conver- a revised map of vb,0 and partial wind load
sion of the free field wind pressure and the factor γ Q,W in SANS 10160-3 is presently
Design wind load load, as distributed across the structure. in progress.
The design wind load can be obtained by Both the uncertainties and the bias of the
determining the wind speed according to design procedures have a significant influ-
Equation 4 for an exceedance probability (PF) ence on the calibration of γQ,W (Retief & REFERENCES
that corresponds with the appropriate target Dunaiski 2009). Recent investigations include Botha, J, Retief, J V, Holický, M & Barnardo-Viljoen,
reliability (βT), with the equivalence given by the reliability assessment of extreme value C 2014. Development of probabilistic wind load
the relationship PF = Φ(–β), where Φ is the models for V and determining uncertainties model for South Africa. Proceedings, Conference
cumulative normal distribution function. The of time in variant wind engineering models of the Italian Association for Wind Engineering
target reliability for a 50-year reference period for converting the free field wind into loads, IN-VENTO 2014 XIII, 22–25 June, Genoa, Italy.
is selected as βT = 3.0 for SANS 10160 (Retief integral reliability modelling and assessment Botha, J, Retief, J V & Viljoen, C 2015.Variability of time
& Dunaiski 2009). Since the probability model of wind loading (Botha et al 2014, 2015, 2016; independent wind load components. Proceedings,
for wind speed is given by Equation 3 for an Botha 2016). 12th International Conference on Applications
annual reference period, either the wind load of Statistics and Probability in Civil Engineering,
model should be adjusted to a 50-year refer- ICASP12, Vancouver, Canada, July 2015.
ence period, or the target reliability should be CONCLUSIONS Botha, J, Retief, J V & Viljoen, C 2016. Application
adjusted to an annual reference period. The Steady progress in accounting for the strong of the Monte Carlo method for the reliability
former process was followed by Retief et al wind climate, based on observations and treatment of wind load variables using Bayesian
(2013) to obtain suitable wind load models. probability modelling to derive pre-specified hierarchical models. Proceedings, 6th International
Based on the relationship between annual characteristic wind speed values as input Conference on Structural Engineering, Mechanics
and 50-year exceedance probabilities, it can to wind load design procedures, is recorded and Computation, SEMC 2016, 5–7 September,
be shown that βT.1 = 4.0 for a one-year refer- in this review. With the introduction of Cape Town.
ence period is equivalent to βT.50 = 3.0 for reliability-based design for SABS 0160:1989, Botha, J 2016. Probabilistic models of design wind loads
50 years. Furthermore, using the sensitivity probability models for wind speed are in South Africa. PhD Thesis. Stellenbosch University.
factor αE = 0.7 to obtain the target reliability also incorporated in the calibration of the BSI (British Standards Institution) 1952. CP3: Chapter
for actions as βT.1.E = 0. × 4.0 = 2.8, the partial wind load factor (Kemp et al 1987; V, Part 2: Code of Basic Data for the Design of
exceedance probability for the design wind Milford 1987). Buildings. London: BSI.
load can be obtained as 2.4 × 10 –3. The Insufficient updated information on prob- BRE (Building Research Establishment) 1989. The
expression for the design wind load is then ability models for wind speed was, however, assessment of wind loads. Part 3: Wind climate in the
given by Equation 7. From Equations 6 and 7, available for incorporation into the latest stan- United Kingdom. BRE Digest 346, London: BRE.
Equation 8 provides an expression for partial dard for wind loading SANS 10160-3:2010. EN (European Standard) 1991. 1991-1-4:2005. Eurocode
wind load factor (γ Q,W) simply as the ratio Whilst the new standard introduced an 1: Actions on Structures. Part 1-4: General Actions
QW,d/QW,k (see Equation 2). extensive advancement of wind loading design – Wind Actions. Brussels: European Committee for
procedures, only nominal adjustment of the Standardization (CEN).
QW,d = QWE µV 2(1 + 4.27 CoV V)2(7) basic wind speed and reliability provisions Goliger, A M 1999. Wind loading specifications in the
limited the degree to which provision could SA loading code. Civil Engineering, 7(4): 19–21.
(1 + 4.27 CoV V)2 be made to South African conditions (Goliger Goliger, A M 2007. South African wind loading
γ Q,W = (8)
(1 + 2.59 2
V) et al 2009a & b; Retief & Dunaiski 2009). specifications: The Euro-way? Journal of Wind
Subsequent investigations of the South Engineering and Industrial Aerodynamics, 95: 9–11.
An example of the implementation of African strong wind climate, as represented Goliger, A M 2016. Wind engineering science and its
Equation 8 is provided in Table 2 for the by Figure 10 (Kruger et al 2013b), provide a role in optimizing the design of the built environment.
10 Journal of the South African Institution of Civil Engineering • Volume 59 Number 4 December 2017DEng Thesis. Stellenbosch University. Available at: Kruger, A C, Goliger, A M, Retief, J V & Sekele, S 2010. Retief, J V & Dunaiski, P E 2009. The limit states basis
http://www.scholar.sun.ac.za/handle/10019.1/98799. Strong wind climatic zones in South Africa. Wind of structural design for SANS 10160-1. Chapter 1-2
Goliger, A M, Milford, R V & Mahachi, J 2001. Proposed and Structures, 13(1): 37–55. in Retief, J V & Dunaiski, P E (Eds.). Background to
wind loading specifications of the SABS 0160. Kruger, A C, Goliger, A M, Retief, J V & Sekele, SS 2012. SANS 10160. Stellenbosch: SUN MeDIA.
Proceedings, International Conference on Structural Clustering of extreme winds in the mixed climate of Retief, J V, Barnardo-Viljoen, C & Holický, M 2013.
Engineering, Mechanics and Computation, Cape South Africa. Wind & Structures, 15(2): 87–109. Probabilistic models for the design of structures
Town, 2–4 April, Vol. 2, 1305–1312. Kruger, A C, Retief J V & Goliger A M 2013a. Strong against wind loads, Proceedings, 5th International
Goliger, A M, Niemann, H-J & Milford, R V 1998. winds in South Africa: Part I: Application of Conference on Structural Engineering, Mechanics
Assessment of wind-load specifications of the SABS estimation methods. Journal of the South African and Computation, SEMC 2013, 2–4 September 2013,
0160:1989. Proceedings, SAICE Loading Conference, Institution of Civil Engineering, 55(2): 29–45. Cape Town.
9–10 September, Johannesburg. Kruger, A C, Retief, J V & Goliger, A M 2013b. Strong Retief, J V, Dunaiski, P E & Day, P W 2009. An overview
Goliger, A M, Retief, J V & Dunaiski, P E 2009a. Review winds in South Africa. Part II: Mapping of updated of the revision of the South African Loading Code
of codification of wind-loading for structural design. statistics. Journal of the South African Institution of SANS 10160. In Retief, J V & Dunaiski, P E (Eds.).
Chapter 3-1 in Retief J V & Dunaiski P E (Eds.) 2009. Civil Engineering, 55(2): 46–58. Background to SANS 10160. Stellenbosch: SUN
Background to SANS 10160. Stellenbosch: SUN Kruger, A C, Retief, J V & Goliger, A M 2017. MeDIA, 1–24.
MeDIA. Development of an updated fundamental basic SABS 024:1952. Comprehensive Model Building
Goliger, A M, Retief, J V Dunaiski, P E & Kruger, A C wind speed map for SANS 10160-3. Journal of Regulations. Chapter 3: Loads. A Guide to Building
2009b. Revised wind-loading design procedures for the South African Institution of Civil Engineering, By-Laws for Local Authorities. Pretoria: South
SANS 10160. Chapter 3-2 in Retief, J V, Dunaiski, P E 59(4): 12–25. African Bureau of Standards.
(Eds.). Background to SANS 10160. Stellenbosch: Louw, W J & Kastiambirtas, E No date. The estimation SABS 0160:1980. The General Procedures and Loadings
SUN MeDIA. of extreme wind gusts from inadequate data. to be Adopted for the Design of Buildings. Pretoria:
Hansen, S O 2013. Wind loading design codes. Obtained from the Meteorology Institute of South African Bureau of Standards.
Proceedings, 6th European–African Conference on München University (UDC 551.553.6(68)). SABS 0160:1989. The General Procedures and Loadings
Wind Engineering, Cambridge, UK, 7–11 July 2013. May, H I 1972. Some wind speed data for estimating to be Adopted in the Design of Buildings. Pretoria:
Holický, M 2009. Reliability Analysis for Structural loads on structures in South Africa. The Civil South African Bureau of Standards.
Design. Stellenbosch: SUN MeDIA. Engineer in South Africa, 14(5): 175–180. SANS (South African National Standard) 2010. SANS
Holmes, J D 2001. Wind Loading of Structures. London: Milford, R V 1986a. Extreme-value analysis of South 10160-3:2010. Basis of Structural Design and Actions
Spon Press. African mean hourly wind speed data. Unpublished for Buildings and Industrial Structures. Part 3: Wind
Kemp, A R, Milford, R V & Laurie, J A P 1987. Proposals Internal Report 85/1, Structural and Geotechnical Actions. Pretoria: SABS Standards Division.
for a comprehensive limit states formulation for Engineering Division, National Building Research SAWB (South African Weather Bureau) 1949.
South African structural codes. The Civil Engineer in Institute, CSIR, Pretoria. Oppervlakwinde in Suid-Afrika. Surface winds of
South Africa, 29 (9): 351–360. Milford, R V 1986b. Extreme value analysis of South South Africa. Report WB8. Pretoria: South African
Kruger, A C 2004. Climate of South Africa. Climate African gust speed data. Unpublished Internal Weather Bureau.
Regions. Report WS45. Pretoria: South African Report 85/4, Structural and Geotechnical TMH7 1981. Code of Practice for the Design of Highway
Weather Service. Engineering Division, National Building Research Bridges and Culverts in South Africa. Parts 1 & 2.
Kruger, A C 2011. Wind climatology of South Africa Institute, CSIR, Pretoria. (Revised 1988). Pretoria: Committee of State Road
relevant to the design of the built environment. PhD Milford, RV 1987. Annual maximum wind speeds for Authorities, Department of Transport.
Thesis, Stellenbosch University. Available at: http:// South Africa. The Civil Engineer in South Africa, Wieringa, J & Rijkoort, P J 1983. Windklimaat van
www.hdl.handle.net/10019.1/6847. 29(8): 5–15. Nederland. Den Haag: Staatsjuitgeverij.
Journal of the South African Institution of Civil Engineering • Volume 59 Number 4 December 2017 11TECHNICAL PAPER Development of an updated
Journal of the South African
Institution of Civil Engineering fundamental basic wind
ISSN 1021-2019
Vol 59 No 4, December 2017, Pages 12–25, Paper 1739 speed map for SANS 10160-3
DR ANDRIES KRUGER obtained his MSc degree A C Kruger, J V Retief, A M Goliger
from the University of Cape Town in the
Geographical and Environmental Sciences, and
his PhD from the University of Stellenbosch in
Civil Engineering, with the research topic Wind This paper evaluates the need for updating the strong wind climate stipulations of South Africa
Climatology and Statistics of South Africa relevant to for the design of structures in accordance with SANS 10160-3:2010, as based on the latest
the Design of the Built Environment. Since 1985 he
information presented by Kruger et al (2013a; 2013b). The primary objective is to provide the
has been involved in the observation, analysis
and research of historical climate at the South African Weather Service. This has geographic distribution of the characteristic gust wind speed by means of the fundamental
included climate change and variability research, the authoring of general value of the basic wind speed, stipulated as vb,0 in SANS 10160-3. A reassessment of previously
climate publications, and other climatological studies through consultation. He published information is made to incorporate additional wind speed modelling results and to
is the author or co-author of a substantial number of scientific publications. investigate identified anomalies. The format of presentation, based on local municipal districts,
Contact details: is subsequently motivated, assessed and implemented. In order to provide for situations
Chief Scientist Department of Geography requiring the consideration of the dynamic effects of wind loading, similar information on
Climate Data Analysis & Research Geoinformatics and Meteorology
characteristic hourly mean wind speed is provided. It is concluded that the presentation of wind
Department: Climate Service University of Pretoria
South African Weather Service Pretoria 0002 speed on a district basis provides an effective balance between the spatial resolution of the
Private Bag X097, Pretoria 0001 South Africa available information and its use in operational standardised design.
South Africa
T: +27 12 367 6074
E: andries.kruger@weathersa.co.za
INTRODUCTION The updated maps and statistics not only
Stipulation of the geographical distribution take into account the historical increase in
PROF JOHAN RETIEF, who is a Fellow of the South
African Institution of Civil Engineering, is Emeritus
of the free field wind speed across South the availability of extreme wind data in South
Professor in Civil Engineering at Stellenbosch Africa provides a direct link to the strong Africa (presently at least seven-fold), but also
University. His field of interest is the development wind climate of the country and the design considers a range of the most widely applied
of risk and reliability as the basis of design for wind loads on structures. The nominal treat- statistical procedures utilised internationally
structures, with specific applications to wind
loading, structural concrete and geotechnical
ment of the map of the fundamental value in the estimation of extreme wind statistics.
practice, amongst related topics. He is a member of the basic wind speed vb,0 was identified The choice of appropriate statistical methods
of SABS TC98 Structural and geotechnical design standards, and is the national as one of the major deficiencies of the South depends largely on the length and quality
representative to ISO TC98 Bases of design and actions on structures, and a African National Standard SANS 10160:2010 of data records, the exposures of associated
member of various Working Groups of these TCs (technical committees). He
Basis of structural design and actions for measuring instruments, the mixed strong
holds degrees from Pretoria University, Imperial College, Stanford University
and Stellenbosch University. buildings and industrial structures Part wind climate of South Africa, as well as the
3 Wind Actions (Goliger et al 2009). The averaging time scales. For example, there are
Contact details:
Department of Civil Engineering publication of SANS 10160-3:2010 (reissued fundamental differences between the methods
Stellenbosch University in 2011 with corrections) was therefore suitable for the estimation of extreme hourly
Private Bag X1, Matieland, Stellenbosch 7602, South Africa followed up with extensive investigations average wind speeds, which have high volumes
T: +27 21 808 4442 into the strong wind climate of South Africa of temporally interdependent strong wind
E: jvr@sun.ac.za
and the statistical treatment of strong wind values in their associated data sets, and gust
observations to derive extreme value prob- speeds, which have lower interdependence.
DR ADAM GOLIGER obtained his MSc degree
from the Warsaw Technical University, and his
ability models, and the compilation of repre- This paper presents the background
PhD and DEng degrees from Stellenbosch sentative free field wind speed maps (Kruger to the reassessment and application of the
University, all in Structural Engineering. Until 2016 2011; Kruger et al 2013a; 2013b). strong wind information in a format that is
(for more than 30 years) he was involved in Prior to the latest revisions of extreme suitable for implementation in standardised
research and consulting work at the CSIR (Council
wind statistics, a comprehensive strong structural design and thereby for incorpora-
for Scientific and Industrial Research). This
included wind-tunnel simulation and modelling wind analysis for the purpose of the South tion into an update of SANS 10160-3. The
techniques, wind damage and environmental studies around buildings. For African loading standard was conducted in stipulation of the basic wind speed provides
several years he served as the South African representative on the International 1985 (Milford 1985a; 1985b). Considering the starting point for the process. The
Association for Wind Engineering (IAWE), and participated in various local and
that wind loading represents the dominant representation of vb,0 as the gust wind speed
international committees and research panels. He is the author or co-author of
more than 100 scientific publications and numerous technical reports. environmental action in South Africa to be constitutes the only rational way to resolve
considered in the design of structures, an the differences between synoptic, convective
Contact details:
Council for Scientific and Industrial Research (CSIR)
accurate estimation of strong winds is of car- thunderstorm and mixed climate strong
T: +27 83 660 8205 dinal importance to the built environment, wind. This implies that the introduction of
E: adam.goliger@gmail.com and should be updated as new information vb,0 as the 10-minute mean wind speed, in
becomes available. A review of the historical order to be consistent with the reference
development of climatic data for wind load Eurocode standard EN 1991-1-4:2005, ought
Keywords: basic wind speed, wind loading code, mapping, strong wind climate, design in South Africa is provided by Goliger to be reversed to the practice followed in
South Africa, extreme wind statistics et al (2017). SABS 0160:1989. The stipulation of vb,0 as
12
Kruger AC, Retief JV, Goliger AM. Development of an updated fundamental basic wind speed map for SANS 10160-3.
J. S. Afr. Inst. Civ. Eng. 2017:59(4), Art. #1739, 14 pages. http://dx.doi.org/10.17159/2309-8775/2017/v59n4a2You can also read