Offshorewindtage 2019 Heiligendamm - Optimizing Operations Implementing lessons-learned Supporting global expansion Attracting new investors

Page created by Carrie Reyes
 
CONTINUE READING
Offshorewindtage 2019 Heiligendamm - Optimizing Operations Implementing lessons-learned Supporting global expansion Attracting new investors
Offshorewindtage
    2019 Heiligendamm
    Optimizing Operations
    Implementing lessons-learned
    Supporting global expansion
    Attracting new investors

0                                  March 2019
Offshorewindtage 2019 Heiligendamm - Optimizing Operations Implementing lessons-learned Supporting global expansion Attracting new investors
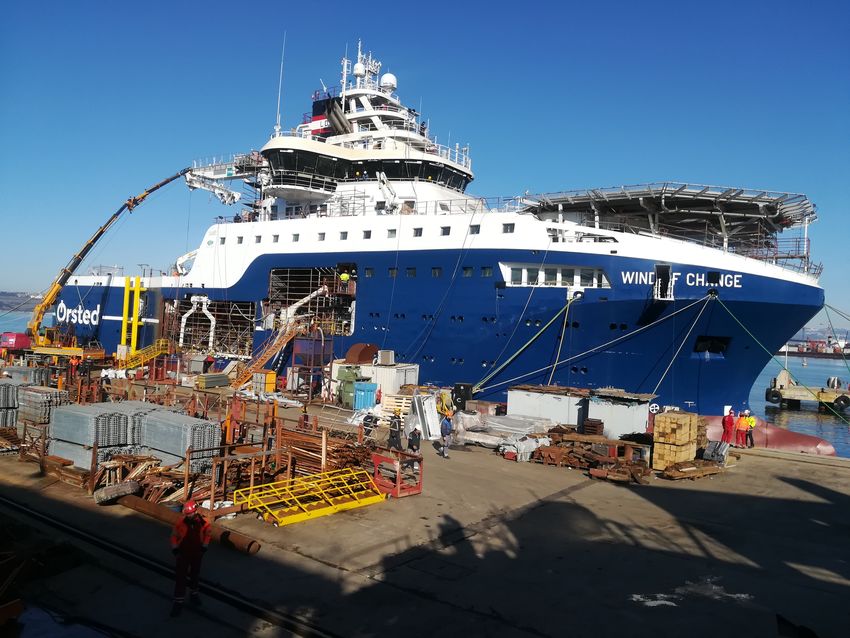
Ørsted develops energy systems that are green, independent
and economically viable
                                                   • Revenue (2018): DKK 76.9 bn                                    Major Shareholders (voting share %)
                                                                                                                    • Danish State             50%
                                                   • EBITDA (2018): DKK 30.0 bn
                                                                                                                    • Seas NVE                 10%
                                                   • 6,080 employees                                                • Capital Group            5-10%

                                                   • Active in Scandinavia, United Kingdom, Germany, The Netherlands, USA, Taiwan and Japan

    Offshore                              Onshore                                 Bioenergy                              Customer Solutions

    – Global leader in offshore wind      – US onshore wind portfolio with        – #1 in Danish heat and power          – Develop green, innovative and
      with 5.6 GW operational capacity      813 MW operational capacity             generation with 25% of market          cost efficient solutions for our
    – Develop, construct, own and                                                                                          B2B customers
                                          – Develop, construct, own and           – Converting heat and power
      operate offshore wind farms           operate onshore wind farms              plants from coal and gas to          – Provide competitive route-to-
    – Significant and attractive build-                                             biomass                                market for own and customers’
                                          – 184 MW under construction and a
      out plan of 3.4 GW towards 2022                                                                                      generation portfolio
                                            pipeline of more than 1.5 GW          – Innovative waste-to-energy
    – Ambition of 15 GW installed                                                   technology (Renescience)             – Optimize activities within natural
      offshore wind capacity by 2025      – Energy storage solutions with the                                              gas
                                            first 20 MW battery storage
                                            project in operation                                                         – Market trading operations to
                                                                                                                           optimize hedging contracts
                                          – Solar: first large-scale solar PV
                                            project Permian Solar 250 MW

1
Offshorewindtage 2019 Heiligendamm - Optimizing Operations Implementing lessons-learned Supporting global expansion Attracting new investors
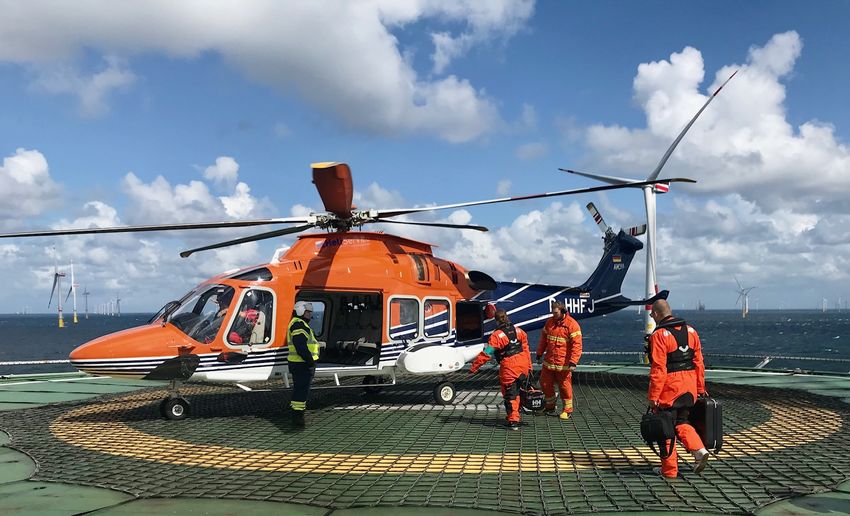
Ørsted’s strategic playing field

A purpose-driven, global, green energy leader

       Renewables generation                      Storage          T&D             Consumption

                                                                                    Wholesale
             Offshore wind

                                                                               Corporate customers
                                                 Electricity
                                                  storage       Electricity
             Onshore wind                                      transmission
                                                                               Residential customers
                                                                    and
                                                                distribution

                Solar PV                                                          Electric heating

                                                Power-to-gas
               Bioenergy                                                         Electric vehicles

    Invest to grow   Explore potential   Exit    No presence

2
Offshorewindtage 2019 Heiligendamm - Optimizing Operations Implementing lessons-learned Supporting global expansion Attracting new investors
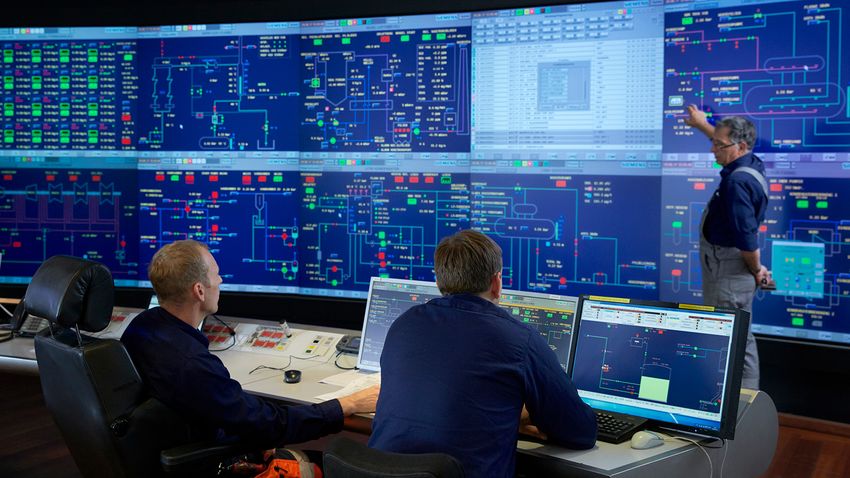
Significant transformation of Ørsted over the past decade 1

    CO2 emissions reduced                              Operating profit (EBITDA)             Capital employed           International expansion
    by almost three quarters                           DKK bn
                                                                           Renewables
                                                                                             DKK bn
                                                                                                           Renewables
                                                                                                                        Share of operating profit (EBITDA)
    g/kWh                                                                                                               %

                    - 72%                                                 37%                                                     International
                                                                                                                                    share +5x
           462                                                                        15.0                      83

                                                                                                      57
                                                                9.3

                                                                                                                87%

                               131

                                                                                                  16%
          2007                 2018                            2007                      2
                                                                                      2018        2007          2018         2007             2018

Note 1: figures taken from Ørsted’s Annual Report 2018 and Capital Markets Day 2018
Note 2: excludes EBITDA contribution from new partnerships

3
Offshorewindtage 2019 Heiligendamm - Optimizing Operations Implementing lessons-learned Supporting global expansion Attracting new investors
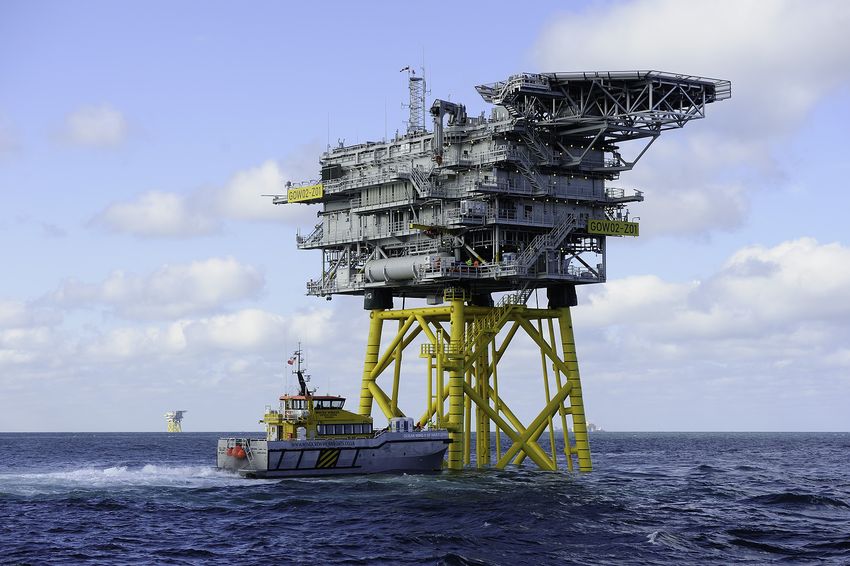
Ørsted strategic transformation

Green share of power generation ~99% in 2025, approximating zero emissions

    Ørsted share of green power and heat                     gCO2e/kWh
                                                99
    %                                  95                     600

                            80                                500

                                                                                        Global energy sector emission target to
                                                                                        stay below 2-degree global warming
                  64                                          400

                                                              300
                                                                          Ørsted CO2 emissions

                                                              200

        17
                                                              100

                                                                0
        2006     2017      2020       2023     2025             2010   2015   2020   2025   2030    2035   2040    2045    2050

4
Offshorewindtage 2019 Heiligendamm - Optimizing Operations Implementing lessons-learned Supporting global expansion Attracting new investors
Ørsted green growth ambition for 2030

Installed renewables capacity
GW                                                                            Offshore wind          Onshore wind   Bioenergy   Renewables1

                                                                                                                    +30 GW

                                                                                     Volume growth not an
                                                                                   objective in itself – focus is
                                                                                       on value creation

                                                                             10 GW

                           2 GW
                               2010                                            2020                                      2030

Note: 2020 includes Borssele 1&2 capacity, COD expected in Q4 2020/Q1 2021
1. Includes onshore wind, offshore wind, solar PV, storage and biomass

5
Offshorewindtage 2019 Heiligendamm - Optimizing Operations Implementing lessons-learned Supporting global expansion Attracting new investors
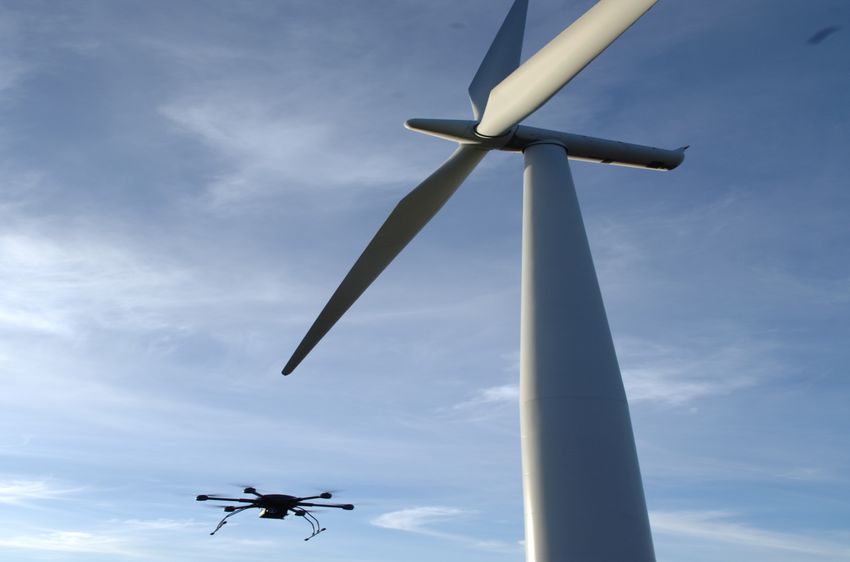
Ørsted Offshore overview

Ørsted offshore wind global footprint                                                                                Unparalleled experience and track record
North America                                        Europe                                           Asia Pacific
                 Bay State Wind
              Revolution Wind
              South Fork
              Block Island
             Ocean Wind
          Garden State                                                                                                             25+ years of experience
        Skipjack                                                                                Formosa 1.1
      Coastal Virginia                                                                         Formosa 1.2             1991        and track record in the             2018
                                                                                       Greater Changhua projects                 offshore wind power sector

                                                                                             Anholt
                                                                                                                        26 offshore wind farms    5 offshore wind farms
                                     West of Duddon Sands                                                                    in operation          under construction
                Walney Extension                                     Horns Rev 1 & 2
                                                    Westermost Rough                                  Avedøre
                                                             Hornsea 1
                Walney 1 & 2                                    Hornsea 2                        Vindeby
                                                                   Hornsea 3 & 4
                Isle of Man                                                                         Nysted
                                                                Race Bank
                                                                                       Gode Wind 2
                                                      Lincs                            Gode Wind 4
                Barrow                                                                                                     5.6 GW           ~ 2,450            3.4 GW
                                                                                      Gode Wind 3
                                               Gunfleet Sands 1 & 2                  Gode Wind 1                         Constructed       Dedicated             under
                Burbo Bank Ext.                                                                                           capacity         employees          construction
                                                                                   Borkum Riffgrund 1
                             Burbo Bank
                                                                                 Borkum Riffgrund 2
                                          Gunfleet Sands 3      Borssele 1&2    Borkum Riffgrund West 1&2
                                                        London Array
                                                                               OWP West
                                                                                                                                           ~ 1,150
                                                                                                                         13 million
                                                                                                                                           turbines               23
    In operation                                                                                                          people
                                                                                                                                            World's           Partnerships
    Under construction                                                                                                   with clean
                                                                                                                                             leading
                                                                                                                         electricity
    Under development                                                                                                                       operator

    Decommissioned after 25 years

6
Offshorewindtage 2019 Heiligendamm - Optimizing Operations Implementing lessons-learned Supporting global expansion Attracting new investors
Ørsted built a strong integrated end-to-end business model

Ørsted Offshore core competencies                                                                                              ~2,450       Full-time employees

                                     ~250                          ~1,300                                 ~700                                                  ~200

      Develop                                Build                                 Operate                                     Own
      Identify and                           Manage                                Conduct life-cycle                          M&A, attract capital
      mature projects                        construction,                         maintenance                                 through partnerships,
                                             sourcing and supply                                                               asset management

                                                                                                          Full-time employees
                                                                                                                                                                         2,450

    ü       Ability to design and optimise projects with a 'total life-cycle cost of wind farm' mindset

    ü       Experience and expertise along the entire value chain allow for better understanding
            and management of risks
                                                                                                                                                               650

    ü       End-to-end model reduces LCoE through fast feedback and learning across the entire
            organisation
                                                                                                             40      70       75    100   160
                                                                                                                                                250     250

                                                                                                          Northland
                                                                                                                    Equinor   CIP   SSE   WPD   Innogy E.ON Vattenfall
                                                                                                           Power

7   Ørsted Offshore, February 2019
Offshorewindtage 2019 Heiligendamm - Optimizing Operations Implementing lessons-learned Supporting global expansion Attracting new investors
Ørsted pioneered the offshore wind industry …
 Unrivalled track-record in offshore wind
 Ørsted cumulative constructed offshore wind power capacity, MW                                                                                                 12,760 MW

                                                                                                                                                   8,943 MW

                                                                                                                                       7,557 MW
                                                                                                                        5,587 MW
                                                                                                            3,849 MW
                                                                                              3,009 MW
                                                                                 2,487 MW
                                                                2,098 MW
                                                   1,371 MW
                                       1,004 MW
                         476 MW
5 MW          50 MW

1990         2000          2005         2010         2012         2013            2014          2016          2017           2018          2020         2022            2025

       Pre-2009: Project by project                      Post-2009: Industrialised approach to planning and execution of offshore wind projects

 Selected projects

                 Vindeby                               Horns Rev 1                              Walney Extension                              Hornsea 1
          First offshore wind farm             First large scale offshore wind            The largest operational offshore          The world’s largest offshore wind
                 in the world                          farm in the world                       wind farm in the world                    farm once constructed

                                5 MW                                   160 MW                                     659 MW                                    1,218 MW

     Turbine capacity       0.45 MW         Turbine capacity         2 MW                Turbine capacity      7-8.25 MW            Turbine capacity       7 MW
     Nr. of turbines        11              Nr. of turbines          80                  Nr. of turbines       87                   Nr. of turbines        174
     Rotor diameter         35 m            Rotor diameter           80 m                Rotor diameter        154-164 m            Rotor diameter         154 m
     Distance to shore      1.8 km          Distance to shore        18 km               Distance to shore     19 km                Distance to shore      120 km

 8
Offshorewindtage 2019 Heiligendamm - Optimizing Operations Implementing lessons-learned Supporting global expansion Attracting new investors
… and is today the global leader

    Largest offshore wind power player globally today                                                                                    Ørsted Offshore’s scale enables cluster synergies
    Global offshore wind capacity, GW
      30%    10%        7%       10%      2%       2%       3%       4%       2%     1%         0%       1%      2%        1%    1%         1•   UK West coast (East Irish Sea): Barrow, Burbo Bank,
                                                                                                                                                 Burbo Bank Extension, West of Duddon Sands, Walney
      9.0                                                                                                                                        1, Walney 2, Walney Extension

                                                                                                                                            2•   East UK North: Westermost Rough, Lincs,      Race
                                                                            Other                                                                Bank, Hornsea 1, Hornsea 2

                                                                                                               30%                          3•   East UK South: London Array 1, Gunfleet Sands 1,
      3.4
                         UK                         5.7 GW                                                                                       Gunfleet Sands 2, Gunfleet Sands 3
                                                                               40%
                         Germany                    1.4 GW                                                                                  4•   Germany: Borkum Riffgrund 1, Borkum Riffgrund 2,

      3.6
                         Denmark                    1.0 GW                           ~30GW                                                       Gode Wind 1, Gode Wind 2

                         Netherlands                0.8 GW                                                                                  5•   Danish waters 2: Anholt, Avedøre, Nysted, Horns Rev 2

                                                                                                                                                 Dutch waters: Borssele 1 & 2                                    5
                                                                                                               16%                          6
                                                                                      3%
                                                                                           4%
                                                                                                                       RWE / E.ON
                                                                            EnBW                  7%
                                                                                                                                                                            1
                                                                                Iberdrola
                                                                                                                                                                                                             4
                                                                                      Vattenfall                                                                                              2

             2.8       2.7
      5.6                                                                                                                                                                                                6
              0.9                                                                                                                                                                             3
                       1.4
                                 2.0

                                         1.1       0.9     0.9     0.8
              2.0                2.0                                         0.7     0.6                0.4                                        Synergies
                       1.4                0.7      0.6      0.3                              0.5                 0.4       0.4   0.4
                                                                             0.3                          0.2
                                          0.4      0.3
                                                            0.6      0.8
                                                                             0.4
                                                                                     0.3
                                                                                     0.3
                                                                                                0.5      0.3
                                                                                                         0.2
                                                                                                                 0.4
                                                                                                                           0.2
                                                                                                                           0.2
                                                                                                                                 0.4      ü      Lower logistics costs
                                                                                                0.1                  0.3
                                                                                                                            Mitsubishi    ü      Fewer technician hours
                                                         Northland
                    Vattenfall         Iberdrola
                                                          Power
                                                                             CIP            Shell               WPD          Diamond      ü      Fewer facilities needed
                                                                                                                            Generation
                                                                                                        China                             ü      Lower inventory levels
            Innogy           E.ON               EnBW              Equinor            SSE                               Eneco
                                                                                                      Longyuan
                                                                                                                                                 Operational offshore wind farms
      Constructed                 Under construction                       % share of global constructed capacity
                                                                                                                                                 Offshore wind farms under construction
                                                                                                                                                 Cluster
Source: Bloomberg New Energy Finance , February 2019, Ørsted analysis                                                                    Note 1: London Array is operated by London Array Limited
                                                                                                                                         Note 2: Horns Rev 1 is operated by Vattenfall however owned 40% by Ørsted

9
Ørsted offshore proven construction track-record and
leading operating capabilities
  Strong construction track-record due to full EPC1 control                 Leader in operating offshore wind power plants
                                                                            # of operated turbines, February 2019
       Country                    Asset        FID    Gross capacity (MW)

                        Borkum Riffgrund 2     2018          465
                                                                                                                             1,147
                         Walney Extension      2015          659

                                                                                  Siemens                            551   2x
                              Race Bank        2015          573

                       Burbo Bank Extension    2014          259
                                                                                     E.ON                           526

                           Gode Wind 1&2       2013          608
                                                                                Vattenfall                     437
                        Westermost Rough       2013          210

                        Borkum Riffgrund 1     2011          312                    Innogy               317

                              West of
                                               2011          389
                            Duddon Sands
                                                                               MHI Vestas             236
                                 Anholt        2010          400

                                                                                   Equinor         162
                            London Array       2009          630

                             Walney 1&2        2009          367
                                                                                       SSE        142

                             Horns Rev 2       2007          209

1. Engineering, procurement and construction
10
Robust and highly visible offshore wind build-out plan
11-12 GW ambition secured ahead of time – new ambition set towards 2025
Ørsted installed capacity projection towards 2025, GW
                                                                                                                                                                                                     15

                                                                                                                                                                                                   ~ +2
                                                                                                                                                                                12.9
                                                                                                                                                              1.0
                                                                                                                                            0.9
                                                                                                                         1.1
                                                                                   9.0                0.9
                                                                1.4
                                             0.8
       5.6                1.2

      2018            Hornsea 1        Borssele 1&2         Hornsea 2             2022           Greater             German            Greater            Deepwater             2025           New 2025
                      1,218 MW           752 MW 1           1,386 MW                            Changhua             Projects 2       Changhua             portfolio 3                         ambition
                                                                                               1&2a 900MW           1,142 MW         2b&4 920MW            954 MW                               ~15 GW

  Country

  On time / budget         /                  /                  /                                     /                   /                  /                 /

  FID timing        Feb. 2016            Jul. 2016        Sep. 2017                              Exp. 2019           Exp. 2021          Exp. 2023 Exp. 2020/2021

  Expected
  Commissioning      H2 2019           2020/2021           H1 2022                                  2021           2024/2025               2025          2022/2023

1. Ørsted will, in accordance with the Dutch tender regulation, build Borssele 1 and 2 within four years from December 2016 with a flexibility of 1 year
2. Ørsted has been awarded 5 German offshore wind projects with a total capacity of 1142 MW. The projects are planned to be commissioned in 2024/25, subject to Final Investment Decision (FID) by Ørsted in 2021
3. Subject to award of the Construction and Operations Plan (COP)
11
Ørsted has a long standing and proven track record in
developing successful partnerships
 European partnerships1                                                                                            North American partnerships1
         United Kingdom                                                                     Denmark                                                                               United States
  Walney Extension (50%)          Race Bank (50%)                               Horns Rev 1 (40%)                        Garden State                    South Fork (50%)   Bay State Wind (50%)
  659 MW (2017)                   573 MW (2016)                                 160 MW (2006)                            800 MW (2018)                   130 MW (2019)      800 MW (2016)

     Walney 1&2 (50.1%)           Hornsea 1 (50%)                               Nysted (42.7%)
     367 MW (2009 / 2010)         1,218 MW (2018)                               166 MW (2010)

  West Duddon Sands (50%)         Westermost Rough (50%)                        Anholt (50%)
  389 MW (2010)                   210 MW (2014 / 2018)                          400 MW (2011)

                                                                                                                         Coastal Virginia2                                  Revolution Wind (50%)
                                                                                                                         12 MW (2017)                                       704 MW (2019)

                                                                                                                    Asia Pacific partnerships1
                                                                                             Germany
                                                                                 Gode Wind 2 (50%)
                                                                                 263 MW (2014)

                                                                                 Gode Wind 1 (50%)
                                                                                 344 MW (2015)

 Burbo Bank Extension (50%)       London Array (25%)                             Borkum Riffgrund 1 (50%)
 258 MW (2016)                    630 MW (2009 / 2014)                           312 MW (2012)
                                                                                                                                                                                        Taiwan

  Gunfleet Sands (50.1%)          Lincs (25%)                                    Borkum Riffgrund 2 (50%)                                                                   Formosa 1 (35%)
  173 MW (2018)                   270 MW (2017 / 2018)                           465 MW (2017)                                                                              128 MW (2016 / 2018)

Note 1: The percentage in brackets represents Ørsted ownership interest and year when the partnership was created
Note 2: In 2017 Ørsted and Dominion Energy entered into a strategic partnership in which Ørsted will construct two 6-megawatt turbines off the coast of Virginia Beach
12
By 2030 offshore wind power will be truly global…

Strong growth in established and new offshore wind power markets
Installed capacity, GW
                                                                             ~ 13 GW

                                                                                12%
                                                                                       153.7   Offshore wind capacity with firm political commitment1
                                                                                       11.4
                                                                                               Targets in existing footprint markets
                                                                                                     The UK government has a CfD roadmap with bi-yearly auctions of
                                                                                                     2-4GW towards 2030 to reach 30GW

                                                                                                     Target of 15GW offshore wind by 2030

                                                                                                                                                                           ~81
                                                                                                     Offshore Wind Energy Roadmap 2030 outlines 11.5GW by 2030
                                                                                                     through 1GW per year post 2023
                                                                                       70.1
                                                          ~ 10 GW                                    MA 2027 (2035) target: 1.6 (3.2) GW. VA 2028 target: 2.0GW.
                                                                                                     NJ 2030 target: 3.5GW. NY 2030 target: 2.4GW.
                                                                                                                                                                                          GW
                                                           19%                                       Current 2025 target of 5.5GW which has already been reached
                                                                     86.0                            through grid allocation and price auction
                                                                     4.1                             Outlined plan for three 800MW (2.4GW) offshore wind projects before
                                                                                                     2030 by the Danish Government leading to a total of 5GW in 2030
                                                                                                     Authorities of Belgium have announced plans for offshore wind targets
                                                                                                     of 2.2GW by 2020 and 4GW by 2030
                                                                    39.5
                                      ~ 5 GW
                                                                                               Targets in next horizon markets
                                          25%
                                                   36.7
                                                                                       72.1          The Indian government has target of 5GW before 2022 and 30GW by

                                                                                                                                                                           ~46
                ~ 1 GW
                                                   12.4                                              2030

                                                                                                     The South Korean government has a total wind target of 18GW by
                                                                    42.4
                                                                                                                                                                                          GW
                                                                                                     2030 of which 13GW is allocated to offshore wind
                 33%        12.1
                                                   24.2
                                                                                                     France has a 2023 target of 3GW installed and 6GW in the pipeline
         0.7               11.0                                                                      post 2023

         2005              2015                    2020             2025               2030

     Americas        Asia Pacific         Europe
     #     GW addition/year           %         CAGR

Source: Bloomberg New Energy Finance (BNEF), 2H 2018 offshore wind market outlook              Note 1: Firm political commitment is defined by a country’s public offshore wind target by 2025/2030

13   Ørsted Offshore, February 2019
At the forefront of making the industry cost competitive

     Multiple levers to drive down cost in offshore wind
      1                                                                  2                                                                  3
                             Scale                                                           Innovation                                                     Industrialisation

          § Turbines and rotor size                                          § Foundation design (e.g. monopiles)                               § Transition from single supply to
                                                                                                                                                  multiple global suppliers
          § Sites                                                            § Electrical
          § Vessel size
          § Cable capacity

                               ü                                                                 ü                                                                  ü
                                                                                                                                                                                    220 m
     Rapid technological development                                                                                                               164 m
     Wind turbine rotor diameter, year of commissioning                                                             154 m

                                                                                       120 m
                                                             107 m
 Boeing 747, 76m                         90 m
                      80 m

                       2002              2005                 2007                     2011                        2014                           2016                            2021 1
1. In Mar. 2018 GE unveiled a 12 MW turbine. Each Haliade-X unit, will be capable of powering 16,000 homes and producing 67 GW/h per year, based on wind conditions on a typical German North Sea site

14
Levelized cost of electricity for different technologies
The rapid cost reductions in the industry, have made offshore wind power competitive relative to conventional power
generation based on fossil fuels
EUR/MWh 2016 prices

                                              - 60%
                     2012

                                                2017

                   165€                          65€                        55€                          66€                        70€                        72€                       113€
                   Offshore*                    Offshore**                  Onshore                      Solar PV                Natural gas                     Coal                     Nuclear***

Source: Bloomberg New Energy Finance (BNEF) for CCGT and Coal plants for Northwest Europe, Danish Energy Agency and BNEF for Offshore WInd.
For offshore wind: Including cost of transmission – Calculated as Levelised revenue (subsidy and market price) of electricity over 25yrs lifetime as a proxy for the levelised cost of society. 3,5% real discount rate
used. *Generic Offshore Wind, Northwest Europe, FID 2012. In 2012 our goal was to reduce offshore wind costs to 100 Euro/MWh in 2020, ** Hornsea 2, UK, *** Hinkley Point, UK. Same approach as for Offshore
Wind. Strike price of 92,5 £/MWh in 2012 real prices. Lifetime of 60yrs, 91% capacity factor.

15
Initiatives to improve performance

Initiatives to improve, optimize and execute the daily                    Initiatives to optimize the
service                                                                   performance of the wind farm

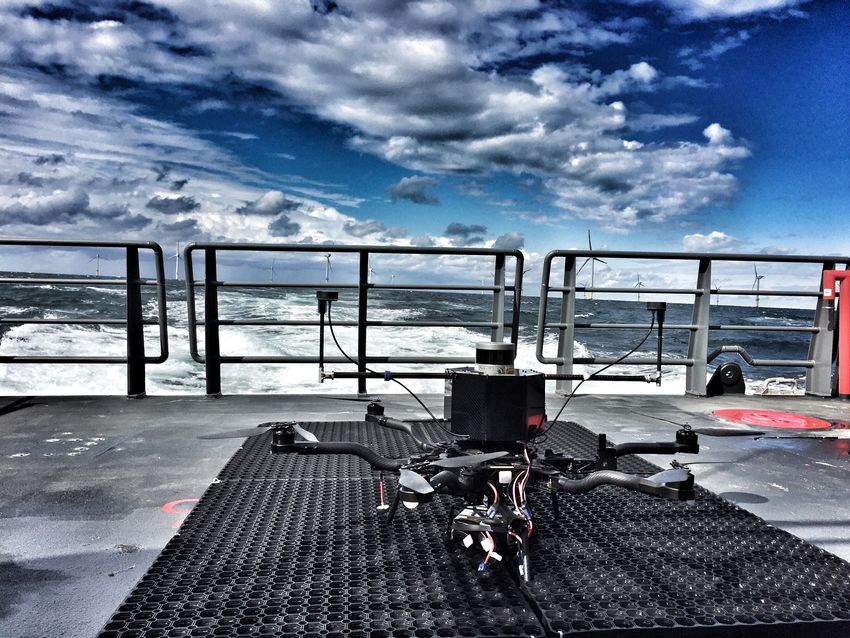
       New SOV, Wind of Change                                                                                    Advanced
                                                                                                                 Analytics Lab

                                         Inspection methods                      Control and
                                                                               monitoring centre

                                                                                                       Develop analytics models that can
                                                                                                       optimize production, and correct
                                                                                                       inefficiencies in wind turbines

                                                                          CMC center to improve diagnostics
       Purpose-built SOV to start in                                      and troubleshooting, increase # of
       May 2019. This will have                                           remote resets and reduce reset
       improved accessibility and be a                                    response times has now opened
       long-term solution
                                         Testing of drones for external
                                         blade inspection

  Site office                                                                                                    Back office

                                                                                                                                      $

  16
17
        Performance improvement through combination of access
        methods

 Accessibility to the wind farm with full logistics set-up
       100%

       80%

       60%
Days

       40%

       20%

        0%
              Jan   Feb   Mar    Apr May Jun   Jul   Aug Sep   Oct Nov Dec
                    Helicopter      SOV    CTV

        17
Ørsted is continually developing operational improvements, with
40 products released by Ørsted Lab in 2018
Example; release of HYPE (Yaw misalignment solution)
Situation pre and post solution      Solution development

                                     1.   Smart wind sensors installed replacing wind vanes (at
                                          low cost) for high accuracy wind speed and direction
                                          data
                                     2.   Turbine yaw misalignment data captured

Turbine alignment pre-solution       3.   Data used in the Ørsted Lab developed HYPE (patented)
                                          algorithm to correct yaw misalignment
                                     4.   Additional service agreement entered into with JV
                                          partnerships to implement solution at site

                                     Results
Turbine alignment post-solution
                                     ü Uplift in production of 0.2-0.3% for Siemens fleet
                                     ü Reduced lifetime integrity costs due to reduced loads on
                                       the structure and components
Performance improvements through faster and safer inspection
methods
Drones (autonomous / piloted by ABJ Drones)   Optical- and thermal-imaging; vessel based and
                                              pile-based

1. Optical and thermal
   imaging data collection
   via custom Unmanned
   Aerial Vehicle (UAV)
2. Structural and internal
   data processing
   through advanced
   artificial intelligence (AI)
   technology
3. 1 day for inspecting full
   turbine (three blades)                     1. Optical and thermal imaging data collection via vessel-
                                                 based or pile-based camera, measured at app. 100-200
                                                 metres distance
                                              2. 1 day for inspecting full turbine (three blades)

19
Performance improvement through optimized feed-in
via Transmission Capacity Management
                                                                                                                                                   Transmission
                                                                                                                                    System
                                                                                                                                                     Capacity
                      Ørsted  Trianel     Trianel                                             Ørsted           Merkur               AC 130            160 MW
                      BKR01 WP Borkum 1 WP Borkum 2                                           BKR02           Offshore              AC 131            160 MW
                      312 MW 200 MW      200 MW                                              450 MW           400 MW
                                                                                                                                    AC 108            200 MW
                                                                                                                                    AC 109            200 MW
      OWF                                                                                                                          DolWin a           800 MW
      Scope
                                                                                                                                    DC 602            800 MW
                                   AC                                                                     AC
                                 33 kV                                                                  33 kV                       AC 154            225 MW
                                 155kV                                                                  155kV
                                                                                                                                    AC 155            225 MW
     TSO Scope                AC 130           AC 108                                                AC 154              AC 156
                              AC 131           AC 109                                                AC 155              AC 157
                                                                                                                                    AC 156            200 MW
      Offshore
                                                                                                                                    AC 157            200 MW
                                                   AC Interlink DolWin a   -g                                                      DolWin g           900 MW
                                                                                                                                   DC 604             900 MW
                                  AC                           DC                    AC                           DC              AC Interlink
                                                                                                                                                      800 MW
                                155kV                         320kV                155kV                         320kV            DolWin a - g
                                       DolWin - a                                                           DolWin - g              Model based Temperature
                                                                                                                                    Monitoring of DC and AC Cables
                                 Nord-                  DC 602                                              DC 604                  and Transmission Capacity
     TSO Scope                   deich                                                                             Dörpen /         Management (TCM II)* for
      Onshore                                                                                                                       connected Offshore windfarms
                          Control                                                         HSL                       West            • Determination of Feed-in Profile
                           Room                                                          Lehrte                                       based on Power Output, Wind
                                                                                                               AC                     Forecast and Turbine
                                                                                                              380kV                   Availability

       *Main Goals of TCM II:
       • To avoid thermal overloading of offshore DC Cables (TSO’s AC Cables in a later stage)
       • To avoid overloading and consequently shutdown of HVDC converters and entire offshore grid connection systems
       • To avoid the violation of the 2K criterion of offshore DC Cables (TSO’s AC Cables in a later stage)
20     • To ensure the utilization of the highest possible transmission capacity considering bullet points above
Challenges (1): Grid build-out not matching offshore wind build-out

                                     Energy Demand
                         2018                         2025?

                      2020

21   Source: TenneT
Challenges (2): Additional Offshore Wind Farms In-feed of
  1,715 MW in 2019 (Diele, Dörpen West and Emden Ost)

NOR-2-3 (DolWin3) 900 MW              NOR-8-1 (BorWin3) 900 MW                   NOR-6-2 (BorWin2) 800 MW
  •    BKR02 (450 MW, COD in 2019)     •   Global Tech 1 (400 MW, COD in 2014)     •   Veja Mate (400 MW, COD in 2016)
  •    Merkur (400 MW, COD in 2019)    •   Hohe See (500 MW, COD in 2019)          •   Deutsche Bucht (252 MW, COD in 2019)
                                                                                   •   Albatros (113 MW, COD in 2019)

            +850 MW                              +500 MW                                      +365 MW

  22
Challenges (3): Scarcity of experienced offshore resources for
worldwide expansion
                                                                                                                   North American partnerships1
                                                                                                                                                                                  United States

                                                                                                                         Garden State                    South Fork (50%)   Bay State Wind (50%)
                                                                                                                         800 MW (2018)                   130 MW (2019)      800 MW (2016)

                                                                                                                         Coastal Virginia2                                  Revolution Wind (50%)
                                                                                                                         12 MW (2017)                                       704 MW (2019)

                                                                                                                    Asia Pacific partnerships1

Further countries and regions with build-out plans in
the next years:                                                                                                                                                                         Taiwan

France, The Netherlands, Italy, Poland, Sweden,
Japan, South Africa, South America, …                                                                                                                                       Formosa 1 (35%)
                                                                                                                                                                            128 MW (2016 / 2018)

Note 1: The percentage in brackets represents Ørsted ownership interest and year when the partnership was created
Note 2: In 2017 Ørsted and Dominion Energy entered into a strategic partnership in which Ørsted will construct two 6-megawatt turbines off the coast of Virginia Beach
23
Challenges (4): Secondary market for offshore wind investments
catching up and requiring substantial resources

                                              • Market for secondary offshore
                                                wind transactions catching up

                                              • Increasing interest from Asian
                                                players (not only to invest but also
                                                to learn from operating wind
                                                farms)

                                              • High effort needed due to level of
                                                support and interaction during due
                                                diligence phase

24   Source: Intralinks Deal Flow Predictor
Q&A
You can also read