Developing a monitoring system for Toyota Prius battery-packs for longer term performance issues
←
→
Page content transcription
If your browser does not render page correctly, please read the page content below
Developing a monitoring system for Toyota Prius
battery-packs for longer term performance issues
Peter Leijen Nihal Kularatna
AECS Ltd. School of Engineering
897 Valley Road The University of Waikato
Hastings, New Zealand Hamilton, New Zealand
peter@aecs.net nihalkul@waikato.ac.nz
Abstract—The Toyota Prius battery pack consists of 38 indi- to measure as we also need to take into account other failure
vidual battery blades, each blade contains 6 NiMH cells in series. methods such as short-circuited cells, etc [8]. Ref [9] details
This means that each pack contains 228 NiMH cells. Given this a method for measuring the SOH and the capacity of Prius
number of individually manufactured cells combined into a large battery packs. A major concern to Prius owners is the lifetime
battery pack, any individual cell or a blade getting weaker than of their battery pack. Toyota states that the battery pack will
all other linearly degrading cells, will become the performance
last 160,000 km or ten years. However as per the experience
limiting element in the pack. For example in a situation where one
blade weakens down to 1200mAh compared to all other 37 blades of companies such as AECS where this research work is
maintaining approximately 2400mAh capacity will make the car ongoing, Prius battery packs have failed prematurely. This
run only 1.3 km in EV mode, compared to 2.6 km if all 38 blades paper investigates the effects of a reduced-capacity blade, and
are of 2400mAh capacity. In order to identify such individually the effects of a blade with very poor SOH, on the performance
weak cells, a supercapacitor based monitoring system is designed of the battery pack. The paper also details a simple battery
and the paper indicates the approach in developing this system, model used to describe the behaviour of the battery blades
together with some details explaining the general performance of under different conditions and proposes a monitoring system
the overall system and how the new monitoring system can help for early detection and prevention of battery failure, based on
in managing the battery pack life issues in the Toyota Prius. a supercapacitor bank based sub-system.
Keywords - Electric Vehicles, Supercapacitors, Battery Man-
agement
II. TOYOTA PRIUS SYSTEM
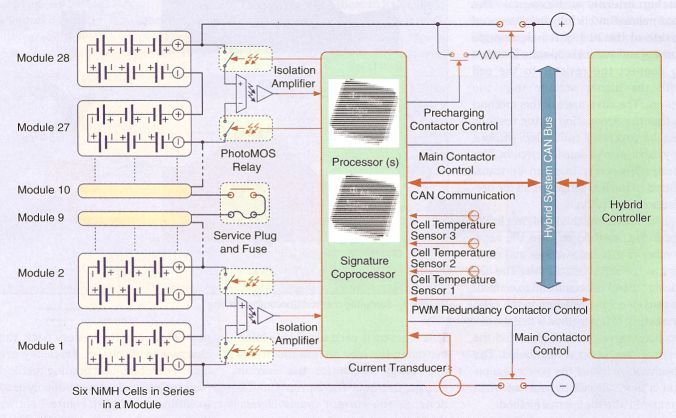
I. I NTRODUCTION The battery pack of the Toyota Prius consists of 38 NiMH
The most difficult issue in developing electric vehicles blades (Figure 1) each of which contain six NiMH cells in
(EV) and hybrid electric vehicles (HEV) is to get the optimally series [10]. Toyota has designed their system to operate in a
performing large capacity battery packs with suitable battery split battery fashion, i.e. the apparent ground (chassis) of the
management systems (BMS). Over the past two decades there HV battery pack occurs between blades 19 and 20, where the
has been a lot of research and development on the battery service plug is fitted. The battery management system of the
packs, drive trains and optimization applicable to these areas Prius (Figure 1) does several sub tasks:
[1]. Toyota Prius is a car which has come into the HEV • It takes a differential voltage measurement across each
market within the last decade and it has a battery pack pair of blades,
based on 228 NiMH cells, organized into blades of 6 series
connected cells. The Toyota Prius system is complex and • Total current into the pack is measured,
contains a number of technically advanced systems that make
diagnostics both interesting and difficult. The apparent ground • Four temperature measurements are performed
loop though the converter assembly to the middle of the throughout the whole pack.
battery pack results in high voltages across the battery pack. Each pair of battery blades will be referred to as a battery
The battery management electronic control unit (ECU) of block in this paper.
the Toyota Prius measures various battery-related parameters
including temperature, voltage and current. When one of these The diagram in figure 1 does not show how the in-
parameters falls outside of predetermined levels a diagnostic verter/converter assembly links the battery management ECU,
trouble code (DTC) is logged. The quality of the battery pack the battery pack and the auxiliary power source (12 V battery).
determines the fuel efficiency of the vehicle. Swings in battery The inverter converts the DC battery voltage to a pseudo
voltage indicate to the BMS when to start and stop charging three-phase sinusoidal waveform using 6 duty-cycle controlled
with the internal combustion engine (ICE). Battery quality can switches (IGBTs). The three-phase voltage is used to drive
be defined as its capacity or state of health [2]. There are many the motor-generator set and is the main source of propulsion.
different methods of measuring state of health (SOH) and state Belt-driven components such as the power steering pump, air-
of charge (SOC) as outlined in [2]–[7]. The easiest method conditioning compressor and the alternator have been removed
of measuring blade capacity is Coulomb counting, a simple from the ICE to further improve the fuel efficiency. The power
integral of current over time [8]. Battery SOH is more difficult steering hydraulics are driven by an electronic pump. Similarly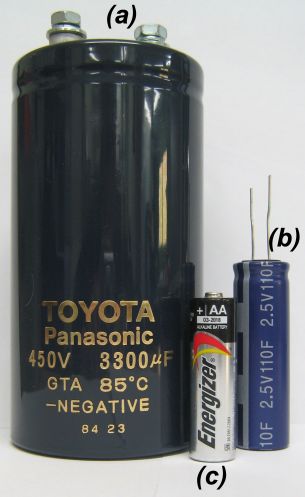
Fig. 1.    A typical Battery Management System for HEVs- 2009 Toyota Prius BMS. [11]

the air-conditioning compressor has also been changed. The                   block with less SoC will collapse before that of a cell with
alternator has been replaced by a DC-DC converter.                           higher SoC.

    III.     TOYOTA PRIUS BMS BATTERY-RELATED
                     FAULT CODES
    The Toyota Prius battery management system (BMS) mon-
itors battery temperature and battery voltage with the sensors
explained in section II. If any of the voltages or temperatures
of the battery blocks fall outside of predetermined trigger
levels for a prolonged period of time the BMS will log the
malfunction and store a diagnostic trouble code (DTC). The
vehicle will then enter a so-called “turtle” mode when a code
is set. Turtle mode is equivalent to limp-home mode in a
conventional vehicle. In this state of operation the vehicle
has reduced power output. For HEVs this means that the
current drawn from the battery, and charging current, are
limited resulting in poor fuel economy, and make the vehicle
almost undrivable. Two of the most common battery-related                    Fig. 2.   Voltage difference while charging and discharging [12].
DTCs are “Leak Detected” and “Battery Block Malfunction”.
The work detailed in this paper was focused on the causes
for the “Battery Block Malfunction” fault code, and early
                                                                                 Another method of diagnosing this DTC, suggested by
detection/monitoring system.
                                                                             Toyota, is to look at the swing between the maximum and the
                                                                             minimum block voltages, as shown in Figure 3. The maximum
A. Battery Block Malfunction Condition                                       allowable voltage swing is 2 V.
    The Battery Block Malfunction DTC (DTC number P3011
to P3029) is triggered by cells that have poor state of health.                  As mentioned above, this DTC is produced due to mis-
The battery management ECU looks at the voltage difference                   matching of battery blades within the battery pack. Replacing
between individual battery blocks under charge and discharge.                the complete battery pack assembly is one possible fix to this
A voltage difference of less than 0.3 V is acceptable (Figure                problem. However this repair cost, in the order of several
2) according to Toyota repair advice [12]. This measurement                  thousands of dollars can be prohibitive, particularly for a car
technique is essentially a method for measuring the overall                  used for several years. However, compared to this single blade
impedance of the battery block. Battery impedance is also                    faulty condition, there is a large range of battery configurations
related to the state of health of the cell [6], [7]. A cell with             and battery SOH distributions which will not generate a fault
higher AC or DC impedance, higher voltage difference, is                     code. Next sections discuss the implications of such battery
deemed to be of lesser SOH. This method also measures                        arrangements and outline a proposed monitoring system to
relative SoC between the battery blocks. The voltage of the                  identify these individual situations.
that the battery pack was only as good as its weakest blade and
that matching state of health (of each blade) and balancing the
state of charge in one battery pack is vital to the performance
and fuel efficiency of the vehicle.
VI. PROPOSED MONITORING SYSTEM
The Toyota Prius battery pack is a large series connected
bank of batteries in the order of 280-300 V at an average
capacity of 1500-2000 mAh as per the results in Figure 4. In
order to achieve an optimum driving range and performance
from the battery pack, the pack requires periodic monitoring
of each blade and individually balancing each blade. Market
research has shown that people who drive EV or HEVs adhere
Fig. 3. Voltage swing between maximum block voltage and minimum block
to a regular service schedule maintaining items such as brake
voltage while charging and discharging [12]. pads, engine fluids etc. However, nobody considers (or advised
of) performing battery maintenance. The slow degradation of
the battery pack over time means that many serious battery
IV. CURRENT ISSUE blade mismatches go unnoticed. The proposed monitoring
system connects to the existing vehicle wiring loom (without
When a large number of series connected cells are exposed any modifications to the base system) and performs a series of
to high charge and discharge rates under slightly varying charge and discharge tests to determine individual SOH/ SOC
conditions, some cells could easily degrade in a non-linear for each pair of blades. A simple model is used to describe
fashion. Figure 4 shows the non-linear fashion in which four the battery blades, resulting in Equation (1) based on testing
different battery packs have deteriorated over time. These for high frequency, low frequency and steady state responses
battery packs were analyzed in the lab to find the capacity of the battery blade. This equation however doesnt include a
distribution and steady state voltages of the individual battery temperature component which has a large effect on the battery
blades. Known broken and poor state of health cells were then performance. Figure 5 shows how the capacities of two battery
substituted into a good battery pack and road-tested in a Toyota blades vary with temperature.
Prius (Model: NHW11, Engine Type: 1FX, Year: 2001), to
investigate the failure methods of the battery packs. In order to achieve the results as per Figure 5 a Coulomb
count was performed between end-of-discharge and end-of-
V. CAPACITY DISTRIBUTION charge points, while the battery blade was at a controlled tem-
perature using a temperature controlled chamber. The battery
Figure 4 shows the measured capacities per battery blade, blade temperature was controlled by placing it in a temperature
using a coulomb counting algorithm between end of discharge controlled chamber and allowing 24 hours for cell temperature
and end of charge points. Both Packs 2 and 3 have aged in to stabilize before the test was started. The tests were repeated
a similar fashion where the blades near the ends of the packs three times for common environmental temperatures (within a
have higher capacities than the blades in the middle but are range of 15 to 25◦ C) to ensure that an accurate relationship can
otherwise uniform. The “bathtub” curve appears to be due to be formed in this temperature range. The results show that the
the temperature differences throughout the pack during normal measured battery capacity increases with temperature. Testing
operation. also showed that the variation in open circuit terminal voltage
1) Effect of one reduced capacity blade within a pack : of the battery decreased by 0.9 mV per degree temperature rise.
It was determined that Pack 3 was of good health because the It can therefore be concluded that the variation in capacity is
pack performed the same as the original Prius battery pack. not attributed to by a variation in terminal voltage but purely
Cell #38 (Cell ID 01M) from Pack 3 was replaced with cell caused by changes in the chemical acceptance of the electrolyte
#38 (Cell ID 41D) from Pack 2. The battery characteristics [13] [14].
are summarized in Table I Cell 41D was chosen to have
approximately half the capacity of rest of the pack with a R
similar steady state voltage. Iload dt
Vt (Iload ) = 1.255 × SOC 0 −
capacity(SOH) (1)
TABLE I. C ELLS REPLACED WITHIN BATTERY PACK . dIload
−RIload − L + 7.145
Cell ID Capacity Steady Voltage dt
01M 2482.2 mAh 7.81 V
41D 1164.4 mAh 7.55 V
Voc (SOC) = 1.255 × SOC + 7.145
(2)
With the Battery Pack 3 in the vehicle it was able to drive 0.3 < SOC < 0.7
2.6 km in EV mode. When one blade was replaced with a
blade of approximately half its capacity as shown in Table I Monitoring of the battery voltage during discharge is
the vehicle was only able to travel 1.3 km in EV mode. No fault required to detect faulty or short-circuited cells within a battery
code was triggered with this cell arrangement even though the blade. The energy removed from a battery blade during this
fuel efficiency of the vehicle was halved. This test confirmed discharge stage is temporarily stored in a super-capacitor bankFig. 4. Capacity Distribution throughout four packs tested.
Fig. 6. Discharge Block n into super-capacitor bank.
Fig. 5. Battery Blade capacity variation with temperature.
and transferred to next battery blade in the pack through a
series of switches and associated circuitry. Figure 6 shows the
discharge phase of the analysis process and how the various
components of the proposed system are arranged.
The charger/analyser system consists of a bi-directional
buck-boost circuit shown in Figure 7. This circuit allows for
Fig. 7. Bi-Directional Buck-Boost power supply assuming ideal components.
efficient conversion of energy from the higher voltage battery
block to the lower voltage capacitor bank and visa-versa. The
circuit shows that the super-capacitor bank (V1) must always
be of a lower voltage than the battery block (V2) otherwise current is integrated (Coulomb count) during the charge phase.
diode D2 will become forward biased and effectively short The near linear relationship between battery state of charge and
circuit the super-capacitor bank. battery voltage shown in Figure 8 and Equation (2) makes it
possible to determine battery state of health by charging the
Energy is effectively recycled throughout the analysis pro- battery by only a small percentage and analysing the voltage
cess as one battery block is discharged into another battery difference. The result of the current integral then corresponds
block isolated through the use of a super-capacitor bank. The to a fixed SoC. The current integral can then be multiplied by
battery voltage is analysed during the discharge phase and the the appropriate factor to calculate SOH or capacity of the cell.Fig. 8. (a) Linear fit to the discharge S-curve (b) plot of residuals for the
linear fit.
Equation (2) describes the linear fit shown in Figure 8.
2) Application of Battery Model: The battery model shown
in equation 2 shows a direct linear relationship between state
of charge and open circuit voltage between 30 and 70 percent
state
R of charge. Therefore ∆VOC ∝ ∆SOC and ∆SOC =
Iload dt. Combining these two values allows calculation of Fig. 9. Size comparison (a) capacitor from Prius inverter (b) PowerStor
overall capacity (SOH). Aerogel super-capacitor (c) Energizer AA battery.
A. Use of Supercapacitors
Figure 10 shows how the efficiency of the buck stage of the Bi-
Figure 9 shows a size comparison of three energy storage Direction Buck-Boost converter changes as the super-capacitor
devices and the Table II compares the energy storage capa- bank is charged. Fundamental equations can be applied to the
bilities of the three components. The AA battery stores the circuit to calculate the efficiency of the converter at different
largest amount of energy. However the AA battery also has conditions.
very high internal resistance compared to the capacitors. This
means that the charge and discharge efficiency of the battery
is very low [15]. The battery also has a low terminal voltage.
The supercapacitor and the electrolytic capacitor (Panasonic)
store very similar amounts of energy however the Panasonic
capacitor needs to be charged to 450 V whereas the super-
capacitor has a terminal voltage of only 2.5 V for the same
amount of energy. A typical battery blade’s terminal voltage
varies from 6.2 V (end of discharge) to 8.4 V end of charge.
The super-capacitor bank needs to cover twice this range of
voltages to be able to efficiently cycle energy from one battery
block (pair of blades) to another battery block.
TABLE II. E NERGY STORAGE COMPARISON
Component Value Voltage Energy
Panasonic Capacitor 3300 µF, 450 V Ec = 12 C ×
V 2 = 334 J
Super-Capacitor 110 F 2.5 V Ec = 12 C ×
V 2 = 343 J
AA battery 2500 mAh, 1.2 V Eb = As × V
9000 As = 10800 J Fig. 10. Scope trace showing converter efficiency and super-capacitor voltage
when the capacitors are in a series configuration and parallel configuration.
A 10 V capacitor bank is used in the proposed design. The
10 V bank consists of 8 super-capacitors arranged in such a Switching the capacitors in such a manner also allows the
manner that there are two parallel banks of 10 V. A novel maximum amount of energy to be extracted from the capacitor
series-parallel switch allows the capacitor bank to be switched bank as it discharges. A super-capacitor bank was chosen for
from a 10 V parallel arrangement to a 20 V series arrangement. use in the proposed monitoring system because of their lowinternal resistance and very good reversible energy storage R EFERENCES
characteristics which means that they are able to withstand [1] M. Eshani, Y. Gao, and A. Emadi, “Modern electric, hybrid electric and
many charge discharge cycles at high charge/discharge rates fuel cell vehicles,” CRC Press, p. 534, September 2010.
[16]. [2] G. L. Plett, “Recursive approximate weighted total least squares esti-
mation of battery cell total capacity,” Journal of Power Sources, vol.
VII. SUMMARY OF BATTERY PACK 196, no. 4, pp. 2319–2331, 2011.
PERFORMANCE AND ACHIEVEMENTS [3] H. Li, C. Liao, and L. Wang, “Research on state-of-charge estimation
of battery pack used on hybrid electric vehicle,” IEEE, 2009, hard copy.
Many battery pack failures are caused by a single battery [4] W. Guoliang, L. Rengui, Z. Chunbo, and C. Chan, “State of charge
blade or block failing as shown in Figure 4. Figure 4 shows that estimation for nimh battery based on electromotive force method,” IEEE
the capacities of the blades within the pack either decrease in a Vehicle Power and Propulsion Conference, no. 3-5, 2008.
linear and very consistent manner, exemplified by Pack 1 and [5] K. Bundy, M. Karlsson, G. Lindbergh, and A. Lundqvist, “An elec-
trochemical impedance spectroscopy method for prediction of the state
Pack 2, or the battery blade capacities decrease unpredictably of charge of a nickel-metal hydride battery at open circuit and during
as observed in the Pack 1 (ABY) and Pack4 (mudgeway) discharge,” Journal of Power Sources, vol. 72, no. 2, pp. 118–125, 1998.
battery packs. Pack I79637 is still of good health, indicated by [6] I. Buchmann, Batteries in a Portable World, second edition ed., C. E.
its relatively high average capacity. Pack2 (hyde2) is of poor Inc., Ed. Cadex Electronics Inc., 2001.
health, evidenced by its low capacity. The capacities in Pack1 [7] L. Zhang, “Ac impedance studies on sealed nickel metal hydride
have decreased linearly only three blades have significantly batteries over cycle life in analog and digital operations,” Electrochimica
less capacity and one battery blade has poor state of health, Acta, vol. 43, no. 21-22, pp. 3333–3342, 1998.
resulting in poor fuel economy. Field data collected has proven [8] P. Leijen and J. Scott, “Failure analysis of some toyota prius
battery packs and potential for recovery,” 2011. [Online]. Available:
the concept that a battery pack from a vehicle which presented www.pjmldesign.co.nz
a “Battery Block Malfunction” fault code has been successfully
[9] P. Leijen, “Off-line nimh battery state of charge and state of health
rebuilt by finding and replacing the faulty battery blades with measurement,” 2011. [Online]. Available: www.pjmldesign.co.nz
matched battery blades from a different pack. The vehicles [10] W. K. Hu, M. M. Geng, X. P. Gao, T. Burchardt, Z. X. Gong, D. Norus,
useful life has been increased by reconditioning the battery and N. K. Nakstad, “Effect of long-term overcharge and operated
pack. temperature on performance of rechargeable nimh cells,” Journal of
Power Sources, vol. 159, no. 2, pp. 1478–1483, 2006.
VIII. FUTURE IMPROVEMENTS [11] J. Cao and A. Emadi, “Batteries need electronics,” IEEE Industrial
Electronics, vol. 5, no. 1, 2011.
It was found during testing that the parameters of the [12] Toyota, Toyota Prius Workshop manual, 2001.
battery model vary with temperature indicating a stepped [13] E. L. Schneider, W. Kindlein Jr, S. Souza, and C. F. Malfatti, “Assess-
change between 10 and 15◦ C. These parameters need to be ment and reuse of secondary batteries cells,” Journal of Power Sources,
quantified and included in the initial battery model. vol. 189, no. 2, pp. 1264–1269, 2009.
[14] D. Linden and T. B. Reddy, Handbook of Batteries, third edition ed.
McGraw-Hill, 1995.
IX. CONCLUSION [15] Maxwell. (2012) datasheet k2 series. [Online]. Available:
The research so far has lead to developing a simplified http://www.maxwell.com/
battery model which accurately describes the behaviour of [16] P. Sharma and T. Bhatti, “A review on electrochemical double-layer
capacitors,” Energy Conversion and Management, vol. 51, pp. 2901–
the “blade” under different conditions. Suitable circuitry has 2912, 2010.
been developed to handle the power conversion between series
connected battery blocks through an existing wiring loom
using a super-capacitor bank as an isolating and energy-transfer
medium. Various sensors have been interfaced with appropriate
control circuitry and switch gear.
ACKNOWLEDGMENT
Authors would like to thank Toyota New Zealand for pro-
viding Prius battery packs for analysis, Paul Hyde from Hyde
Automotive for the battery packs provided, and Mudgeway
for their battery pack and associated parts which were used
during the experiments. We would also like to thank AECS Ltd
for providing valuable assistance with the interpretation of the
large amount of test data and the use of their test equipment.You can also read