Assessment of future scenarios for wind erosion sensitivity changes based on ALADIN and REMO regional climate model simulation data - De Gruyter
←
→
Page content transcription
If your browser does not render page correctly, please read the page content below
Open Geosci. 2016; 8:465–477

Research Article                                                                                                              Open Access

Gábor Mezősi, Viktória Blanka*, Teodóra Bata, Zsuzsanna Ladányi, Gábor Kemény, and
Burghard C. Meyer

Assessment of future scenarios for wind erosion
sensitivity changes based on ALADIN and REMO
regional climate model simulation data
DOI 10.1515/geo-2016-0033
Received June 3, 2015; accepted February 9, 2016
                                                                              1 Introduction
Abstract: The changes in rate and pattern of wind ero-                        Wind erosion in Europe affects large areas; about 42 mil-
sion sensitivity due to climate change were investigated                      lion ha of European agricultural lands may be affected by
for 2021–2050 and 2071–2100 compared to the reference pe-                     wind erosion [1]. Large areas are influenced in the semi-
riod (1961–1990) in Hungary. The sensitivities of the main                    arid areas of the Mediterranean region [2, 3], in the temper-
influencing factors (soil texture, vegetation cover and cli-                  ate climate areas of the northern European countries [4, 5]
mate factor) were evaluated by fuzzy method and a com-                        or in the Carpathian Basin [6, 7]. Over the past decades, the
bined wind erosion sensitivity map was compiled. The cli-                     significance of the wind erosion problem is increased be-
mate factor, as the driving factor of the changes, was as-                    cause of the changing agricultural practices (e.g. increase
sessed based on observed data for the reference period,                       in the size of fields, the intensive use of machinery or re-
while REMO and ALADIN regional climate model simula-                          moval of hedgerows) [8] and further increase can be ex-
tion data for the future periods. The changes in wind ero-                    pected due to the projected climate change [9–11]. There-
sion sensitivity were evaluated on potentially affected agri-                 fore, it is important to delineate more precisely the loca-
cultural land use types, and hot spot areas were allocated.                   tion and the rate of this hazard at present and also in the
Based on the results, 5–6% of the total agricultural areas                    next decades. Research increasingly focus on wind erosion
were high sensitive areas in the reference period. In the                     at plot scale and also on regional scales [12].
21st century slight or moderate changes of wind erosion                            Wind erosion and the rate of its damage are deter-
sensitivity can be expected, and mostly ‘pastures’, ‘com-                     mined by several factors (e.g. soil parameters, lithology,
plex cultivation patterns’, and ‘land principally occupied                    climate, vegetation, anthropogenic effects) [13, 14]. Bag-
by agriculture with significant areas of natural vegetation’                  nold [15] determined a relation for the calculation of wind
are affected. The applied combination of multi-indicator                      erosion using these factors. Later it was improved by a
approach and fuzzy analysis provides novelty in the field                     wind erosion equation (WEQ – Wind Erosion Equation
of land sensitivity assessment. The method is suitable for                    and RWEQ – Revised Wind Erosion Equation), and other
regional scale analysis of wind erosion sensitivity changes                   models were also developed (e.g. WEPS – Wind Erosion
and supports regional planning by allocating priority ar-                     Prediction System, AUSLEM – AUStralian Land Erodibil-
eas where changes in agro-technics or land use have to be                     ity Model) [16–22]. These models were designed in plot
considered.                                                                   scale using field measurements and empirical knowledge;
                                                                              however, they work with several limiting factors (e.g. wind
Keywords: wind erosion sensitivity projection; regional
                                                                              fetch length, roughness of soil surface) [23]. These ap-
climate model simulations; fuzzy analysis; hot spot analy-
                                                                              proaches are typically process-based models, however, the
sis
                                                                              applied mathematical and physical relationships cannot
                                                                              be simply scaled up to regional applications [22]. Regional

*Corresponding Author: Viktória Blanka: Department of Physical
Geography and Geoinformatics, University of Szeged; Hungary, 6722
Szeged, Egyetem utca 2-6; Email: blankav@geo.u-szeged.hu                      Gábor Kemény: Research Institute of Agricultural Economics, Bu-
Gábor Mezősi, Teodóra Bata, Zsuzsanna Ladányi: Department                     dapest, Hungary
of Physical Geography and Geoinformatics, University of Szeged,               Burghard C. Meyer: Geographical Institute, University of Leipzig,
Szeged, Hungary                                                               Leipzig, Germany

                      © 2016 G. Mezősi et al., published by De Gruyter Open.
This work is licensed under the Creative Commons Attribution-NonCommercial-NoDerivs 3.0 License.
466 | G. Mezősi et al.

scale methods are problematic, because of the spatial va-           2. how the extent of the areas with different sensitivity
lidity, however there are several attempts to develop more             was projected to change until the end of the 21st cen-
accurate regional scale estimations [24–27].                           tury (2021–2050, 2071–2100 compared to 1961–1990)
     Wind erosion and the accompanying sediment ac-                    when integrating and comparing the two regional
cumulation cause huge agro-economic damages in the                     climate change simulations of REMO [37] and AL-
Carpathian Basin. Agricultural loss due to wind erosion                ADIN [38];
results from direct impacts (physical damage on crops,              3. what regional tendencies can be found in the ex-
mostly vegetables and sugar beet in April) that potentially            tent of the most sensitive areas (increase, no change,
affects smaller areas (15–20.000 hectares) in a value of               decrease of sensitivity) in the case of different land
1500–3000 EUR/ha. However the estimation of loss is dif-               cover types?
ficult due to the lack of information about damages, since
insurance exists only for sand-blast damage up to 0.5–2%
of the crop value, mostly bought by vegetable farmers on
sand land regions [28]. Indirect impacts are more signifi-
                                                                 2 Materials and methods
cant (e.g. degrading soil structure and fertility, decrease of
the production area, and increased costs of labour, chem-        2.1 Study area
icals, seeds and maintenance), but they can not be easily
quantified [29]. Natural hazards altogether (hail, wildfire,     The investigated area, Hungary is located in SE Europe in
spring frost, drought, excess water, heavy precipitation,        the Carpathian Basin, approx. 68% of which is covered
wind erosion) caused around 300 million EUR financial            by agricultural areas (Fig. 1). The area is determined by a
loss in the last decade [28, 30]. Based on the potential wind    yearly mean precipitation of 500–750 mm and an average
erosion hazard map 26.5 percent of the territory of Hun-         temperature of 10–11∘ C. The countrywide yearly average
gary is highly and moderately endangered by wind erosion         wind speed is 2–4 ms−1 , the monthly averages are highest
risk [31]. The experienced decrease of precipitation during      in the spring period (March and April) [39]. The number of
the spring months, with a rate of a nearly 20% between           days on which the maximum wind speed is over 10 ms−1
1901 and 2010 has contributed to the increase of wind ero-       is also the highest in April [40]. The main wind direction
sion hazard [32].                                                above 5 ms−1 , which is important in inducing erosion, is
     Regional scale wind erosion hazard maps are avail-          north-west [41]. The surface of the investigated areas is
able for Hungary, most of them take into consideration           mostly covered by sediments of fluvial, lacustrine, aeolian
only physical soil properties and critical wind speed for the    origin, resulting in a various soil cover. Loamy sediments
calculation [6, 33, 34]. An integrated regional-scale wind       cover most of the areas, however, sand covered territories
erosion sensitivity map was also calculated using GIS and        are also in a huge extent (Fig. 1).
fuzzy analyses based on soil parameters, land cover, cli-
matic conditions and land use to estimate the regional
differences in wind erosion sensitivity and exposure in          2.2 Data
Hungary [35]. Regional scale is suitable for environmen-
tal, landscape or spatial planning applications of agricul-      For analysing wind erosion sensitivity in regional scale,
tural and environmental programs and strategies [36]. In         where local parameters cannot be assessed, the most rel-
the viewpoint of planning, it is crucial to deal with the        evant environmental parameters are soil texture proper-
management of hazards and to allocate those places where         ties, vegetation cover and climate parameters [14, 15], thus
increasing wind erosion risk can be expected.                    these factors were calculated in this assessment.
     In the article temporal and spatial alterations in wind          The soil and vegetation factors were evaluated by us-
erosion senisitivity due to the impact of climate change         ing the calculation method of the regional scale wind ero-
were investigated based on climate model simulation data         sion sensitivity map of Mezősi et al. [35]. In the calcula-
compared to the reference period (1961–1990). The key            tion to analyse soil sensitivity [35], the soil erodibility in-
questions were:                                                  dex [19] was assessed by using the soil texture categories
                                                                 of the Hungarian Agrotopographical map [42] and to anal-
   1. how the rate, spatial pattern and distribution of          yse the effect of vegetation cover NDVI values were cal-
      wind erosion sensitivity were projected to change in       culated [43] for the most important spring period (March-
      the study area, the agricultural areas of Hungary;         April) on the basis of MODIS remote sensing data, because
                                                                 the vegetation on the cultivated fields have little cover to
Assessment of future scenarios for wind erosion sensitivity changes | 467
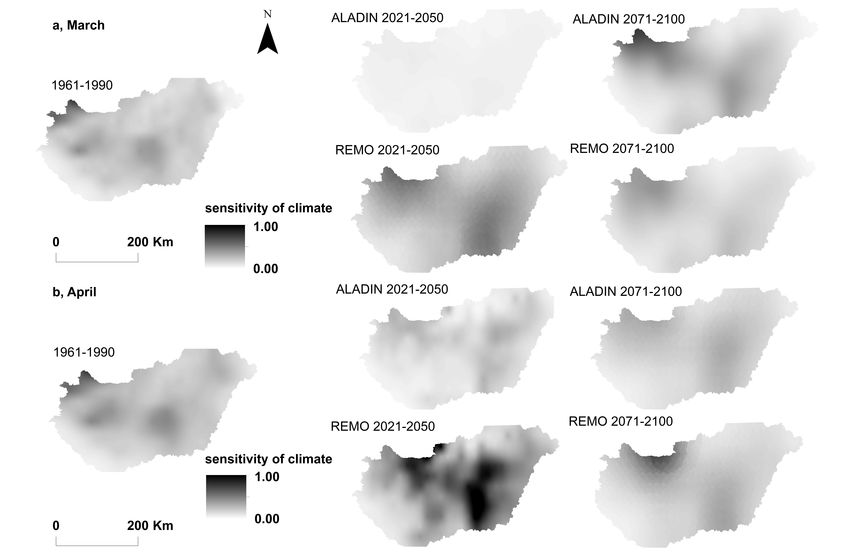
Figure 1: Main land cover types [45] and soil texture classes of the study area [42]; land cover: 1: artificial surfaces; 2: agricultural areas;
3:Forests and semi-natural areas; 4: wetlands; 5: water bodies); soil texture: 1: sand; 2: loamy sand; 3: loam; 4: loamy clay; 5: clay.
protect the soils in this spring (March-April) period. To 2.3 Methods
calculate the climate parameters for the reference period
(1961–1990) observed monthly precipitation, monthly av- 2.3.1 Calculation of climate-factor
erage temperature, and monthly average wind speed in
March and April (source: Hungarian Meteorological Ser- The climate parameters were assessed by calculating the
vice) were used. The soil moisture and vegetation cover climatic factor of Wind Erosion Equation WEQ [46–49] for
are usually low and monthly average wind speeds are the the most relevant spring period of the year (March-April).
highest during these spring months (March–April); there- The calculated index of climatic factor uses monthly tem-
fore, wind erosion can be especially active at this time of perature (T), monthly precipitation (p) and monthly aver-
the year. age wind speed data.
The projected future changes of the climate param- Calculation of climate (C) factor (1) [46–48]:
eters were analysed using two regional climate models,
386 · u3
REMO and ALADIN with a spatial resolution of 0.22∘ (ap- C= (1)
PE2
proximately 25 km). These models utilise the A1B scenario
to model anthropogenic climate forcing, which represents where u: average monthly wind speed (m/s), PE: Thorn-
an average development of greenhouse gas emissions [44]. waite precipitation-effectiveness index (2)
The climate projections were generated by the Numerical ]︂ 109
∑︁ [︂ Pi
Modelling and Climate Dynamics Division of the Hungar- PE = 3.16 · (2)
ian Meteorological Service. These model simulations pro- 1.8 · *Ti + 22
vided daily data about the changes of temperature and pre- where Pi: monthly precipitation (mm), Ti: monthly average
cipitation and monthly wind speed data for the periods temperature (∘ C)
2021–2050 and 2071–2100 with respect to the reference pe- With this calculation method, average values were
riod of 1961–1990. From all of these data, monthly average calculated for the reference period (1961–1990) based on
values were calculated and evaluated for the two future pe- observed meteorological data and to assess the future
riods. changes of wind erosion hazard the changes of the climate
To allocate the area, potentially affected by wind ero- factor were applied for the two future period (2021–2050
sion on land use basis, CORINE Landcover 2006 map and 2071–2100) on the basis of the ALADIN and REMO re-
(CLC) [45] was used (Table 1). gional climate model simulation data. The behaviour of
the applied models is complex, having uncertainties, how-
ever, based on the validation studies, these models can be
efficiently used for climate research purposes [50–53].468 | G. Mezősi et al.
Table 1: The used datasets during the analyses and their sources.
Indicator Used data Spatial Source
resolution
sensitivity of soil soil erodibility index from the 250 × 250 m [27]
Hungarian Agrotopographical Map
sensitivity of vegetation vegetation cover from NDVI 250 × 250 m [27]
sensitivity of climate C factor 250 × 250 m ALADIN and REMO RCMs data for
(wind, precipitation and 2021–2050 and 2071–2100
temperature data were (Meteorological information
used) services, Hungary), observed data
for 1961–1990 (Meteorological
information services, Hungary)
land cover (~land use) Agricultural classes: ~100 × 100 m [34]
211 Non-irrigated arable land
221 Vineyards
222 Fruit trees and berry
plantations
231 Pastures
242 Complex cultivation patterns
243 Land principally occupied by
agriculture, with significant areas
of natural vegetation
2.3.2 Calculation of sensitivity maps
To calculate the sensitivity of wind erosion, it is neces-
sary to identify the basic relationships between the rate of
wind erosion and the relevant affecting factors (soil tex-
ture properties, vegetation cover and climate factor).
Sensitivity was calculated separately for the influenc-
ing factors by using fuzzy analysis [54–56] and using these
sensitivity values, a combined sensitivity map was com-
piled (Fig. 2). The fuzzy relations can be easily incorpo-
rated into geographic information systems (GIS) and the
sensitivity values can be calculated on pixel basis, there-
fore it is effective for comparing the results with other Figure 2: Flowchart of the applied methodolical framework.
sites [57].
For the calculation of the sensitivity of the affecting ponential reduction of the sensitivity of wind erosion [60].
factors IDRISI software was used. In this software the rela- Consequently, the applied fuzzy membership function was
tion between two parameters is described by fuzzy mem- exponential and monotonically decreasing [35]. The rela-
bership functions. The fuzzy membership function can be tionship between the C factor and the rate of wind ero-
linear, exponential, logarithmic or polynomial [? ]. sion is linear, thus the applied fuzzy membership function
In case of soil texture properties, the increasing exper- was linear and monotonically increasing [49, 59, 61]. This
imental t ha−1 yr−1 erosion value of the soil means that means that the increase in the C factor resulted in the in-
the sensitivity is also increasing [58, 59]. The applied fuzzy crease of the wind erosion sensitivity in the area (Fig. 2).
membership function describing the relationship between The overall sensitivity was calculated by averaging the
the soil texture properties and the rate of wind erosion separate factor sensitivity maps to a combined sensitivity
was exponential and monotonically increasing. In terms map to avoid the problem of weighting. Thus, in the fi-
of vegetation, the increasing vegetation density causes ex- nal sensitivity assessment, each factor was given an equalAssessment of future scenarios for wind erosion sensitivity changes | 469
Table 2: CORINE Land Cover (CLC) nomenclature for agricultural areas.
Level 1 Level 2 Level 3 Area
(km2 )
2. Agricultural areas 21 Arable land 211 Non-irrigated arable land 48957
22 Permanent crops 221 Vineyards 1464
222 Fruit trees and berry plantations 804
23 Pastures 231 Pastures 6425
24 Heterogeneous 242 Complex cultivation patterns 2446
agricultural areas
243 Land principally occupied by agriculture, with signifi- 1456
cant areas of natural vegetation
weight. Using the method of Mezősi et al. [35], wind ero- were higher than 0.35. These high sensitivity areas are the
sion sensitivity was calculated by fuzzy analyses, where 0 most exposed to the investigated natural hazard both at
means not sensitive at all, 1 means the maximum sensi- present and in the future.
tivity. For example 0.25 means that the sensitivity is 25%,
thus the area is rather not sensitive than sensitive.
Based on the detailed sensitivity map, to assess the 2.3.3 Linking of wind erosion sensitivity to agricultural
summarized sensitivity in a more comprehensible way, it is land uses
inevitable to categorize the sensitivity as high sensitivity,
medium sensitivity and low sensitivity. However there are In the spring period the used NDVI vegetation index is usu-
no well-defined threshold values between the categories ally low for every land cover class; therefore, it is diffi-
and it is hard to define which exact sensitivity value should cult to distinguish the different land use types (e.g. agri-
be used in the assessment. In this study, the following cultural areas, forests or built-up areas), however, wind
thresholds for wind erosion sensitivity classes were used: erosion does not typically occur in forests or urbanised
high sensitivity over 0.35, medium sensitivity 0.2–0.35 and areas. Therefore, land cover type was also employed in
low sensitivity below 0.2. These threshold values were in- the analysis to locate the potentially affected areas. By the
trinsically arbitrary; however the thresholds were adjusted help of the CORINE Landcover 2006 map, agricultural ar-
to the experimental wind erosion rates,field survey results eas were selected (CLC 211, CLC 221, CLC 222, CLC 231, CLC
and recorded economic losses [35]. 242, CLC 243 – Table 2), because on these areas the veg-
To carry out the temporal analysis, the sensitivity map etation cover opens and closes on annual and seasonal
for the reference period (1961–1990) was compared to the schedules according to the agricultural crop rotation and
estimated future wind erosion sensitivity maps. In the these areas are exposed to wind erosion in the early spring
analysis of future changes in wind erosion sensitivity, the period. Therefore, the combined sensitivity to wind ero-
soil factor and the vegetation factor were fixed, because sion was calculated for the agricultural areas of CORINE
the soil is considered as invariable in this time period, land cover classes. For each land cover class the Number of
while the natural changes of the vegetation is very slow, patches (pcs), Area (km2 ), Number of high sensitive (0.35–
however land use can be modified by anthropogenic activ- 1.00) patches (pcs), Area of high sensitive patches (km2 )
ities, therefore the long-term projection of vegetation al- and Ratio of high sensitive areas (%) in March and April
teration is difficult. Thus, in the modelling of the two fu- were assessed. To analyse future tendencies in wind ero-
ture periods the driving factor of the changes is the climate sion sensitivity on different land cover types, the changes
factor. Consequently to assess the future changes, the ob- of the area of the high sensitivity category (wind erosion
served meteorological data for climate factor was replaced sensitivity higher than 0.35) were analysed for the two fu-
by the simulation data of the ALADIN and REMO climate ture periods.
models, while soil and vegetation factors were the same as
it was in the reference period.
Based on the results of fuzzy analysis, hot spot areas
were allocated for March and April separately where all of
the soil, vegetation, present and future climate sensitivity470 | G. Mezősi et al.
tifiable in climate models, however, it is possible to derive
3 Results and discussion development trends from the future simulations [63].
In this study data of two regional climate model were
3.1 Climate sensitivity based on regional applied and compared and the results differ slightly from
(climate model) simulation other multi-model approaches [64]. 30-year-averages were
calculated according to the climatological practices that
Based on the calculation of climate sensitivity for the pe- can provide efficient practical information for decision
riod of 1961–1990, the highest values can be observed in makers [23].
the north western and in the centre part of the study area in
March (Fig. 3). In April, slightly higher values were found
in the whole study area compared to March with similar 3.2 Wind erosion sensitivity assessment
spatial pattern. For the period of 2021–2050 based on the
ALADIN model simulation the value of climate factor was The integrated sensitivity analysis on agricultural lands in
expected to decrease on most of the areas in both March March and April (Fig. 4) allocated areas, where high wind
and April, indicating the reduction of climate sensitivity, erosion sensitivity was characteristic for the 1961–1990 pe-
but the decrease was slighter in April. The changes of the riod. It corresponded to the spatial pattern of soil texture
climate factor showed contradictory results on the basis of classes (see Fig. 1). The highest sensitivity (fuzzy value >
REMO model simulation, since they estimated an increase 0.35) values occurred in the sandland regions of the study
in the north-western and the south-eastern parts. The in- area covered by fluvio-aeolian loss and sand. Between sen-
crease had a higher rate in April. This significant difference sitivity maps for March and April, there was no significant
between the results were mainly caused by the different difference in the extent of high sensitivity areas, only a
precipitation projection of the models in March and April. slight difference in the extent of medium sensitivity areas
In longer time scale (2071–2100), the increase of the occurred.
climate factor can be expected compared to the 1961–1990 For the future period of 2021–2050 REMO and ALADIN
period on most of the area. Higher increase was projected simulations indicated different tendencies. Based on AL-
in the north-western and south-eastern parts of the study ADIN simulation, decrease in the extent of medium sensi-
area in both March and April. Compared to the period of tivity areas could be expected in March, especially in the
2021–2050, the values of the climate factor for 2071–2100 western part of the study area and the extent of high sensi-
were projected to decrease on the basis of REMO model tivity areas were also projected to decrease. Similar trends
simulation in both March and April, while ALADIN indi- were projected in April, but to a smaller rate. REMO simula-
cated increase in the climate factor in both months. The tion based sensitivity calculation did not show significant
pattern of the climate sensitivity seemed to be unchanged changes on the western part, but on the south-eastern part
in both shorter and longer time scale. of the country higher changes were indicated and the ten-
The applied climate simulations have uncertainties dency was increasing. REMO simulation based sensitivity
arisen from the modelling method and the natural climate calculation projected high increase of wind erosion sensi-
variability. Moreover, modelling the social and economic tivity in both months and the territorial expansion of high
changes in the future (meaning the anthropogenic climate sensitivity areas was projected. In April, almost the whole
forcing factor in the models) is the most difficult and there- study area, except for the northern territories, were char-
fore, the most uncertain part of the models [10, 62]. To eval- acterised by medium or high sensitivity in the 2021–2050
uate the uncertainty and validate the model results several period based on REMO data. The northern territories were
studies were carried out, which confirmed the applicabil- less affected at present and in the future as well.
ity of the models for climate research purposes [50–53]. For the period of 2071–2100, increasing wind erosion
Based on the model validations for the Carpathian Basin hazard in March was indicated using ALADIN simulation
spring temperature is quite reliable based on REMO, al- data, on the south-eastern part of the study area compared
though it is underestimated by ALADIN. In the case of pre- to the previous investigated period. Based on REMO simu-
cipitation both model validations result in overestimation lation, a decreasing extent of the medium sensitivity ar-
in the study area [51, 52]. Since both temperature and pre- eas in both March and April was projected, mostly in the
cipitation bias can lessen wind erosion potential, the esti- western part of the study area, however, it was not so sig-
mations of future wind erosion sensitivity possibly under- nificant and showed a more fragmented pattern compared
estimate the potential increase and overestimate the po- to the previous period. Despite the decreasing trend be-
tential decrease. Wind parameter values are hardly quan- tween the periods of 2021–2050 and 2071–2100 the areaAssessment of future scenarios for wind erosion sensitivity changes | 471
Figure 3: The climate sensitivity (C-factor) in March and April in the period of 1961–1990, 2021–2050 and 2071–2100 based on ALADIN and
REMO climate model simulation data.
of high and medium sensitivity areas was projected to be The hotspot analysis allocated the areas, which were
even higher than it was in the reference period (1961–1990) the most exposed to the investigated natural hazard at
in the centre part of the country. present and also in the future (Fig. 6). In March an area
Based on the results, moderate change of wind erosion of 445 km2 was allocated as hot spot of high wind ero-
sensitivity was expected in the 21st century due to the im- sion sensitivity, especially in the centre part of the Danube-
pact of climate change. The applied climate model simu- Tisza Interfluve. In April not only the aforementioned area,
lations, the ALADIN and REMO showed differences in rate but also some parts of Nyírség were indicated as hot spots
and pattern of wind erosion hazard for the modelled fu- in a total extent of 975 km2 . Based on the two climate
ture periods. Especially for the first period the rate and also model simulation data, very similar results in the pattern
the direction of the changes were different, thus definite and extent of the hotspot areas were arisen.
tendencies could hardly be drawn. For the period of 2021– Estimating wind erosion hazard is a major challenge
2050 on the basis of REMO simulation the extent of ‘high due to the limited calculation methods for larger areas [36].
sensitivity areas’ and also the ‘medium sensitivity areas’ The active and passive prevention and adaptation prac-
increased, while ALADIN simulation data indicated de- tices can influence the factors playing role in wind erosion.
crease in both sensitivity categories (Fig. 5). For the period In the viewpoint of climate, one of the key factors is the
of 2071–2100, only minor changes of the extent of the ‘high wind speed that can be modified by shelterbelts or by the
sensitivity’ and also ‘medium sensitivity’ areas were pro- increase of surface roughness (e.g. by agro-techniques or
jected on the basis of both model simulations compared to vegetation cover) [65–67]. In the viewpoint of soil the in-
the reference period in March and also in April, however crease of the soil aggregates or soil covering by manure
the rate of increase was different in the two months and or straw can be a good solution. However, these modifi-
according to the two models. This difference between the cations are local interventions relevant for plot scale and
results were mainly caused by the different precipitation they slightly have impact on regional wind erosion pat-
projection of the models in the spring period (March and tern.
April).472 | G. Mezősi et al.
Figure 4: Wind erosion sensitivity of the agricultural lands in March and April for the period of 1961–1990, 2021–2050 and 2071–2100
based on soil, vegetation and climate sensitivities.
est sensitivities were shown by the vineyards (CLC 221), the
fruit tree and berry plantations (CLC 222) and the complex
cultivation patterns (CLC 242), where more than 25% of
their areas considered as high sensitive. 5–10% of the non-
irrigated arable lands, pastures and land principally occu-
pied by agriculture with significant areas of natural vege-
tation were defined as high sensitive. Although the ratio of
the high sensitive areas of non-irrigated arable land was
Figure 5: Area (% compared to the total extent of the agricultural only 2–4%, the extent of the high sensitivity area in this
areas) of wind erosion sensitivity classes in the periods of 1960– land cover type was higher than in all the other classes’.
1990 and 2021–2050, 2071–2100 based on REMO (R) and ALADIN The future wind erosion sensitivity was assessed on
(A) regional climate model simulation data the basis of climate model simulations assuming invari-
able land use pattern. The two climate models in the 2021–
3.3 Wind erosion sensitivity in March and 2050 period showed different rate and direction in the
April by land use changes of the extent of high sensitivity patches in case of
all CORINE land cover types (Table 4). The ALADIN based
Wind erosion sensitivity was analysed according to differ- calculation showed decrease in all categories for the 2021–
ent agricultural land cover classes of CORINE for the ref- 2050 period, and the highest decrease could be observed
erence period (1961–1990) to reveal the differences in sen- in case of CLC 211 and CLC 231. Smaller decrease (by 9–
sitivity between the land use classes. The calculated sen- 30%) of the high sensitivity areas was projected for April.
sitivity values for April were slightly higher in case of all However, REMO based calculation projected increase of
land cover types (Table 3) compared to March. The high- the high sensitivity areas in all land cover classes, and theAssessment of future scenarios for wind erosion sensitivity changes | 473
Figure 6: Hot spot areas of wind erosion sensitivity for March and April based on the REMO and ALADIN climate simulation data.
highest increase was expected in case of CLC 243. Based of natural vegetation’ (CLC 243) based on the model results.
on REMO simulation higher differences between the two These land use types are more favourable from the view-
months (March and April) were identified. point of wind erosion than intensively cultivated land use
The longer-term projections for the 2071–2100 period types (e.g. arable land). Future land management planning
did not show significant differences compared to the refer- should aim to avoid the increase of cultivation intensity in
ence period (1961–1990) in March, the changes were mostly these areas. No noticeable changes in wind erosion sensi-
below 15% (from −2% to +39%). Calculations based on tivity can be detected on “vineyards” (CLC 221) and “fruit
ALADIN showed increase in the area of high sensitivity trees and berry plantations” (CLC 222), but more than
patches in all land cover classes in March; REMO based 30% of these areas have already high sensitivity. In case
calculations projected minor decrease in case of CLC 221 of arable lands (CLC211) the projected tendency is indef-
and CLC 222. For April, only two land cover types (CLC 242, inite. For the first period, model simulation data showed
CLC 243) showed increase (3–25%) in the extent of the high wind erosion sensitivity decrease in the early spring pe-
sensitivity areas based on ALADIN, while the rate and di- riod (March), but increase in April, while for 2071–2100 the
rection of changes were different on the basis of REMO sim- data showed contrary tendencies. Since arable lands cover
ulation, the extent of the high sensitivity areas showed in- the largest area, the areas possibly affected by increasing
crease except of CLC 211 and CLC 222. tendency are the largest in spite of the less clear tendency.
The results show that for the period of 2071–2100 both On areas where increasing tendency can be expected on
models project only minor changes in the extent of the arable lands, the highest attention from future planning
high sensitivity and also the extent of medium sensitivity and adaption is, required. Land cover change can also be
areas compared to the reference period in March and also a good possibility, however, only in case of less-favourable
in April. However, remarkable differences can be detected soils (e.g. from CLC 211 to CLC 231, CLC 242 or CLC 243).
between the different agricultural land use types, con- The current analysis assumed invariable future land use
firmed also by the findings of Tibke [68], Gomes et al. [12], pattern. Anthropogenic activities should modify land use
Leenders et al. [69], or Horel et al. [70], who identified considering regional sensitivity to mitigate possible wind
that the different agricultural land use and techniques can erosion hazard.
have a significant effect on wind erosion hazard. To detect
tendencies, considered as important in case of the differ-
ent land use types, averaged data of the two models was
considered, where more than 5% area change was consid-
4 Conclusion
ered as important change (Table 5). Increasing tendency
Significant territories in the Carpathian Basin face high
in the sensitivity was identified in case of ‘Pastures’ (CLC
wind erosion sensitivity at present, and a slight increase
231), ‘Complex cultivation patterns’ (CLC242) and ‘Land
of wind erosion hazard can be expected for the end of
principally occupied by agriculture, with significant areas474 | G. Mezősi et al.
Table 3: Wind erosion sensitivity according to CORINE land cover classes in the reference period 1961–1990.
CLC class Number of Area (km2 ) Number of Area of Ratio of high
patches (pcs) high high sensitivity
sensitivity sensitivity areas (%)
patches (pcs) patches
(km2 )
March
211 Non-irrigated arable land 3821 48957.05 494 1397.15 2.85
221 Vineyards 1041 1464.45 233 441.32 30.14
222 Fruit trees and berry plantations 960 804.53 300 274.98 34.18
231 Pastures 6202 6425.40 592 485.82 7.56
242 Complex cultivation patterns 3337 2446.27 534 627.05 25.63
243 Land principally occupied by agri- 2920 1456.57 169 87.00 5.97
culture, with significant areas of natu-
ral vegetation
April
211 Non-irrigated arable land 3821 48957.05 568 1709.41 3.49
221 Vineyards 1041 1464.45 256 461.60 31.52
222 Fruit trees and berry plantations 960 804.53 341 311.35 38.70
231 Pastures 6202 6425.40 700 575.75 8.96
242 Complex cultivation patterns 3337 2446.27 604 696.74 28.48
243 Land principally occupied by agri- 2920 1456.57 201 103.61 7.11
culture, with significant areas of natu-
ral vegetation
Table 4: The area and the percential changes of the high sensitivity areas according to CLC in March and April based on the the REMO and
ALADIN climate model simulation data for the 2021–2050 and 2071–2100 periods.
CLC class 211 221 222 231 242 243
March
Area of high 1961–1990 1397.15 441.32 274.98 485.82 627.05 87.00
sensitivity patches
(km2 )
Changes in the ALADIN 2021–2050 −60.65 −25.07 −19.57 −56.29 −37.49 −48.21
extent of high REMO 47.68 13.02 19.07 74.04 32.18 83.91
sensitivity areas (%) ALADIN 2071–2100 14.75 6.53 1.06 32.96 15.38 39.19
REMO 2.89 −1.93 −1.72 1.97 4.02 9.08
April
Area of high 1961–1990 1709.41 461.60 311.35 575.75 696.74 103.61
sensitivity patches
(km2 )
Changes in the ALADIN 2021–2050 −30.29 −15.73 −10.35 −28.56 −9.00 −19.94
extent of high REMO 104.07 17.53 22.90 124.67 35.70 141.63
sensitivity areas (%) ALADIN 2071–2100 −15.66 −6.50 −4.15 −5.33 3.41 7.98
REMO −1.14 2.07 −2.08 11.87 7.66 25.14Assessment of future scenarios for wind erosion sensitivity changes | 475
Table 5: Trends in the change of the extent of the high sensitivity areas to wind erosion according to CORINE patches based on averaged
REMO and ALADIN climate model simulation data for the 2021–2050 and 2071–2100 periods (↑ - increase; ↓ - decrease; ~- no important
change).
Projection for 2021–2050 Projection for 2071–2100
March April March April
211 ↓ ↑ ↑ ↓
221 ↓ ~ ~ ~
222 ~ ↑ ~ ~
231 ↑ ↑ ↑ ~
242 ~ ↑ ↑ ↑
243 ↑ ↑ ↑ ↑
the century based on ALADIN and REMO regional climate where changes in agrotechnics or land use have to be con-
simulation data. Two main hot-spot areas were allocated sidered to make prevention and adaptation possible.
where prevention or adaptation measures are of high im-
portance. The most apparent finding was that the pattern Acknowledgement: This research was funded by TÁMOP-
of climate sensitivity in regional scale seemed to be un- 4.1.1.C-12/1/KONV-2012-0012 “Green Economy Coopera-
changed in both shorter and longer time scale. The spatial tion” (ZENFE) project supported by the European Union
analysis indicated that on the western part of the coun- and co-financed by the European Social Fund.
try the wind erosion sensitivity was expected to be more
variable and the trends were more unclear than on the
eastern part during the 21st century. Wind erosion hazard
can be more significant than it was projected in this study,
References
since environmental hazards can have a synergistic effect [1] European Environment Agency, Europe’s Environment: the Sec-
on each other. Owing to a drought period in summer, veg- ond Assessment. Elsevier, United Kingdom, 1998
etation can perish to such an extent that soil surfaces can [2] Lopez M.V., Sabre M., Gracia R., Arrue J.L., Gomes L., Tillage ef-
become uncovered and exposed to wind erosion; further- fects on soil surface conditions and dust emission by wind ero-
more, the decreasing groundwater table can also enhance sion in semiarid Aragon (NE Spain). Soil Tillage Res. 1998, 45,
91–105
wind erosion sensitivity.
[3] Moreno Brotons J., Romero Díaz A., Alonso Sarría F., Belmonte
Despite of the discrepancies and uncertainties of cli- Serrato F., Wind erosion on mining waste in southeast Spain.
mate simulations, some general aspects of the changes Land Degrad. Dev., 2009, 21, 196–209
can be identified e.g. hot spot areas, which still could pro- [4] Eppink L.A.A.J., Spaan W.P., Agricultural wind erosion control
vide valuable information for spatial planning and land measures in the Netherlands. Soil Technol. Ser., 1989, 1, 1–13
[5] Bärring L., Jönsson P., Mattsson J.O., Ĺhman R., Wind erosion
management purposes. The applied combination of multi-
on arable land in Scania, Sweden and the relation to the wind
indicator approach and fuzzy analysis provides novelty in climate: a review. Catena, 2003, 52, 173–190
the field of land sensitivity assessment and the method is [6] Borsy Z., Research in areas of blown sand. In: Pécsi M., Lóczy D.
suitable for regional scale analysis of wind erosion sensi- (Ed.), Physical geography and geomorphology in Hungary, Geo-
tivity changes. The advantage of the applied fuzzy method graphical Research Institute of Hungarian Academy of Sciences,
in a land sensitivity assessment is the ability of soft com- Budapest, 1986, 77–82
[7] Lóki J., Research of the land forming activity of wind and pro-
puting, namely this tool permits modelling a system with-
tection against wind erosion in Hungary. Riscuri şi Catastrofe,
out detailed mathematical descriptions using qualitative 2011, 10, 1–13
as well as quantitative data [71]. Thus, this method is suit- [8] Riksen M., Brouwer F., De Graaf J., Soil conservation policy mea-
able for the ensemble assessment of the factors important sures to control wind erosion in north-western Europe. Catena,
in wind erosion, although the available datasets with dif- 2003, 52, 309–326
[9] Jacob D., Petersen J., Eggert B., Alias A., Bossing Christensen O,
ferent spatial resolution and quality do not allow the ap-
Bouwer L.M. et al., EURO-CORDEX: new high-resolution climate
plication of the detailed equations developed in plot scale. change projections for European impact research. Regional En-
Regional scale data are necessary for regional planning to vironmental Change, 2013, 14, 563–578
develop more focused strategies to allocate priority areas [10] Bartholy J., Pongrácz R., Gelybó G., Szabó P. , Analysis of ex-
pected climate change in the Carpathian Basin using the PRU-476 | G. Mezősi et al.
DENCE results. Időjárás Quarterly Journal of the Hungarian Me- 8–15
teorological Service, 2008, 112, 249–264 [29] Riksen M., De Graaff J., On-site and off-site effects of Wind Ero-
[11] IPCC, 2014: Climate Change (2014) Synthesis Report. Contribu- sion on European Light Soils. Land Degrad. Dev., 2001, 12, 1–11
tion of Working Groups I, II and III to the Fifth Assessment Report [30] Gaál M., Quiroga S., Fernandez-Hadddad Z., Potential impacts
of the Intergovernmental Panel on Climate Change [Core Writ- of climate change on agricultural landuse suitability of the
ing Team, R.K. Pachauri and L.A. Meyer (eds.)] . IPCC, Geneva, Hungarian counties. Regional Environmental Change, 2014, 14,
Switzerland, 151 pp. 597–610
[12] Gomes L., Arrue J.L., Lopez M.V., Sterk G., Richard D., Gracia R., [31] Lóczy D., Kertész Á., Lóki J., Kiss T., Rózsa P., Sipos G., Sütő L.,
Sabre M., Gaudichet A., Frangi J.P., Wind erosion in a semiarid Szabó J., Veress M., Recent landform evolution in Hungary. In:
agricultural area of Spain: the WELSONS project. Catena, 2003, Lóczy D., Stankoviansky M., Kotarba A. (Ed.) Recent Landform
52, 235–256 Evolution. Springer, New York, 2012, 205–247
[13] Nordstrom K.F., Hotta S., Wind erosion from cropland in the [32] Lakatos M., Szépszó G., Bihari Z., Krüzselyi I., Szabó P., Bartholy
USA: a review of problems, solutions and prospects. Geoderma, J., Pongrácz R., Pieczka I., Torma C. Changes of the climato-
2004, 121, 157–167 logical extremes in Hungary. OMSZ, Budapest, 2012 (in Hun-
[14] Shao Y., Physics and modelling of wind erosion. Springer, garian) http://www.met.hu/doc/IPCC_jelentes/HREX_jelentes-
Cologne, 2008 2012.pdf Accessed 7 November 2014
[15] Bagnold R.A. The Physics of Blown Sand and Desert Dunes. [33] Szabó L., Karácsony J., Székely Zs., Wind erosion problems in
Methuen, London, 1941 Hungary. Agrokémia és talajtan, 1994, 43, 109–112
[16] Woodruff N.P., Siddoway F.H., A Wind Erosion Equation. Soil Sci. [34] Lóki J., Research of the land forming activity of wind and pro-
Soc. Am. J., 1965, 29(5), 602–608 tection against wind erosion in Hungary. Riscursi şi Catastrofe,
[17] Fryrear D.W., Mechanics, measurement and modeling of wind 2001, 9, 83–95
erosion. Advances in Geoecology, 1998, 31(1), 291–300 [35] Mezősi G., Blanka V., Bata T., Kovács F., Meyer B., Estimation
[18] Fryrear D.W., Saleh A., Bilbro J.D., Schomberg H.M., Stout J.E., of regional differences in wind erosion sensitivity in Hungary.
Zobeck T.M., Revised Wind Erosion Equation (RWEQ). Wind Ero- Natural Hazards and Earth System Sciences, 2015, 15, 97–107
sion and Water Conservation Research Unit, Technical Bulletin [36] Jaedicke C., Solheim A., Blikra LH. Stalsberg K., Sorteberg A.,
1, Southern Plains Area Cropping Systems Research Laboratory, Aaheim A. et al. Spatial and temporal variations of Norwegian
USDA-ARS, 1998 geohazards in a changing climate, the GeoExtreme Project. Nat.
[19] NAM, USDA National Agronomy Manual, 2002 http://directives. Hazards Earth Syst. Sci., 2008, 8, 893–904
sc.egov.usda.gov/OpenNonWebContent.aspx?content=17894. [37] ALADIN model http://www.cnrm.meteo.fr/aladin/
wba Accessed 7 November 2014 [38] REMO model http://www.remo-rcm.de/
[20] Böhner J., Schäfer W., Conrad O., Gross J., Ringeler A., The [39] Péczely Gy., Climatology [Éghajlattan]. Nemzeti Tankönykiadó,
WEELS model: methods, 15 results and limitations, Catena, Budapest, 1998 (In Hungarian)
2003, 52, 289–308 [40] MET, Hungarian Meteorological Service, 2012 http://www.met.
[21] Hagen L.J., Evaluation of the wind erosion prediction system hu/eghajlat/magyarorszag_eghajlata/altalanos_eghajlati_jell
(WEPS) erosion submodel on cropland fields. Environmental emzes/szel/ Accessed 7 November 2014
Modelling and Software, 2004, 19(2), 171–176 [41] Lyles L., Krauss R.K., Threshold velocities and initial particle
[22] Webb N.P., McGowan H.A., Phinn S.R., McTainsh G.H., AUSLEM motion as influenced by air turbulence. 1971, Paper No. 70–740,
(AUStralian Land Erodibility Model): a tool for identifying wind presented at winter meeting ASAE, December 8–11, 1970.
erosion hazard in Australia. Geomorphology, 2006, 78 (3–4), [42] AGRO, Agrotopographical Database, 1991 http://maps.rissac.
179–200 hu/agrotopo_en/. Accessed 7 November 2014
[23] Funk R., Skidmore E.L., Hagen L.J., Comparison of wind erosion [43] Huete A., Didan K., Miura T., Rodriguez E.P., Gao X., Ferreira
measurements in Germany with simulated soil losses by WEPS. L.G., Overview of the radiometric and biophysical performance
Environmental Modelling & Software, 2004, 19, 177–183 of the MODIS vegetation indices. Remote Sensing of Environ-
[24] Shao, Y., Leslie, L. M., Wind erosion prediction over the Aus- ment, 2002, 83, 195–213
tralian continent, J. Geophys. Res.-Atmos., 1997, 102, 30091– [44] Nakicenovic N., Swart R. (Ed.), Emissions Scenarios. A Spe-
30105 cial Report of IPCC Working Group III. Cambridge University
[25] Buschiazzo, D. E., Zobeck, T. M., Aimar, S. B., Wind erosion in Press, Cambridge, UK, 2000. http://www.ipcc.ch/pdf/special-
loess soils of the semiarid Argentinian pampas, Soil Sci., 1999, reports/emissions_scenarios.pdf Accessed 7 November 2014
164, 133–138 [45] CORINE, CORINE land cover 2006, http://www.eea.europa.eu/
[26] Zobeck, T. M., Parker, N. C., Haskell, S., Guoding, K., Scaling publications/COR0-part2 Accessed 7 November 2014
up from field to region for wind erosion prediction using a field- [46] Lyles L., Erosive wind energy distributions and climatic factors
scale wind erosion model and GIS, Agr. Ecosyst. Environ., 2000, for the West. J Soil Water Conserv., 1983, 38(2), 106–109
82, 247–259, [47] Klik A., Wind Erosion Assessment in Austria using Wind Erosion
[27] Youssef, F., Visser, S., Karssenberg, D. J., Bruggeman, A., and Equation and GIS. In: Francaviglia R (ed) Agricultural Impacts on
Erpul, G., Calibration of RWEQ in a patchy landscape: a first Soil Erosion and Soil Biodiversity: Developing Indicators for Pol-
step towards a regional scale winderosion model, Aeolian Res., icy Analysis, Proceedings from an OECD Expert Meeting, Rome,
2012, 3, 467–476 2004, 145–154
[28] Kemény G., Varga T., Fogarasi J., Nemes A., The effects of [48] Skidmore, EL., Wind erosion climatic erosivity. Climatic Change
weather risks on micro-regional agricultural insurance premi- 1986, 9: 195–208
ums in Hungary. Studies in Agricultural Economics, 2013, 115,Assessment of future scenarios for wind erosion sensitivity changes | 477
[49] Panebianco J.E., Buschiazzo D.E., Erosion predictions with the [61] Woodruff N.P., Armbrust D.V., A monthly climatic factor for the
Wind Erosion Equation (WEQ) using different climatic factors. wind erosion equation. Journal of Soil and Water Conservation,
Land degradation and development, 2008, 19(1), 36-44 1968, 23, 3 May-June, 1968, Reprinted from the Journal of Soil
[50] Farda, A., Déué, M., Somot, S., Horányi, A., Spiridonov, V., Tóth, and Water Conservation March-April 1983, 38(2)
H., Model ALADIN as regional climate model for Central and [62] IPCC, Climate Change. The Physical Science Basis. Working
Eastern Europe. Studia Geophysica et Geodaetica, 2010, 54(2), Group I. Contribution to the Fourth Assessment Report of the
313–332 IPCC ed by S. Solomon, D. Qin, M. Manning, Z. Chen, M. Mar-
[51] Csima, G., Horányi, A., Validation of the ALADIN-Climate re- quis, K.B. Averyt, M. Tignor, H.L. Miller. Cambridge University
gional climate model at the Hungarian Meteorological Service. Press, New York, NY, 2007
Időjárás. Quarterly Journal of the Hungarian Meteorological Ser- [63] Richert C., Matzarakis A., The climatic wind energy potential –
vice 2008, 112 (3–4), 155–177 present and future: GIS-analysis in the region of Freiburg im
[52] Szépszó, G., Horányi, A., Transient simulation of the REMO re- Breisgau based on observed data and Regional Climate Models.
gional climate model and its evaluation over Hungary. Időjárás, Open Geosciences, 2014, 6(2), 243–255
Quarterly Journal of the Hungarian Meteorological Service [64] Rockel B., Woth K.,. Extremes of near-surface wind speed over
2008, 112 (3–4), 203–231 Europe and their future changes as estimated from an ensemble
[53] Žagar, N., Žagar, M., Cedilnik, J., Gregorič, G. and Rakovec, J., of RCM simulations. Climatic Change, 2007, 81, Supplement 1,
Validation of mesoscale low-level winds obtained by dynamical 267–280
downscaling of ERA40 over complex terrain. Tellus A, 2006, 58, [65] Blaskó L., Karuczka A., Nyiri L., Zsembeli J., Wind erosion sen-
445–455 sitivity analysis of cohesive soils (Kötött talajok széleróziós
[54] Klir G.J., Yuan B, Fuzzy sets and fuzzy logic. Prentice Hall, New érzékenységének vizsgálata). Agrokémia és Talajtan, 1995, 44,
Jersey, 1995 497–503 (In Hungarian)
[55] Shi H., Gao Q., Qi Y., Liu J., Hu Y., Wind erosion hazard assess- [66] Lyon D.J., Smith J.A. Wind Erosion and Its Control, 2010 http://
ment of the Mongolian Plateau using FCM and GIS techniques. www.ianrpubs.unl.edu/epublic/live/g1537/build/{#}target Ac-
Environ Earth Sci., 2010, 61, 689–697 cessed 7 November 2014
[56] Borrelli, P., Panagos P., Ballabio C., Lugato E., Weynants M., [67] Farsang A., Bartus M., Barta K., Szatmári J., Csernozjom tala-
Montanarella L., Towards a pan-European assessment of land jok in situ széleróziós vizsgálata terepi szélcsatornával [Wind
susceptibility to wind erosion. Land Degradation & Develop- erosion study on Chernozem soils, an in situ wind tunnel re-
ment, 2014, DOI: 10.1002/ldr.2318 search] . In Dobos E., Bertóti R.D., Szabóné Kele G. (Eds.). Ta-
[57] Park I., Lee J., Saro L., Ensemble of ground subsidence haz- lajvédelem Különszám. Talajtan a mezőgazdaság, a vidékfe-
ard maps using fuzzy logic. Open Geosciences, 2014 6(2), 207– jlesztés és a környezetgazdálkodás szolgálatában [Soilscience
218[58] Eastman J.R. IDRISI Andes tutorial. Worcester, MA, Clark for agriculture, rural development and environment manage-
University, 2006 ment], Miskolc, Hungary, 2013, 157–168 (In Hungarian)
[58] Li F.R., Kang L.F., Zhang H., Zhao L.Y., Shirato Y., Taniyama [68] Tibke G., Basic principles of wind erosion control. Agr. Ecosyst.
I., Changes in intensity of wind erosion at different stages Environ., 1988, 22–23, 103–122
of degradation development in grasslands of Inner Mongolia, [69] Leenders J.K., van Boxel J.H., Sterk G., Wind forces and related
China. J. Arid Environ., 2005, 62, 567–585 saltation transport. Geomorphology, 2005, 71, 357–372
[59] Skidmore E.L., Wind Erosion Climatic Erosivity. Climate Change, [70] Horel Á., Tóth E., Gelybó Gy., Kása I., Bakacsi Zs., Farkas Cs., Ef-
1986, 9, 195–208 fects of Land Use and Management on Soil Hydraulic Properties.
[60] Armbrust D.V., Bilbro J.D., Relating Plant Canopy Characteris- Open Geosciences, 2015, 7 (1), 742–754
tics to Soil Transport Capacity by Wind. Agronomy Journal, 1997, [71] Robinson V.B., A Perspective on the Fundamentals of Fuzzy Sets
89(2), 157–162 and their Use in Geographic Information Systems. Transactions
in GIS, 2003, 7, 3–30You can also read