Global warming and windstorm impacts in the EU - JRC PESETA IV project - Task 13 - European ...
←
→
Page content transcription
If your browser does not render page correctly, please read the page content below
Global warming and windstorm
 impacts in the EU

 JRC PESETA IV project – Task 13

 Jonathan Spinoni, Giuseppe Formetta, Lorenzo
 Mentaschi, Giovanni Forzieri and Luc Feyen

 2020

 EUR 29960 EN

This publication is a Technical report by the Joint Research Centre (JRC), the European Commission’s science and knowledge service. It aims
to provide evidence-based scientific support to the European policymaking process. The scientific output expressed does not imply a policy
position of the European Commission. Neither the European Commission nor any person acting on behalf of the Commission is responsible
for the use that might be made of this publication. For information on the methodology and quality underlying the data used in this
publication for which the source is neither Eurostat nor other Commission services, users should contact the referenced source. The
designations employed and the presentation of material on the maps do not imply the expression of any opinion whatsoever on the part
of the European Union concerning the legal status of any country, territory, city or area or of its authorities, or concerning the delimitation
of its frontiers or boundaries.

Contact information
Name: Jonathan Spinoni
Address: Joint Research Centre, via E. Fermi 2749, 21027 Ispra (VA), Italy.
Email: jonathan.spinoni@ec.europa.eu
Tel.: +390332785817

EU Science Hub
https://ec.europa.eu/jrc

JRC118595

EUR 29960 EN

 PDF ISBN 978-92-76-12955-4 ISSN 1831-9424 doi:10.2760/039014

Luxembourg: Publications Office of the European Union, 2020

© European Union 2020

The reuse policy of the European Commission is implemented by the Commission Decision 2011/833/EU of 12 December 2011 on the
reuse of Commission documents (OJ L 330, 14.12.2011, p. 39). Except otherwise noted, the reuse of this document is authorised under the
Creative Commons Attribution 4.0 International (CC BY 4.0) licence (https://creativecommons.org/licenses/by/4.0/). This means that reuse is
allowed provided appropriate credit is given and any changes are indicated. For any use or reproduction of photos or other material that is
not owned by the EU, permission must be sought directly from the copyright holders.

All images © European Union 2020, except cover page: Animaflora PicsStock - stock.adobe.com

How to cite this report: Spinoni J., Formetta G.(a), Mentaschi L., Forzieri G., and Feyen L., Global warming and windstorm impacts in the EU,
EUR 29960 EN, Publications Office of the European Union, Luxembourg, 2020, ISBN 978-92-76-12955-4, doi:10.2760/039014.
JRC118595.

All authors from the European Commission's Joint Research Centre, except:
(a)
 Università di Trento (Italy)

Contents

Executive summary ................................................................................................................................................................................................... 1
1 Introduction ............................................................................................................................................................................................................ 4
2 Methodology .......................................................................................................................................................................................................... 5
3 Findings..................................................................................................................................................................................................................... 6
 3.1 Wind losses in the recent past .......................................................................................................................................... 6
 3.2 Wind hazard projections ....................................................................................................................................................... 6
 3.3 Wind impact projections ....................................................................................................................................................... 8
4 Conclusions .......................................................................................................................................................................................................... 11
Annexes ......................................................................................................................................................................................................................... 12
 Annex 1. Extended methodology ............................................................................................................................................................. 12
 A1.1 Weather reanalysis and climate projections ......................................................................................................................... 12
 A1.2 Socioeconomic projections .............................................................................................................................................................. 13
 A1.3 Wind indicator ......................................................................................................................................................................................... 13
 A1.4 Vulnerability assessment ................................................................................................................................................................. 14
 A1.5 Impact modelling .................................................................................................................................................................................. 16
 Annex 2. Additional results ......................................................................................................................................................................... 17
References ................................................................................................................................................................................................................... 21
List of figures............................................................................................................................................................................................................. 24
List of Tables.............................................................................................................................................................................................................. 25

 i
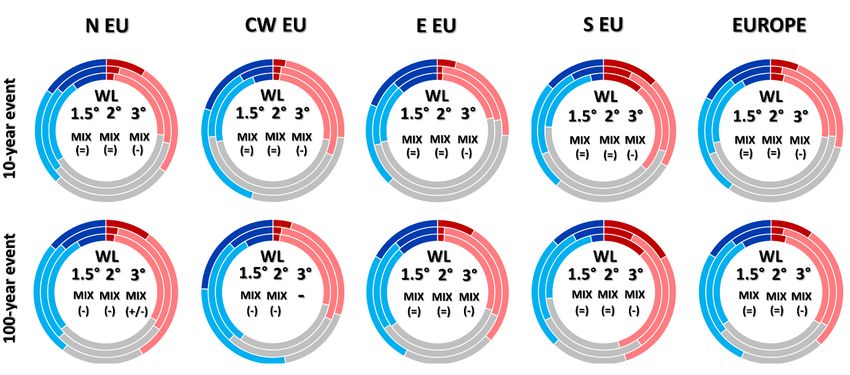
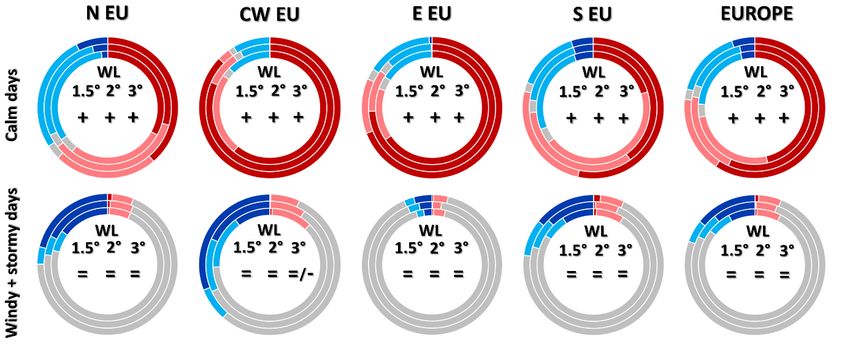
Executive summary
Windstorms are amongst the most damaging natural hazards in Europe, with approximately 5
€billion of estimated annual losses in the EU. The number of reported windstorms significantly
increased over the last decades, yet there is no consensus about a climate-induced trend in
windstorms over Europe. Climate model projections of extreme wind are highly uncertain, also
because the current generation of climate models still do not resolve spatial and temporal
resolution issues. However, but they suggest that windstorms will not become more intense or
happen more frequent with global warming over most of the European land, As a consequence, it is
expected that risks from windstorms in the EU will not rise due to climate change. Future impacts
of wind extremes could be reduced by a range of measures, such as the development and
implementation of enhanced windstorm-resilient standards and building codes.

Current effects of windstorms
During the last decades, Europe was hit by a number of highly impacting windstorms that caused a considerable
human and economic impact, ranging from human fatalities and injuries to damage to roads, power plants, the
agriculture sector, forests, infrastructure, and private properties. Estimated average annual losses for the EU
and UK amount to 5 €billion/year (in 2015 values), or approximately 0.04% of total GDP (of 2015). Absolute
losses are highest in Germany (850 €million/year), France (680 €million/year), Italy (540 €million/year) and the
UK (530 €million/year), while impacts relative to the size of the economy are double the EU average in Bulgaria
and Estonia (0.08% of GDP), and 0.07% of GDP in Latvia, Lithuania and Slovenia. Each year approximately 16
million citizens in the EU and UK are exposed to windstorms with an intensity that happens only once every 30
years in present climate, resulting in nearly 80 annual deaths. While in tropical regions an increase in the
frequency and intensity of cyclones has been observed in the last decades, in particular from the 1990’s, in
Europe there is no robust trend in windstorms.

Figure 1. Area fraction (in %) of each region (northern Europe, central-western Europe, eastern Europe, southern Europe)
with a significant increase (dark blue), no change (grey) and decrease (light blue) in 100-year wind speed (ensemble median
change is significant if >0.3 m/s and at least 2/3 models agree on sign of change) and number of calm days (ensemble
median change is significant if >5 days and at least 2/3 models agree on sign of change). Inner (outer) circle represents
1.5°C (3°C) warming.

Wind hazard across Europe in a warmer climate
Recent and pan-European assessments of possible changes in extreme windstorms in view of global warming
are lacking and, moreover, none of the earlier iterations of the PESETA project investigated windstorms.
According to this study, climate model projections suggest small changes in wind hazard with global warming

 1
in Europe. At 3°C warming, maximum wind speeds will likely reduce over 16% of the land area, increase over
nearly 10% (including the Alpine areas) and remain relatively stable over the rest of Europe. Southern-Europe
is the region with the largest share of the area with an increase in wind extremes (17% at 3°C), while central-
western Europe has the largest share of land for which less intense wind extremes are projected (24% at 3°C).
Also the number of windy or stormy days does not show significant changes. On the other hand, there is a
robust tendency projected towards more calm days (daily maximum wind speed below 3.5 m/s) over most of
Europe, in particular over central, west and east Europe (Figure 1).

Economic losses from windstorms assuming no socioeconomic change
The lack of a significant trend in wind hazard with global warming across Europe implies that human and
economic impacts will remain stable when assuming that current socioeconomic conditions continue into the
future (Figure 2). For most countries impacts also remain stable, yet with 3°C global warming losses could grow
to 0.08 of the country GDP (of 2015) in Hungary, Romania and Slovakia compared to 0.06% under present
climate. In Estonia, on the other hand, losses could drop from 0.08% of GDP under present climate to 0.05% of
GDP with 3°C global warming (see Table 6 in the Annexes for further details).

 base 1.5˚C 2.0˚C 3.0˚C
 Wind losses (€ billion)

 4.6 4.5 4.6 4.6

 Wind losses (% of GDP)

 0.04 0.04 0.04 0.04

Figure 2. Annual wind losses for the EU and UK assuming that current socioeconomic conditions continue into the future.

Economic losses from wind storms with socioeconomic change
The projected losses in absolute terms are larger when future socioeconomic change is accounted for compared
to when it is assumed, that the current socioeconomic conditions continue into the future, because of the growth
of the size of the economy and hence higher values of the exposed assets. By 2050, wind storm annual losses
are projected to grow to nearly 7 €billion/year (in 2015 values) for both 1.5 and 2°C global warming. By the
end of this century this further grows to more than 11 €billion/year, with slightly higher impacts for higher
levels of warming (Figure 3). Future wind-induced damage expressed as a share of the size of future economies
show a small decrease because building stock and replacement costs grow somewhat slower than GDP.

 base 1.5˚C 2.0˚C 3.0˚C
 Wind losses (€ billion)

 4.6 11.3 11.4 11.4

 Wind losses (% of GDP)

 0.04 0.03 0.03 0.03

Figure 3. Annual wind losses for the EU and UK assuming socioeconomic conditions in 2100 according to the 2015 Ageing
Report.

 2
Resilience to wind extremes
Even though our projections indicate that wind hazard and risk will likely not change in Europe with global
warming, increasing resilience to present wind extremes could further reduce impacts on future societies. There
are a wide range of measures that could be taken, such as increasing windstorm forecast accuracy and warning
time, improving storm readiness, emergency communications and response, as well as structural measures for
wind-proofing infrastructures, which in the EU could be stimulated by amendments of Eurocodes.

Approach
Projections of daily wind speed under a high emissions scenario (RCP8.5) and moderate mitigation scenario
(RCP4.5) were used in order to estimate changes in wind hazard between baseline (1981-2010) climate and at
global warming levels of 1.5, 2 and 3°C above preindustrial levels. Wind damage functions, which relate the
total construction stock with wind speed and economic losses, as well as reported fatalities, were derived from
past wind events and their reported impacts. In the absence of information on future vulnerability, these impact
relations were kept constant in the scenarios. The damage and mortality relations were then applied in a static-
economic scenario, in which wind hazard at the different warming levels was applied to the present population
and construction stock. We also combined the projections of wind hazard at the warming levels with projections
of exposed construction assets and population in 2050 and 2100 according to the 2015 Ageing Report. As it is
very unlikely that 3°C warming will happen by mid-century, this warming level was only combined with 2100
society in the dynamic economic scenario. The use of the static and dynamic economic scenarios allows
disentangling the effects of climate change and exposure dynamics on future windstorm losses.

An important limitation of the analysis is the spatial resolution of the wind data, which is too coarse to capture
local severe windstorms. The current generation of climate models also have a rather poor physical
representation of wind dynamics. Further, in the absence of wind gust data at sub-daily time steps we used
daily maximum wind speed as a proxy of windstorms. It is yet unclear if these limitations affect current
projections of wind hazard in view of global warming.

 3
1 Introduction
Cyclones and extreme windstorms represent the most damaging natural hazard at global scale, causing
approximately one third of total natural disaster losses and two thirds of insured losses. Though Europe is not
frequently hit by cyclones, but only by dust storms, extratropical cyclones and windstorms (Foreman, 2018),
storms together with floods are the costliest naturel hazard in Europe (EEA, 2017; Sharkey et al., 2019). Between
1980 and 2016 they accounted for 31% of total losses and 63% of insured losses, but only 3% of total fatalities
recorded. Similar numbers have been reported at global scale, with windstorms accounting for one third of total
losses by natural disasters and more than two thirds of insured losses (Berz, 2005). The impacts caused by
extreme windstorms include mortality and serious injuries, tree fall, flying debris, damage to properties and
infrastructure, disruption of electricity lines, traffic interruption, and stresses on wind turbines, among others
(Forzieri et al., 2018).
Recently, a few severe windstorms in Europe were reported in the Copernicus Emergency Management Service
(EMS1), such as the autumn 2018 event in northeastern Italy that partially destroyed the woods famous for the
Stradivari’s violins. Though the media tend to emphasize such events, literature suggests the lack of a general
trend in windstorm frequency and intensity over Europe (Barredo, 2010; Feser et al., 2015; Tobin et al., 2015;
Cronin et al., 2018; Spinoni et al., 2019). Results of trend analysis in storm activity critically depend on the time
period analysed due to decadal climate variability and detecting long-term trends is hampered by the
inhomogeneity in historical wind measurements. At regional scale, in the last decades a slight increase of
storminess over North Atlantic and northwestern Europe and a decrease in southern Europe (Feser et al., 2015)
and the Mediterranean (Nissen et al., 2014) has been reported, and a slight upward trend in winter windstorms
in Central Europe (Leckebusch et al., 2008).
With global warming climate extremes are expected to intensify (Forzieri et al., 2016). Some studies report a
likely small increase of storm intensity and frequency in the North Atlantic, northwestern, and western Europe
(Della Marta and Pinto, 2009; Feser et al., 2015), a decrease in southern Europe (Nissen et al., 2014), and
contradicting trends over northern and eastern Europe (Pryor et al., 2010). Recent and pan-European
assessments of possible changes in extreme windstorms in view of global warming are lacking. Also in PESETA
III (and earlier iterations of the project) windstorms were not analysed.
Human and economic losses from storms depend not only on the dynamics and nature of the storm, but also
on the exposure of human population and assets, their vulnerability and the coping capacity of local and regional
communities. The lack of reliable and validated data on vulnerability to windstorms is a gap that needs to be
filled in order to better understand the risk associated to windstorms. Existing aggregated loss indexes for large-
scale applications typically correlate population density and wind speed with reported damage (e.g., Pinto et al.,
2012). There exist more detailed models for specific infrastructures, such as wind=fragility curves for glass
façades (Lima-Castillo et al., 2019) or power transmission networks (Scherb et al., 2019), yet their application
is typically limited to smaller scales and they only capture the infrastructure-specific impacts.

Given the magnitude of impacts of windstorms in Europe and the lack of pan-European projections of this
hazard and the consequent risks, the PESETA IV windstorm analysis aims at filling this gap. We investigate the
correlation between reported impacts and windstorms over past decades and estimate the possible changes in
view of global warming and socioeconomic projections. Reported economic impacts of windstorms are
dominated by damage to infrastructures, while losses to ecosystems typically are not included in loss figures.
Hence, loss estimates herein do not capture these effects. Disturbances of forests due to windstorms, however,
are covered in the forest ecosystems task of PESETA IV. The energy task of PESETA IV further evaluates the
effect of changes in wind regime on wind power potential in Europe. For the wind analysis in both of these tasks
the same underlying wind data from the climate models are used as in the windstorm analysis presented herein.

1
 https://emergency.copernicus.eu/mapping/list-of-components/EMSR334

 4
2 Methodology
This report presents projections of risk of extreme winds for Europe in view of global warming. As an indicator
of wind hazard we used daily maximum wind speed, with a focus on its most extreme values that have the
potential to result in human impacts and damage to infrastructures and assets. To this end, we selected wind
speeds above the 98.5th percentile and fitted an extreme value distribution to these data with non-stationary
extreme value analysis. The extreme value analysis allows relating return levels (RLs) with return periods (RPs)
for extreme wind speed over Europe for the baseline and future periods. The return period expresses how
frequent an event can be expected to happen, whereas the return level is the corresponding magnitude of the
event. The longer the return period, the rarer is the event, but if an event of a given RP shows a shorter RP in
the future, it means that such event will be more frequent. The RPs are expressed in number of years, the RL is
the wind speed (in m/s) corresponding to the RP. In this study, we analysed extreme events corresponding to
RPs from 1 year to 1000 years. As illustrative example, we show results for 10-year and 100-year return
periods. To compute changes in hazard between the baseline and future periods, we used the ensemble median.
To evaluate the robustness of the projections, we used the agreement in sign between simulations: the change
is significant (in sign) if at least two thirds of the models agree on an increase (or decrease) in extreme wind
speed.
We appraised vulnerability to extreme winds on the basis of damage records collected from disaster databases
during the period 1981-2016. The damage data associated to the reported events were used to calibrate
damage functions that correlate the reported loss with the return period of the event derived from weather
reanalysis and the value of total construction of the area where the event caused impacts. Total construction
was used as a proxy of exposure, as damage from wind is typically dominated by infrastructure damage.
Information on the value of the total construction stock was obtained from EUROSTAT2. Projections of the total
construction stock are not available. Given that it shows a strong correlation with GDP, future total construction
values were obtained by scaling baseline values with the projected changes in GDP based on the ECFIN 2015
Ageing Report (EC, 2015)3. For the human impact (mortality) we derived mortality rates from the total number
of fatalities reported per country over the period 1981-2016 and the number of people exposed to windstorms
(corresponding to a 50-year intensity or more severe). Population projections are also according to the 2015
Ageing Report. The national scale socioeconomic data were further downscaled by the LUISA Territorial
Platform4.
We evaluated windstorm hazard and risk in Europe throughout the 21st century by comparing impacts under
baseline (1981-2010) climate with those under global warming levels (GWLs) of 1.5, 2 and 3°C above
preindustrial levels. We evaluated wind impacts under GWLs on today’s society (static economic analysis) as
well as on Europe in 2050 and 2100 for the EU Reference economic scenario (2015 Ageing Report projections.
This allows understanding windstorm risk if climate conditions under different levels of warming would be
imposed on today’s society, without any assumptions on socioeconomic developments over long time spans. In
addition, we also assess the impacts at different warming levels on society in 2050 and 2100 for the EU
Reference socioeconomic scenario (2015 Ageing Report projections). Comparison of the static and dynamic
economic analyses allows disentangling the effects of climate and socioeconomic changes. The vulnerability
derived from recent windstorm events is assumed constant in the projections, hence the results presented do
not include any additional adaptation of sectors to changing maximum wind speed conditions. Our hazard
analysis includes all EU member states plus a number of neighbouring countries (Iceland, Norway, and
Switzerland and Balkan countries). Economic impacts are presented for EU countries and the UK. More details
on the methodology can be found in Annex 1.

2
 http://appsso.eurostat.ec.europa.eu/nui/show.do?dataset=nama_10_nfa_fl&lang=en
3
 During the PESETA IV project, the 2018 Ageing projections became available but they could not be incorporated. Compared to the 2015
Ageing Report, GDP growth projections are slightly lower over the period 2025-2050 and marginally higher during 2055-2070. These
updated projections do not affect the main conclusions of this report.
4
 https://ec.europa.eu/jrc/en/luisa

 5
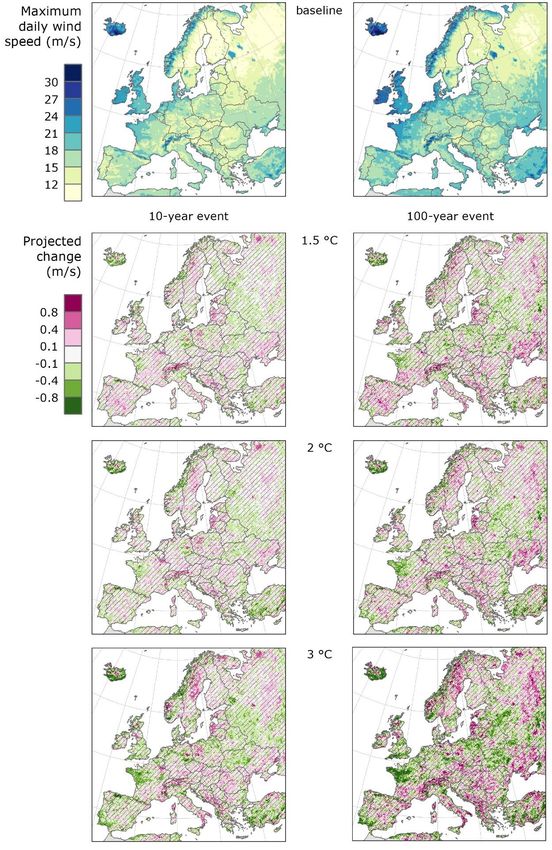
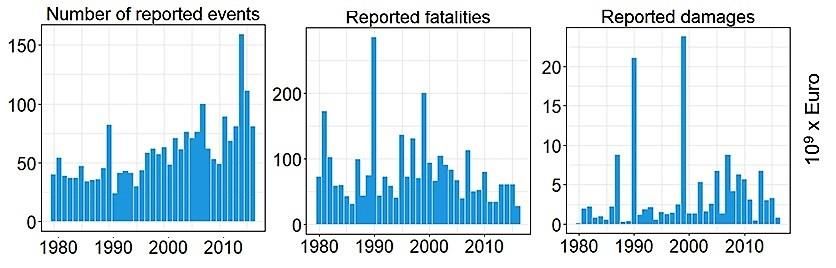
3 Findings

3.1 Wind losses in the recent past
We analysed reported damage from about 2000 wind-related disaster records collected over 1981-2016 in the
Munich RE’s NatCatSERVICE disaster database. Figure 4 shows the evolution in time of the total number of
reported wind events, fatalities, and damage (expressed in 2015 €billion) per year in Europe between 1981 and
2016. The total number of reported events in time shows a significant increasing trend in the analysed period.
The total reported fatalities caused by wind over the period 1981-2016 sums up to an average of 80/year.
Reported fatalities do not show a statistically significant trend. The total reported economic damage caused by
wind over the period 1981-2016 sums up to nearly 138 €billion or an average of 3.7 €billion/year. Reported
damage shows a slight increasing trend in time. With a lack of general trend in extreme windstorms over this
period in Europe, this relates predominantly to more value exposed due to economic growth.

Figure 4. Evolution in time of the total number of reported wind events, fatalities, and damage in Europe between 1981 and
2016 (from NatCatSERVICE disaster database).

3.2 Wind hazard projections
Figure 5 shows the projected changes in wind speed of a present 10-year and 100-year daily maximum wind
speed between the baseline and warming levels of 1.5, 2°C and 3°C. The projected changes in maximum wind
speed are very small both in absolute values and relative terms. There is also no homogeneous spatial pattern
in the projected changes in wind extremes over European lands. The projected changes slightly increase in
absolute values with global warming level and they are overall statistically somewhat more robust, but still no
clear general pattern is present. However, in particular for higher intensity wind speeds (exemplified by the 100-
year wind speed) at a global warming level of 3°C, some robust patterns emerge: a decrease in return level
(meaning less severe windstorms) over most of Iceland, north-western France, southern Portugal, north-eastern
Poland, and southern UK. Oppositely, an increase in wind hazard is projected over mountainous areas in
Scandinavia and the Alps, and in southern Italy and scattered areas in central and eastern Europe (e.g., Hungary
and Romania).

 6
Figure 5. Baseline 10- and 100-year maximum daily wind speed and projected change for different global warming levels.
Dashed lines represent no-robust changes where less than two third of the simulations agree on the sign of change.

The pan-European and macro-regional scale summary (Figure 6,

 7
Table 5) shows that at 1.5°C global warming over nearly 90% of the European land area the projected changes
are negligible (
minor changes. It should be noted that these estimates of economic damage and fatalities are based on present
vulnerability estimates (i.e., the damage function and mortality rates derived from past disasters) under all
scenarios. If the trend of declining vulnerability with increasing wealth observed over the last decades in high-
income countries (Formetta and Feyen, 2019) continues, it is expected that future relative impacts of wind
extremes to EU societies will be lower than today.

Table 1. Ensemble median Expected Annual Damage (EAD, expressed in 2015 €million) for the baseline (1981-2010) and
warming levels for the alternative socioeconomic scenarios.

 Base society 2050 society 2100 society
Country base 1.5°C 2.0°C 3.0°C 1.5°C 2.0°C 1.5°C 2.0°C 3.0°C
Austria 116 126 137 128 191 206 305 329 308
Belgium 121 118 120 111 187 190 326 330 305
Bulgaria 29 29 26 31 39 34 55 48 59
Cyprus 6 7 6 6 15 14 26 24 21
Croatia 29 25 28 34 38 44 55 63 76
Czechia 91 80 84 93 115 122 196 208 231
Denmark 93 75 89 82 137 161 245 288 266
Estonia 12 11 9 9 16 14 24 20 18
Finland 110 109 99 100 158 144 269 244 247
France 682 704 709 752 1,084 1,088 1,920 1,928 2,046
Germany 854 797 844 896 1,042 1,103 1,554 1,646 1,748
Greece 72 71 68 68 81 78 113 110 110
Hungary 62 61 65 76 88 93 128 136 159
Ireland 83 80 78 63 135 130 251 243 197
Italy 541 528 512 535 788 765 1,262 1,226 1,278
Latvia 15 13 13 12 18 17 27 26 25
Lithuania 22 20 22 18 27 30 43 47 39
Luxembourg 15 14 15 16 25 28 45 51 52
Malta 3 4 3 2 10 8 15 13 9
Netherlands 188 155 157 149 223 226 373 378 357
Poland 223 200 214 204 311 333 410 439 419
Portugal 56 67 57 69 94 80 132 112 133
Romania 83 95 90 99 131 125 193 184 201
Slovakia 43 43 45 55 67 70 101 104 127
Slovenia 24 24 25 27 34 37 55 60 63
Spain 324 336 329 355 555 538 883 856 929
Sweden 170 184 191 177 321 335 614 640 596
United Kingdom 528 550 552 473 899 900 1,639 1,640 1,403
EU and UK 4,594 4,528 4,588 4,641 6,829 6,913 11,260 11,393 11,422

 9
Table 2. Ensemble median Expected Annual People Exposed (EAPE, in 1000 people) for baseline (1981-2010) and warming
levels for the alternative socioeconomic scenarios.

 Base society 2050 society 2100 society
Country base 1.5°C 2.0°C 3.0°C 1.5°C 2.0°C 1.5°C 2.0°C 3.0°C
Austria 278 282 287 269 328 331 311 315 294
Belgium 363 340 339 343 457 456 497 496 502
Bulgaria 236 239 237 275 188 186 131 129 152
Cyprus 27 27 25 22 32 29 33 31 26
Croatia 126 128 142 162 110 123 84 93 106
Czechia 347 324 340 355 344 360 312 326 339
Denmark 169 153 154 142 176 176 191 191 177
Estonia 36 35 32 28 32 28 26 23 21
Finland 172 173 174 169 197 197 202 202 196
France 2,032 2,080 1,945 1,975 2,396 2,239 2,570 2,402 2,438
Germany 2,660 2,581 2,596 2,503 2,402 2,406 2,024 2,027 1,947
Greece 310 303 291 282 260 250 198 190 184
Hungary 329 332 358 401 316 342 256 278 311
Ireland 146 155 146 143 168 159 190 179 176
Italy 1,840 1,778 1,758 1,865 2,022 1,997 1,825 1,803 1,912
Latvia 67 66 59 52 45 41 37 33 29
Lithuania 98 95 94 80 60 59 51 51 43
Luxembourg 16 19 20 20 37 40 48 52 52
Malta 11 10 9 9 11 10 10 9 9
Netherlands 549 533 528 502 562 557 545 540 513
Poland 1,275 1,200 1,234 1,110 1,089 1,121 752 775 695
Portugal 303 346 264 241 285 218 224 171 156
Romania 667 667 687 793 595 614 443 457 529
Slovakia 183 172 178 209 155 160 117 121 142
Slovenia 70 73 80 87 75 82 67 73 79
Spain 1,399 1,450 1,295 1,218 1,400 1,248 1,260 1,123 1,055
Sweden 303 301 303 262 383 384 467 467 405
United Kingdom 1,996 2,073 2,092 1,968 2,538 2,565 2,802 2,832 2,672
EU and UK 16,010 15,935 15,666 15,485 16,662 16,377 15,672 15,387 15,158

 10
4 Conclusions
The wind hazard projections show that with global warming there will likely be no significant change in extreme
wind-related events over most of the European territory. On the other hand, a robust increase in calm days is
projected almost everywhere. This could have positive consequences for various sectors, from wind farm power
generation to tourism and river transportation. We used a large number of the most recent high-resolution
climate simulations available for Europe. However, present climate models still do not resolve some model and
resolution issues, which make projections of future wind, and especially the extremes, highly uncertain. There
is a clear need for very high spatial and temporal resolution wind data (the best option would be of wind gust
instead of maximum wind speed), both for the past and future. In order to improve the projections – which does
not necessarily mean larger and more robust changes – the new generation of climate models (i.e., the CMIP6)
could help.
The likely small changes expected in wind extremes with global warming will result in negligible changes in risks
associated to windstorms. The projected changes in exposure (population and assets) in Europe also do not
dramatically change future wind risk projections. Our analysis assumes static vulnerability. This means that the
human mortality and economic loss rates derived from reported impacts of past windstorms are assumed to
be constant under the different scenarios. Even though that wind hazard and risk will likely not strongly rise
with global warming, the risk to future societies could be further reduced by increasing resilience to extreme
winds.
Possible adaptation measures include improved design of infrastructure, such as the siting and orientation of
buildings, the angling of roofs so that they slope down to face the prevailing wind direction, taking advantage
of adjacent shielding, avoiding excessive roof overhangs and nearby hazardous objects such as mature trees
and overhead distribution cables. Also the development and use of new materials can make buildings and
infrastructure more resilient against extreme wind gusts. In the EU, the wind-proofing of infrastructure could
be further stimulated through potential amendments of Eurocodes with regard to structural design addressing
relevant impacts of windstorms, both general and material-specific. Buildings that require continuity of services
such as power, for instance healthcare buildings, should be protected against interruptions to power supplies.
Other measures include the removal of debris and old trees close to traffic roads, a strategic plan to plant
broadleaved trees close to houses, schools, and hospitals instead of tall conifers, and the capillary teaching of
actions to take during a windstorm emergency.

 11
Annexes

Annex 1. Extended methodology
A1.1 Weather reanalysis and climate projections
The new ERA5 reanalyses dataset, provided by the ECMWF (European Centre for Medium-Range Weather
Forecasts), is the most recent meteorological reanalysis dataset. It includes estimates of a range of atmospheric
parameters, including air temperature, pressure, wind, humidity and ozone at different altitudes, and surface
parameters such as rainfall, soil moisture, sea-surface temperature. The resolution of the dataset is 0.25°. In
this study, we downloaded maximum wind speed at hourly temporal resolution data for Europe from 1979 to
2018. These data were used to analyse windstorms in the past and link them with reported losses.
Projections of wind hazard (daily maximum wind speed at 10-m) with global warming are based on two
Representative Concentration Pathways (RCPs): RCP4.5 and RCP8.5. RCP4.5 may be viewed as a moderate-
emissions-mitigation-policy scenario and RCP8.5 as a high-end emissions scenario. Statistical and quantitative
hazard analyses in this report are performed over 30-year time periods. The reference scenario spans the period
1981-2010, hereinafter referred to as “base”. We compare impacts for the baseline with those over 30-year
time slices centred on the year that global average temperature is 1.5, 2 and 3°C above preindustrial
temperature (Table 3). The 1.5°C and 2°C warming scenarios are explicitly considered in the Paris Agreement,
while a 3°C global warming is a scenario that could be expected by the end of the 21 st century if adequate
mitigation strategies are not taken.

Table 3. Regional climate projections used in the wind hazard and impact analysis and corresponding years of exceeding
1.5, 2 and 3 °C global warming.

 RCP4.5 RCP8.5 RCP4.5 RCP8.5 RCP4.5 RCP8.5
 RCM (R) Driving GCM (G)
 1.5 °C 2 °C 3 °C

 CNRM-CERFACS-CNRM-CM5 2035 2029 2057 2044 2067

 CCLM4.8-17 ICHEC-EC-EARTH 2033 2026 2056 2041 2066

 MPI-M-MPI-ESM-LR 2034 2028 2064 2044 2067

 HIRHAM5 ICHEC-EC-EARTH 2032 2028 2054 2043 2065

 WRF331F IPSL-IPSL-CM5A-MR 2023 2021 2042 2035 2054

 RACMO22E ICHEC-EC-EARTH 2032 2026 2056 2042 2065

 CNRM-CERFACS-CNRM-CM5 2035 2029 2057 2044 2067

 ICHEC-EC-EARTH 2033 2026 2056 2041 2066

 RCA4 IPSL-IPSL-CM5A-MR 2023 2021 2042 2035 2054

 MOHC-HadGEM2-ES 2021 2018 2037 2030 2069 2051

 MPI-M-MPI-ESM-LR 2034 2028 2064 2044 2067

For each RCP an ensemble of 11 EURO-CORDEX combinations of Global Climate Models (GCM) and Regional
Climate Models (RCM) were used (Jacob et al., 2014). Wind hazard conditions at 1.5 and 2°C warming were
derived from an ensemble of 22 climate projections (11 RCP4.5 and 11 RCP8.5 members), whereas the

 12
ensemble projections for 3°C warming are based on RCP8.5 only, as 10 out of 11 RCP4.5 climate simulations
do not reach 3°C warming.
It should be noted that we derived climate at global warming levels from transient climate projections, which
may differ from stabilized climate at those warming levels. Studies (e.g., Maule et al., 2017) suggest that the
effect of pathway to global warming levels is small compared to the models’ variability, expect for strongly not
time-invariant variables such as sea level rise.

A1.2 Socioeconomic projections
We performed the wind risk assessment with static socioeconomic conditions as well as with projections of
socioeconomic development in Europe. The static approach provides information on how climate and
consequent wind conditions at different global warming levels would affect today’s societies in Europe. For the
dynamic economic assessment we focus on 2050 and 2100. At mid-century we evaluate losses of 1.5 and 2°C
warming on 2050’s economy (as 3°C is unrealistic by mid-century) and at the end of the century we consider
the effect of the three warming levels on 2100’s economy.
The projections of socioeconomic development in Europe are based on the ECFIN 2015 Ageing Report, further
referred to as EU Reference Scenario. This scenario acts as a benchmark of current policy and market trends in
the EU. High-resolution land use and population projections based on the EU Reference Scenario were derived
with the LUISA modelling platform (Jacobs-Crisioni et al., 2017).
As the Ageing report deals with projections only to the year 2060, the projections have been extended to the
year 2100. Regarding the GDP projections, the Ageing Report assumes that two out of the three determinants
of economic growth, technical progress and capital accumulation, would reach a steady state (with constant
growth rates) by the year 2060. That has been assumed as well for the following decades. The third contributor
to growth (the labour input) has been assumed to evolve in a proportional way with respect to population (i.e.
same growth rate). That means ignoring possible changes in the labour markets conditions, such as changes in
the participation rates or the employment rate. The population projections for 2061-2100 are taken from the
latest United Nations demographic report (medium variant), and they are explicitly considered in the
computation of the economic growth figures (more details can be found in Ciscar et al., 2017).

A1.3 Wind indicator
Wind-related damage is often caused by wind gusts (Francis and Gillespie, 1993; Pryor et al., 2010; Schwierz
et al., 2010), defined as a sudden increase of wind speed. The wind gust is not available from EURO-CORDEX
climate projections and instead we used the daily maximum wind speed as proxy (Rockel and Woth, 2007).
Daily maximum wind speed was obtained as the maximum speed among sub-daily wind speed values from the
reanalysis datasets and as a direct quantity from EURO-CORDEX simulations. Using maximum daily wind speed
instead of wind gust may introduce a bias, in particular dealing with tropical cyclones (Powell et al., 2003) or
the extratropical cyclones as the Medicanes, the Mediterranean hurricanes (Cavicchia et al., 2014), but they are
extremely rare over European lands. Another limitation is that the spatial resolution of the wind data may not
capture local windstorms, and so windstorm peaks are likely to be underestimated. Further, local orography
cannot be fully reproduced with 0.11° or 0.25° data and sub-hourly measurements would be preferable.
We focus only on extreme wind events, which are likely to cause the largest human impact and damage to
infrastructures (Forzieri et al., 2018) and other assets. Our approach follows that by Forzieri et al. (2016), i.e.
we considered only windstorms on the end-tail (98.5th percentile) of the statistical distribution of daily maximum
wind speed over that location, applying a Peak over Threshold analysis and fitting the extremes with a
Generalized Pareto Distribution (Hosking and Valli, 1998). To minimize extrapolation errors, we opted for a non-
stationary extreme value analysis (EVA) over the full length of the climate projections (Mentaschi et al., 2016).
The extreme value analysis (EVA) allowed relating return levels (RLs) with return periods (RPs) for extreme wind
speed over Europe for the baseline and future periods. The return period expresses how frequent an event can
be expected to happen, whereas the return level is the corresponding magnitude of the event. The longer the
return period, the rarer is the event, but if an event of a given RP shows a shorter RP in the future, it means
that such event will be more frequent. The RPs are expressed in number of years, the RL is the wind speed (in
m/s) corresponding to the RP. In this study, we analysed extreme events corresponding to RPs from 1 year to
1000 years. As illustrative example, we show results for 10-year and 100-year return periods.

 13
To compute changes in hazard between the baseline and future periods, we used the ensemble median. To
evaluate the robustness of the projections, we used the agreement in sign between simulations: the change is
significant (in sign) if at least two thirds of the models agree on the increase (or on the decrease). In next
subchapters, we present also regional statistics about projected changes.
The use of wind data is becoming more and more important for different sectors, an example is power
generation in wind farms by wind turbines (Vautard et al., 2014), which operates at best conditions with wind
speed between two critical values (Hansen, 2015). In order to complement the wind hazard analysis with other
frequently used indicators, we compute additional wind indicators and we investigate their changes between
the baseline and the warming levels (and fixed future periods).

A1.4 Vulnerability assessment
In this study, we assess vulnerability to windstorms by correlating observed impacts from windstorms with the
intensity of these events estimated based on reanalysis wind data. To do that, we obtained impact data from
Munich Re’s Natural Catastrophe Statistics dataset (NatCatSERVICE5). This database is structured at country
scale, with sometimes more geographical precision of the area affected. For Europe over the period 1981-2016
it contains information on more than 2,000 wind-related events, for which damage is reported in about 40%
of the cases. Trends in these data have been evaluated for statistical significance using the Mann-Kendall test.
This shows that reported losses typically underestimate true wind losses. There is no disaggregation of the
losses between different sectors. This is a main limitation, together with incomplete data on the exact locations
exposed to extreme events and the inaccurate (or lack of) damage estimate. A summary of the impact data
used can be found in Table 4.
.
The damage data associated to the reported events were used to calibrate damage functions which correlate
the reported loss with the return period of the event and the value of total construction of the area where the
event caused impacts. In this study, information on the value of total construction stock was obtained from
EUROSTAT6. Total construction was used as a proxy of exposure, as damage from wind is typically dominated
by infrastructure damage. Projections of the total construction stock are not available. Given that it shows a
strong correlation with GDP, future total construction values were obtained by scaling baseline values with the
projected changes in GDP based on the ECFIN 2015 Ageing Report (EC, 2015). For the human impact (mortality)
we derived mortality rates from the total number of fatalities reported per country over the period 1981-2016
and the number of people exposed to windstorms (corresponding to a 50-year intensity or more severe).
Population projections are also according to the 2015 Ageing Report. The national scale socioeconomic data
were further downscaled by the LUISA Territorial Platform7.
The methodological approach to estimate future windstorm impacts can be summarized as follows:
 - For each storm event in NatCatSERVICE, we collected the damage, fatalities, location, and date;
 - Search for the highest wind speed in a temporal (2-weeks) and spatial (circle with radius of 100 km)
 window around the date and the location of the reported event;
 - Consider only pixels in the search radius with return periods above 5 years and sum the total
 construction stock corresponding to those pixels;
 - Calibrate the damage function/mortality rate using all the reported events with impacts in
 NatCatSERVICE.

The final damage function (Eq. 1) is a power-based function with the loss (expressed in million euros) as
dependent variable and the return period (RP) and the total construction (TC) of the area as independent
variables.
 = (Eq. 1)

5
 https://natcatservice.munichre.com/
6
 http://appsso.eurostat.ec.europa.eu/nui/show.do?dataset=nama_10_nfa_fl&lang=en
7
 https://ec.europa.eu/jrc/en/luisa

 14
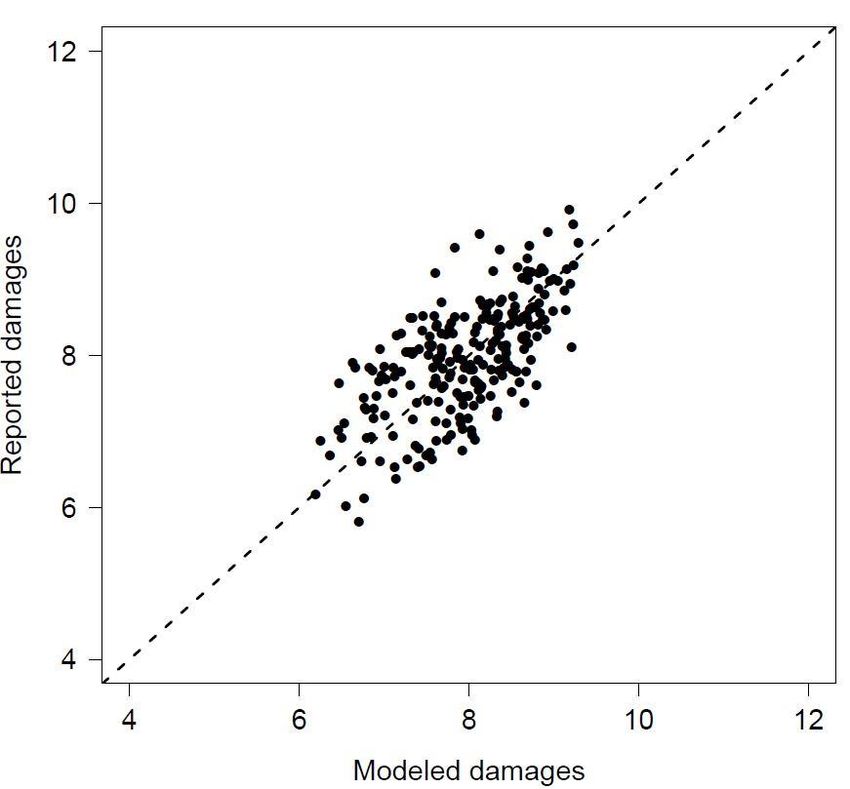
Optimized parameters α and β equal respectively 0.68 and 0.2 and the overall coefficient of determination (R2)
of the function is 0.42. A comparison between modelled and observed losses is shown in Figure 7.

Table 4. Summary of windstorms reported in Munich RE’s NatCatSERVICE disaster database. Fat is for fatalities and dam
for damage. The events refer to the period 1981-2016 and the damage is expressed in 2015 €billion.

 events human economy
 nr reported nr events nr events with reported reported damage in
Country events with fat > 0 dam > 0 fatalities billion € (2015)
Austria 150 23 44 45 3.0
Belgium 66 21 26 55 3.5
Bulgaria 28 11 5 18 0.1
Cyprus 7 1 0 1 0.0
Croatia 17 3 1 3 0.0
Czechia 33 12 5 18 0.4
Denmark 32 9 18 38 7.2
Estonia 9 0 1 0 0.1
Finland 24 2 13 4 0.5
France 194 85 41 470 29.5
Germany 500 160 268 465 44.1
Greece 48 21 4 66 0.7
Hungary 9 4 8 20 0.1
Ireland 55 15 13 54 0.8
Italy 124 61 23 221 2.3
Latvia 14 5 2 10 0.3
Lithuania 8 3 2 9 0.1
Luxembourg 11 0 8 0 0.6
Malta 10 3 1 7 0.0
Netherlands 56 20 24 57 4.0
Poland 64 34 7 112 0.3
Portugal 45 18 12 68 0.6
Romania 35 15 3 97 0.1
Slovakia 15 6 3 14 0.4
Slovenia 9 1 3 1 0.1
Spain 143 73 24 411 5.5
Sweden 49 8 19 35 3.4
United Kingdom 240 115 84 556 23.5
EU and UK 1995 729 662 2854 131

 15
Figure 7. Scatter plot of reported and modelled damage.

A1.5 Impact modelling
The wind risk assessment is based on the combination of the hazard, exposure and vulnerability. For the baseline
(1981-2010) and 30-year time windows around the warming levels, the pixel-median wind return period was
derived. Using the damage function and mortality rates, the return periods were combined with the layers of
total construction and population to obtain the corresponding economic loss, people exposed and number of
fatalities. The country expected annual damage, expected annual population exposed and fatalities for the
baseline and at the global warming levels was obtained by summing the values over all grid cells in each
country.

 16
Annex 2. Additional results

Table 5. Macro-regional percentages of the area for which the projected 10- and 100-year daily maximum wind speed is
smaller (-) or larger (+) at a global warming level period compared to the baseline period (1981-2010). No change (=) means
that the median change is below 0.3 m/s. If at least two thirds of the simulations agree on the sign of change, it is considered
robust (r). CW is for central-western, N for northern, E for eastern, and S for southern Europe.

 Indicator 10-year event 100-year event
 Reg/Period 1.5°C 2°C 3°C 1.5°C 2°C 3°C
 +r 2.2 3.4 9.1 2.5 3.1 10.4
 + 24.0 24.8 25.6 30.7 31.6 31.2
 N EU = 40.0 36.1 27.7 30.7 27.9 18.5
 - 23.9 22.0 22.1 27.9 25.3 26.1
 -r 9.9 13.7 15.5 8.2 12.0 13.8
 +r 2.0 2.1 3.0 2.0 2.3 4.4
 + 25.6 29.2 23.6 26.6 29.8 25.9
 CW EU = 44.3 42.1 28.2 30.9 29.7 16.9
 - 22.4 18.1 25.1 32.4 26.6 28.5
 -r 5.7 8.5 20.0 8.0 11.6 24.3
 +r 1.6 1.4 4.3 2.0 1.8 8.6
 + 19.7 20.8 21.8 28.1 29.2 28.0
 E EU = 50.5 49.2 35.8 34.9 34.6 21.1
 - 16.6 16.9 19.1 23.3 23.1 25.5
 -r 11.6 11.7 19.0 11.8 11.3 16.7
 +r 11.4 7.2 12.8 12.5 7.7 16.7
 + 25.5 23.1 20.5 33.0 32.6 28.3
 S EU = 39.3 38.8 27.9 27.7 27.6 17.1
 - 20.3 22.7 25.1 23.1 24.3 25.6
 -r 3.6 8.2 13.8 3.7 7.8 12.3
 +r 3.9 3.0 6.4 4.3 3.2 9.6
 + 23.0 23.4 22.4 29.8 30.4 28.4
 EUROPE = 44.7 42.6 30.9 31.4 30.4 18.8
 - 20.3 20.6 22.9 26.1 25.6 27.1
 -r 8.1 10.4 17.3 8.4 10.3 16.2

 17
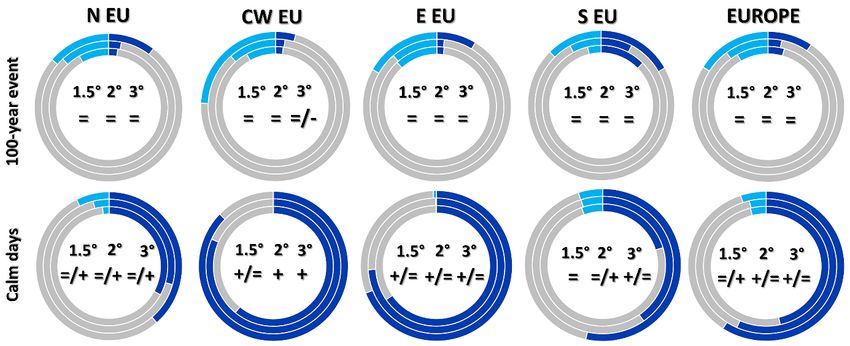
Figure 8. Macro-regional changes compared to baseline in the total number of calm days (daily maximum wind speed 20.7) for different warming levels. Shown are percentages of the
area with changes in calm and stormy days that are negligible (ensemble median change 5 days but 5 days and ≥2/3 models agree on sign of change, dark red and blue). Inner (outer) circle represents 1.5°C (3°C)
warming.

 18
Table 6. Projected ensemble median Expected Annual Damage (EAD, expressed in % relative to the GDP) for baseline (1981-
2010) and warming levels for the alternative economic scenarios.

 Base society 2050 society 2100 society
 Country base 1.5°C 2.0°C 3.0°C 1.5°C 2.0°C 1.5°C 2.0°C 3.0°C
 Austria 0.04 0.04 0.05 0.04 0.04 0.04 0.03 0.03 0.03
 Belgium 0.03 0.03 0.03 0.03 0.03 0.03 0.02 0.02 0.02
 Bulgaria 0.08 0.08 0.07 0.09 0.06 0.05 0.05 0.05 0.06
 Cyprus 0.04 0.04 0.04 0.03 0.04 0.04 0.03 0.03 0.03
 Croatia 0.07 0.06 0.07 0.08 0.05 0.06 0.04 0.05 0.06
 Czechia 0.06 0.05 0.05 0.06 0.04 0.04 0.03 0.03 0.04
 Denmark 0.04 0.03 0.04 0.03 0.03 0.03 0.02 0.03 0.02
 Estonia 0.08 0.07 0.06 0.05 0.06 0.05 0.05 0.04 0.04
 Finland 0.06 0.06 0.06 0.06 0.05 0.05 0.04 0.04 0.04
 France 0.03 0.04 0.04 0.04 0.03 0.03 0.02 0.02 0.03
 Germany 0.03 0.03 0.03 0.03 0.03 0.03 0.02 0.02 0.03
 Greece 0.04 0.03 0.03 0.03 0.03 0.03 0.02 0.02 0.02
 Hungary 0.06 0.06 0.07 0.08 0.05 0.05 0.04 0.04 0.05
 Ireland 0.05 0.05 0.05 0.04 0.04 0.04 0.03 0.03 0.02
 Italy 0.04 0.03 0.03 0.04 0.03 0.03 0.03 0.03 0.03
 Latvia 0.07 0.06 0.06 0.06 0.05 0.05 0.04 0.04 0.04
 Lithuania 0.07 0.07 0.07 0.06 0.05 0.06 0.04 0.05 0.04
 Luxembourg 0.04 0.03 0.04 0.04 0.02 0.03 0.02 0.02 0.02
 Malta 0.04 0.06 0.05 0.03 0.07 0.06 0.06 0.05 0.03
 Netherlands 0.03 0.03 0.03 0.03 0.02 0.02 0.02 0.02 0.02
 Poland 0.06 0.05 0.06 0.05 0.04 0.04 0.04 0.04 0.04
 Portugal 0.03 0.04 0.03 0.04 0.04 0.03 0.03 0.03 0.03
 Romania 0.06 0.07 0.07 0.08 0.05 0.05 0.04 0.04 0.05
 Slovakia 0.06 0.06 0.06 0.08 0.05 0.05 0.04 0.04 0.05
 Slovenia 0.07 0.07 0.07 0.08 0.06 0.06 0.05 0.05 0.05
 Spain 0.03 0.03 0.03 0.03 0.03 0.03 0.03 0.02 0.03
 Sweden 0.05 0.05 0.05 0.05 0.04 0.04 0.03 0.03 0.03
 United Kingdom 0.03 0.03 0.03 0.03 0.03 0.03 0.02 0.02 0.02
 EU and UK 0.04 0.04 0.04 0.04 0.03 0.03 0.03 0.03 0.03

 19
Table 7. Projected ensemble median Expected Annual Fatalities (EAF) for baseline (1981-2010) and warming levels for the
alternative economic scenarios.

 Base economy Economy 2050 Economy 2100
Country base 1.5°C 2.0°C 3.0°C 1.5°C 2.0°C 1.5°C 2.0°C 3.0°C
Austria 1 1 1 1 1 1 1 1 1
Belgium 1 1 1 1 2 2 2 2 2
Bulgaria 0 0 0 1 0 0 0 0 0
Cyprus 0 0 0 0 0 0 0 0 0
Croatia 0 0 0 0 0 0 0 0 0
Czechia 0 0 0 0 0 1 0 0 0
Denmark 1 1 1 1 1 1 1 1 1
Estonia 0 0 0 0 0 0 0 0 0
Finland 0 0 0 0 0 0 0 0 0
France 13 13 12 12 15 14 16 15 15
Germany 13 12 12 12 11 11 10 10 9
Greece 2 2 2 2 1 1 1 1 1
Hungary 1 1 1 1 1 1 0 0 1
Ireland 1 2 1 1 2 2 2 2 2
Italy 6 6 6 6 7 6 6 6 6
Latvia 0 0 0 0 0 0 0 0 0
Lithuania 0 0 0 0 0 0 0 0 0
Luxembourg 0 0 0 0 0 0 0 0 0
Malta 0 0 0 0 0 0 0 0 0
Netherlands 2 1 1 1 2 2 2 2 1
Poland 3 3 3 3 3 3 2 2 2
Portugal 2 2 2 1 2 1 1 1 1
Romania 3 3 3 3 2 2 2 2 2
Slovakia 0 0 0 0 0 0 0 0 0
Slovenia 0 0 0 0 0 0 0 0 0
Spain 11 12 10 10 11 10 10 9 8
Sweden 1 1 1 1 1 1 1 1 1
United Kingdom 15 16 16 15 19 19 21 21 20
EU and UK 77 78 75 74 80 79 76 74 73

 20
References
Barredo, J. I. (2010). No upward trend in normalised windstorm losses in Europe. Nat. Hazards Earth Syst. Sci,
10, 97-104.
Berz, G. (2005). Windstorm and storm surges in Europe: loss trends and possible counter-actions from the
viewpoint of an international reinsurer. Philosophical Transactions of the Royal Society A: Mathematical, Physical
and Engineering Sciences, 363(1831), 1431-1440.
Cavicchia, L., von Storch, H., & Gualdi, S. (2014). A long-term climatology of medicanes. Climate dynamics, 43(5-
6), 1183-1195.
Ciscar, J.C., Mongelli, I., Szewczyk, W., 2017. ‘PESETA III: Task 2 - Socioeconomic scenarios dataset’, Technical
Report, European Commission.
Cronin, J., Anandarajah, G., & Dessens, O. (2018). Climate change impacts on the energy system: a review of
trends and gaps. Climatic change, 151(2), 79-93.
Della Marta, P. M., Mathis, H., Frei, C., Liniger, M. A., Kleinn, J., & Appenzeller, C. (2009). The return period of wind
storms over Europe. International Journal of Climatology, 29(3), 437-459.
EEA (2017). Economic losses from climate-related extremes. Available at: https://www.eea.europa.eu/data-and-
maps/indicators/direct-losses-from-weather-disasters-3/assessment-1
European Commission (EC). (2015). The 2015 Ageing Report: Economic and budgetary projections for the 28
EU Member States (2013-2060). European Economy 3, May 2015, Brussels. PDF. 424pp. Tab. Graph. Free. doi:
10.2765/877631 (online)
Eyring, V., Bony, S., Meehl, G. A., Senior, C. A., Stevens, B., Stouffer, R. J., & Taylor, K. E. (2016). Overview of the
Coupled Model Intercomparison Project Phase 6 (CMIP6) experimental design and organization. Geoscientific
Model Development (Online), 9(LLNL-JRNL-736881).
Feser, F., Barcikowska, M., Krueger, O., Schenk, F., Weisse, R., & Xia, L. (2015). Storminess over the North Atlantic
and northwestern Europe—A review. Quarterly Journal of the Royal Meteorological Society, 141(687), 350-382.
Foreman, T. M. (2018). The Effects of Dust Storms on Economic Developments. PDF available online at:
https://pdfs.semanticscholar.org/e0e8/72143d8119fb616455bac626fa9cc47caca0.pdf?_ga=2.85059856.864
499091.1568807379-1888540279.1567422695. Last accessed on September 9, 2019.
Formetta, G., & Feyen, L. (2019). Empirical evidence of declining global vulnerability to climate-related hazards.
Global Environmental Change, 57 doi:10.1016/j.gloenvcha.2019.05.004.
Forzieri, G., Feyen, L., Russo, S., Vousdoukas, M., Alfieri, L., Outten, S., & Cid, A. (2016). Multi-hazard assessment
in Europe under climate change. Climatic Change, 137(1-2), 105-119.
Forzieri, G., Bianchi, A., e Silva, F. B., Herrera, M. A. M., Leblois, A., Lavalle, C., & Feyen, L. (2018). Escalating
impacts of climate extremes on critical infrastructures in Europe. Global environmental change, 48, 97-107.
Francis, J. K., & Gillespie, A. J. (1993). Relating gust speed to tree damage in Hurricane Hugo, 1989. Journal of
Arboriculture.; 19 (6): 369-373.
Hansen, M. O. L. (2015). Aerodynamics of Wind Turbines. 3rd Edition. 1 May 2015. Taylor and Francis Group,
London, DOI: https://doi.org/10.4324/9781315769981.
Hosking, J. R., & Wallis, J. R. (1987). Parameter and quantile estimation for the generalized Pareto distribution.
Technometrics, 29(3), 339-349.
Isemer, H. J., & Hasse, L. (1991). The scientific Beaufort equivalent scale: Effects on wind statistics and
climatological air-sea flux estimates in the North Atlantic Ocean. Journal of climate, 4(8), 819-836.
Jacob, D., Petersen, J., Eggert, B., Alias, A., Christensen, O. B., Bouwer, L. M., & Georgopoulou, E. (2014). EURO-
CORDEX: new high-resolution climate change projections for European impact research. Regional environmental
change, 14(2), 563-578.
Jacobs-Crisioni, C., Diogo, V., Castillo, C. P., Baranzelli, C., e Silva, F. B., Rosina, K., & Lavalle, C. (2017). The LUISA
Territorial Reference Scenario 2017: A technical description (No. JRC108163). Joint Research Centre.
Leckebusch, G. C., Weimer, A., Pinto, J. G., Reyers, M., & Speth, P. (2008). Extreme wind storms over Europe in
present and future climate: a cluster analysis approach. Meteorologische Zeitschrift, 17(1), 67-82.

 21
Lima-Castillo, I. F., Gómez-Martínez, R., & Pozos-Estrada, A. (2019). Methodology to develop fragility curves of
glass façades under wind-induced pressure. International Journal of Civil Engineering, 17(3), 347-359.
doi:10.1007/s40999-018-0360-6.
Mentaschi, L., Vousdoukas, M., Voukouvalas, E., Sartini, L., Feyen, L., Besio, G., & Alfieri, L. (2016). Non-stationary
Extreme Value Analysis: a simplified approach for Earth science applications. Hydrol. Earth Syst. Sci. Discuss.,
doi, 10.
Moemken, J., Reyers, M., Feldmann, H., & Pinto, J. G. (2018). Future Changes of Wind Speed and Wind Energy
Potentials in EURO‐CORDEX Ensemble Simulations. Journal of Geophysical Research: Atmospheres, 123(12),
6373-6389.
Nissen, K. M., Leckebusch, G. C., Pinto, J. G., & Ulbrich, U. (2014). Mediterranean cyclones and windstorms in a
changing climate. Regional environmental change, 14(5), 1873-1890.
Pinto, J. G., Karremann, M. K., Born, K., Della-Marta, P. M., & Klawa, M. (2012). Loss potentials associated with
European windstorms under future climate conditions. Climate Research, 54(1), 1-20.
Powell, M. D., Vickery, P. J., & Reinhold, T. A. (2003). Reduced drag coefficient for high wind speeds in tropical
cyclones. Nature, 422(6929), 279.
Pryor, S. C., Barthelmie, R. J., Nikulin, G., & Jones, C. (2010). Influence of Regional Climate Model spatial resolution
on wind climates. In AGU Fall Meeting Abstracts.
Rockel, B., & Woth, K. (2007). Extremes of near-surface wind speed over Europe and their future changes as
estimated from an ensemble of RCM simulations. Climatic Change, 81(1), 267-280.
Sharkey, P., Tawn, J. A., & Brown, S. J. (2019). Modelling the spatial extent and severity of extreme European
windstorms. arXiv preprint arXiv:1906.03178.
Schelhaas, M. J., Hengeveld, G., Moriondo, M., Reinds, G. J., Kundzewicz, Z. W., Ter Maat, H., & Bindi, M. (2010).
Assessing risk and adaptation options to fires and windstorms in European forestry. Mitigation and Adaptation
Strategies for Global Change, 15(7), 681-701.
Scherb, A., Garrè, L., & Straub, D. (2019). Evaluating component importance and reliability of power transmission
networks subject to windstorms: Methodology and application to the nordic grid. Reliability Engineering and
System Safety, 191 doi:10.1016/j.ress.2019.106517.
Schwierz, C., Köllner-Heck, P., Mutter, E. Z., Bresch, D. N., Vidale, P. L., Wild, M., & Schär, C. (2010). Modelling
European winter wind storm losses in current and future climate. Climatic change, 101(3-4), 485-514.
Spinoni, J., Mentaschi, L., Formetta, G., Forzieri, G., Dosio, A., Barbosa Ferreira, P., and Feyen, L. (2019). Wind
projections over European emerged lands. EMS Annual Meeting Abstracts, Vol. 19, EMS2019-527, 2019.
Tobin, I., Vautard, R., Balog, I., Bréon, F. M., Jerez, S., Ruti, P. M., & Yiou, P. (2015). Assessing climate change
impacts on European wind energy from ENSEMBLES high-resolution climate projections. Climatic Change,
128(1-2), 99-112.
Vautard, R., Thais, F., Tobin, I., Bréon, F. M., De Lavergne, J. G. D., Colette, A., & Ruti, P. M. (2014). Regional climate
model simulations indicate limited climatic impacts by operational and planned European wind farms. Nature
communications, 5, 3196.
Wang, C., Zhang, L., Lee, S. K., Wu, L., & Mechoso, C. R. (2014). A global perspective on CMIP5 climate model
biases. Nature Climate Change, 4(3), 201.

 22
You can also read