Disclosure report 2015 - the first global account of climate action from leading states, provinces and regions - Umweltministerium Baden ...

Page created by Jimmy Brewer
 
CONTINUE READING
Disclosure report 2015 - the first global account of climate action from leading states, provinces and regions - Umweltministerium Baden ...
Disclosure Report 2015
   The first global account of climate action from leading
   states, provinces and regions
   Brought to you by                   Data powerEd by

founding partners:                       supported by:
Disclosure report 2015 - the first global account of climate action from leading states, provinces and regions - Umweltministerium Baden ...
Compact of states and regions | Disclosure Report 2015   1                                                        2    Compact of states and regions | Disclosure Report 2015

                                                                                            Contents    Foreword
Foreword                                                                                           2    A new global agreement on climate change will be adopted in Paris in December 2015. Unprecedented climate action
                                                                                                        at all levels of government and in the community over the past years has led to us being in this position where we can
Reporting governments at a glance                                                                  3    secure a more prosperous, sustainable and equitable world.
1. Tackling climate change region by region                                                        6    It has been a privilege for Québec, Basque Country and South Australia to lead state and regional governments as part of
   Driving climate action through the Compact of States and Regions                                6    this global effort on climate change.
                                                                                                        Our Compact of States and Regions brings together the contributions of 44 sub-national governments from around
   A year of change                                                                                8
                                                                                                        the world. Together we represent more than 325 million citizens and one eighth of the global economy. Through the
2. State and regional climate pledges                                                              12   Compact, hundreds of individual climate commitments and actions have been put forward from governments.
   Greenhouse gas emission reduction targets                                                       12   These governments include states that rival some of the largest and most industrialized nations in the world, as well as
                                                                                                        rural areas and territories already heavily affected by climate change.
   Greenhouse gas emissions savings                                                                17
                                                                                                        We all have different local circumstances and challenges to address, but through the Compact we demonstrate our
   Progress toward greenhouse gas reduction targets                                                19   collective commitment to climate action.
   Renewable energy targets                                                                        21   As state and regional governments, we have responsibility for key policy levers in the delivery of both climate change
                                                                                                        mitigation and adaptation. Through the implementation of our policies, the administration of our budgets and the
   Renewable power trends to date                                                                  24   legislation we pass, we provide a bridge between both international and national objectives, and delivery at the city and
   Energy efficiency targets                                                                       25   local government levels.
                                                                                                        And our leadership is needed now more than ever. We know the national climate plans submitted ahead of the Paris
3. Climate risk and adaptation                                                                     30   talks – the Intended Nationally Determined Contributions (INDCs) – are not sufficient to limit global temperature rise to
   Physical, social and economic risk                                                              30   below two degrees Celsius. But states, provinces and regions can support this global effort by raising our own levels of
                                                                                                        ambition.
   Adaptation plans and action                                                                     32
                                                                                                        For many years, we have been at the forefront of climate leadership by setting ambitious climate and clean energy
4. Beyond a Paris climate deal: opportunities for low carbon growth                                34   targets, and developing new and innovative policy responses. Through the Compact of States and Regions, we
                                                                                                        demonstrate the breadth of our collective commitments and scale of our potential impact.
   The economic rewards of effective climate action                                                36
                                                                                                        Many of us already have bold near term targets by 2020. But it is crucial we raise ambition before any new Paris climate
   Leading a low carbon future                                                                     38   deal comes into force. The Compact will help us achieve this by providing an annual assessment of progress made
List of figures                                                                                    39   toward our climate commitments and emission reduction targets.
                                                                                                        And this is just the beginning. Through the public disclosure of our mitigation and adaptation actions, we can measure
List of tables                                                                                     39
                                                                                                        and manage our achievements within our local and regional contexts. We will also provide a global overview of the
Acknowledgements                                                                                   40   trends, challenges and opportunities for collaboration across nations and regions.
                                                                                                        Our vision is that all governments in all parts of the world have access to high quality information, so that we can
                                                                                                        effectively manage our individual and collective responses to the global climate challenge.
                                                                                                        On behalf of all Compact governments, we invite our state and regional counterparts around the world to join us and
                                                                                                        report to the Compact of States and Regions in 2016 and far beyond – to secure a smarter, cleaner, safer future for all.

                                                                                                        Philippe Couillard, Premier of Québec
                                                                                                        Iñigo Urkullu, President of the Basque Country
                                                                                                        Jay Weatherill, Premier of South Australia
Disclosure report 2015 - the first global account of climate action from leading states, provinces and regions - Umweltministerium Baden ...
Compact of states and regions | Disclosure Report 2015   3                                                                                  4   Compact of states and regions | Disclosure Report 2015

Reporting governments at a glance
States, provinces and regions included in this report

State or regional     Country              Head of government                      Land area (km2)   Population   GDP (US$)           State or regional   Country         Head of government                    Land area (km2)     Population   GDP (US$)
government                                                                                                                            government
Alberta               Canada               Premier Rachel Notley                   661,848           4,175,409    328,000,000,000     Midi-Pyrénées       France          President Martin Malvy                45,348              2,926,592    90,000,000,000
Aquitaine             France               President Alain Rousset                 41,300            3,303,000    101,534,850,000     Minas Gerais        Brazil          Governor Fernando Damata              586,520             20,734,097   144,101,123,595
Australian Capital    Australia            Chief Minister Andrew Barr              2,358             385,996      27,448,000,000                                          Pimentel
Territory                                                                                                                             New York            United States   Governor Andrew Cuomo                 121,883             19,510,000   1,230,000,000,000
Baden-Württemberg     Germany              Minister-President Winfried             36,000            10,500,000   450,000,000,000     New-Caledonia       New-Caledonia President Philippe Germain              18,575              268,767      7,875,000,000
                                           Kretschmann
                                                                                                                                      Newfoundland and    Canada          Premier Paul Davis                    405,212             527,000      27,000,000,000
Basque Country        Spain                President Iñigo Urkullu                 7,234             2,172,877    71,815,577,650
                                                                                                                                      Labrador
Bavaria               Germany              Minister-President Horst Seehofer       70,549            12,600,000   582,599,000,000
                                                                                                                                      North Rhine-        Germany         Minister-President Hannelore Kraft 34,110                 17,540,000   624,700,000,000
British Columbia      Canada               Premier Christy Clark                   944,735           4,631,300    188,150,735,000     Westphalia
Brittany              France               President Pierrick Massiot              27,208            3,273,343    95,000,000,000      Northwest           Canada          Premier Robert McLeod                 1,183,085           43,234       3,295,485,200
California            United States        Governor Edmund G. Brown Jr.            423,470           38,800,000   2,200,000,000,000   Territories
Carinthia             Austria              Governor Dr. Peter Kaiser               9,536             556,637      19,485,378,250      Ontario             Canada          Premier Kathleen Wynne                1,076,000           13,678,740   652,271,000,000
Catalonia             Spain                President Artur Mas i Gavarró           32,107            7,518,903    226,328,650,000     Oregon              United States   Governor Kate Brown                   255,026             3,970,329    219,600,000,000
Connecticut           United States        Governor Dannel Malloy                  12,997            3,644,545    253,036,000,000     Provence-Alpes-     France          President Michel Vauzelle             31,400              5,000,000    168,581,250,000
Delta State           Nigeria              Executive Governor Dr. Ifeanyi Okowa    18,213            4,112,445    16,750,000,000      Côte d’Azur
Drenthe               Netherlands          King’s Commissioner Jacques             2,639             488,600      13,500,000,000      Québec              Canada          Premier Philippe Couillard            1,667,712           8,214,672    272,439,000,000
                                           Tichelaar
                                                                                                                                      Rhône-Alpes         France          President Jean-Jack Queyranne         43,698              6,393,500    211,300,000,000
Emilia-Romagna        Italy                President Stefano Bonaccini             22,453            4,457,115    154,976,610,291
                                                                                                                                      Rio de Janeiro      Brazil          Governor Luiz Fernando de Souza       43,778              16,461,173   192,024,212,087
Jalisco               Mexico               Governor Jorge Aristóteles Sandoval     126,497           7,350,682    57,888,000,000
                                           Díaz                                                                                       São Paulo           Brazil          Governor Geraldo Alckmin Filho        248,223             44,035,304   721,300,000,000

Jammu and Kashmir     India                Chief Minister Mufti Mohammad           101,387           12,548,926   13,730,000,000      Scotland            United Kingdom First Minister Nicola Sturgeon         78,772              5,300,000    200,000,000,000
                                           Sayeed                                                                                     South Australia     Australia       Premier Jay Weatherill                983,482             1,688,700    78,184,811,460
Jämtland              Sweden               County Commissioner Robert Uitto        34,009            127,000      5,000,000,000       Valencia            Spain           President Ximo Puig          Renewable 23,254             5,113,815    114,599,315,700
                                                                                                                                                                                                       electricity
KwaZulu-Natal         South Africa         Premier Edward Senzo Mchunu             94,361            10,267,300   37,000,000,000      Vermont             United States   Governor Peter Shumlin                24,906              626,138      27,100,000,000
La Réunion            France               President Didier Robert                 2,500             840,974      19,750,000,000
                                                                                                                                      Wales               United Kingdom First Minister Carwyn Jones            20,761              3,082,412    22,000,000,000
Laikipia County       Kenya                Governor Joshua Irungu                  9,462             420,000      546,000,000
                                                                                                                                      Washington          United States   Governor Jay Inslee                   176,477             7,061,153    324,200,000,000
Lombardy              Italy                President Roberto Maroni                23,864            9,973,397    372,230,000,000
                                                                                                                                      Yucatán             Mexico          Governor Rolando Zapata Bello         39,524              1,955,577    11,802,011,314
Manitoba              Canada               Premier Greg Selinger                   649,947           1,272,000    61,323,000,000
Disclosure report 2015 - the first global account of climate action from leading states, provinces and regions - Umweltministerium Baden ...
Compact of states and regions | Disclosure Report 2015   5                                                    6      Compact of states and regions | Disclosure Report 2015

                                                                                                          1   Tackling climate change region by region
                                                                                                              Driving climate action through the Compact of States and Regions
                                                                                                              The global transition to a thriving low carbon economy is underway. This year GDP growth decoupled
                                                                                                              from emissions for the first time. While the world’s economies grew on average by 3.3%, emissions
                                                                                                              increased by 0.5%, leading to a record-breaking fall in carbon intensity of 2.7%.1 This milestone
                                                                                                              reflects the accelerated global momentum on climate action leading up to and throughout 2015; from
                                                                                                              G7 countries agreeing to phase out fossil fuel emissions by the end of the century to Pope Francis
                                                                                                              calling on leaders to urgently act on climate change.
                                                                                                              But it isn’t just world leaders driving this change. The world’s most influential companies are
                                                                                                              committing to procure 100% of their electricity from renewable sources.2 Investors are divesting
                                                                                                              trillions of dollars of assets from fossil fuels3. And today the scale of climate actions from city, state,
                                                                                                              provincial and regional governments is unprecedented.
                                                                                                              State, provincial and regional governments in particular have long risen to the climate challenge
                                                                                                              despite sometimes being overlooked by national leaders, academics and the media. This report brings
                                                                                                              their leadership into the spotlight. Through the Compact of States and Regions, we can reveal that
                                                                                                              44 governments, spanning 18 different countries across six continents have reported their climate
                                                                                                              commitments and GHG inventories for the first time.
                                                                                                              These state and regional governments are a force to be reckoned with. Together they represent
                                                                                                              more than 325 million people and over US$10.5 trillion in GDP. That is one eighth of the global
                                                                                                              economy. Of these 44 reporting governments, 37 have a state-wide GHG inventory4 and a public
                                                                                                              emissions reduction target. Seven governments have joined the Compact of States and Regions as
                                                                                                              ‘observers’, committing to develop a GHG target and inventory within a two year timeframe5. The
                                                                                                              potential collective emissions saving through the Compact represents one of the most significant
                                                                                                              commitments in the world ahead of COP21. But the Compact doesn’t stop in Paris. It also provides a
                                                                                                              platform for governments to increase their ambition and report climate data far beyond 2015.
    What is the Compact of States and Regions?
                                                                                                              Using data disclosed directly to the Compact of States and Regions, this report paints the first-ever
    The Compact of States and Regions is an initiative that provides a transparent, global picture            picture of the contribution to global GHG emissions reductions by state and regional governments.
    of efforts to tackle climate change from state and regional governments. Announced at the UN              Chapter 2 of this report provides an assessment of the pledged emissions savings in the long and
    Climate Summit in New York in 2014, the Compact of States and Regions is supported by the United          short term. While disclosing GHG emissions targets is a mandatory requirement as part of reporting
    Nations and was launched by The Climate Group, CDP, R20 and nrg4SD.                                       to the Compact, many states, provinces and regions also disclosed the climate measures, economic
                                                                                                              opportunities and adaptation actions that underpin their climate strategies. Chapters 3 and 4 give a
    The Compact of States and Regions is the first dedicated reporting mechanism for states,                  flavor of the vast amount of additional data that has been disclosed to the Compact.
    provinces and regions, showcasing and analyzing their climate efforts. Through an annual
    assessment, state and regional governments are able to measure their emissions and set
    ambitious reduction goals, while acknowledging their different capabilities and circumstances.
    To join the Compact, governments must:
              1. Make a public commitment to reduce greenhouse gas (GHG) emissions.
              2. Publicly report a standard set of GHG inventory data on an annual basis.
    Governments without existing GHG reduction targets and inventories can “observe” the Compact
    by stating their intent to develop a GHG target and inventory within two years. They are also
    encouraged to submit existing data to a recognized reporting platform on an annual basis, to build
    the capacity needed to eventually develop an inventory. Disclosure and assessment of progress
    will take place each year through an annual disclosure report.                                            1 PWC, ‘Conscious Uncoupling? Low Carbon Economy Index’, in PWC. October 2015, http://www.pwc.co.uk/services/sustainability-climate-
                                                                                                              change/insights/low-carbon-economy-index-2015-download-section.html.
    The Compact is a critical part of the post-Paris agenda of action by Non-State Actors, so all state       2 RE100, ‘Companies’, http://there100.org/companies, 2015
                                                                                                              3 Carrington, D. Howard, E, ‘Institutions worth $2.6 trillion have now pulled investments out of fossil fuels’, The Guardian, 22 September
    and regional governments are invited to join and begin reporting in 2016.                                 2015, http://www.theguardian.com/environment/2015/sep/22/leonardo-dicaprio-joins-26tn-fossil-fuel-divestment-movement.
                                                                                                              4 The Compact of States and Regions accepted GHG emissions inventories dating back to 2010.
                                                                                                              5 Delta State, Jammu and Kashmir, KwaZulu-Natal, Laikipia County, New Caledonia, Valencia and Yucatan. Five observing governments
                                                                                                              already have either a sector-specific emissions reduction target and/or an emissions inventory that is sector-wide or dates from before
                                                                                                              2010.
Disclosure report 2015 - the first global account of climate action from leading states, provinces and regions - Umweltministerium Baden ...
Compact of states and regions | Disclosure Report 2015                              7                                                                                               8                              Compact of states and regions | Disclosure Report 2015

Figure 1: Governments reporting to the Compact of States and Regions in 2015                                                                                                                                                             Figure 2: Projected GHG savings to 2050

       Alberta                                                                                                                                                                                                                                                          3.5
                                                                                            Basque Country
       British Columbia                                                                                                                                                                          By 2050, these governments will
                                                                     Scotland               Catalonia                          Baden-Württemberg                                                                                                                        3.0
       Manitoba                                                                                                                                                                                  have reduced their annual emissions
                                                                     Wales                  Valencia*                          Bavaria                    Midi-Pyrénées                                                                                                                            19% reduction

                                                                                                                                                                                                                                         Total GHG emissions (GtCO2e)
       Newfoundland and Labrador                                                                                               North Rhine-Westphalia
                                                                                                                                                                                                 from 2.81 GtCO2e to 1.28 GtCO2e,
                                                                                                                                                          Brittany                                                                                                      2.5                                           36% reduction
       Northwest Territories
                                                                                                                                                                                                 which equals an average absolute
                                                                                                  Drenthe                                                 Aquitaine
                                                                                                                                                                                                 reduction of 55%. This constitutes a                                   2.0                                                                    63% reduction
       Ontario                                                                                                                                            Rhône-Alpes                            63% reduction compared to a business
       Québec                                                                                                                           Jämtland          Provence-Alpes-Côte d'Azur             as usual scenario, which would see                                     1.5
                                                                                                                                                          New Caledonia                          emissions rise to 3.5 GtCO2e by 2050.
                                                                                                            EUROPE                                        La Réunion                                                                                                    1.0
                                                            California
                                                            New York                                     Carinthia
                                                                                                                                                    ASIA                                                                                                                0.5
       NORTH AMERICA                                        Washington                                Lombardy
                                                                                                      Emilia Romagna                                                                                                                                                    0
                                                            Oregon                                                                             Jammu and Kashmir*                                                                                                             2010    2015      2020     2025       2030   2035       2035   2040   2045       2050
                                                            Connecticut                     AFRICA
                                                            Vermont
                                                                                                                                                                                                                                                                                     GHGs under business as usual
                                                                                                                                                                                                                                                                                     GHGs under targets
       Jalisco                     SOUTH AMERICA                                         Delta State*
       Yucatan*                                                                          Laikipia County*
                                                                                                                                         OCEANIA/AUSTRALIA                                                                               Not only have state and regional governments demonstrated the political will to achieve these
                                                                                         KwaZulu Natal*
                                                                                                                                                                                                                                         substantial emissions reductions, they also have the jurisdictional power and budgets to deliver
                                                                                                                                                                                               This data is evidence of what we          them. Across the world, states and regions are leading on a breadth of actions to address climate
                                                            Minas Gerais                                                                                                                       have long understood — that               change, from large cross-border collaborations to small community interventions. British Columbia,
                                                            Rio de Janeiro                                                                                          Australian                 sub-national governments                  for example, has adopted a revenue-neutral carbon tax for the purchase or use of fossil fuels, while
                                                            São Paulo                                                                                               Capital                                                              California and Québec have established the largest regional carbon market in North America – and it
                                                                                                                                                                    Territory
                                                                                                                                                                                               have an important role to play            is now being expanded to other provinces and countries. In Brazil, Rio de Janeiro has set a state-wide
*Observer to the Compact of States and Regions
                                                                                                                                                                    South Australia            in reducing greenhouse gas                target to reduce solid waste GHG emissions.
                                                                                                                                                                                               emissions, combatting climate             In India, the state of Jammu and Kashmir is dedicated to developing renewable energy and providing
While limiting temperature rise to below 2 degrees Celsius is a global challenge requiring global                                                                                              change and supporting the                 access to this energy in rural communities, while in Mexico, Jalisco is installing solar photovoltaic
governance, state and regional governments are racing ahead in setting ambitious GHG reduction                                                                                                                                           lamps, water pumps and air conditioning in the administrations’ buildings. The government of North
                                                                                                                                                      I wanted the Rhône-Alpes                 transition to a low carbon                Rhine-Westphalia in Germany is boosting combined heat and power development with a funding
goals – with potentially huge impacts.
                                                                                                                                                 region to join the Compact of                 economy. As we approach COP21,            program amounting to €250 million (US$270 million).
Governments reporting to the Compact of States and Regions currently represent 2.81GtCO2e in
annual emissions6. Through their reported GHG emissions reduction commitments, we estimate total                                                   States and Regions, because                 sub-national governments are              The Compact provides a tool for analyzing these and the many other policies and measures being
cumulative savings7 of:                                                                                                                              the history of our climate                taking the opportunity to learn           implemented at the state and regional level.

                                                                                                                                                  now writes itself at the sub-                from one another so we can
• 3 GtCO2e by 2020, which is more than the combined annual GHG emissions of the UK,                                                                   national level. Countries                advance our shared priorities
    Germany and Japan in 2012;
                                                                                                                                                         sign treaties, but it is              and make real progress on this
• 12.4 GtCO2e by 2030, more than the combined GHG emissions of the US and EU, or China                                                             regional governments who,                   urgent and critical issue.
    alone in 2012; and                                                                                                                               through their actions and                 - Kathleen Wynne, Premier, Ontario
• 47.4 GtCO2e by 2050, equalling world GHG emissions in 2012.                                                                                      contributions, play a major
                                                                                                                                                role each day to tackle climate
                                                                                                                                                                        change.
                                                                                                                                               - Jean-Jack Queyranne, President, Rhône-Alpes

6 Compact ‘observers’ account for 2% of this figure. Further analysis in Chapter 2 is based on the emissions from those 37 states, provinces
and regions that have fulfilled all Compact requirements (2.74 Gt CO2e).
7 When compared to a business as usual scenario. For information about the methodology, please see chapter 2 “State and regional climate
pledges”.
Compact of states and regions | Disclosure Report 2015                             9                                                 10   Compact of states and regions | Disclosure Report 2015

                                                                                                                                                                                                             To make a difference on climate change,
                                                                                                                                                                                                             sub-national governments must work
A year of change
                                                                                                                                                                                                             together and lead by example. The Compact
Since the launch of the Compact of States and Regions in 2014, state and regional governments
have not been alone in bringing forward their climate commitments. At the time of publishing, over
                                                                                                                                                With a challenge as serious                                  of States and Regions is significant because
150 countries have submitted their post-2020 emission reduction pledges, or Intended Nationally                                                    as climate change and an                                  it recognizes the critical role that sub-
Determined Contributions (INDCs) to the United Nations Framework Convention on Climate Change                                                        opportunity as great as                                 national governments play in moving the
(UNFCCC)8. These climate plans come from both developed and developing countries, and in total
                                                                                                                                               green growth, I believe there                                 dial on climate action globally. In B.C.,
cover over 86% of global emissions.
                                                                                                                                                  is a fundamental need for                                  we have been leading by example since
Including submissions from the world’s biggest emitters – China, US, the EU member states,
India, Russia and Japan – together the INDCs could limit the forecast temperature rise to around                                                   transparency and people                                   2008, when we introduced North America’s
2.7 degrees Celsius by 21009. While this is not sufficient to avoid dangerous climate change, it is                                                  should know how their                                   first and only broad-based, revenue-
significantly lower than previous estimates. Countries could also be asked to increase the ambition of
                                                                                                                                                  government and different                                   neutral carbon tax, and this spring we
their pledges in the future.
                                                                                                                                                sectors are delivering. I am
                                                                                                                                                                                                             celebrated our fifth year of carbon
This new bottom-up process meant that for the first time, other countries, observers and climate                                                                                                             neutrality across our public sector – a
                                                                                                                                                therefore delighted to have
organizations could review proposed commitments ahead of the COP, to assess the remaining                                                                                                                    unique achievement in North America. We
emissions gap and degree of global warming. This evolution of global governance is a victory for                                                    reported on our carbon                                   recognize that we can’t win the battle
transparency.                                                                                                                                 emissions, demonstrating our
Transparency is at the heart of the Compact of States and Regions. Publicly disclosing climate data
                                                                                                                                                                                                             against climate change on our own, but by
                                                                                                                                                commitment to the Compact                                    making strong commitments that reduce
unleashes more informed discussion, increased ambition and greater responsibility to citizens,
which undoubtedly leads to lower emissions. And the impact of the Compact of States and Regions is                                                  of States and Regions as                                 our emissions while growing our economy,
already clear from the overwhelming global response it has received.                                                                               part of the international                                 and by reporting our progress through the
• A total of 77 emissions reduction targets were reported, with target years varying from 2018 to                                           contribution from sub-national                                   platform provided by Compact of States
  2060.                                                                                                                                                        governments.                                  and Regions, we can send the signal that
• Emission reduction targets with ambition levels of up to 90% by 2050 and 100% by 2060, show
                                                                                                                                                  - Carl Sargeant, Minister for Natural                      climate action must become the priority
  recognition of the importance of a long-term decarbonization pathway.
                                                                                                                                                        Resources, Welsh Government                          for the rest of the globe.
• Almost 50% of reporting governments already have a target in place with a timeline beyond
  2035.                                                                                                                                                                                                      - Mary Polak, Minister of Environment, British Columbia
• 66% of governments reported a renewables target, while 70% disclosed their energy efficiency
  goal.
• In total, 348 climate actions were reported to underpin the climate targets.
• Energy efficiency in buildings tops the list of implemented climate measures for many
  governments.
• Climate actions in relation to transport and energy are widespread, while waste and agriculture
  were identified as areas for further action.
• 27 governments reported that they have a dedicated climate adaptation plan in place.

8 UNFCCC, ‘INDCs as communicated by Parties’, http://www4.unfccc.int/submissions/indc/Submission%20Pages/submissions.aspx,
October 2015.
9 UNFCCC, ‘Synthesis report on the aggregate effect of the intended nationally determined contributions’, http://unfccc.int/resource/
docs/2015/cop21/eng/07.pdf, 30 October 2015.
Compact of states and regions | Disclosure Report 2015          11                                                               12     Compact of states and regions | Disclosure Report 2015

Baden-Württemberg’s 50-80-90 goals
                                                                                                                                                                     2   State and regional climate pledges
In 2013 the Parliament of Baden-Wuerttemberg resolved the Act Governing the Mitigation of Climate Change in Baden-Württemberg. We are reorienting our                    In many parts of the world, setting headline targets has become the central feature of an effective
climate policy, and as one of the consequences, our energy supply. This transition is called ‘Energiewende’. Our goals for the year 2050, we express with the            strategy to tackle dangerous climate change. In many ways, the European Union set the tone back in
formula ‘50-80-90’.                                                                                                                                                      2008 by adopting a threefold energy and climate strategy seeking to go beyond the ambition of the
                                                                                                                                                                         Kyoto Protocol. In support of the EU Emissions Trading Scheme as a major pillar of the Union’s climate
50% reduction in consumption
                                                                                                                                                                         policy, the heads of state agreed to reduce domestic emissions by 20% by 2020, reach 20% renewable
Saving energy means more than simply using less energy. Electricity and heat must also be used more efficiently. That means using energy where it is really              energy in total energy consumption by 2020 and aim to save 20% of energy consumption by 2020.
needed and ensuring that none of it is wasted.                                                                                                                           Recently, the EU built on this plan by adopting a new set of targets to be achieved by 2030.
80% renewable energy                                                                                                                                                     But a successful climate strategy should go beyond setting targets and ensure that appropriate
                                                                                                                                                                         climate actions are implemented, an adaptation strategy is developed and, if possible, should include
We want 80% of the energy used in Baden-Wuerttemberg to come from renewable sources. Most electricity will come from the wind and sun, while solar
                                                                                                                                                                         climate goals in other areas of policymaking. Nevertheless, climate targets are often the backbone of
collectors, ambient heat and geothermal energy will be the main sources of heat energy. This will reduce our reliance on imported raw materials and
                                                                                                                                                                         decarbonization strategies and offer an indication of the ambition of the government in power, while
therefore Baden-Württemberg will be less affected by rising prices in the world market.
                                                                                                                                                                         giving clear signals to the public, businesses and investors.
90% reduction in greenhouse gases
                                                                                                                                                                         Through the Compact of States and Regions, we are able to study emissions reduction, energy
Our aim is to reduce energy-related greenhouse gas emissions in Baden-Württemberg by 90% by the year 2050. We aim to achieve a reduction of 25% as early                 efficiency and renewable targets from states, provinces and regions for the first time ever. The
as the year 2020.                                                                                                                                                        composition of these targets varies in many respects, such as target years, base years, and
Principles                                                                                                                                                               applicable sectors, thus making their interpretation and evaluation challenging. Nevertheless, this
                                                                                                                                                                         chapter will provide a breakdown of the variety of targets disclosed through the Compact of States
Baden-Württemberg is highly industrialized and is for that reason dependent on reliable supplies of energy. This is why we will make absolutely sure that                and Regions.
energy is available at all times. Also, electricity and heat must not be allowed to become luxuries. They both play a crucial role in private, public and economic
life and must be affordable for everyone. The state government needs and actively elicits the competence and opinion of the people who live here in Baden-               Of the 44 governments reporting to the Compact of States and Regions in 2015, 37 have a state-wide
Württemberg, as well as its associations, businesses and local authorities. We are counting on the willingness of the people to shape the energy transition              GHG inventory and a public emissions reduction target in place. The additional seven governments10
with us. Finally we want to ensure that the energy transition is compatible with a healthy environment and nature conservation.                                          are ‘observing’ the Compact, committing to develop a GHG target and inventory within a two-year
                                                                                                                                                                         timeframe. All aggregate numbers in the below analysis are based on those 37states, provinces and
                                                                                                                                                                         regions which have reported a region-wide GHG reductions target and GHG inventory – fulfilling the
                                          Franz Untersteller, Minister of the Environment, Climate Protection and the Energy Sector, Baden-Württemberg                   core Compact criteria.11
                                                                                                                                                                         The analysis includes an assessment of the potential future emissions savings that can be achieved
                                                                                                                                                                         as a result of these targets when compared with a business-as-usual scenario, as well as the
Jammu and Kashmir’s renewable energy development                                                                                                                         progress governments have made to date.

India’s Ministry of New and Renewable Energy has designated the Jammu and Kashmir Energy Development Agency (JAKEDA) to increase renewable energy                        Greenhouse gas emission reduction targets
in the State of Jammu and Kashmir. In recent years, our projects have included solar energy, mini hydro power, wind energy and biomass cooking devices.                  One of the most common climate commitments made by state and regional governments reporting
In 2010, the Ministry also launched the Jawahar Lal Nehru National Solar Mission, with the aim of establishing India as a global leader in solar energy. The             to the Compact is a region-wide GHG emissions reduction target. Region-wide targets apply to the
Jammu and Kashmir Government issued a Solar Power Policy in 2013, and based on this climate change initiative, we decided to adopt further preventive                    entire economy of a region, whereas other targets may apply to specific sectors. They are typically
management strategies for transitioning to a cleaner, more energy efficient future.                                                                                      established as an “absolute” target, meaning that the reductions are independent of other social and
                                                                                                                                                                         economic factors, or they are set as an “intensity” target, meaning that the reductions are linked to
Beyond solar, we issued a Hydro Power Policy in 2011 to electrify energy deficient areas by harnessing the state’s abundant fast running water.                          factors such as GDP and population growth. Once adopted, region-wide GHG targets give perhaps the
And wind power too, offers potential in the region. In collaboration with the National Institute of Wind Energy, in 2008-09 we installed 50-meter high wind              clearest indication of a state or region’s overall path toward decarbonization, as well as the future
masts to assess this potential. On the basis of three years’ data, a potential of 336 watts per square meter was calculated in a village in the Reasi district,          direction of its climate and energy policy.
which is enough for 8 megawatts of wind energy. Work on the proposed project will begin soon.
‘Clean cooking’ is also a focus in rural areas of the state, with devices such as biomass and solar cook stoves being introduced. In tropical areas, we have also
installed family and community-accessible biogas plants.
Many benefits have been recorded following the implementation of these projects. The state’s renewable energy sector is investment intensive, and solar
and hydro policies are expected to attract investment within the sector. And by reducing emissions the state can also earn Renewable Energy Certificates.
The growth of the clean energy sector also creates job opportunities. This will have an especially positive impact on our young people, as the state has the
highest number of unemployed youth in India.
Besides unleashing large-scale capacity for a huge chunk of both rural and urban youth, the tapping of energy from renewable resources will strengthen
the institutional infrastructure of the state. Finally, the allied sectors associated with the growth of the renewables industry both directly and indirectly
improves research and development, design, manufacturing, marketing, installation and maintenance, as well as energy supply companies, equipment
manufacturers, and regulatory bodies. The State of Jammu and Kashmir’s decision to invest in a low carbon future is set to bring many more benefits for all.

                                                                                       Shafat Sultan, Chief Executive Officer of JAKEDA, Jammu and Kashmir
                                                                                                                                                                         10 Delta State, Jammu and Kashmir, KwaZulu-Natal, Laikipia County, New Caledonia, Valencia and Yucatan.
                                                                                                                                                                         11 Unless otherwise specified.
Compact of states and regions | Disclosure Report 2015    13                                                                           14     Compact of states and regions | Disclosure Report 2015

Table 1: Region-wide GHG reduction targets

 Government                                            Base year                 GHG reduction target GHG reduction    GHG reduction target   Government                        Base year                         GHG reduction target GHG reduction                                       GHG reduction target
                                                                                 by 2020              target by 2030   by 2050                                                                                    by 2020              target by 2030                                      by 2050
 Absolute targets                                                                                                                             North Rhine-Westphalia            1990                              25%                                                                      80%
 Australian Capital Territory                          1990                      40%                                   80%12                  Northwest Territories             2005                                                                       NA20
 Aquitaine                                             1990                      20%                                                          Ontario                           1990                              15%                                      37%                             80%
 Baden-Württemberg                                     1990                      25%                                   90%                    Oregon                            1990                              10%                                                                      75%
 Basque Country                                        2005                                                   40%      80%                    Provence-Alpes-Côte d’Azur        2007                              20%                                      35%
 British Columbia                                      2007                      33%                                   80%                    Québec                            1990                              20%
 Brittany                                              2005                      17%                                   52%                    Rhône Alpes                       1990                              29%                                                                      75%
 California                                            1990                      NA13                         40%      80%                    São Paulo                         2005                              20%
 Carinthia                                             2005                      16%14                                                        Scotland                          1990                              42%                                                                      80%
 Catalonia                                             2005                      25%                                                          South Australia                   1990                                                                                                       60%
 Connecticut                                           199015                    10%                                   80%                    Vermont                           1990                                                                       50%21                           75%
 Drenthe                                               1990                      20%                                   90%16                  Wales                             1990                              40%                                                                      80%
 Emilia-Romagna                                        1990                      20%17                                                        Washington                        1990                              NA22                                     25%23                           50%
 Jalisco                                               2010                                                   30%      50%                    Intensity targets
 Jämtland                                              1990                      50%                          100%                            Bavaria                           Reduce GHG emissions per capita to below 2 tons annually by 2050
 La Réunion                                            2011                      10%                                                          Rio de Janeiro                    Reduce GHG emissions per unit of GDP below 2005 levels by 2030
 Lombardy                                              2005                      20%18                        40%                             Business as usual targets
 Manitoba                                              2005                      15%                                                          Alberta                           BAU                               16%                                                                      50%
 Midi-Pyrénées                                         2005                      19%                                                          Minas Gerais                      BAU                                                                        25%

 New York                                              1990                                                            80%
 Newfoundland and Labrador                             199019                    10%                                   75%
                                                                                                                                               - Overall, all 37 governments have adopted a region-wide GHG reduction target (or targets).
                                                                                                                                               - 89% of governments have set an absolute target (or targets).

12 ACT also has a target of 100% below 1990 levels by 2060.
13 California has a target to return GHG emissions to 1990 levels by 2020.
14 Carinthia’s target applies to non-EU ETS emissions.
15 Connecticut’s 2050 target is based on a 2001 base year.
16 Drenthe’s targets are based on the national and EU targets.                                                                                                                              20 Northwest Territories’ target is to return GHG emissions to 2005 levels or below by 2030.
17 Emilia-Romagna’s target is based on the national target.                                                                                                                                 21 Vermont’s mid-term target year is 2028.
18 Lombardy’s target applies to non-EU ETS emissions.                                                                                                                                       22 Washington has a target to return GHG emissions to 1990 levels by 2020.
19 Newfoundland and Labrador’s 2050 target is based on a 2001 base year.                                                                                                                    23 Washington’s mid-term target year is 2035.
Compact of states and regions | Disclosure Report 2015      15                                                    16    Compact of states and regions | Disclosure Report 2015

Figure 3: Region-wide GHG reduction targets
                                                                                                           Australian Capital Territory absolute targets    Timeframes for region-wide targets:
                                                                                                           Aquitaine                                        −−76% of governments (28) reported a near-term target (i.e. 2020 or earlier);
                                                                                                           Baden-Württemberg
                                                                                                                                                            −−32% of governments (12) reported a mid-term target (i.e. 2021-2035); and
                                                                                                           Basque Country
                                                                                                           British Columbia                                 −−59% of governments (22) reported a long-term target (i.e. 2050 and beyond).
                                                                                                           Brittany
                                                                                                           California                                                   2020                               2030                               2050

                                                                                                                                                                   76%
                                                                                                           Carinthia
                                                                                                           Catalonia
                                                                                                           Connecticut
                                                                                                           Drenthe
                                                                                                           Emilia-Romagna
                                                                                                                                                                                                      32%                                59%
                                                                                                                                                                 28 governments                    12 governments                    22 governments
                                                                                                           Jalisco
                                                                                                           Jämtland                                         Based on 37 governments who reported a region-wide GHG reductions target and GHG inventory.
                                                                                                           La Réunion
                                                                                                           Lombardy                                         Range of region-wide targets:
                                                                                                           Manitoba                                         −−Near-term targets range from a 0-50% reduction, with most near-term targets (61%) in the 10-20%
                                                                                                           Midi-Pyrenees                                      reduction range. The most commonly reported near-term target is a 20% reduction below
                                                                                                           New York                                           base-year emissions.
                                                                                                           Newfoundland and Labrador                        −−Mid-term targets range from a 0-100% reduction, with most mid-term targets (55%) in the 30-40%
                                                                                                           North Rhine-Westphalia                             reduction range. The most commonly reported mid-term target is a 40% reduction below base-year
                                                                                                           Northwest Territories                              emissions.
                                                                                                           Ontario                                          −−Long-term targets range from a 50-100% reduction, with most long-term targets (64%) in the
                                                                                                           Oregon                                             70-80% reduction range. The most commonly reported long-term target is an 80% reduction below
                                                                                                           Provence-Alpes-Côte d’Azur                         base year emissions.
                                                                                                           Quebec                                           Most commonly reported absolute GHG reduction targets
                                                                                                           Rhone-Alpes
                                                                                                           São Paulo                                                    2020                               2030                               2050
                                                                                                           Scotland

                                                                                                                                                                   20%                                40%                                80%
                                                                                                           South Australia
                                                                                                           Vermont
                                                                                                           Wales
                                                                                                           Washington
                                                                                                                                                                 below base year                  below base year                    below base year
                                                                                                           Bavaria                      Intensity targets
                                                                                                           Rio de Janeiro
                                                                                                                                                            In addition to region-wide targets, governments also reported a variety of sectoral targets, applying
                                                                                                           Alberta            Business as usual targets     to specific sectors of the economy, including the public sector. For example, Carinthia (Austria), aims
                                                                                                           Minas Gerais                                     to make the transport sector “carbon-neutral” by 2035, and Australian Capital Territory (Australia)
                                                                                                                                                            and North Rhine-Westphalia (Germany) both aim for government operations to be “carbon-neutral” by
1990 1995      2000     2005     2010      2015   2020      2025     2030   2035   2040    2045 2050
                                                                                                                                                            2020 and 2030 respectively.

Key: When multiple targets were reported by a
      government, the target with the longest                                                              Target aiMs to return emissions to base year
                                                                                                           or below
      time frame was shown.
                                                                                                           Business as usual targetS

10%                                                   50%                                          100%    Range of reduction targetS
                                        Shaded on scale by percent
Compact of states and regions | Disclosure Report 2015      17                                                              18                                Compact of states and regions | Disclosure Report 2015

Table 2: Selected sectoral GHG reduction targets
                                                                                                                                                                                        Methodology of emissions saved calculations
 Sector                      Government                                  Target                                                                                                         ‘Business as usual’ GHG emissions were estimated based on per capita GHG emissions (2010) and
 Buildings                   New Caledonia                               Reduce GHG emissions in the residential and tertiary sectors by 35% below a                                    official population projections to 2050. For years where population projections were not available,
                                                                         trend scenario by 2030.                                                                                        population was estimated using a compound annual growth for the related period. ‘Target’ GHG
                                                                                                                                                                                        emissions were projected based on the GHG targets reported to the Compact up to 2050. Actual
 Energy                      New York                                    Reduce GHG emissions from the energy sector by 40% below 1990 levels by                                        GHG emissions and interim targets were included where available. The GHG ‘emissions saved’
                                                                         2030.                                                                                                          figures represent the cumulative difference between ‘business as usual’ (BAU) emissions and
 Industry                    New Caledonia                               Reduce GHG emissions from the mining and metallurgy sectors by 10% below a                                     ‘target’ emissions for each reporting government from 2010 to the date indicated (i.e. 2020 and
                                                                         trend scenario by 2030.                                                                                        2030).
 Land use                    Laikipia County                             Increase annual tree planting by 25%, resulting in over 10 million trees by 2030.
                                                                                                                                                                 These calculations show considerable savings. Between 2010 and 2020, these states, provinces and
 Public sector               Australian Capital Territory                Achieve carbon neutrality in government operations by 2020.                             regions could save a total of 3 GtCO2e, which is more than their current annual emissions combined.
                             North Rhine-Westphalia                      Achieve carbon neutrality in government operations by 2030.                             To 2050, the cumulative savings increase even further, equalling current annual global emissions.

                             Rio de Janeiro                              Reduce public sector energy-related GHG emissions by 30% below 2005 levels              These emissions savings are represented in the figure below. In terms of an absolute reduction in
                                                                         by 2030.                                                                                emissions, the projection shows state emissions will drop by more than half (54%) from 2010 to 2050,
                                                                                                                                                                 from 2.76 GtCO2e to 1.28 GtCO2e11.
                             Vermont                                     Reduce GHG emissions from government operations by 75% below 1990 levels
                                                                         by 2050.                                                                                Figure 4: Greenhouse gas emissions savings versus BAU (2010-2050)
 Transport                   Carinthia                                   Achieve carbon-neutrality in the transport sector by 2035.
                                                                                                                                                                                                     4.0                     12.4 GtCO2e by 2030
                             Rio de Janeiro                              Reduce GHG emissions in the transport sector by 30% below 2010 levels by
                                                                         2030.
                                                                                                                                                                                                     3.5
                                                                                                                                                                                                                  3 GtCO2e by 2020
 Waste                       Rio de Janeiro                              Reduce GHG emissions from sewage by 65% below 2005 levels by 2030.
                                                                                                                                                                                                     3.0

                                                                                                                                                             Total GHG emissions (GtCO2e per year)
                                                                         Reduce GHG emissions from solid waste by 65% below 2005 levels by 2030.
                                                                                                                                                                                                     2.5
Greenhouse gas emissions savings                                                                                                                                                                                                                                          47.4 GtCO2e by 2050

Analysis of the GHG reduction targets disclosed through the Compact of States and Regions shows that, should all                                                                                     2.0
governments meet their targets, the following annual and cumulative emissions savings can be achieved when
compared with a ‘business as usual’ scenario starting in 2010:                                                                                                                                       1.5

Annual savings                                                                                                                                                                                       1.0

     § 0.6 GtCO2e/year in 2020                                                                                                                                                                       0.5

     § 1.2 GtCO2e/year in 2030                                                                                                                                                                       0
                                                                                                                                                                                                           2010      2015        2020       2025   2030   2035   2035   2040      2045          2050

     § 2.2 GtCO2e/year in 2050                                                                                                                                                                                     GHGs under business as usual
Cumulative savings                                                                                                                                                                                                 GHGs under targets

     § 3 GtCO2e by 2020                                                                                                                                          The light green area represents the annual emissions of the reporting governments, both forecast and reported, which
                                                                                                                                                                 reduce toward 2050 based on their targets. The dark green areas represent the BAU scenario that is linked to state and

     § 12.4 GtCO2e by 2030                                                                                                                                       regional population projections.

     § 47.4 GtCO2e by 2050
Compact of states and regions | Disclosure Report 2015            19   20   Compact of states and regions | Disclosure Report 2015

                                                                                                                            Oregon                             60,944,000               1990      2012              +9%
                                                                                                                            Provence-Alpes-Côte d’Azur         35,000,000               2007      2013              -27%
Progress toward greenhouse gas reduction targets
                                                                                                                            Québec                             77,980,000               1990      2012              -8%
As of the latest emissions inventories, which range from 2010 to 2014:
                                                                                                                            Rhône Alpes                        42,389,000               1990      2013              -6%
−−Collectively, governments reporting absolute GHG reduction targets compared to a base year were
  6% below their combined base year emissions.24                                                                            São Paulo                          98,037,080               2005      2013              +6%

−−Individually, 76% of those governments (25) were at or below their base year emissions.                                   Scotland                           58,575,355               1990      2012              -26%*

Table 3: GHG emissions trends to date                                                                                       South Australia                    31,690,240               1990      2011-2012         -9%*
                                                                                                                            Vermont                           8,269,000                 1990      2012              +2%
 Government                                   Latest GHG emissions Base                      Inventory   Percent change
                                              inventory metric     year                      year        from base year     Wales                             45,825,984                1990      2012              -18%
                                              tons CO2e                                                                     Washington                        94,100,000                1990      2012              +6%
 Aquitaine                                    19,297,345                        1990         2012        -20%               Total                             2,218,596,774             NA        NA                -6%
 Australian Capital Territory                 3,990,000                         1990         2013-2014   +25%
                                                                                                                                                   *Percent change from base year figures were reported by the government through the
 Baden-Württemberg                            76,000,000                        1990         2012        -15%                                      Compact. All other progress from base year estimates was calculated using reported
                                                                                                                                                                base year emissions and reported gross emissions in the year indicated.
 Basque Country                               19,303,800                        2005         2013        -25%
 British Columbia                             61,500,000                        2007         2012        -4%               Comparing current and base year emissions is, however, only one way to consider progress. Most
 Brittany                                     24,500,000                        2005         2010        -4%*              governments (60%) have chosen to use a 1990 base year, in which case the comparison, spanning
                                                                                                                           over two decades, can miss out on recent progress. For example, most of the governments that are
 California                                   458,685,000                       1990         2012        +6%               currently over their base year emissions, have made significant emissions reductions over the past
 Carinthia                                    3,951,021                         2005         2013        -17%              decade.

 Catalonia                                    43,138,840                        2005         2012        -10%              Table 4: Recent GHG emissions trends
 Connecticut                                  39,546,768                        1990         2012        -11%               Government            Latest emissions -inventory         Percent change          Percent change from
                                                                                                                           Table 4: Recent emissions trend
                                                                                                                                                  (2012)                              from base year          2005
 Drenthe                                      3,458,920                         1990        2013         -8%
                                                                                                                                                                                      (1990)
 Emilia-Romagna                               50,983,000                        1990        2010         +50%
                                                                                                                            California            458,685,000                         +6%                     -6%
 Jalisco                                      42,001,220                        2010        2010         NA
                                                                                                                            Oregon                60,944,000                          +9%                     -11%
 Jämtland                                     880,000                           1990        2011         -24%
                                                                                                                            Vermont               8,269,000                           +2%                     -11%
 La Réunion                                   4,659,201                         2011        2011         NA
                                                                                                                            Washington            94,100,000                          +6%                     -1%
 Lombardy                                     70,600,00                         2005        2012         -18%
                                                                                                                           For governments that are already below their base year emissions, half of them are more than half
 Manitoba                                     21,400,000                        2005        2013         +3%               way toward their near-term (i.e. 2020) goal, with four having already achieved it (i.e. Aquitaine,
 Midi-Pyrénées                                18,543,000                        2005        2013         -15%*             Connecticut, Newfoundland and Labrador, and Provence-Alpes-Côte d’Azur).
 New York                                     211,740,000                       1990        2011         -8%
 Newfoundland and Labrador                    8,640,000                         1990        2013         -11%
 North Rhine-Westphalia                       308,812,000                       1990        2013         -15%*
 Northwest Territories                        1,456,000                         2005        2013         -12%
 Ontario                                      167,000,000                       1990        2012         -6%

24 This includes 33 governments that have set an absolute GHG reduction target with a base year.
Compact of states and regions | Disclosure Report 2015      21   22     Compact of states and regions | Disclosure Report 2015

Table 5: Progress toward 2020 GHG reduction targets                                                        Table 6: Renewable energy/power targets

 Government                         Current reduction       Target reduction      Progress toward           Government                                 Target share of   Target share of                                    Target share
                                    below base year         in 2020               2020 target                                                          renewable energy/ renewable energy/                                  of renewable
                                                                                                                                                       power in 2020     power in 2030                                      energy/power in
 Aquitaine                          20%                     20%                   100%                                                                                                                                      2050
 Baden-Württemberg                  15%                     25%                   60%                       Australian Capital Territory* 90%
 British Columbia                   4%                      33%                   12%                       Aquitaine                                  25%
 Brittany                           4%                      17%                   24%                       Baden-Württemberg                          25%                                                                  80%
 Catalonia                          10%                     25%                   40%                       Basque Country                                                              20%                                 40%
 Carinthia*                         17%                     16%                   106%                      Brittany                                   28%
 Connecticut                        11%                     10%                   110%                      California                                 33%                              50%
 Drenthe                            8%                      20%                   40%                       Carinthia*                                                                  100%25
 Jämtland                           24%                     50%                   48%                       Catalonia*                                 20%
 Lombardy*                          18%                     20%                   90%                       Connecticut*                               27%26
 Midi-Pyrénées                      15%                     19%                   79%                       Drenthe                                    16%
 Newfoundland and Labrador          11%                     10%                   110%                      Emilia-Romagna                             17%
 North Rhine-Westphalia             15%                     25%                   60%                       La Réunion*                                50%                              100%
 Ontario                            6%                      15%                   40%                       Lombardy                                   15%
 Provence-Alpes-Côte d’Azur         27%                     20%                   135%                      Midi-Pyrénées                              43%
 Québec                             8%                      20%                   40%                       New York*                                                                   50%
 Rhône-Alpes                        6%                      29%                   21%                       Ontario*                                                                    49%27
 Scotland                           26%                     42%                   62%                       Oregon*                                                                     25%28
 Wales                              18%                     40%                   45%                       Provence-Alpes-Côte d’Azur                 20%                              30%
*Target applies to non-EU ETS emissions                                                                     Rhône-Alpes                                29%
                                                                                                            São Paulo                                  69%
Renewable energy targets                                                                                    Scotland*                                  50%29
Another commonly reported climate commitment through the Compact of States and Regions is a
                                                                                                            South Australia*                                                            50%30
renewable energy or power target, expressed as a percentage share of the region’s energy or power
mix.                                                                                                        Vermont                                                                                                         90%
In the way that region-wide emissions reduction targets provide an indication of a region’s overall         Wales*                                     15%
path toward decarbonization, renewables targets provide a similar sense of the region’s future              Washington*                                15%31
energy profile.
                                                                                                                                                                                                           *Target applies to the power sector
The two types of targets often go hand in hand, with the decarbonization of energy supply                  Timeframes for renewable energy/power targets:
contributing to overall GHG emission reductions. In fact, over two thirds of governments reporting a       −−72% of governments (18) reported a near-term target (i.e. 2020 or earlier);
region-wide emissions reduction target also reported a renewable energy and/or power target.
                                                                                                           −−36% of governments (9) reported a mid-term target (i.e. 2021-2035); and
−−Overall, 68% of reporting governments (25) have adopted a renewable energy and/or renewable
  power target.                                                                                            −−12% of governments (3) reported a long-term target (i.e. 2050 and beyond).
−−About half of the renewable targets (12) apply only to the power sector.                                 25 Carinthia’s target is for region-wide heat and power supply to be 100% CO2 neutral and nuclear-free by 2025 based on 2005 levels.
                                                                                                           26 Connecticut’s target is a renewable portfolio standard, which requires individual electricity providers to obtain a minimum
                                                                                                           percentage of their retail load from renewable energy. The share of renewable power indicated in the target is therefore not necessarily
                                                                                                           the same as region-wide renewable power generation.
                                                                                                           27 Ontario’s mid-term target year is 2025.
                                                                                                           28 Oregon’s mid-term target year is 2025. The target is a renewable portfolio standard, which requires Oregon’s largest utilities to obtain
                                                                                                           a minimum percentage of their retail load from renewable energy. Oregon currently gets 76% of its state-wide power from renewables.
                                                                                                           29 Scotland’s near-term target year is 2015.
                                                                                                           30 South Australia’s mid-term target year is 2025.
                                                                                                           31 Washington’s target is a renewable portfolio standard, which requires 84% of utilities to obtain a minimum percentage of their retail
                                                                                                           load from renewable energy. Washington currently gets 76% of its state-wide power from renewables.
Compact of states and regions | Disclosure Report 2015          23                                    24    Compact of states and regions | Disclosure Report 2015

                                                                                                                                            Renewable power trends to date
           2020                               2030                              2050                                                        Most reporting governments already get a significant amount of their power from renewable sources.

         72%                             36%                               12%
                                                                                                                                            −−About a third of governments (31%) get more than 75% of their power from renewable sources.
                                                                                                                                            −−5% get between 50-74% of their power from renewable sources.
                                                                                                                                            −−About a quarter (26%) get between 25-49% of their power from renewable sources.
   18 governments                     9 governments                     3 governments                                                       −−About a third of governments (36%) currently get less than 25% of their power from renewable
                                                                                                                                              sources.
Based on 25 governments who reported a renewable energy/power target.                                                                       Figure 5: Share of fossil fuel, nuclear and renewable energy in region-wide electricity generation

                                                                                                                                  Alberta
Range of renewable energy/power targets:                                                                                        Aquitaine
−−Half of the near-term renewable targets (9) are in the 15-25% range, with the other half ranging         AustraliaN Capital Territory*
                                                                                                                   Baden-Württemberg
  from 27-90%. No specific near-term target was particularly common, reflecting diversity between                       Basque Country
  regions’ potential energy mix.                                                                                                  Bavaria
                                                                                                                       British Columbia
−−44% of the mid-term renewable targets (4) are in the 40-50% range, with the most commonly                                      Brittany
  reported mid-term target being a 50% share of renewables in the energy/power mix.                                           California
                                                                                                                               Carinthia
−−Two of the three long-term targets are in the 80-90% range (the other being 40% share of
                                                                                                                               Catalonia
  renewables in the energy mix).                                                                                            Connecticut
                                                                                                                              Drenthe**
In addition, several governments also reported source-specific renewable energy targets, aimed at                       Emilia-Romagna
increasing the generation or consumption of a specific renewable source, such as biomass, hydro,                                  Jalisco
solar and wind.                                                                                                                Jämtland
                                                                                                                        KwaZulu-Natal*
Table 7: Selected source-specific renewable energy/power targets                                                              La Réunion
                                                                                                                         Laikipia County
                                                                                                                               Lombardy
 Renewable       Government             Target                                                                                  Manitoba
 source                                                                                                                   Midi-Pyrenees
                                                                                                                           Minas Gerais
 Biomass         Northwest              Increase the capacity of biomass heat in residential,                             New Caledonia
                 Territories            commercial and institutional buildings by 100% by 2015.                                 New York
                                                                                                           Newfoundland and Labrador
 Hydro           Québec                 Add 4,000 MW of hydroelectricity production by 2017.                    North Rhine-Westphalia
 Solar           Connecticut            Increase deployment of residential solar photovoltaic                    NorthWest Territories
                                        systems from 30 MW to 300 MW by 2022.                                                     Ontario
                                                                                                                                  Oregon
                 KwaZulu-Natal          Install solar geysers in one of every 20 new government-            Provence-Alpes-Cotes-D’Azur
                                        supplied housing units by 2020.                                                            Quebec
                                                                                                                            Rhône-Alpes
                 La Réunion             Have 50% of residential housing equipped with solar hot                           Rio de Janeiro
                                        water by 2020, and 80% by 2030.                                                        São Paulo
                                                                                                                               Scotland
                 Laikipia County        Power 25% of households with solar electricity by 2025.                         South Australia
                                                                                                                                 Valencia
                 Northwest              Increase the use of solar electricity within diesel powered                              Vermont
                 Territories            communities to 20% by 2017.                                                                 Wales
                                                                                                                            Washington
 Wind            Manitoba               Increase wind power capacity to 1,000 MW (as economically                                 Yucatan
                                        viable).
                                                                                                                                            0         10           20          30        40          50          60      70         80         90        100
                 Québec                 Add 4,000 MW of wind electricity by 2017.
                                                                                                                                                                        Percent of region-wide electricity generation
Others, including Newfoundland and Labrador and British Columbia (Canada), which are already close
to 100% renewable energy/power at 90% and 93% respectively, reported intent to continue in that                                                  Fossil fuels                 Nuclear               Renewables 		Other                              No data
direction with the addition of new renewable energy capacity in the coming years.
                                                                                                                                                           * Reported electricity mix and associated figures refer to region-wide consumption not generation
                                                                                                                                                           ** Data represents total energy mix, not solely electricity
Compact of states and regions | Disclosure Report 2015        25                        26     Compact of states and regions | Disclosure Report 2015

Disclosed shares of renewables                                                                                                  Table 9: Energy efficiency targets (as a decrease in energy use)
                                                                                                                                 Government                                  Percentage decrease in                  Base year                          Target year
   0-25% Renewables                    25-49% Renewables                   50-74% Renewables               75-100% Renewables                                                energy use

       38%                                26%                                5%                              31%
                                                                                                                                 Baden-Württemberg                           50%                                     2010                               2050
                                                                                                                                 Brittany                                    26%                                     2005                               2020
                                                                                                                                                                             60%                                     2005                               2050
                                                                                                                                 Drenthe                                     10%                                     2010                               2020
   16 governments                      11 governments                       2 governments                  13 governments
                                                                                                                                 Lombardy                                    10%32                                   2005                               2020
Based on 42 governments who reported their share of renewables.                                                                  Midi-Pyrénées                               15%                                     2005                               2020
−−The most commonly reported renewable power source is hydroelectric power, with states,                                         New Caledonia                               10%33                                   NA34                               2030
  provinces and regions getting an average of 33% of their power from hydro. The 13 governments
  getting more than 75% of their total power from renewables, get an average of 77% from hydro.                                  Provence-Alpes-Côte d’Azur                  25%                                     2007                               2030

−−The next most commonly reported renewable sources are wind power and biomass, both at an                                       Rhone-Alpes                                 20%                                     1990                               2020
  average of 5%, followed by solar at an average of 2%.                                                                          Scotland                                    12%                                     200635                             2020
−−On average, less than 1% of state, provincial and regional power is provided by geothermal or tidal,                           Wales                                       18%                                     2007                               2020
  with the exceptions being Laikipia County, which gets 32% of its power from geothermal, and
  Brittany, which gets 18% of its power from tidal.                                                                             Table 10: Selected sectoral energy efficiency targets

Energy efficiency targets                                                                                                        Sector            Government                Target

In addition to increasing the renewable share of their energy production and use, many governments                               Buildings         California                Double energy efficiency progress in existing buildings by 2030
focus on energy efficiency and productivity as a cost-efficient way to reduce GHG emissions. Energy                                                Newfoundland              Reduce building and industry energy consumption by 20% from
efficiency targets reported to the Compact are perhaps the most varied in substance and form of all                                                and Labrador              business as usual by 2020
targets reported.
                                                                                                                                                   New York                  Increase energy efficiency in buildings by 600 trillion BTUs by 2030
−−Overall, 68% of governments (25) reported an energy efficiency target.
                                                                                                                                                   South Australia           Increase energy efficiency in residential buildings by 15% from 2003
−−52% of these governments (13) reported energy efficiency targets for a specific economic sector                                                                            levels by 2020
  (or sectors).
                                                                                                                                                   Wales                     Eradicate fuel poverty in all households by 2018
−−36% of these governments (9) reported region-wide energy efficiency targets (i.e. all sectors),
                                                                                                                                                   Washington                Ensure all new buildings are energy-neutral by 2030
  expressed as an overall reduction in energy use.
                                                                                                                                 Power             British Columbia Reduce expected increase in electricity demand by 66% by 2020
−−20% of these governments (5) reported region-wide energy efficiency targets, expressed as an
  overall increase in energy efficiency.                                                                                                           La Réunion                Increase energy efficiency of electricity use by 10% from a trend
                                                                                                                                                                             scenario by 2020 and 20% by 2030
Table 8: Energy efficiency targets (as an increase in energy efficiency)
                                                                                                                                                   Manitoba                  Save 842 MW of electricity by 2017
 Government                      Percent increase in energy Base year                   Target year                                                Ontario                   Have conservation account for 16% of forecast gross demand by
                                 efficiency                                                                                                                                  2032
 Aquitaine                       28%                              2008                  2020                                                       Québec                    Save 350 million cubic meters of natural gas by 2015
 Catalonia                       20%                              2007                  2020                                                                                 Save 11 TWh of electricity compared to a reference scenario by 2015
 Emilia-Romagna                  20%                              BAU                   2020                                     Public            Connecticut               Reduce energy use in at least 100 public buildings with the highest
 Jämtland                        30%                              1990                  2020                                     sector                                      energy costs by 20% from 2012 levels by 2018

 Newfoundland and Labrador 20%                                    2007                  2020                                                       Jalisco                   Increase energy efficiency in public buildings and fleets by 12%
                                                                                                                                                                             from 2013 levels by 2018
                                                                                                                                                   South Australia           Increase energy efficiency in public buildings by 30% from 2000
                                                                                                                                                                             levels by 2020
                                                                                                                                 Transport Québec                            Save 2 million tons (oil equivalent) of petroleum by 2015

                                                                                                                                32 Lombardy’s target applies to energy use in non-EU ETS sectors.
                                                                                                                                33 New Caledonia also has a target of reducing energy use by 25% below a trend scenario in all sectors, excluding mining and metallurgy.
                                                                                                                                34 New Caledonia’s target is based on a trend scenario.
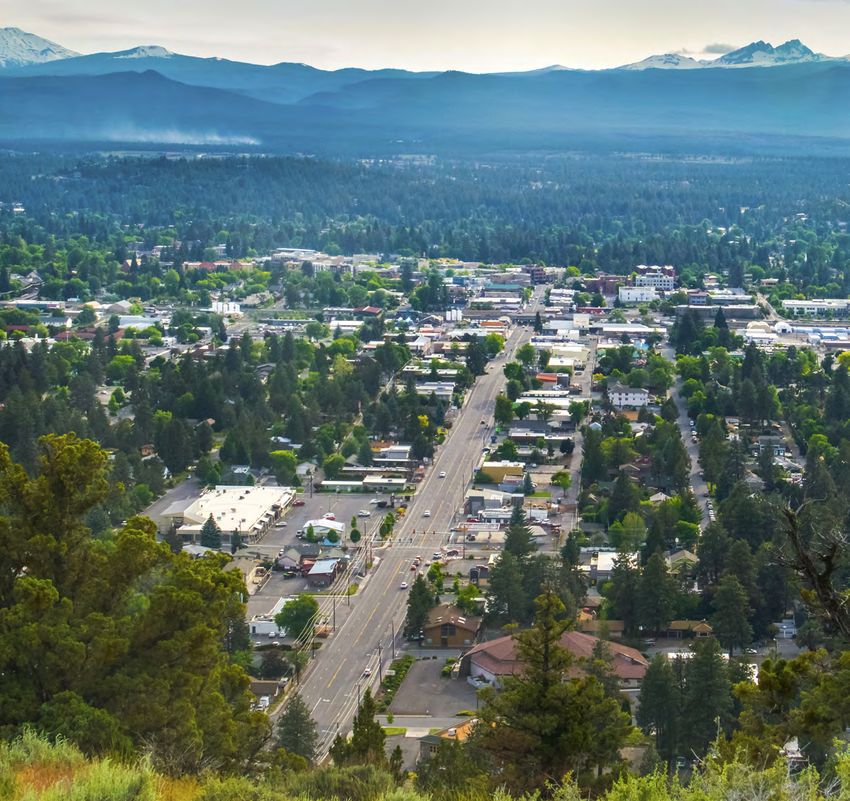
                                                                                                                                35 Scotland’s near-term target is based on 2005-2007 levels.
28   Compact of states and regions | Disclosure Report 2015

Oregon and the Pacific Northwest
are experiencing the impacts of
climate change now. June 2015
was the hottest June yet in the
northwest, helping to fuel record-
breaking forest fires and massive
fish die-offs due to warming river
temperatures. The science tells
us such impacts are here to stay:
climate models forecast several
significant changes for the
northwest including decreased
snow pack and changed river flow,
rising coastal sea-levels and
increased ocean acidification, and
growing severity of wildfires.
Reducing greenhouse gas emissions
in a cost-effective way has been
a priority for Oregon because we
believe that we can and should
do our share to address this
global challenge. Our least-
cost and least-risk approach to
planning for our energy future
has resulted in almost two
decades of substantial investment
in energy efficiency, an ambitious
renewables policy, and an
agreement to close our lone coal
plant 20 years early which will
result in avoided annual emissions
of 3-4.5 million metric tons of
CO2-equivalent. We are committed
to continuing this progress going
forward, both within Oregon’s
borders and in collaboration with
our partner states and regions.
- Katherine Brown, Governor, Oregon
You can also read