PV Status Report 2019 - Europa EU
←
→
Page content transcription
If your browser does not render page correctly, please read the page content below
PV Status Report 2019
 Jäger-Waldau, A.

 2019

 EUR
 EURXXXXX
 29938EN
 EN
This publication is a Science for Policy report by the Joint Research Centre (JRC), the European Commission’s
science and knowledge service. It aims to provide evidence-based scientific support to the European policymak-
ing process. The scientific output expressed does not imply a policy position of the European Commission. Nei-
ther the European Commission nor any person acting on behalf of the Commission is responsible for the use
that might be made of this publication. For information on the methodology and quality underlying the data
used in this publication for which the source is neither Eurostat nor other Commission services, users should
contact the referenced source. The designations employed and the presentation of material on the maps do not
imply the expression of any opinion whatsoever on the part of the European Union concerning the legal status
of any country, territory, city or area or of its authorities, or concerning the delimitation of its frontiers or
boundaries.

Contact information
Name: Arnulf JÄGER-WALDAU
Address: European Commission, Joint Research Centre, via Enrico Fermi 2749, 21027 Ispra (VA), Italy
Email: Arnulf.JAEGER-WALDAU@ec.europa.eu
Tel.: +39 033278-9119

JRC Science Hub
https://ec.europa.eu/jrc

JRC118058

EUR 29938 EN

 PDF ISBN 978-92-76-12608-9 ISSN 1831-9424 doi:10.2760/326629

 Print ISBN 978-92-76-12607-2 ISSN 1018-5593 doi:10.2760/329862

Luxembourg: Publications Office of the European Union, 2019

© European Union, 2019

The reuse policy of the European Commission is implemented by the Commission Decision 2011/833/EU of 12
December 2011 on the reuse of Commission documents (OJ L 330, 14.12.2011, p. 39). Except otherwise noted,
the reuse of this document is authorised under the Creative Commons Attribution 4.0 International (CC BY 4.0)
licence (https://creativecommons.org/licenses/by/4.0/). This means that reuse is allowed provided appropriate
credit is given and any changes are indicated. For any use or reproduction of photos or other material that is
not owned by the EU, permission must be sought directly from the copyright holders.

All images © European Union 2018, except: cover page, © Valentin Jäger-Waldau (pixabay #4518970)

How to cite this report: Jäger-Waldau, A., PV Status Report 2019, EUR 29938 EN, Publications Office of the
European Union, Luxembourg, 2019, ISBN 978-92-76-12608-9, doi:10.2760/326629, JRC118058.

Title PV Status Report 2019
Photovoltaics is a solar-power technology for generating electricity using semiconductor devices known as solar cells. A number
of solar cells form a solar ‘module’ or ‘panel’, which can then be combined to form solar power syst ems, ranging from a few
watts of electricity output to multi-megawatt power stations.
Growth in the solar photovoltaic sector has been robust. The Compound Annual Growth Rate over the last decade was over
40 %, thus making photovoltaics one of the fastest growing industries at present. The PV Status Report provides comprehen-
sive and relevant information on this dynamic sector for the interested public, as well as decision-makers in policy and industry.
Contents

Foreword .............................................................................................................. 1
Acknowledgements ................................................................................................ 2
Executive Summary ............................................................................................... 3
1 Introduction ...................................................................................................... 5
2 The PV Market ................................................................................................. 10
 2.1 EUROPE, THE RUSSIAN FEDERATION AND TURKEY ........................................ 12
 2.1.1 Austria ............................................................................................. 15
 2.1.2 Belgium ............................................................................................ 16
 2.1.3 Denmark .......................................................................................... 16
 2.1.4 France .............................................................................................. 17
 2.1.5 Germany .......................................................................................... 17
 2.1.6 Greece ............................................................................................. 18
 2.1.7 Hungary ........................................................................................... 18
 2.1.8 Italy ................................................................................................. 19
 2.1.9 The Netherlands ................................................................................ 19
 2.1.10 Poland .............................................................................................. 19
 2.1.11 Spain ............................................................................................... 20
 2.1.12 Switzerland ....................................................................................... 20
 2.1.13 UK ................................................................................................... 21
 2.1.14 Other European countries, Russia and Turkey ........................................ 21
 2.2 Asia and the Pacific region .......................................................................... 23
 2.2.1 Australia ........................................................................................... 23
 2.2.2 India ................................................................................................ 23
 2.2.3 Israel ............................................................................................... 24
 2.2.4 Japan ............................................................................................... 24
 2.2.5 Jordan .............................................................................................. 25
 2.2.6 Malaysia ........................................................................................... 26
 2.2.7 Pakistan ........................................................................................... 26
 2.2.8 People’s Republic of China .................................................................. 27
 2.2.9 Philippines ........................................................................................ 28
 2.2.10 Korea ............................................................................................... 28
 2.2.11 Singapore ......................................................................................... 29
 2.2.12 Taiwan ............................................................................................. 29
 2.2.13 Thailand ........................................................................................... 29
 2.2.14 United Arab Emirates (UAE) ................................................................ 30

 i
2.2.15 Vietnam............................................................................................ 30
 2.2.16 Emerging markets ............................................................................. 31
 2.3 Americas .................................................................................................. 34
 2.3.1 Argentina .......................................................................................... 34
 2.3.2 Brazil ............................................................................................... 34
 2.3.3 Canada ............................................................................................. 34
 2.3.4 Chile ................................................................................................ 35
 2.3.5 Dominican Republic ............................................................................ 35
 2.3.6 Honduras .......................................................................................... 35
 2.3.7 Mexico .............................................................................................. 36
 2.3.8 Panama ............................................................................................ 36
 2.3.9 Peru ................................................................................................. 37
 2.3.10 United States of America .................................................................... 37
 2.3.11 Emerging markets ............................................................................. 37
 2.4 Africa ....................................................................................................... 39
 2.4.1 Algeria ............................................................................................. 39
 2.4.2 Burkina Faso ..................................................................................... 39
 2.4.3 Cape Verde ....................................................................................... 40
 2.4.4 Egypt ............................................................................................... 40
 2.4.5 Ethiopia ............................................................................................ 41
 2.4.6 Ghana .............................................................................................. 41
 2.4.7 Mauritania ........................................................................................ 42
 2.4.8 Morocco ............................................................................................ 42
 2.4.9 Senegal ............................................................................................ 42
 2.4.10 South Africa ...................................................................................... 43
 2.4.11 Zambia ............................................................................................. 43
 2.4.12 Emerging markets ............................................................................. 44
3 Electricity costs and the economics of PV systems ............................................... 46
 3.1 LCOE ........................................................................................................ 47
 3.2 Influence of financing costs on LCOE ............................................................ 49
 3.3 LCOE of residential grid-connected PV systems .............................................. 51
 3.4 Residential and commercial PV systems with electricity storage models ............ 54
 3.5 LCOE of utility-scale PV systems .................................................................. 56
4 CONCLUSIONS AND OUTLOOK .......................................................................... 58
References ......................................................................................................... 63
List of abbreviations and definitions ....................................................................... 76
List of figures ...................................................................................................... 78
List of tables ....................................................................................................... 79

 ii

Foreword

The necessity to limit the maximum global average temperature rise to as close as possi-
ble to 1.5°C was acknowledged with the Paris Agreement. This agreement went into
force on 4th November 2016. However, the current policies in place to limit global green-
house gas (GHG) emissions are still insufficient to keep the temperature increase below
2°C. The burning of fossil fuels for energy purposes is still the largest source of the
world’s greenhouse gas emissions, accounting for 68%. Therefore, the decarbonisation of
our energy system is the single most important component to achieve the target.
The G20 Ministerial Meeting on Energy Transitions and Global Environment for Sustaina-
ble Growth took place in Karuizawa, Japan on 15 and 16 June 2019. For the first time,
Energy and Environment Ministers from the G20 countries gathered in joint sessions to
address energy transition and global environmental challenges. Ministers focused on en-
ergy security, economic efficiency, environment and safety
The IEA's Energy Technology perspectives 2017 presented a pathway for achieving the
goals of the Paris Agreement. In order to reach this, the power sector has to be fully de-
carbonised not by 2060 as modelled for a 2°C scenario, but well before 2050.
Photovoltaics (PV) is a key technology option for realising a decarbonised power sector
and sustainable energy supply. Further it can be deployed in a modular way almost eve-
rywhere on the planet. Solar resources in Europe and across the world are abundant and
cannot be monopolised by one country. Regardless of how fast energy prices increase in
the future, and the reasons behind these increases, PV and other renewable energies are
the only ones offering the stabilisation of, or even a reduction in future prices.
Between the end of 2009 and the first half of 2019, the benchmark Levelised Cost of
Electricity from PV system decreased by 80% to USD 57/MWh (EUR 52/MWh). The main
contribution was the decrease of module prices by over 85 % in most markets. Due to
the continuous decrease of PV system prices and increasing electricity prices, the number
of such markets is steadily increasing. In 2018, solar energy attracted 42.5 % of all new
renewable energy investments which equates to USD 140 billion (EUR 122 billion).
In 2018, PV industry production increased by 5 % and reached a worldwide production
volume of about 113 GW of PV modules. For 2019 a growth above 15% is forecasted.
The compound annual growth rate (CAGR) over the last 15 years was above 40 %, which
makes PV one of the fastest growing industries at present.
The 17th edition of the PV Status Report gives an overview of current trends. Over the
last one and a half decades, the PV industry has grown from a small group of companies
and key players into a global business where information gathering is becoming increas-
ingly complex. This report seeks to bring together all available information. As it is a liv-
ing document any additional information would be most welcome and will be used to up-
date the report.

Ispra, November 2019

Piotr Szymanski
Director
Joint Research Centre, European Commission
Directorate C: Energy, Transport and Climate

 1
Acknowledgements
Over the last two decades, in addition to the numerous discussions I have had with in-
ternational colleagues, as well as literature and internet research, I have visited various
government entities, research centres and leading industry companies in Australia, Chile,
China, India, Japan, Singapore, South Africa, the United States and Europe. I would like
to thank all my hosts for their kindness and the time taken to welcome me, to share their
knowledge and to discuss the status and prospects of PV.

 2
Executive Summary
For the 9th year in a row, solar power attracted the largest share of new investments in
renewable energies, followed by wind power. The USD 140 billion (EUR 122 billion) in-
vestments in solar energy, accounted for 42.5 % of all new renewable energy invest-
ments. While the annual investment decreased by 13%, the newly installed capacity of
solar photovoltaic power increased by about 5% to over 107 GW in 2018.
Over the last 15 years, the production volume of solar PV has increased with a compound
annual growth rate (CAGR) of over 40 %, which makes the industry one of the fastest
growing ones in the world. Until 2006, the solar cell production was dominated by Japan
and Europe. After the rapid increase of the annual production in China and Taiwan since
2006, a new trend emerged in 2014 to rapidly increase production capacities in other
Asian countries such as India, Malaysia, Thailand, the Philippines or Vietnam.
Market development for solar PV systems did not follow the production at the same pace,
which led to overcapacities and massive price pressure along the production value chain.
This development triggered a consolidation of the manufacturing industry, which is still
ongoing.
R&D spending for renewable energies increased by 10% to reach USD 13 billion (EUR
11.3 billion). About half of this R&D went to solar energy. However despite the urgent
need for a rapid decarbonisation of our energy supply this is still only 10.7% of the total
R&D spending of USD 121 billion (EUR 105 billion) for energy.
The trend that the developing economies invest more in renewable energy capacity than
the developed ones continued for the fourth year.
The PV industry has changed dramatically over the last few years. China has become the
major manufacturing country for solar cells and modules, followed by Taiwan and Malay-
sia.
According to market forecasts, the installed PV power capacity of 520 GW at the end of
2018 could reach up to 1.4 TW by 2024. At the end of 2019, worldwide solar PV power is
expected to reach 650 GW capable of producing roughly 4 % of the worldwide electricity
demand. The EU’s share is about one fifth of the world-wide installed capacity and can
provide about 5.5 % of its electricity demand.
Recent 100% renewable electricity scenarios have highlighted the importance of solar
photovoltaics to achieve this goal and decarbonise the power sector in a cost effective
manner. To realise a carbon free power supply by 2050, the installed PV generation ca-
pacity of about 650 GW at the end of 2019 has to increase to more than 4 TW by 2025
and 21.9 TW by 2050. This indicates that the installation rate has to increase by a factor
of 2.5 until 2025. The European Union needs to increase its capacity from 117 GW at the
end of 2018 to more than 630 GW by 2025 and 1.94 TW by 2050. In case of a transition
to a sustainable transport sector, i.e. electrification and synthetic fuels, these numbers
would need to increase by a factor of two.
2016 already saw a number of record breaking power purchase agreements (PPA) con-
tracts and bids below USD 30/MWh and the trend for bids below 25 USD/MWh has accel-
erated in sun rich regions in 2017 and 2018. The trend continued in 2019 with offers be-
low USD 20/MWh. These very low bids and PPAs are only possible through a combination
of excellent solar resource, high debt shares and very low debt costs as well as the fact
that some tariffs are indexed to inflation.
PV is a key technology option for implementing the shift to a decarbonised energy supply
and can be deployed in a modular way almost everywhere on this planet. Over the last
decades the growth of PV energy use was mainly driven by public incentives, but the
shift now to economics driven use of solar PV electricity as one of the lowest cost elec-
tricity supplies is obvious.

 3
4
1 Introduction
Reported production data for the global solar cell production 1 in 2018 vary between
110 GW2 and 120 GW and estimates for 2019 are in the 120 to 140 GW range. The signif-
icant uncertainty in these data is due to the highly competitive market environment, as
well as the fact that some companies report production figures, while others report sales
and again others report shipment figures.
The data presented, collected from stock market reports of listed companies, market re-
ports and international colleagues, were compared to various data sources and thus led
to an estimate of 114 GW (Fig. 1), representing an increase of about 5 % compared to
2017 and another 10% are expected for 2019.
Since 2000, the production of solar photovoltaic devices has grown with a CAGR of over
40 %. After the rapid increase of the annual production in China and Taiwan since 2006 a
new trend emerged in 2014 to increase production capacities in other Asian countries like
India, Malaysia, Thailand, the Philippines or Vietnam. It is interesting to note that most of
these investments are done by Chinese companies. Another trend in the PV industry was
the rapid increase in original equipment manufacturing (OEM) volumes since 2011, which
allowed larger companies to significantly increase their shipment volumes without adding
new capacity of their own.

 Figure 1: World PV cell/module production from 2005 to 2019 (estimate)

 140
 Rest of World
 120 United States
 Malaysia
 Japan
Annual Production [GW]

 100
 Europe
 Taiwan
 80
 PR China

 60

 40

 20

 0
 2005 2008 2010 2011 2012 2013 2014 2015 2016 2017 2018 2019e
 Year
Total investment in the energy sector was USD 1.85 trillion in 2018 [IEA 2019]. Power
sector investments accounted for USD 775 billion or 42%. Investments in renewable
power was leading with USD 304 billion, followed by the network infrastructure with USD
293 billion, fossil-fuel power plants with USD 127 billion, nuclear with USD 47 billion and
battery storage with USD 4 billion. Including the USD 25 billion investment in renewable
energy for transport and heat a total of USD 329 billion was invested in renewable ener-
gy sources compared to USD 806 billion investments for the coal, gas and oil supply. To-

1
 Solar cell production mean:
- In the case of wafer silicon based solar cells, only the cells
- In the case of thin-films, the complete integrated module
- Only those companies which actually produce the active circuit (solar cell) are counted
- Companies which purchase these circuits and make solar modules are not counted
2
 Please note that all number are based on the current available data (October 2019) and can change, when
 final annual reports of public companies or country statistics are published later

 5
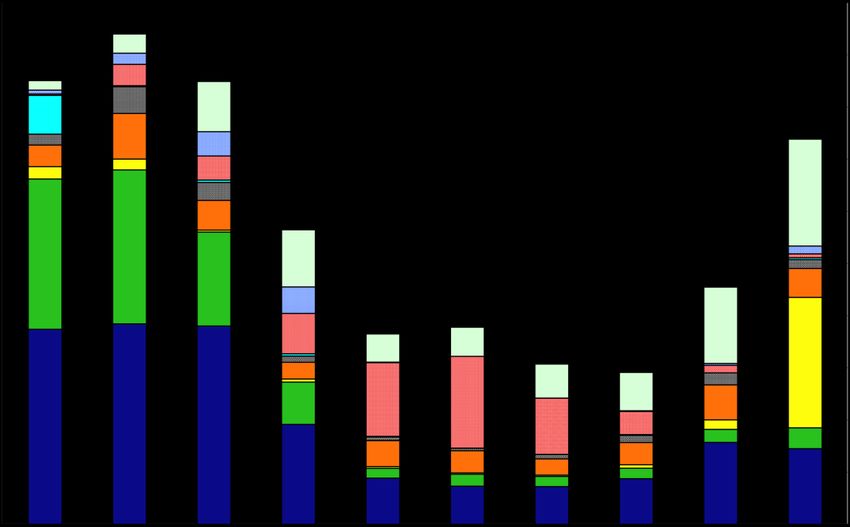
tal new installed renewable power capacity, excluding large hydro, increased from 158 GW in 2017 to 190 GW in 2018. Uncertainties in production statistics Only a limited number of companies report production figures for solar cells or thin film modules. Shipment figures can include products from stock, already produced in the previous year. Some companies report shipments of ’solar products‘ without a differentia- tion between wafers, cells or modules. The increasing trend towards Original Equipment Manufacturing (OEM) in- creases the risk of double counts. World-wide, a total of about 272 GW of new power generation capacity were connected to the grid year and 45 GW were decommissioned, resulting in 237 GW of new net capac- ity (Fig. 2) [Gwe 2019, IEA 2019, own analysis]. Renewable energy sources (RES) in- cluding large hydro accounted for 167 GW or 61 % of all new power generation capacity. PV electricity generation capacity accounted for 107 GW, or 39 % of the new installed ca- pacity. Figure 2: New connected or decommissioned electricity generation capacity world-wide in 2018 Nuclear New connected Capacity Decommissioned Capacity others Oil CSP Large Hydro Biomass Coal Gas PV Wind -40 -20 0 20 40 60 80 100 120 [GW] Source: [Gwe 2019, IEA 2019a] and own analysis The share of electricity in the final consumption provided by renewable energy sources (excluding hydro) increased from 9.7% in 2017 to 10.8% in 2018 [IEA 2019a, Ene 2019]. In 2018, PV and wind electricity generation was up by 31% and 12% respectively compared to 2017. Including hydropower, the renewable electricity generation rose by 7% and accounted for 25.6% of total electricity production. However, power generation capacity expansion with renewable energy sources has to accelerate considerably, if the IEA Sustainable Development Scenario (SDS) of half the power coming from renewables in 2030 should be achieved. 6
Total power generation increased by 3.5% to 26 590 TWh in 2018. After three years of
declining GHG emissions from the power sector, emissions increased 2.6% in 2017 and a
further 2.5% in 2018. This is in contradiction with the SDS scenario, where emissions
have to decrease on average 4.1% per year until 2030.
R&D trends for governmental and industrial spending for renewable energies were posi-
tive in 2018 [Ren 2019]. While government spending increased by 8% to USD 5.5 billion
(EUR3 4.8 billion), corporate R&D increased even more by 12% to USD 7.5 billion
(EUR 6.5 billion). However, compared with the total R%D spending for energy by gov-
ernments (USD 26 billion) and industry (USD 95 billion) this is still a small fraction of the
overall energy R&D expenditures [IEA 2019].
For the 9th year in a row, solar power attracted the largest share of new investments in
renewable energies [Blo 2019]. The USD 140 billion (EUR 122 billion) investments in so-
lar energy, accounted for 42.5 % of all new renewable energy investments. Despite a
22% annual investment decline, the newly installed capacity of solar photovoltaic power
increased by 7% to about 107 GW in 2018. However, one has to keep in mind that a
number of solar projects closed their financing earlier, but were only commissioned in
2018. In such cases the investment is counted for the year of the financial closure, while
the capacity addition is counted for 2018.
The trend that the developing economies invest more in renewable energy capacity than
the developed ones continued for the fourth year. Out of the USD 140 billion
(EUR 122 billion) investments in solar energy, 54% or USD 75 billion (EUR 65 billion)
were invested in developing economies.
In terms of investments into renewable power (excluding large hydro), China kept the
lead with USD 91.2 billion (EUR 79.3 billion), followed by Europe USD 61.2 billion
(EUR 53.2 billion), the USA with USD 48.5 billion (EUR 42.2 billion) and India USD
15.4 billion (EUR 13.4 billion).
Between 2008 and 2014, PV module prices have decreased rapidly by more than 80 %,
then 2015 saw a short levelling out due to industry consolidation and increasing markets,
mainly in China and Japan [Blo 2013, 2016]. However, since the beginning of 2016 mod-
ule prices have again seen a sharp decrease in prices, which put all solar companies
along the value chain under enormous pressure [Blo 2019a].
World-wide overcapacities along the PV value chain still exist and started to build up as a
result of very ambitious investments beginning in 2005. The investments in solar cell and
module manufacturing equipment, excluding polysilicon manufacturing plants, peaked in
2011 at about USD 14 billion (EUR4 10.8 billion) after the PV market grew by more than
150 % in 2010. However, in the following years, the market growth for solar photovoltaic
systems slowed and was not able to absorb the output of this massive and rapid in-
creased manufacturing capacity. The result was a huge oversupply, which led to continu-
ous price pressure along the value chain and resulted in a reduction of market prices for
polysilicon materials, solar wafers and cells, as well as solar modules. This development
resulted in the insolvency of many companies. Consequently, equipment spending de-
clined dramatically and hit the bottom with around USD 1.7 billion in 2013 before it start-
ed to rebound in 2014 [Sol 2014]. Early 2018 it was reported that PV CAPEX (from c-
ingot to module) had surpassed USD 7 billion in 2017 and could reach USD 10 billion in
2018 [Col 2018].
Consolidation in the PV manufacturing industry has led to the closure or takeover of a
significant number of companies since 2009. Despite those bankruptcies and companies
with idling production lines or even permanent closures of their production facilities, the
number of new entrants to the field, notably large semiconductor, construction or ener-
gy-related companies, is remarkable and makes a reasonable forecast for future capacity
developments very speculative.
Nevertheless, the general trend still is pointing in the direction of more capacity an-
nouncements despite the existing excess capacity. However, it is important to recall that

3
 Exchange rate 2018: EUR 1.00 = USD 1.15
4
 Exchange rate 2013: EUR 1.00 = USD 1.30

 7
the existing excess capacity is different in the four main parts of the silicon module value
chain, i.e. (1) polysilicon production, (2) wafer production, (3) solar cell manufacturing,
(4) module manufacturing. According to Bloomberg New Energy Finance (BNEF) the
group of Tier 1 module manufacturers have a production capacity of 139 GW in in 3Q
2019 [Blo 2019a].
Despite the continuing problems of individual companies, the fundamental industry as a
whole remains strong and the overall PV sector will continue to experience significant
long-term growth. The IEA's Renewable Energy Market Report 2019 forecasts world-wide
a new installed photovoltaic power capacity between 720 and 880 GW between 2019 and
2024 [IEA 2019b].
For 2019, the world market predictions vary between 95 GW according to Solar Power
Europe’s low scenario and 142 GW in the Q3 BNEF Global PV Market Outlook [Blo 2019a,
Sol 2019]. The same sources predict a range between 94 GW and 152 GW in 2020.
The current solar cell technologies are well established and provide a reliable product,
with a guaranteed energy output for at least 30 years.
This reliability, the increasing demand for electricity in emerging economies and possible
interruptions due to grid overloads there, as well as the rise in electricity prices from
conventional energy sources, all add to the attractiveness of PV systems.
About 95 % of current production uses wafer-based crystalline silicon technology. Pro-
jected silicon production capacities for 2019 vary between 524 000 tonnes [Blo 2019] and
703 000 tonnes [Ikk 2019]. It is estimated that about 30 000 tonnes will be used by the
electronics industry. Potential solar cell production will, in addition, depend on the mate-
rial used per Wp (grams per Watt-peak). The blended global average was about 3.5 g/Wp
in Q3 2019. According to the International Technology Roadmap for Photovoltaic polysili-
con material consumption is expected to drop to values between 2.1 and 2.6 g/W in 2029
[Itr 2018].
In general, global CAPEX for PV solar systems have converged, even if significant differ-
ences still exist due to differences in market size and local competition and factors like
import taxes, local content rules or existing tax credits. In the 1st half year (H1) 2019,
the BNEF global benchmark for levelised cost of electricity (LCOE) in the solar sector was
given with USD 57 per MWh a decrease of about 18% compared to 2018 [Blo 2019b].
The cost share of solar modules in the benchmark PV system has dropped below 30 %.
The influence of CAPEX on LCOE of solar PV electricity has decreased significantly and
other costs like O&M (operations and maintenance) costs, permits and administration,
fees and levies as well as financing costs play a more dominant role. Therefore, these
variable and soft costs must be targeted for further significant cost reductions.
In countries with a developed electricity grid infrastructure, the increasing shares of PV
electricity in the grid lead to a growing importance of the economics of integration.
Therefore, more and more attention is focused on issues such as:
 ● development of new business models for the collection, sale and distribution of PV
 electricity, e.g. development of bidding pools at electricity exchanges, virtual
 power plants with other renewable power producers, and storage capacities;
 ● adaptation of the regulatory and legal procedures to ensure fair and guaranteed
 access to the electricity grid and market.
The technical challenges are different ones in countries with a weak electricity grid or
where not all citizens have access to electricity at all. The access to electricity and the
design of new electricity infrastructure should be based no longer on the dependence of
classical centralised power generation units, but use the new available technology op-
tions of decentralised renewable power generation sources like photovoltaics. The smart
use of the locally available mix of different renewable energy sources as well as demand
and supply side management has to be an integral part of every energy plan to avoid
stranded investments in the future.
The cost of direct current (DC) electricity generated by a PV module has dropped below
EUR 0.02/kWh in many places world-wide, although a significant additional cost compo-

 8
nent relates to transporting the electricity from the module to where and when it is
needed. Therefore, new innovative and cost-effective electricity system solutions with PV
as an integral part of sustainable energy solutions are needed now. The optimisation of
solar PV electricity plant design and operation has direct effect on the O&M costs, which
play an important role for the economics of the PV installation. With the continuous de-
crease of hardware CAPEX, the non-technical costs, linked to permit applications and
regulations are representing an increasing share of the total costs and need to be re-
duced as well.

 9
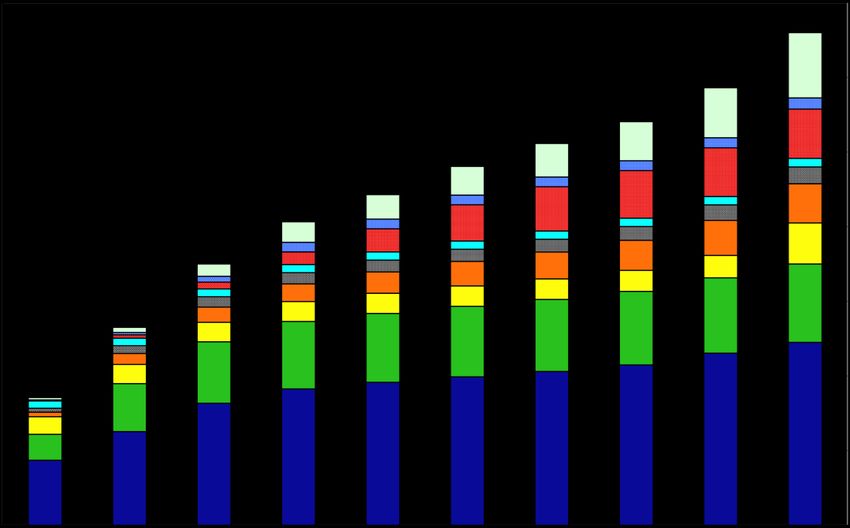
2 The PV Market
Annual new solar PV system installations increased from 29.5 GW in 2012 to 107 GW
world-wide in 2018, driven by a shift to more large scale utility systems on the one hand
and a worldwide reduction of PV system prices on the other side (Fig. 3). The annual in-
stallation in 2018 was about 5% higher than in 2017, increasing the world-wide PV power
to almost 520 GW at the end of 2018.
This development represents the grid connected PV market. To what extent the off-grid
and consumer product markets are included is not clear, because these markets are very
difficult to track. However, these segments have become smaller and smaller in relative
terms.

 Uncertainties in market statistics
 ● The installation figures of this report are about the physical installation of
 the system hardware, not the connection to the grid. The grid connection
 can be delayed due to administrative reasons or in some cases missing grid
 capacity.
 ● If not specifically indicated, this report uses nominal DC peak power (Wp)
 under standard test conditions (1 000 W irradiance, air mass 1.5 light spec-
 trum and 25 ºC device temperature) for reasons of consistency.
 ● Not all countries and press releases report DC peak power (Wp) for solar PV
 systems. Especially for larger scale system the utility peak AC power is
 used, which is relevant for the transmission operator. Even in the Eurostat
 and IRENA statistics the two capacities are sometimes mixed.
 ● Some statistics only count the capacity which is actually connected or
 commissioned in the respective year for the annual statistics, irrespectively
 when it was actually installed. This can lead to short term differences in
 which year the installations are counted and the annual statistics, but levels
 out in the long-run, if no double counting occurs. E.g.:
 (1) in Italy about 3.5 GW of solar PV systems were reported under the sec-
 ond conto energia and installed in 2010, but only connected in 2011;
 (2) the construction period of some large solar farms spread over two or
 more years. Depending on the regulations – whether or not the installation
 can be connected to the grid in phases and whether or not it can be com-
 missioned in phases, the capacity count is different.
 ● Some countries do not have official statistics on the capacity of solar PV
 system installations or sales statistics of the relevant components.

Since 2015, China is the country with the largest PV power capacity. In 2017, China also
overtook the European Union in terms of total installed PV power capacity. With over
44 GW of new connected PV system capacity it reached a total PV power capacity of
175 GW or 34% of the 518 GW solar PV electric power capacity installed worldwide at the
end of 2018. The European Union follows with a cumulative installed PV power of 117 GW
or 23% of global capacity. This is down from the 66% share in 2012, when the cumula-
tive installed solar PV electric power had just reached 100 GW world-wide.

 10
Figure 3: Cumulative PV system installations from 2010 to 2019 estimates

 700

 Rest of EU Bracket represents the EU share
 Cumulative Installed PV Power [GWp]

 600
 France
 United Kingdom
 500
 Italy
 Germany
 400 Rest of World
 India
 300 China
 United States
 200 Japan

 100

 0
 2010 2011 2012 2013 2014 2015 2016 2017 2018 2109con2019opt
 Year
 Source: [IEA 2019b, Sol 2019, Sys 2019] and own analysis

 Figure 4: Annual PV installations from 2010 to 2019 estimates

 160
 Rest of EU
 France Bracket represents the EU share
 140
 United Kingdom
Annual Installed PV Power [GWp]

 120 Italy
 Germany
 100 Rest of World
 India
 80
 China
 United States
 60
 Japan

 40

 20

 0
 2010 2011 2012 2013 2014 2015 2016 2017 2018 2019con 2019opt
 Year
 Source: [IEA 2019b, Sol 2019, Sys 20198] and own analysis

 11
2.1 EUROPE, THE RUSSIAN FEDERATION AND TURKEY

Since the first European Renewable Energy Directive went into force in April 2009 grid-
connected solar photovoltaic (PV) systems in the European Union have increased tenfold
from 11.3 GW at the end of 2008 to over 117 GW at the end of 2018 [Jäg 2018].
Just before the COP meeting in Katowice in December 2018, the European Commission
published its Vision for 2050, A Clean Planet for all, in which it was outlined that the use
of renewable energy sources has to exceed 60% by 2050 to reach an average of 1.5ºC or
net zero emissions [EC 2018].
Already the 2016 European Commission (EC) initiative "New Deal for Energy Consumers:
Empowering Consumers, Developing Demand Side Response; using smart technology;
linking Wholesale and Retail Markets; Flanking Measures to Protect Vulnerable Custom-
ers" listed as one of the options the right to self-generate and consume self-produced
electricity [EP 2016]. This right is now part of the new renewable energy directive, which
was published on 21 December 2018 [EU 2018].
In the political guidelines for the next European Commission 2019 – 2024, the president
elect Ursula von der Leyen, pledged on 16 July 2019, to present a green deal in her first
100 days in office [Ley 2019]. She outlined her ambition for a more rapid cut in GHG
emissions and wants to reduce emissions by at least 50% in 2030. For 2021 it is planned
to present a plan towards a 55% reduction target by 2030.
Due to different energy policies, regulations and public support programmes for renewa-
ble energies in the various countries, market conditions for PV differ substantially. Be-
sides these policy driven factors, the varying grades of liberalisation in the domestic elec-
tricity markets as well as the maturity of the PV market and local financing conditions
have a significant influence on the economic attractiveness of installing PV systems.
Looking at the electricity system as a whole, a total of about 21.7 GW of new power gen-
eration capacity were installed in the EU last year and 3.3 GW were decommissioned, re-
sulting in 18.4 GW of new net capacity (Fig. 5) [Ago 2019, Sys 2019, Win 2019, own
analysis]. Renewable energy sources (RES) accounted for 20.7 GW or 95.4 % of all new
power generation capacity. PV electricity generation capacity accounted for 9 GW, or
42 % of the new installed capacity.

Figure 5: New connected or decommissioned electricity generation capacity in the EU in 2018

 Installed Capacity
 Coal
 Decommissioned Capacity

 Fuel Oil

 Gas

 Hydro

 Biomass

 PV

 Wind

 -2 0 2 4 6 8 10 12
 [GW]
 Source: [Ago 2019, Sys 2019, Win 2019] and own analysis

 12
In terms of new net capacity, wind power was first with 9.7 GW, followed by solar PV
9 GW, biomass plants with 1.1 GW, hydro 0.4 GW and natural gas with 0.3 GW. The net
installation capacity for coal- and oil-fired power plants was negative, with a decrease of
1.5 GW and 0.7 GW, respectively.
With a cumulative installed capacity of over 117 GW (Fig. 6), the EU has further lost
ground in the worldwide market. The European Union accounted for 23% of the global
total of 518 GW of solar PV electricity generation capacity at the end of 2018. This is a
steep decline from the 66 % recorded at the end of 2012. The installed PV power capaci-
ty in the EU at the end of 2018 can generate around 130 TWh of electricity or about
4.8 % of the final electricity demand in the Union.

 Figure 6: Grid-connected PV capacity in EU

 140
 Rest of EU
 Cumulative Photovoltaic Power [GWp]

 Greece
 120 United Kingdom
 Czech Republic
 Belgium
 100 France
 Spain
 Italy
 80 Germany

 60

 40

 20

 0
 2010 2011 2012 2013 2014 2015 2016 2017 2018 2019e

 Source: [Sol 2019, Sys 2019] and own analysis

At first glance, this development looks like a success. However, analysing the annual in-
stallations, it becomes obvious that between 2011 and 2017 Europe’s share was not only
declining in relation to a growing market worldwide, but also in actual installation figures
(Fig. 7). After its peak in 2011, when PV installations in the EU accounted for 70% of
worldwide installations, six years of market decreases and stagnation followed. This trend
was finally reversed when the PV market in the European Union increased almost 50%,
from about 6 GW in 2017 to about 9 GW in 2018. The increase was due to stronger than
expected markets in Germany (3.1 GW), the Netherlands (1.4 GW), France (>1 GW),
and Hungary (>0.5 GW).
After five years of very little new PV power additions in Spain, 2019 saw some change. In
July 2017, the Spanish Ministry for Energy and Tourism [GoS 2017] announced the win-
ners of the second renewable energy auction and solar photovoltaic power projects had
won 3.9 GWAC (~ 5 GWDC) in this auction. The winning consortia have to connect the sys-
tems before the 1 of January 2020.

 13
Figure 7: Annual PV installations in EU

 20
 Rest of EU
 18 Greece
 Annual Photovoltaic Installations [GWp]

 United Kingdom
 16 Czech Republic
 Belgium
 14 France
 Spain
 Italy
 12 Germany

 10

 8

 6

 4

 2

 0
 2010 2011 2012 2013 2014 2015 2016 2017 2018 2019e

 Source: [Sol 2019, Sys 2019] and own analysis

An increase in Europe's ambition to reduce GHG emissions by 2030 requires more re-
newables for an accelerated carbon free electrification. A shift from fossil based electricity
generation to non-combustible renewable electricity generation, i.e. hydro, solar and
wind, will reduce the total primary energy demand (TPED) by a factor of two to three,
thus increasing the overall energy efficiency.
The New Energy Outlook (NEO) 2018 by Bloomberg New Energy Finance forecasts a
slight electricity demand increase in Europe (EU-28, Island, Norway and Switzerland)
from 3 454 TWh in 2017 to 3 566 TWh in 2030. The increase is driven by the increased
use of electric vehicles (EV) and partly compensated by progress in energy efficiency [Blo
2018b]. This is in line with the estimates for the European Union that the net electricity
generation will be around 3 400 TWh in 2030.
In order to achieve the 50 to 55% GHG reduction target pledged by Ms von der Leyen,
what PV capacity would be needed until 2030? To answer this question, two scenarios
from the analysis of the Commission Communication "A European long-term strategic
vision for a prosperous, modern, competitive and climate neutral economy" were used
[EC 2018a].
The first one is the baseline scenario, which should reach a GHG reduction of 65% by
2050. The cumulative solar capacity of this scenario would be 441 GWDC. The second
scenario is the 1.5TEC one, which would achieve a 57% reduction by 2035 with a GHG
reduction of 80% in the power sector. To achieve this reduction in the power sector a PV
capacity of 825 GWDC would be needed. This is of course a simplified picture as all the
different scenarios include a wide range of technology options and technology adaptation
assumptions. However, solar photovoltaic electricity generation is one of the few technol-
ogies ready and scalable now. In Figure 8 it is shown how the installed PV capacity would
have to develop to reach these capacities in 2030.
For 2019 new photovoltaic power capacity of 14 to 15 GW is expected in the European
Union, increasing the total to about 130 GW by the end of the year. To reach the scenar-
io targets a 14% CAGAR is needed for the baseline and 18.5% CAGAR for the 1.5TEC
scenario. This corresponds to roughly a fourfold increase of the market between 2019
and 2030 in the baseline and an eightfold increase in the 1.5TEC scenario. More details
can be found in a recent study [Jäg 2019a].

 14
Figure 8 shows the actual and projected PV installations under the current market condi-
tions and those installations needed to achieve the baseline or the 1.5TEC scenario. The
current market conditions seem not sufficient to meet the targets.

 Figure 8: Actual and projected photovoltaic installations from 2010 to 2030

 900

 800 Capacity installed

 700
 Forecast current installation trend
Installed PV power [GW]

 600
 Capacity needed for EU Baseline
 500
 Capacity needed for EU 1.5TECH
 400

 300

 200

 100

 0
 2010 2012 2014 2016 2018 2020 2022 2024 2026 2028 2030
 Year

The following sections describe market development in some EU Member States, as well
as in Switzerland, the Russian Federation, Ukraine and Turkey. Not all EU Member States
are covered in this report due to either small markets or limited changes in the market
development.

2.1.1 Austria
In 2018, Austria installed about 170 MW of new PV systems and increased the cumula-
tive capacity to 1.44 GW. The electricity generation from PV systems was 1.44 TWh or
2.4% of the national electricity production in 2018.
The Ökostrom-Einspeisetarifverordnung 2012 (Eco-Electricity Act) is the regulation that
sets the prices for the purchase of electricity generated by green power plants. In addi-
tion, there is a federal investment subsidy programme for PV systems with different siz-
es. For each of these categories a limited budget is available. In 2019, the investment
costs of PV systems below 100 kWp are supported with a maximum of EUR 250/kWp and
EUR 200/kWp for systems between 100 and 500 KWp. Greenfield systems (on agricultur-
al land) are not eligible. Storage systems can be supported with a maximum of EUR
500/kWh and up to a maximum of 10 kWh/kWp installed.
In addition to these federal programmes, five federal states have their own PV pro-
grammes and four states have programmes to support the installation of electricity stor-
age.
In June 2017 the Eco-Electricity Act was changed. For 2018 and 2019 an additional
budget of EUR 15 million each year to support PV systems and electricity storage was
agreed [BGB 2017].
At the end of May 2018, the Austrian Government approved the new Climate and Energy
Strategy – "mission 2030" – for Austria [GoA 2018]. The main issues concerning photo-
voltaics are:

 15
Increase the share of renewables in final energy consumption to 45-50% by 2030. This corresponds to about 80 TWh of electricity or 30 TWH more than today from hydro, solar and wind. In 2030 renewable electricity production should cover 100% of electricity con- sumption. Investment support programme for "100,000 rooftops with local storage". Removal of all taxation on self-generation, currently exempted up to 25 MWh. Change incentives to a combination of feed-in premiums, auctions and investment incentives. According to a study by the Energy Economics Group of the Technical University of Vien- na, the installed PV capacity to realise "mission 2030" should be in the range of 14 to 15 GW by 2030 , a more than 10-fold increase compared to 2017 [Haa 2017]. 2.1.2 Belgium The three Belgian regions (Brussels, Flanders and Wallonia) have individual support schemes for PV, but one electricity market. Therefore, some regulations are regional and others are national. A common denominator is the fact that all three regions selected an renewable portfolio standard (RPS) system with quotas for RES. A net-metering scheme exists for systems up to 5 kWp Brussels or 10 kWp (Flanders and Wallonia) as long as the electricity generated does not exceed the consumer’s own electricity demand. In 2011, Belgian installations peaked with over 1 GW of new systems, before starting to decline in 2012. At the end of 2018, cumulative installed capacity was over 4.25 GW with about 370 MW installed in that year. About 10 % of Belgian households are already gen- erating their own PV electricity, and PV power supplied 3.6 TWh or 4.4 % of the country’s net electricity production in 2018. The proposal of the Belgium Parliament for a new Energy Pact 2050 was published in January 2018 [BKV 2018]. The main issues concerning photovoltaics are: Gradual phase-out of Belgium’s 6 GW of nuclear capacity between 2022 and 2025 and increase of renewables in the power supply to 40% by 2030 (8 GW of PV, 4.2 GW onshore wind and 4 GW offshore wind). Increase of renewables in the power supply to 100% by 2050. 2 GW of large-scale storage and 3 GW of distributed small-scale storage. The Belgian grid operator Elia published three scenarios for the Belgian electricity supply indicating that total PV power could be in the range of 5 to 11.6 GW by 2030 and in the highest scenario could go up to 18 GW by 2040 [Eli 2017]. To reach the 2030 targets of the Energy Pact, the present market size of about 370 MW only has to increase slightly over the next 12 years. 2.1.3 Denmark In 2018 about 180 MW were installed increasing the total capacity to over 1.1 GW. PV systems generated 953 GWh or 2.8% of the Danish electricity in 2018. At the end of November 2016, the German Bundesnetzagentur announced the results of the first cross boarder auction with Denmark: five bids, all of them from Denmark and to be built there, totalling 50 MW won at a price of 5.38 cents per kilowatt hour (EURct/kWh) [Bna 2016]. The results of the first Danish cross border auction in Decem- ber 2016 revealed even lower prices. The 9 winning tenders will get a fixed premium of 12.89 Danish øre per kWh (EUR 17.32/MWh) for 20 years on top of the Danish spot mar- ket price, which is fluctuating in the range of EUR 30 to 40/MWh [Ene 2016]. In 2017, the Danish government decided to have a tender for PV systems smaller than 1 MW in 2018 and a joint tender for solar and wind power in 2018 and 2019 [Ene 2018a]. The support scheme was approved by the European Commission in August 2018 [EC 2018b]. In December 2018, the Danish Energy Agency announced the six winning bids of the 2018 technology neutral tender [Ene 2018b]. Three solar photovoltaic pro- 16
jects with a combined capacity of 104 MW and bids for tariff premiums between
DKKøre 2.84 and 2.98 per kWh (EURct5 0.38 and 0.40 per kWh) were selected.
In February 2019, Better Energy announced the signature of a 125 MW commercial Pow-
er Purchase Agreement (PPA) in Denmark [Bet 2019]. The PV plant is scheduled to be
operational in 2020.

2.1.4 France
In 2018, 873 MW of new PV systems were connected to the grid in France [Rte 2019].
Total cumulative connected capacity in mainland France and Corsica increased to over
8.5 GW. In addition, total capacity in the French Overseas Departments stood at about
390 MW [Sta 2019]. Electricity production (continental France and Corsica) from PV sys-
tems was 10.2 TWh or 2.1 % of the national electricity consumption [Rte 2019].
On 22 July 2015, France’s National Assembly adopted the Energy Transition for Green
Growth Act. The legislation aims to reduce France’s reliance on nuclear to 50 % of power
generation by 2025 and increase the share of renewable energies in the final gross ener-
gy consumption to 23 % in 2020 and 32 % in 2030 [MEE 2016].
The targets for PV to achieve the 2023 goal are 10.2 GW installed PV power by 2018 and
between 18.2 and 20.2 GW by 2023. Under the new support mechanism, feed-in tariffs
are only available for systems below 100 kW capacity and tenders for systems above.
However, there is still a difference for the larger systems: Systems between 100 and
500 kW bid for fixed tariffs, larger systems for a market premium. In the first half of
2018 PV systems with a capacity of 479 MW were connected to the grid [Sta 2018]. The
capacity of projects in the planning stage increased to 6 GW, of which 2.5 GW already
had a signed connection agreement.
In 2016, the mandatory introduction of smart meters started and should be completed by
2021. This measure provides an indirect support measure for small self-consumption sys-
tems, because it removes the grid connection costs. These costs were in general more
than 12% of the price of a 3 kW system.

2.1.5 Germany
Compared to 2017, new PV system installations in Germany saw an increase of almot
80% to 3.14 GW, with about 760 MW free-field systems as a result of previous auctions
[Bun 2019]. About half of new PV systems are now being combined with electricity stor-
age systems. For the first 8 months of 2019 the Bundesnetzagentur reported the regis-
tration of PV projects with 2.7 GW.
The German market growth is directly correlated to the introduction of the Renewable
Energy Sources Act (Erneuerbare Energien Gesetz EEG) in 2000 [EEG 2000]. This law
introduced a guaranteed feed-in tariff (FiT) for electricity generated from solar PV sys-
tems for 20 years and already had a fixed built-in annual reduction which was adjusted
over time to reflect the rapid growth of the market and corresponding price cuts. Howev-
er, the rapid market growth required additional adjustments. Until 2008, only estimates
of installed capacity existed, so a plant registrar was introduced on 1 January 2009.
Since May 2012, the FiT has been adjusted on a monthly basis depending on the actual
installation of the previous quarter. The revision of the EEG in 2014 changed the system
size for new systems eligible for a feed in tariff and introduced levels of levies on self-
consumption [EEG 2014]. So far systems with a capacity of less than 10 kWp are except-
ed form the levy. For all other systems, the levy on each self-consumed kWh increased
to 40% on 1 January 2017.
Since 1 September 2015, owners of new ground mounted systems have to participate
and win an auction of the Federal Network Agency. The total amount of capacities auc-
tioned is determined by political decisions and limits this market segment.
Starting on 1 January 2016 only systems smaller than 100 kWp are eligible for a fixed
feed in tariff and since then also larger rooftop systems have to market their electricity or

5
 Exchange rate: 1 EUR = 7.46 DKK

 17
take part in auctions. The relevant feed-in-tariffs are regularly published by the Bundes-
netzagentur.
The fact that the tariff for residential PV systems smaller than 10 kWp (October 2019:
EUR 0.1018/kWh) is now well below the average variable electricity rate consumers are
paying (EUR 0.267- 0.331/kWh) and the fact that they are still exempt from the EEG levy
makes self-consumption attractive and opens up new possibilities for the introduction of
local storage. Since July 2017 a programme to support self-consumptions for tenants of
multi apartment buildings exists, but until September 2019 only about 435 PV systems
with 9.5 MW cumulative power were installed [Bna 2019].
Between May 2013 and December 2018, the Kreditanstalt für Wiederaufbau (KfW) has
been offering low interest loans to install storage for PV systems up to 30 kWp [KfW
2013, 2016].

2.1.6 Greece
In 2009, Greece introduced a FiT scheme which started slowly until the market accelerat-
ed from 2011 until 2013, when 425 MW, 930 MW and more than 1 GW of new PV system
capacity was installed respectively. This boom ended on 10 May 2013, when the Greek
Ministry of Environment, Energy and Climate Change (YPEKA) announced retroactive
changes in the FiT for systems larger than 100 kWp and new tariffs for all systems from
1 June 2013. During the first five months of 2013 almost 900 MW were installed and in-
creased the total cumulative capacity to over 2.5 GW. About 2.4 GW were installed in the
Greek mainland and the rest on the islands. Since then only a few tens of MW have been
installed.
The Greek Operator of the Electricity Market (ADMIE) reported about 2 140 MW of in-
stalled grid-connected PV systems over 10 kW and 351 MW of rooftop PV systems up to
10 kW at the end of December 2018 [Adm 2019]. These figures do not include the in-
stalled capacity of non-interconnected Greek islands, which — according to the Hellenic
Electricity Distribution Network Operator SA — was 166 MW in March 2019 [Hed 2019].
In total about 46 MW of new PV capacity was installed in 2018.
After the European Commission approved the new auction scheme on 4 January 2018
[EC 2018c], the first renewables auction in Greece was held on 2 July 2018. Since then
three additional auctions were held, which resulted in an allocated PV capacity of about
700 MW.
In the July 2019 auction the average PV tender tariff was €0.06278/kWh, a solar electric-
ity price 9.37% lower than the starting level of €0.06926/kWh.

2.1.7 Hungary
The Hungarian National Renewable Action Plan required by the EU Renewable Energy Di-
rective (2009/28/EC) foresees to reach a renewable energy share of 14.65% of its gross
energy consumption by 2020. As a consequence of not meeting the trajectory set out in
the NREAP a new supporting scheme for electricity generation from RES was adopted in
June 2016.
The existing mandatory take-off system, guaranteeing a fixed price per kWh generated,
was phased out on 31 December 2016. However, all project owners, who had submitted
their application before this deadline, were still eligible for this scheme.
In July 2017 the European Commission approved the new renewable support scheme
(METÁR) [EC 2017]. For systems with a capacity below 500 kW a feed in tariff (FiT) and
for systems between 500 kW and 1 MW a feed-in premium (FiP) will be set at the begin-
ning of each year. The approved internal rate of return (IRR) used to calculate the level
of the FiT and FiP and the duration of support is 6,94 %. Systems above 1 MW are eligi-
ble for a competitive FiP determined by a bidding procedure.
In the first half of 2018, METÁR, which finally came into force October 2017, already had
some turbulences, when the government unexpectedly brought forward the application
deadline for projects of 50 - 500kW to 26 April 2018, whereas in the original government

 18
You can also read