Real Estate Focus a b - Chief Investment Office WM 2018 - UBS
←
→
Page content transcription
If your browser does not render page correctly, please read the page content below

ab

Real Estate
Focus
Chief Investment Office WM
2018
Editorial
     Dear reader,

     To this day, spinach enjoys the reputation of being a miraculous source of iron.
     For this reason, generations of children have been and still are repeatedly
     forced to eat the green leafy stuff. This myth is based on an error, the origin
     of which goes back over 100 years. A scientist at that time is said to have made
     a mistake with the decimal point, which attributed to the vegetable ten times
     its actual iron content. The iron content of spinach is a prime example of an
     error that has been disseminated without challenge and thus has become
     taken for granted.

     The debate surrounding fully autonomous vehicles and their impact on the
     real estate market shows some parallels with the spinach legend. In this case,
     it is not a matter of the undisputed iron content of such vehicles, but rather
     the one-sided manner in which the debate is being conducted. As in the case
     of the iron content of spinach, hardly a single analysis allows for any doubt
     that we will soon be traveling around in fully autonomous vehicles. It is beyond
     question that the assistance systems are becoming ever more sophisticated,
     thanks to technological advances. But in reality, it is still far from certain
     whether and, if so, how private road transport can be fully automated. The
     visionaries also seem be in agreement about the impact of fully autonomous
     vehicles on the property markets, advising us to align our real estate invest-
     ments accordingly as of now. A recommendation which is in our opinion (still)
     being made on shaky grounds.

     The special theme of this year’s UBS Real Estate Focus does indeed deal with
     tomorrow’s mobility and its consequences for the property markets. But so that
     in facing today’s challenges you don’t have to consume a regular ration of
     spinach like the cartoon figure Popeye, we have also focused again this year on
     the market trends which are currently the most important ones for you.

     We hope you find this an engaging read.

     Claudio Saputelli                         Daniel Kalt
     Head Global Real Estate                   Chief Economist Switzerland

                                                                                   UBS Real Estate Focus 2018   3
Content

                                                 6                                  12
    UBS Real Estate Focus 2018
    This report has been prepared by
    UBS Switzerland AG. Please see the
                                                 Mobility                           Residential
    important disclaimer at the end of the
    document. Past performance is not an
    indication of future returns. The market
    prices provided are closing prices on the
    respective principal stock exchange.

    Publisher
    UBS Switzerland AG
    Chief Investment Office WM
    P.O. Box, CH-8098 Zurich

    Editor in Chief
    Elias Hafner

    Editor
    Andrew DeBoo

    Editorial deadline
    11 January 2018

    Translation                                  6   Change in mobility             12 Condominiums and single-family
    24translate GmbH, St. Gallen                     Not a game changer                homes
                                                                                       Footprints keep shrinking
    Desktop publishing
    Margrit Oppliger                             8   Accessibility
    Werner Kuonen                                    Access to activities is key    16 Apartment buildings
                                                                                       No longer at any price
    Photos
    Manuel Stettler Fotografie, Burgdorf         10 Autonomous cars
                                                    Revolution in the real estate   20 Mortgages as an asset class
    Cover photo
                                                    market?                            More money from institutional
    Community hall, Männedorf
                                                                                       investors
    Printer
    galledia ag, Flawil, Switzerland
                                                                                    23 Investment crowdfunding
    Languages                                                                          Higher returns with higher risk
    English, German, French, and Italian

    Contact
    ubs-cio-wm@ubs.com

    Order or subscribe
    UBS clients can subscribe to the print
    version of UBS Real Estate Focus via their
    client advisor or the Printed & Branded
    Products mailbox:
    sh-iz-ubs-publikationen@ubs.com

    Electronic subscription is also
    available via Investment Views on the
    UBS e-banking platform.

    SAP-Nr. 83518E-1801

4   UBS Real Estate Focus 2018
26                                 38                                  42
Commercial                         Listed                              Global

26 Retail space                    38 Real estate equities and funds   42 UBS Global Real Estate
   Shopping malls reinvent            Not cheap                           Bubble Index
   themselves                                                             Superstars or bubbles?

29 Office space                                                        46 Global market for direct
   Prices (still) correcting                                              real estate investments
                                                                          Where opportunities still reside
32 Hotel investments
   Potential in the cities                                             49 Impact of long-term
                                                                          investment themes on global
35 Parking garages as investment                                          real estate markets
   properties                                                             Existing properties could
   Niche strategy without extra                                           depreciate faster
   yield

                                                                       54 Overview and forecasts

                                                                                     UBS Real Estate Focus 2018   5
Change in mobility

                  Not a game changer

                  Claudio Saputelli
Mobility

                                         Worldwide urbanization is continuing inexorably, and demand
                                         for mobility is keeping pace. New solutions are needed to keep
                                         limited traffic capacity from curbing economic growth. Property
Residential

                                         values will only rise in regions that “move closer” from a time
                                         perspective.

                  The United Nations predicts that two thirds of        Intelligent mobility solutions more urgent
Commercial

                  the world’s population will call a city home by       than ever
                  2050. A century ago, only 30% of people were          Current capacity constraints can partly be
                  urban dwellers. Urbanization has made great           blamed on urban development since the post-
                  strides in Western countries. At the end of           war period, in which cars came to dominate cit-
                  2015, for example, around 84.5% of Swiss resi-        ies. To counter this one-sidedness, it is necessary
                  dents lived in urban areas, compared to less          to apply a more granular understanding of
                  than half the population in emerging and devel-       urban mobility and planning. Ideally, the car
Listed

                  oping nations.                                        monoculture, in which cars in downtown areas
                                                                        are usually stuck in traffic jams or parked in
                  Urbanization and economic progress go hand in         space-hogging lots, will be replaced by a
                  hand. Productivity increases when people live         broader menu of mobility alternatives where
                  and work in cities. Also, cities can supply public    public transit, non-motorized options – such as
                  services more cheaply (such as electricity, water,    pedestrian zones and bicycle lanes – and poten-
Global

                  wastewater services, gas and telecommunica-           tially driverless cars (see page 10) will change
                  tions). Urbanization and the emergence and            how people get around.
                  development of metropolitan areas are essential
                  for economic growth and, ultimately, for pros-        No change in daily travel time budget
                  perity.                                               Urban and development planning is highly com-
                                                                        plex, but the consequences of future mobility
                  Mobility is key to efficiency                         plans can be demonstrated quite simply using a
                  For an economy to reap the full benefits of its       constant travel time budget. Cesare Marchetti
                  workforce’s potential, people have to be free to      described this budget in 1994, positing that
                  move quickly and independently in its metropo-        people in different countries and cultures do
                  lises. The challenges begin here. In 2013, two        not change their average commute times over
                  thirds of total mobility was concentrated in          decades (Marchetti’s constant). This observation
                  urban areas. If infrastructure development fails      is based on an intriguing trend: people’s travel
                  to keep pace with current population trends,          time budgets do not decrease even as faster
                  people will spend more time sitting in city traf-     travel options emerge. In France, for example,
                  fic. Traffic disruptions are already serious today.   the average travel speed has increased 3% a
                  With demand for mobility expected to triple by        year on average in the past 200 years. In other
                  2050, urban planners could face a nightmare           words, when transportation gets faster, com-
                  scenario of widespread traffic gridlock, with all     muting distances get longer.
                  the negative social and economic consequences
                  that entails.

              6   UBS Real Estate Focus 2018
Hans Wilsdorf Bridge, Geneva
“Despite the upcoming mobility
changes, demand for urban real estate
will remain high.”
Impact on the real estate market Third, mobility concepts of the future – particu-
larly driverless cars designed to reduce perceived
No convergence of urban and rural prices travel time – will not reduce the difference
Marchetti’s constant is one of the most stable between property prices in city centers and
mobility indicators around. On work days, com- peripheral regions, particularly outside the travel
muters travel an average of 70 to 90 minutes in time budget. The unique diversity of mobility
the countries examined. So what are the impli- offerings, the availability of innumerable ser-
cations for the real estate market? vices and the dense concentration of knowl-
edge will always make major centers more
First, demand will remain high for real estate appealing than rural areas. In addition, major
markets in urban centers and metropolitan centers within Marchetti’s constant offer access
areas within the travel time budget, even if the to jobs in other (global) major centers thanks to
nature of mobility changes, as long as attractive airports and direct rail connections.
jobs are concentrated in cities.
Second, property values will rise in regions that
have “moved closer” to workplaces as a result
of mobility improvements or major traffic infra-
structure projects. This trend will drive urbaniza-
tion.
UBS Real Estate Focus 2018 7Accessibility
Access to activities
is key
Claudio Saputelli
Mobility
Most Swiss locations are highly accessible, by both national
and international comparison. Real estate prices are generally
higher in centrally located regions with equally easy access via
Residential
public and private transportation. New traffic infrastructure
cannot always affect prices, however.
Commercial
Transportation accessibility is important for the
attractiveness of regions as places for people to
More accessible, not just
live and for companies to be based. Highly more mobile
accessible regions, after all, have lower trans- “Mobility” is often confused with “accessibility.”
portation and time costs, and so are generally Mobility describes whether, how often and how
more productive and thus more competitive easily people, goods and services can move or be
than their less accessible counterparts. No won- transported. Accessibility, by contrast, is need
Listed
der traffic and development planners are so and destination-based. It focuses on the travel
focused on maintaining or improving accessibil- times, costs, options, comfort and risks associ-
ity over the long term. There are two ways to ated with access to key activity destinations
achieve this goal: the first is to locate activity (work, education, shopping and recreation).
destinations at or near residential areas, and the
second is to optimize transportation services When transportation systems are designed to
Global
and infrastructure. In prosperous countries like meet a community’s needs, their main function
Switzerland, these two approaches often go is to provide access to activity destinations at a
hand in hand. low cost and with the least effort possible. Trans-
portation and infrastructure policies should
Improvement in almost every region therefore focus on improving accessibility instead
Accessibility is good in Switzerland in general, of merely increasing mobility.
and in most of its towns and municipalities. This
holds true not only within Switzerland, but also
compared to other countries, as various studies accessible by private motor vehicle than they
report. Building more transportation routes has were several years ago, as factors such as high
improved accessibility, as have higher speed lim- population growth nationwide have led to
its, improvements to existing infrastructure (e.g. chronically congested thoroughfares.
increasing the number of connections) and
road-widening projects that have added extra Good accessibility bolsters the real estate
lanes. market
Good regional accessibility is reflected in local
The Gotthard Base Tunnel is the most recent property prices. However, it is impossible to
example of the large transportation infrastruc- quantify this effect exactly. There is no univer-
ture projects that have continuously boosted sally accepted definition or methodical
accessibility in Switzerland. In fact, according to approach for measuring accessibility, so it is
BAKBASEL, accessibility has improved in virtually often estimated based on simplified assump-
every region of the country since 2005, with tions. Nonetheless, a survey of national and
respect to both public transit and private motor- international studies can be distilled into four
ized transportation. The centers of large cities empirical findings on how accessibility affects
are the only exceptions; these are now less property prices.
8 UBS Real Estate Focus 2018Travel time to central business district
One big driver of property prices is “centrality,”
i.e. the travel time to the nearest central busi-
ness district and the related opportunity cost
(loss of potential benefits) of this time. Gener-
ally speaking, the farther away the central busi-
ness district, the lower the property prices.
However, other factors such as a town’s topo-
graphical location, supply and – particularly in
Switzerland – tax considerations can override
this effect and produce an entirely different out-
come.
Quality differences between public and private
transportation
Regions that can be accessed just as well with
public transit systems as with private transporta-
tion tend to have higher real estate prices than
regions with qualitative differences between
these two modes of transportation. Also, buyers
are willing to pay more for properties that are
easy to access with private vehicles than for
comparable properties that are more accessible
via public transportation. For that reason, prop-
erty prices tend to rise more in response to proj-
ects targeting private motorized transportation
than to projects to improve public transporta-
tion.
Travel time saved by transportation projects Prices rise as accessibility improves
Locations that are already highly accessible – Condominium prices (in CHF/m²) and accessibility (in minutes)*
like big Swiss cities – do not have much room
Municipalities Municipalities
for improvement. Even large transportation in Canton Zurich in Canton Geneva
projects can only lower travel times a little. 14,000
Smaller locations are a different proposition 13,000
entirely; they often harbor greater potential. As 12,000 Zurich Geneva
a result, property prices in more remote com- 11,000
muter locations tend to respond more to trans- 10,000
portation projects. 9,000
8,000
Regional development potential 7,000
Improved accessibility can stimulate the local 6,000
economy, encouraging home construction and 5,000
4,000
reviving the housing market. This does not hap- 0 20 40 60 0 20 40
pen automatically, though. Transportation infra-
structure projects can only contribute to eco- Travel time to Zurich Travel time to Geneva
nomic prosperity if the targeted region has
Tax rates relative to canton municipalities
untapped potential of its own, or if the project
connects it to a larger, more dynamic economic Low Medium High
center. * Average travel time with personal motor vehicle and public transportation to the respective centers;
population size class represented by circle size.
Source: FSO, TranSol, Wüest Partner, UBS
UBS Real Estate Focus 2018 9Autonomous cars
Revolution in the
real estate market?
Claudio Saputelli
Mobility
Fully autonomous vehicles – or rather, the technology for
them – are almost here. Unclear, however, is how autonomous
driving will actually work in a normal street environment.
Residential
Real estate investors betting on big changes in mobility behav-
ior are taking a huge risk.
Imagine a world where robotic cars whisk you example, passed a bill in April 2016 that puts
Commercial
from one place to the next. It is a much safer the ultimate responsibility for accidents on the
world thanks to intelligent control software, human sitting in the driver’s seat, if there is any
lightning-fast reactions, tireless attentiveness, doubt. As a result, drivers have no choice but to
better all-round visibility and strict adherence to constantly monitor the system, largely eliminat-
traffic laws. It is also a world without the stress ing the touted advantages of fully autonomous
and wasted time that comes from battling city vehicles.
traffic. Driverless cars pick you up at home and
Listed
transport you to your destination while you Technical reliability has been elusive too. None
work or, depending on the car’s features, catch of the current assistance systems work flaw-
up on sleep. It may sound utopic now, but it lessly. Road sign recognition – for example, the
could become everyday reality. With near technology that shows drivers the maximum
weekly newsbites about autonomous cars, the legal speed – regularly ceases to work when
automotive industry implies that these vehicles signs are dirty. Reading cameras are also partic-
Global
will start appearing in showrooms in only a few ularly prone to fail due to rain, ice or dirt, or
years’ time. when the sun is low.
Forecasts tell us that perceived travel times will Impact on property markets
shrink to virtually zero. As a result, motorists
will be willing to drive more frequently and Urban parking lots would be relocated
cover longer distances. Car movements will It is currently unclear whether, when and how
increase significantly too, as unoccupied vehi- autonomous vehicles will change how we get
cles roam around picking up passengers or per- around. That has not dammed the rise of
forming other activities. Also, large numbers of reports on how driverless vehicles are poised to
non-vehicle owners – the elderly, disabled, chil- completely disrupt property markets and force
dren, etc. – will likely adopt driverless cars. real estate investors to rethink their investment
strategies. They forecast the following big
Many questions remain unanswered changes if fully autonomous cars become a
Driverless cars are still a long way from becom- reality one day:
ing widespread though; too many hurdles still
lie ahead. The ethics of programming algo- Many people could decide to purchase trips in
rithms to resolve life-or-death questions, for an autonomous vehicle instead of owning one
example, is particularly difficult. People are wary or more cars. This would lower the demand for
of accepting actions taken by autonomous garages, parking spaces and driveways; existing
technology that may result in injury or death, space would be repurposed. Even large down-
even if autonomous technology has a better town parking garages would become obsolete,
track record statistically than human drivers. because autonomous cars would either be con-
Also, lawmakers have to establish the legal stantly running or parked in large, fully auto-
basis for the use of driverless cars. Germany, for matic parking systems on the city periphery.
10 UBS Real Estate Focus 2018Access roads to big apartment complexes, long term. Of course, real estate developers
offices and retail outlets would have to be rede- would be well advised to pursue flexible long-
signed to allow large numbers of people to get term development strategies even without
in and out of cars. Gas stations would also autonomous vehicles.
come in for change (Switzerland currently has
around 3,400), since autonomous cars would Optimistically, it will probably take a decade or
be maintained and filled up in fleets at central more before driverless cars become a reality and
locations. Travel patterns would alter as well. can be used anywhere, at any time and at least
The ability to relax and even sleep in autono- as safely as human-operated vehicles. Once that
mous cars would eliminate the need for travel- day arrives, another question will arise: How
ers to interrupt their trip and spend the night in many people will still drive themselves, either
hotels close to main traffic arteries. because they enjoy sitting behind the wheel or
do not trust the machine? Clearly, betting now
Betting on a vision of the future on a brick-and-mortar strategy fully aligned
The rise of fully autonomous vehicles is with autonomous vehicles is risky.
expected to revolutionize the property market,
which is why governments and real estate
developers are already being encouraged to
devise flexible long-term development strate-
gies. However, they are also being told that cit-
ies need even more parking capacity – at least
in the short term. The recipe for success is
therefore to build parking garages that can be
easily converted to retail or other uses over the
A long road to full automation
The 5 stages of motor vehicle automation
0 1 2 3 4 5
Unassisted Assisted Partially Highly Autonomous Driverless
automated automated
Driver only Driver
Driver does not can take No driver
has to take
have to operate the controls the controls
Driver does not pedals or if needed
have to operate steering wheel,
Driver drives pedals has a super-
visory function Vehicle
and steers Vehicle can performs
the vehicle accelerate,
Vehicle can all
decelerate, functions
accelerate, turn and
Driver’s Vehicle’s
Vehicle can decelerate minimize
tasks tasks
accelerate, and turn, driving risk
Vehicle can decelerate warns driver
Vehicle does accelerate and and turn early on
not have any decelerate
control functions
Source: mobilegeeks.de, UBS
UBS Real Estate Focus 2018 11Condominiums and single-family homes
Footprints keep
shrinking
Maciej Skoczek and Matthias Holzhey
Mobility
Single-family homes have gained ground over condominiums.
Stiffer competition with rental apartments is causing condo-
minium prices to stagnate. Urban concentration will slow new
Residential
construction of single-family homes, but will have little impact
on prices.
Commercial
Last year did not bring many new drivers for however, will likely stagnate since they face
the owner-occupied housing market. Mortgage stiffer competition from declining rents. Abso-
interest rates remained stable, population lute purchase price amounts continue to limit
growth dropped below 1%, and rental apart- financing availability, driving demand for small
ments became cheaper. Home prices, however, apartments and maintaining buyers’ willingness
rose slightly yet again in 2017. Condominium to pay for lesser-quality properties.
prices remained stable year-to-year, but prices
Listed
of single-family homes increased roughly 2%. Condominiums were in the lead
Prices for condominiums have risen faster than
Home prices expected to increase slightly those for single-family homes in the current real
The owner-occupied home market is mainly estate cycle. When adjusted for inflation, con-
buoyed by low mortgage rates. The cost of dominium prices in the available price indexes
owning your own home in Switzerland (interest increased an average of 2.4% a year over the
Global
costs, maintenance and provisions) is currently last 20 years, while those of single-family
around 15% lower than the cost of renting a homes climbed a mere 1.9%. Much of this dif-
comparable property. With loan-to-values at ference can be put down to three factors.
80%, the resulting return on equity is over 4%.
This situation is unprecedented, at least in the
current real estate cycle. Ten years ago, housing Parallel long-term price behavior
was a very popular investment: the cost of own-
ing a home exceeded the cost of renting by
in the two market segments
40%. This implies that investors expected prices Inflation-adjusted asking prices (index 2000 =100) and cumulative
difference in price change rates between condominiums and single-family
to increase at the time. In fact, purchase prices homes (in percentage points)
had to increase at least 2% each year to offset
the additional cost of ownership compared to 180
Condominiums
rental (which was exceeded). The current sav- 160 Single-family homes
ings, by contrast, provide a buffer against a 140
market correction: home buyers would still be 120
ahead financially if prices corrected by 0.5% 100
a year.
Difference in price increases (cumulative) –5 percentage points
This buffer is not expected to be exhausted in 15 +15 percentage points
2018. Home ownership costs will remain low; 10
the robust economy has bolstered demand for
5
homes. Home construction should also remain
at last year’s level, which was 15–20% lower 0
than in 2014. We expect single-family home 2001 2003 2005 2007 2009 2011 2013 2015 2017
prices to increase slightly. Condominium prices, Source: Wüest Partner, UBS
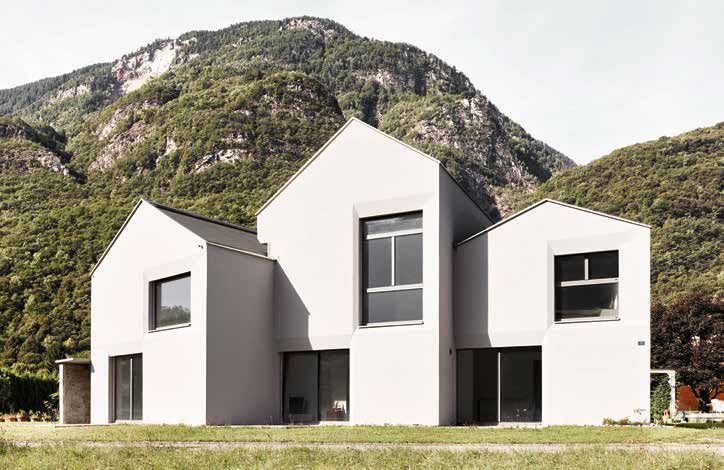
12 UBS Real Estate Focus 2018Swiss House XXII, Preonzo (Bellinzona), Architecture firm: Davide Macullo Architects
“Only a quarter of owner-occupied
homes built are single-family homes.”
Single-family homes are too big Also, the construction boom in condominiums
The average single-family home has around 170 has improved condominium construction quality
square meters of living space. With purchase relative to single-family homes. Only a quarter of
prices averaging over CHF 1 million, the pool of all the owner-occupied homes built in recent
possible buyers is limited to 20% of all house- years are single-family homes. And modern con-
holds. This shifts demand toward condomini- dominiums are comparable to single-family
ums, which cost less than CHF 800,000 on homes in terms of comfort, privacy and sound
average. This theory is supported by the fact insulation.
that prices for relatively small condominiums
have risen faster than for condominiums over Better rentability favors condominiums
150 square meters in size. Condominiums remain very popular invest-
ments. The percentage of loan applications
Single-family homes have worse macro intended for buy-to-rent investments has nearly
locations doubled since 2007 and has hovered at 18–20%
Condominiums, whether new or pre-existing, of all housing loan applications for several years.
are usually found at better macro locations than Small and medium-sized apartments in urban
single-family homes. A quarter of all condomini- centers and metropolitan areas in particular are
ums are found at prime locations, compared to ideal investment vehicles for small investors. The
a fifth of single-family homes. The annual price freedom to switch between living in the prop-
increase at these locations was 1% higher than erty or renting it out justifies the premium on
the national average over the last 10 years. condominiums over single-family homes.
UBS Real Estate Focus 2018 13Size, location and rentability differences will However, Switzerland’s new Spatial Planning
impact relative price trends in the future, too. In Act aims to use these “internal reserves.” It
Mobility
the long term, however, the single-family home gives precedence to the use of infill housing in
market will be determined by two trends: densi- developed rural and metropolitan areas over an
fication and aging. increase in floor area ratios. Densification will
take place by packing as much floor space as
Densification aiming to reverse the trend possible on such land, which will make new sin-
Higher floor area ratios mean higher property gle-family home construction difficult.
Residential
values. Single-family homes seem perfectly
poised to profit from urban concentration, also New condominiums continue to replace single-
known as densification, because they occupy a family homes with extensive unused develop-
relatively large piece of land. So far, however, ment rights in upmarket locations. However,
home values have not risen much outside the these properties are already selling at a premium
city centers. as investment properties or status symbols. In
Commercial
addition, the new Spatial Planning Act reduces
No incentives for densification in rural areas the net financial gains from zoning changes by
Most single-family homes are located in rural levying a value-added tax of at least 20% on
areas. According to the data, developed areas property value increases attributable to new
have not grown denser at all in the last 10 years; zoning. Most cantons already levy value-added
building space increased around 11%, on par tax on gains attributable to an upgrade in zon-
with population growth. Developers simply had ing classifications. Taken together, these trends
Listed
no incentives to densify; land was available and mean the supply of single-family homes will
relatively cheap. Only in city centers and high-in- grow more slowly in the future than it has thus
come communities did densities increase as high far.
land prices made it worthwhile to pack more
housing units into the same parcel of land.
Building space thus grew only half as fast as the
Global
population. However, more single-family homes
were built than demolished between 2011 and
2015, even in high-income communities and city
centers. This is because, in most communities, it
only pays off to demolish and replace condo- Minimal densification in rural areas
miniums if the floor area ratio can accommodate Difference between changes in population and changes in building area*,
a doubling of residential floor space. by community type, in percentage points
Uncontrolled proliferation
Spatial Planning Act discourages new construc- of settlements Densification
tion of single-family homes
Densification entails using undeveloped oases Urban centers
and metropolitan
within built-up areas as well as “unused devel- areas
opment rights,” which arise when the actual
High-income
built floor space is less than the legally permit- communities
ted floor space. According to a study by ETH Peri-urban
Zurich and the Federal Office for Spatial Devel- communities
opment, these “internal reserves” could easily Rural
accommodate over a million residents. But den- communities
sification is not mandatory. Except for the
greater Zurich area, virtually every Swiss region, –10 –5 0 5 10
including Geneva and Basel, has enough unde-
veloped, properly zoned land to absorb the next 1995–2005 2005–2015
decade of population growth without densify- * According to the FSO’s area statistics as of December 15, 2017
ing. Source: FSO, UBS
14 UBS Real Estate Focus 2018Demographic change causes glut of single-
family homes
Comparison of asking and
Over the medium to long term, however, the transaction price indexes
lower supply of single-family homes will not be
enough to turn the price tide permanently. Until Price indexes based on asking prices and those
2030, the main buyer group of large residential based on transaction prices should remain
units will grow at half the rate as the overall essentially identical in the long term. In the past
population due to aging. In fact, demand for 10 years, however, transaction price indexes
single-family homes is expected to shrink in the have gained about 15 percentage points more
mountainous cantons of Central Switzerland, than asking price indexes. There are three rea-
Appenzell Innerrhoden and Grisons. sons for this difference:
In other words, single-family home prices, (1) In periods of fast-rising demand, transaction
which have outperformed condominium prices prices are bid up higher than advertised
since 2014, are probably about to reach the end prices. This is likely what happened at times
of their rally. Prices in both market segments in Swiss hot spots. Sellers, however, are
should generally track each other closely over quick to adapt their expectations to changed
the long term. Fierce competition and relatively market realities.
high transparency in the home market will pre-
vent prices in both segments from decoupling (2) Transaction records make a more exact qual-
in the long run. ity adjustment possible. In other words,
prices are adjusted for variations in quality,
such as micro location or building condition.
Since micro locations have deteriorated
among sold properties in the last five years,
the adjustments have increased transaction
price indexes.
(3) Transaction price indexes weight expensive
regions more heavily. Steeper price increases
at good locations since 2000 have contrib-
uted to the decoupling of transaction prices.
UBS Real Estate Focus 2018 15Apartment buildings
No longer
at any price
Matthias Holzhey and Elias Hafner
Mobility
Asking rents have only dropped moderately, despite rapidly
increasing vacancy rates. This is partly for psychological rea-
sons. However, the downward trend should accelerate in the
Residential
next three years. Prices for apartment buildings have peaked,
and property values could decline if central banks do not
mount a sustained intervention.
Commercial
Competition in the rental market is getting even This happened from 1985 to 1991, when the
fiercer. As of mid-2017, 2.4% of all rental apart- nationwide vacancy rate dropped below this
ments were vacant. This level was last exceeded threshold, and asking rents shot up 50% after
in 1998, when 2.8% of rental apartments stood adjusting for inflation. In the current real estate
empty. So far, however, the vacancy rate has cycle, only the Lake Geneva region has such a
not scared off investors; the number of newly tight housing market. Here, rents increased 5%
approved units has declined very little in recent annually between 2002 and 2015 – double the
Listed
quarters. This year, the total housing stock is rate in the rest of Switzerland.
expected to increase 1.1%.
If vacancies go up in such tight markets, rents
Vacancy rate poised to hit all-time high tend to collapse quickly. For example, rents in
Residential construction is virtually unchanged, the Lake Geneva region have already shed 9%
while additional demand is dropping. Net immi- since 2015, even though the current vacancy
Global
gration is expected to reach nearly 60,000 this rate for rental apartments, 0.8%, is only one-
year, meaning that some 10,000 fewer addi- third of the Swiss average. Average advertised
tional apartments will be needed than in 2013. rents have only dropped moderately nationwide.
The decline is entirely due to lower net immigra-
tion from EU countries, which has shrunk from
75% to 60% of total immigration in the last
four years.
Several factors are driving this trend. The eco-
nomic recovery in the Eurozone, especially on Correction potential for asking rents
the Iberian Peninsula, has slashed net immigra- Ratio of asking and existing rents to income (index 2000 =100)
tion from Spain and Portugal to negligible levels 180
in the last five years. But Switzerland’s weak
160
labor market has lost its allure, too. If construc-
tion and population trends remain the same, 140
the vacancy rate will reach a new record high by
120 Correction
2019 at the latest. potential
100
Rent decreases still moderate 80
In extremely tight housing markets, asking rents 1975 1985 1995 2005 2015
(rents for new and renewed leases) tend to Asking rents/income
respond very quickly to changes in the vacancy Existing rents/income
rate. Rents tend to skyrocket if vacancy rates in Period with rapid increase in vacancy rate
a region drop to around 0.5%. Period with rapid decrease in vacancy rate
Source: FSO, Wüest Partner, UBS
16 UBS Real Estate Focus 2018The index for asking rents is almost 3% below Action recommended with existing
its mid-2015 peak. Rents declined sporadically properties
in most cities and metropolitan areas, and even With existing properties, however, landlords can
in large parts of the periphery. In fact, Western usually contain the income loss to one apart-
Switzerland (without the Lake Geneva region) ment. Here, it pays to quickly adapt rents to the
even showed a 1% increase last year. new reality, especially in regions where the leas-
ing risk is still rising. Also, it is cheaper in the
Loss aversion puts off market shakeout long run to renovate apartments that no longer
Psychological factors are probably responsible meet market quality standards than to drastically
for the lack of movement in asking rents, even reduce the rent.
in municipalities with rapidly rising vacancy
rates. Loss aversion – the tendency to avoid
losses – has been thoroughly researched in
empirical studies. For many investors, a financial
loss has up to twice the psychological impact as
an equivalent gain.
In the real estate market, loss aversion explains
why market liquidity declines rapidly when
home prices fall. Potential sellers tend to hold
on to their properties when the current market
price is lower than what they originally paid.
Loss aversion is also the reason why landlords Incentives can attract
are hesitant to lower asking rents even after a
prolonged vacancy. A lower rent is a certain loss
the wrong tenants
or, at the very least, less than they originally More rental apartments have been advertised
expected to earn, which they perceive as a loss. with sign-up incentives in the past two years –
from rent-free periods to graduated rental leases
It may pay to wait with new apartments to gift cards and free moves. Landlords have
When advertised apartments remain vacant for turned to incentives for obvious reasons: they
weeks, landlords have to weigh the risk of pro- get prospective tenants’ attention and avoid the
longed vacancies against the lower income asso- need to lower effective rents, which would
ciated with a rent reduction. If rents or rent reduce property values. The sweeteners have
expectations no longer reflect market conditions become almost de rigeur for commercial proper-
by the time the apartment comes onto the mar- ties, which are rented out under long-term
ket, the asking rent will often have to be leases. But it’s not clear that incentives are effec-
reduced more than 10% before tenants are will- tive for rental apartments. Gift cards or even free
ing to sign a lease. moves will likely have very little impact on a pro-
spective tenant’s housing budget and willingness
With new buildings, reductions this large can to pay more in rent.
significantly lower yields, since the lower rents
usually have to be passed on to all the tenants in In fact, sign-up incentives could have unintended
the building. In that case, landlords may prefer and undesirable consequences. They could give
to wait for a deeper-pocketed tenant. It is no the impression that something is wrong with the
wonder, then, that the vacancy rate has shot up apartment or landlord and thereby damage a
particularly quickly in new buildings, where development’s image. They might also attract
roughly one-ninth of the apartments are empty. the wrong kinds of tenants. The shorter the
Instead of lowering rents, more landlords are tenant’s intended stay, the more valuable a tem-
now trying to lure in tenants with incentives, porary discount or cash incentive will be. People
which may pose more disadvantages than who are eager to live in an apartment for rent-
advantages. free months will probably move out again after a
short period of time.
UBS Real Estate Focus 2018 17Rents declining at an accelerating pace in real terms. Therefore, current rents are not
Persistently high vacancy rates put pressure on excessive, so we don’t anticipate a broad correc-
Mobility
rents. We expect asking rents to correct around tion in the years to come. However, asking rents
2.5% this year. But that does not necessarily are still 20% higher on average than current
mean the correction phase is over. Unless con- rents. This difference will shrink when asking
struction activity changes direction or immigra- rents correct as anticipated. Once this happens,
tion surges again, asking rates will probably be landlords will be less likely to increase rents for
at least 10% lower in 2020 than in 2015. incoming tenants in existing properties. They will
Residential
also have less latitude to change the terms of
Existing rents have developed steadily over the existing leases if the reference interest rate rises,
long term. In Switzerland, they have kept step since asking rents act as a ceiling for existing
with wages since 1982, increasing 0.5% a year contracts.
Commercial
Excess supply risks in Ticino and Western Switzerland
Vacancy rates in the business centers are low extremely negative in Ticino, too. An increase
and will probably not rise much in the next in the number of building permits and a sudden
several quarters. Structural vacancy has driven drop-off of immigration from Italy will likely
Listed
up leasing risks in the Central Plateau region prompt a steep rise in the number of vacant
and many peripheral regions. The cantons of rental apartments by mid-year. Excess supply
Solothurn and Valais, for example, have the risks have also risen significantly in the Western
highest percentage of vacant rental apartments Swiss cantons of Fribourg, Jura and Neuchâtel,
at around 6%, while nearly 4.5% of all rental as well as in the hinterlands of Vaud.
apartments are empty in Aargau. The trend is
Global
Vacancy rate for rental apartments¹ (2017) and absorption risk² (4Q 2017) by canton (abbreviation) or population
mobility region, in %
Zürcher Unterland
Oberes Baselbiet Lugano TI
FR JU
High
SZ NE
Luzern St.Gallen
Limmattal La Sarine GR
Lausanne BL Wil Solothurn
Morges LU SG Brugg-Zurzach VS
Absorption risk
VD Thun Zürcher Oberland
CH SH SO
Winterthur
Medium
Zimmerberg TG AG
Vevey Aarau Oberaargau
Unteres Baselbiet ZH BE Sion
GE Glattal- Pfannenstiel Olten
Basel-Stadt Furttal Bern Thurtal Biel/Bienne
Zürich ZG
Sursee-Seetal
Baden
Low
0 1 2 3 4 5
Vacancy rate for rental apartments
Leasing risk
Low High Population size
1
Vacancy rate for rental apartments based on UBS estimates of rental housing stock
2
The absorption risk compares growth in the housing stock (supply) with population growth (potential demand) and indicates whether too much
or too little is being built on a regional basis. The increase in supply is determined from the number of building permits requested and issued in the last
five to six quarters. Potential growth is estimated based on the past three years of population growth.
Source: FSO, Docu Media, UBS
18 UBS Real Estate Focus 2018Investment outlook rates or lower rents. We believe the most attrac-
tive locations are metropolitan area locations
Valuations peaking situated at commuting distance from central
Falling capitalization rates have fueled the rally business districts; they offer net initial yields of
in residential investment property prices over the just over 3% with only moderate vacancy risks.
past 10 years. Prices for apartment buildings
throughout Switzerland have risen nearly 60%
since 2007. Rents, however, have only risen
around 15% over the same period. As a result,
net initial yields have declined from just under
5% to 3.5%. Yields vary regionally as well, from
less than 2% (Zurich District 1) to over 5%
(Goms).
Many investors still find these yields attractive
given the negative yields on Swiss government
bonds with maturities of up to 10 years or more.
However, interest rates should rise slightly over
the next 12 months as central banks worldwide
tighten the monetary reins. With vacancies on
the rise and rents on the decline, capitalization
rates will likely not fall any more in 2018. In
short, prices for residential investment property
appear to have peaked. Investors have largely
given up on further capital gains. This can be
seen in the stock market: the prices of residen-
tial real estate funds underwent a significant
correction in the second half of 2017. Expecta-
tions of further increases in residential invest-
ment property prices have fizzled out.
Value adjustment looms
Future investment performance depends heavily One franc of rent is worth twice as much
on the long-term interest rate trends. Interest
rates will start trending upward once central
in Zurich as in the mountains
Initial net returns* by population mobility region, in %
banks stop depressing them artificially. A small
increase in the yield curve of 0.5 percentage under 2.5
points or less shouldn’t squeeze prices for 2.5 to 3.0
apartment buildings across the board, however. 3.0 to 3.5
3.5 to 4.0
Investors would still be hard-pressed to find bet- 4.0 to 4.5
ter places to put their money. An increase in the over 4.5
yield on 10-year Swiss government bonds to,
say, 2%, however, would require substantial
write-downs. Property values would correct
around 20%. Properties in prime locations,
which have responded more strongly to falling
interest rates in recent years, could shed up to
30% of their value. Peripheral locations, by con-
trast, are less sensitive to interest rate fluctua-
tions. Instead, they face a higher risk of lost * Net yield aer all costs are deducted (including maintenance) in % of purchase price
income in today’s market due to higher vacancy Source: UBS estimates
UBS Real Estate Focus 2018 19Mortgages as an asset class
More money from
institutional investors
Elias Hafner
Mobility
Insurers and pension funds now have greater incentives to
offer mortgages. Banks are likely to lose market share due to
stricter banking regulation. Institutional investors can choose
Residential
from several mortgage investment options.
Last year, the Swiss mortgage market broke Incentives shift due to regulation and
Commercial
through the CHF 1 trillion barrier. Banks hold low interest rates
roughly 95% of the total mortgage volume, There are three main reasons behind institu-
with insurers and pension funds making up only tional investors’ current push into the mortgage
a small portion of the market. However, the market:
trend appears to be changing. Insurers’ mort-
gage positions grew by around 6% a year in Regulation
2015 and 2016, while pension funds’ mortgage Stricter capital and liquidity requirements since
Listed
books expanded 5% in 2016 after years of the financial crisis under Basel III have made
decline. Banks, in contrast, have experienced financing more expensive for banks. At the
slower growth. In fact, large banks’ mortgage same time, the Swiss National Bank’s countercy-
books have recently shrunk. Initial 2017 data clical capital buffer and stricter self-regulation
indicates that insurers’ mortgage portfolios are have made mortgage lending more expensive
continuing to grow faster than those of banks. or difficult for banks. The regulation of mort-
Global
gage lending for institutional investors, by con-
Institutional investors with a long-term trast, is not quite as stringent.
horizon
Banks finance most mortgage loans with debt
that is callable at short notice. For banks, fixed-
rate mortgages are traditional interest opera-
tions: they collect the mortgage interest with
one hand, and pay depositors interest on their
deposits with the other.
Institutional investors have a small portion
Insurers and pension funds, by contrast, invest Swiss mortgage market, broken down by lender as of the end of 2008 and
2016, in %
capital that insured individuals or plan members 2016
pay in to cover future losses or pension commit-
4 1
ments. Pension fund obligations usually have
terms of 10–15 years. For this reason, insurers 18 2008 Cantonal banks
and pension funds prefer to extend long-run- 42 34 Large banks
ning loans, offering 15 years by default but 17 32 Raiffeisen banks
going up to 25 years in some cases. They also Other banks
tend to be more conservative about loan-to- 14 Insurance companies
value ratios and market segment risk. So not 17 32 Pension funds
only are market shares unequal, but the market
itself is segmented too.
26
Source: FSO, FINMA, SNB, UBS
20 UBS Real Estate Focus 2018Negative interest rates by negative interest rates. According to Swiss-
The January 2015, introduction of negative canto’s Pension Funds Study 2017, 58% of
interest rates shifted the incentives for granting pension funds pay negative interest or deposit
mortgages in favor of institutional investors in charges, encouraging them to shift some
two ways. First, banks do not charge most of fixed-income or money market positions to
their private clients negative interest, so their mortgages.
earnings situation is at risk of worsening consid-
erably. To prevent margin erosion in the mort- Property values
gage business, banks have raised lending mar- The low interest environment has prompted
gins: mortgage rates at banks have barely institutional investors to move large amounts of
budged downward despite a significant capital to investment properties. Pension funds,
decrease in the general interest rate level. Many for example, reduced their bond positions to
pension funds, on the other hand, are affected 32% of their portfolios in 2016 from 38% in
Independently, with a partner or indirectly
Pension funds and insurers wanting to invest in Separating the underwriting and lending opera-
the mortgage market have several options. tions requires properly adjusted incentives,
though. For example, the mortgage partner can
Independent mortgage lending always carry part of each mortgage on its bal-
One option is for pension funds and insurers to ance sheet, or the underwriter can analyze a
lend mortgages themselves, enabling them to mortgage without knowing whether the institu-
capture all the returns along the value chain. tional investor or the mortgage partner will be
As of mid-December 2017, relatively large insti- bearing the default risk and carrying the invest-
tutional investors offered 10-year mortgages ment on their balance sheet.
based on reference rates of around 1.3%
(banks: 1.5%). Whether or not independent Indirect investments
lending makes sense depends heavily on the Finally, investments can also be made indirectly
maintenance costs for the necessary infrastruc- through investment foundations or mortgage
ture. As a rule, the bigger the mortgage book funds. Several large banks have created invest-
and the longer its intended operating life, the ment vehicles for this purpose since late 2016
easier it will be to absorb high initial and fixed and, in some cases, have moved mortgages
costs. from their own balance sheet into them. This
solution offers the prospect of broad diversifica-
Collaboration with a mortgage partner tion and the rapid build-up of a mortgage posi-
Institutional investors can also transfer part of tion. Also, investors can redeem shares if they
the value chain to a partner. Working with bro- wish. Return expectations vary depending on
ker platforms, for example, gives them quick the mortgage fund, mainly because of average
access to new clients. Pension funds or insurers maturities (less than one year to six years), but
can also act solely as investors. In this case, the currently range around 0.2–0.5%. Rigorous
mortgage partner – for example, a bank – han- mortgage selection criteria are designed to pre-
dles all the administration. The return for the vent these investment vehicles from only receiv-
institutional investor depends on the maturity; ing “bad” loans. Unlike direct mortgage invest-
at the moment, it should range from nearly ments, these positions have to be marked to
0.5–1.0% in most cases. Mortgage partners, by market, which can lead to unwanted coverage
contrast, can earn an additional return without ratio fluctuations when interest rates change.
having to carry the mortgages on their books.
UBS Real Estate Focus 2018 212007, and increased the real estate share to trated. Knowing this, institutional investors
nearly 23% from 17% during the same period. should not relax their traditionally conservative
Mobility
Demand for investment properties among insti- mortgage lending policies just to collect a few
tutional investors remains robust, but investors extra basis points. These investors are also wary
seem more cautious now. This has brought of mortgage holdings that shorten capital com-
mortgages – which, at conservative loan-to- mitment periods, since they want to avoid
value ratios, act more like bonds than real asset-liability mismatching.
estate investments – onto the radar.
Residential
While the market distortions caused by negative
interest rates are unlikely to persist over the
medium term, the “regulation gap” between
banks and institutional investors – due to
“The segmentation Basel IV, among other things – could certainly
widen even more. As a result, banks are being
should continue
Commercial
forced to give up some mortgage business and
focus more on the service-oriented, less inter-
to increase, which est-rate-sensitive links in the lending value
chain. At the end of 2016, insurers were poten-
tially able to invest an additional CHF 37 billion
will lead to more in mortgages (estimated, not including over-col-
lateralization). Pension funds are generally per-
robust mortgage
Listed
mitted to invest 50% of their total assets in
Swiss mortgage securities. Even if they did
lending as mort- choose to allocate such an unrealistically high
share of the CHF 800 billion of capital held in
second pillar plans to this asset class, they
gage asset maturi- would still make up less than half of the total
Global
market. Clearly, banks will continue to domi-
ties adapt to nate the Swiss mortgage market. The market
should continue to split up into segments, how-
investors’ liability ever, which will ultimately lead to more robust
mortgage lending as mortgage asset maturities
become more aligned with investors’ liability
maturities.” maturities.
Banks still dominant, but segmentation
stronger
The spread between mortgages and fixed-in-
come investments seems highly attractive at
first sight, and not just because of the negative
interest rate environment. Mortgages have cer-
tain appealing characteristics as well. They are
an illiquid asset class, so investors demand to be
compensated accordingly. Institutional investors,
with their long-term investment horizon, can
bear the liquidity risk and collect the illiquidity
premium. Also, over the long term, mortgages
can provide diversification and carry a default
risk as low as that of bonds. Default rates can
spike, however, as the subprime crisis illus-
22 UBS Real Estate Focus 2018Investment crowdfunding
Higher returns
with higher risk
Elias Hafner and Maciej Skoczek
Crowdfunded investments in the Swiss residential real estate
market have been delivering blockbuster returns through high
gearing and compromises in macro locations. Investors have been
reaping the rewards during this fair-weather period. Concentra-
tion risks loom, however, particularly for small investors.
Too good to be true? Earn 7% a year in an
ostensibly secure asset class while interest rates
What is investment
are low. Real estate crowdfunding platforms are crowdfunding?
making exactly that promise. These platforms,
which first appeared in Switzerland in 2015, Investment crowdfunding – also known as equity
have brokered over CHF 200 million in invest- crowdfunding or crowd investing – in real estate
ments in apartment buildings. Most of the time, enables many investors, each using relatively little
the platforms have kept their promise. Buy-to-let capital, to purchase apartment buildings through an
and residential real estate funds are traditional online platform. That way, even small investors can
alternatives to crowdfunding, but currently offer co-own a residential investment property and profit
much lower returns: 4–5% and 2–3%, respec- from rental income and rising property values.
tively.
Up-close look at the differences in returns Second, fund properties tend to have better
The large differences in returns on equity, espe- macro locations. Only some 25% of the Swiss
cially between crowdfunded investments and population lives in communities with a higher
residential real estate funds, are largely attribut- macro ranking than a fund portfolio’s median
able to leverage, differences in gross rental property. Median properties in crowdfunded
returns and the costs of managing the real ventures, by contrast, tend to rank much lower;
estate portfolio. a bit more than 60% of the population lives in
communities with a better rating.
Gross rental return – funds offer better location,
liquidity and diversification Third, funds always factor in a rent default rate
On average, crowdfunding providers promise of around 4%.1 That is much higher than the
net rental incomes of nearly 4.5% of the real average vacancy rate of rental apartments in
estate purchase price. The portfolios of residen- invested communities, which is less than 2% on
tial real estate funds, by contrast, pay an aver- a portfolio-weighted basis. Crowdfunding fig-
age of 3.5–4% of the fund assets’ fair value. So ures only include a vacancy buffer of around
why do listed funds return less? 1.5% – despite significantly worse macro loca-
tions and community vacancy rates in excess of
First, they come with certain advantages, like 5%.
better diversification and greater liquidity than
individual investments in apartment buildings.
Investors are willing to pay a premium for these
advantages, lowering returns. In investment
crowdfunding, by contrast, the risk is concen-
trated in a few apartments; the secondary mar- 1
The rent default rate corresponds to the reduction in income
ket is still untested. attributable to vacancies and uncollected rent relative to net
target rent.
UBS Real Estate Focus 2018 23You can also read