Economic upturn coming just at the right time - Credit Suisse
←
→
Page content transcription
If your browser does not render page correctly, please read the page content below
INVESTMENT SOLUTIONS & PRODUCTS
Swiss Economics

Swiss Real Estate Market 2018

                                                                     February 2018

Economic upturn coming
just at the right time

Owner-occupied housing   High-rise buildings       Retail property
Return to price growth   Comeback of residential   The knock-out race
                         high-rise buildings       has begun

Page 7                   Page 27                   Page 43
Swiss Economics

Imprint
Publisher
Dr. Burkhard Varnholt
Vice Chairman IS&P
+41 44 333 67 63
burkhard.varnholt@credit-suisse.com

Fredy Hasenmaile
Head Real Estate Economics
+41 44 333 89 17
fredy.hasenmaile@credit-suisse.com

Printing
gdz AG, Spindelstrasse 2, 8041 Zürich

Copy deadline
February 2, 2018

Publication series
Swiss Issues Immobilien

Orders
Directly from your relationship manager, from any branch of Credit Suisse
Electronic copies via www.credit-suisse.com/immobilienstudie
Internal orders via MyShop quoting Mat. No. 1511454
Subscriptions quoting publicode ISE (HOST: WR10)

Visit our website at
www.credit-suisse.com/research

Copyright
The publication may be quoted providing the source is indicated.
Copyright © 2018 Credit Suisse Group AG and/or affiliated companies. All rights reserved.

Authors
Fredy Hasenmaile
+41 44 333 89 17
fredy.hasenmaile@credit-suisse.com

Brice Hoffer
+41 44 333 72 60
brice.hoffer@credit-suisse.com

Thomas Rieder
+41 44 332 09 72
thomas.rieder@credit-suisse.com

Dr. Fabian Waltert
+41 44 333 25 57
fabian.waltert@credit-suisse.com

Stephan Boppart
Slavisa Lazic

Contribution
Fabian Diergardt

                                                                                            Real Estate Market 2018 I February 2018   2
Swiss Economics

Table of contents

                    Management summary                                            4

                    Owner-occupied housing                                        7
                    Demand                                                        7
                    Supply                                                       10
                    Market outcome                                               12
                    Outlook for owner-occupied housing in 2018                   15

                    Decision process when buying a home:
                    Clear division of roles between men and women                16

                    Rental apartments                                            19
                    Demand                                                       19
                    Supply                                                       21
                    Market outcome                                               23
                    Outlook for rental apartments in 2018                        26

                    Comeback of residential high-rise buildings                  27

                    Office property                                              31
                    Demand                                                       31
                    Supply                                                       36
                    Market outcome                                               37
                    Outlook for office property in 2018                          39

                    Urban logistics: Logistics are taking over the cities        40

                    Retail property                                              43
                    Demand                                                       43
                    Supply                                                       47
                    Market outcome                                               48
                    Outlook for retail property in 2018                          51

                    Behavioral economics: When psychology plays
                    tricks on investors                                          52

                    Real estate investments                                      55
                    Direct real estate investments                               55
                    Indirect real estate investments                             57
                    Outlook for real estate as an investment                     59

                    Factsheets: Regional real estate markets at a glance         60

                                       Real Estate Market 2018 I February 2018    3
Swiss Economics
Management summary
Economic upturn coming just at the right time
The Swiss real estate market is beset by a record level of expansion, growing vacancies and down-
ward pressure on rents. The economic upturn is therefore coming to its aid at precisely the right
time. Thanks to the cyclically driven revival of demand, the real estate market is receiving a final
boost of energy following the unexpected wave of immigration after 2007 and the massive revalua-
tions due to low or even negative interest rates. While the revival of demand will relieve the symp-
toms of the oversupply, it will not be able to bring about any decisive change to the challenging situ-
ation.
Owner-occupied housing Return to price growth
Page 7 The regime change to falling residential property prices following 14 years of price growth was just a
brief intermezzo. Prices on the owner-occupied housing market are significantly up again and have
returned to the growth zone even in the high-price segment. The strong economic upturn is generat-
ing new demand on the owner-occupied housing market, especially since mortgage interest costs
are still at very low levels despite a slight upward trend. The renewed price increase is favored by a
continuous fall in construction activity in the ownership segment in recent years. Promoters are only
gradually becoming more confident again and planning more housing for homeowners. Supply
should decrease further in the short term and we therefore anticipate prevailing low vacancies and
solid price growth in the majority of regions. However, we do not expect a return to an overheated
owner-occupied housing market as the momentum is being too strongly neutralized by the high price
level and regulatory restrictions for this to happen. On top of this, the aging population will no longer
foster the demand for owner-occupied housing to the same extent in the future. The high-demand
babyboomer cohorts are gradually reaching an age at which on balance the demand for owner-
occupied housing starts to fall.
Special focus: Clear division of roles between men and women
Decision process when The acquisition of owner-occupied housing is one of the most important decisions of a household.
buying a home Individual family members with different roles and preferences contribute to the decision. Both inter-
Page 16 national studies and a survey conducted by us reveal major differences between the genders in the
decision-making process. Sellers are well advised to focus on women, as they are the key factor in
the decision to buy a property, while men are primarily concerned about how to finance it. While the
disparity between the preferences of men and women is commonly known, its magnitude neverthe-
less comes as a surprise.
Rental apartments The upturn will not be enough
Page 19 The outlook on the rental accommodation market is deteriorating further. This is evidenced by grow-
ing vacancies, rising pressure on rents and tenants who outside the major centers are increasingly
gaining the upper hand. However, thanks to high yield premiums, investors are not being put off by
the increasing risks and are continuing to invest in the rental accommodation market. Rental apart-
ment construction therefore remains at a very high level. At the same time the market is being con-
fronted with falling demand as immigration is continuously losing momentum. However, the rental
accommodation market is receiving support at exactly the right time and the emerging robust eco-
nomic upturn is set to stabilize demand. It may curb the growth of vacancies, but it will not be able to
halt it. Because we expect excessive construction activity again in the current year, vacancies are set
once again to go up sharply to around 2.5%. We therefore anticipate a continued fall in advertised
rents of around 1% in 2018.
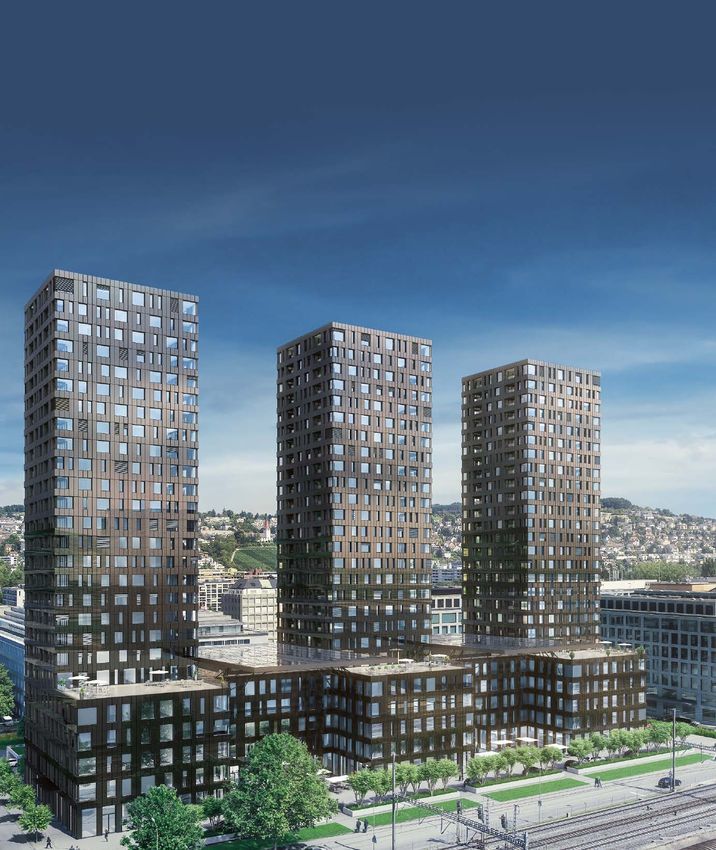
Special focus: Comeback of residential high-rise buildings
High-rise buildings Cities are the focal points of economic, social and cultural life, which therefore gives them a strong
Page 27 appeal. The improvement of the quality of life in cities as well as various social trends such as falling
household sizes have also contributed to the rediscovery of urban living. Solving the resultant settle-
ment pressure calls for structural consolidation for which high-rise buildings offer a potential answer.
Residential high-rise buildings have since 2010 therefore experienced a renaissance. They appear to
be a suitable product for urban living requirements at central locations. For the investor, however,
high-rise buildings are complex construction projects that entail higher investment costs. But with an
enhanced tiering of rents by floor level and a focus on the correct target groups, the additional ex-
penditure can be recovered again through higher rental income.
Real Estate Market 2018 I February 2018 4
Swiss Economics

Office property           Fragile revival of demand
Page 31                   There are increasing signs of an improvement in the market situation. However, it remains to be
                          seen how sustainable these signs are. Due to low financing costs, attractive yield spreads and a lack
                          of investment alternatives, investments in office property projects are still attractive. Following two
                          years of relative calm, an acceleration in the planning of new office properties can therefore be ob-
                          served again. These new capital inflows are jeopardizing the stabilization of the office property mar-
                          ket. Hopes are therefore entirely based on the gradual recovery of the Swiss economy in 2018 and
                          that this is able to stimulate the demand for office space sufficiently. In the longer term, the aging of
                          the Swiss population that will more or less result in a stagnation of the working population from
                          2025, and the falling space consumption per employee point toward a noticeable decline in demand.
                          Demand-boosting trends such as increased immigration, a higher participation rate among women
                          and senior citizens and a continued tertiarization of the Swiss economy might mitigate the expected
                          weak demand but will hardly turn the situation around. The scenario of a long-term slowdown in the
                          growth of demand for office space therefore appears undisputed.

Special focus:            Logistics are taking over the cities
Urban logistics           Owing to reurbanization and the triumph of e-commerce, logistics locations are gaining importance
Page 40                   within the centers and their immediate vicinity – despite the prevailing shortage of space. Modern
                          concepts of urban logistics for overcoming the last mile are geared toward four approaches. As well
                          as swifter means of transport and new delivery models (e.g. pick-up stations), more refined forms of
                          cooperation and conversions of office and retail properties are also being tested. However, such
                          cascaded systems of urban logistics are still largely pie in the sky in Switzerland. Nevertheless, more
                          and more real estate investors are becoming aware of this fast-growing sector.

Retail property           The knock-out race has begun
Page 43                   The decline in retail sales has come to a halt. However, falling space productivity, major growth
                          disparities between e-commerce and bricks and mortar retailing and rising bankruptcy rates suggest
                          that the structural change within the sector is still in full swing. The development in the US shows
                          that the victims are ultimately the providers of retail property because they are losing tenants. A
                          glance at China reveals where the retail business is going. Despite much less widespread internet
                          usage than in western countries, China has already taken the lead regarding e-commerce. With this
                          in mind we subject the bricks and mortar shopping formats to a digital stress test and consider de-
                          partment stores and shopping streets at B and C locations to be most at threat. Because the future
                          course of business has become much less certain, retailers are striving for more flexibility. They are
                          therefore reducing the number of their locations and aim to expand their online business toward an
                          omnichannel strategy. As rising vacancies despite a reduced expansion of space make clear, the
                          structural change has therefore only just begun.

Special focus:            When psychology plays tricks on investors
Behavioral economics      Traditional economic models and theories are mostly based on the assumption that people’s behav-
Page 52                   ior corresponds to that of a rational utility maximizer (homo oeconomicus). In reality, however, human
                          decision behavior displays a large number of in some cases systematic deviations from the rational
                          economic behavior model. This is where behavioral economics comes into play. As a subdiscipline of
                          modern economics, it aims by means of findings above all from psychology to explain irrational be-
                          havior by market participants and gain a better understanding of market inefficiencies. Real estate
                          markets in particular are considered to be inefficient due to their lack of transparency and their inert-
                          ness. Various theories of behavioral economics can therefore be directly applied to the players on
                          the real estate market. These include, for example, loss aversion that causes significantly fewer real
                          estate transactions to take place in phases of downward price corrections.

Real estate investments   Negative interest rates dominating cycle
Page 55                   Despite a deterioration in the earnings situation due to a lack of demand on the end user markets,
                          the yields on direct and indirect real estate investments remain impressive. The negative interest
                          rates are to some extent dominating the classic property cycle and despite falling potential for rental
                          income preventing a corresponding price adjustment to investment properties and products. This is
                          evidenced by a continued yield compression of direct investments and persistently high agios and
                          premiums for indirect investments. Although the agios will disappear as yield drivers in the next few
                          years, according to our main scenario they should not exert a negative impact. Owing to the side-
                          ways trend for long-term interest rates and the slight upward trend in short-term interest rates, the
                          net asset values are in future set to make positive but lower yield contributions than in the recent
                          past. Altogether our main scenario anticipates a slight downturn in the performance of indirect real

                                                                                Real Estate Market 2018 I February 2018          5
Swiss Economics

estate investments in the next few years but not a collapse of the market. Because there will barely
be any change to the intense quest for yields in 2018, direct real estate investments are set to build
on the excellent performance of the past few years with at least an average return for another year.

                                                     Real Estate Market 2018 I February 2018        6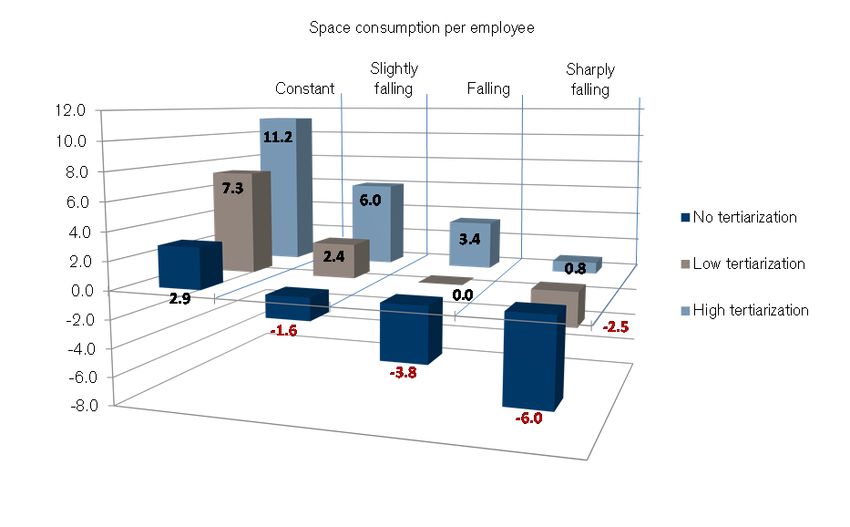
Swiss Economics

                                                     Owner-occupied housing

                                                     Return to price growth
                                                     The regime change in the winter of 2016/2017 to falling residential property prices following 14
                                                     years of price growth was just a brief intermezzo. House prices quickly bottomed out thanks to
                                                     the prevailing low interest rates and a continuous decline in construction activity and started to
                                                     rise again in the second half of 2017. Because economic momentum and regulatory obstacles
                                                     are at present largely canceling each other out, the focus is shifting to demographic effects. The
                                                     babyboomers are heading toward retirement and departing from working life. The time when
                                                     they will also turn their backs on residential property is no longer far off. What marks will this
                                                     leave on the owner-occupied housing market?

                                                     Demand: Financing hurdles canceling out momentum
Economic recovery support-                           We expect very good underlying economic conditions for the current year. The growth of Swiss
ing demand                                           gross domestic product (GDP) is set to accelerate noticeably to 1.7% and a slight fall in the
for residential property …                           unemployment rate is expected. On top of this comes positive news about the economic recov-
                                                     ery in the Eurozone from which Switzerland should additionally benefit. Thanks to the economic
                                                     upturn, households are able to expand their work volumes and thereby increase their incomes.
                                                     However, from a purely earnings-related perspective, the upturn will only be reflected in con-
                                                     sumers’ wallets after a delay owing to just moderate nominal and real wage increases.

… especially since mort-                             Nevertheless, the altogether positive news is likely to increase the desire for home ownership as
gage interest rates remain                           mortgage interest rates are expected also to remain very low in 2018. We do not anticipate any
low                                                  change in money market rates. However, we expect the interest rates for fix mortgages with
                                                     medium to long terms to rise by 15 to 40 basis points between the end of 2017 and the end of
                                                     2018. Nevertheless, actual mortgage costs remain extremely low when viewed historically. A
                                                     home owner with an average income last year had to spend 18.6% of his income on mortgage,
                                                     repayment and maintenance costs for a new condominium of an average standard (Figure 1).
                                                     Between 1996 and 2017 these costs averaged at 21.1%.

Figure 1: Affordability of residential property                                       Figure 2: Regional imputed affordability
For average household as % of income under the following parameters: new con-         For average household as % of income under the following parameters: 5% interest,
struction, 1% maintenance, 80% loan to value ratio, repayment on two thirds within    1% maintenance, 80% loan to value ratio, repayment on two thirds within 15 years
15 years

                        Actual affordability (5-year fix mortage)                     Imputed affordability
42%                     Imputed afforability (5% interest)                     6%         > 60%
                        5-year fix mortgage (r.h.s.)                                      50 – 60%
                                                                                          40 – 50%
35%                                                                            5%         33 – 40%
                                                                                          27 – 33%
                                                                                          20 – 27%
28%                                                                            4%
                                                                                          < 20%

21%                                                                            3%

14%                                                                            2%

  7%                                                                           1%
                                                                                                                                                 Change 2016 – 2017
  0%                                                                           0%                                                                      Sharp increase
                                                                                                                                                       Slight increase
       1996 1998 2000 2002 2004 2006 2008 2010 2012 2014 2016                                                                                          Sideways movement
                                                                                                                                                       Slight decrease
                                                                                                                                                       Sharp decrease

Source: Credit Suisse                                                                 Source: Credit Suisse, Geostat

Imputed affordability curb-                          Although the actual affordability will more or less remain at its current low level in 2018, many
ing demand …                                         households continue to be denied access to home ownership. Apart from the high capital re-
                                                     quirements, the imputed affordability prescribed by regulatory factors also serves to limit the
                                                     ability of households to acquire residential property. A household with an average income would
                                                     have had to spend an imputed 38.4% of this on a new condominium of an average standard in

                                                                                                              Real Estate Market 2018 I February 2018                  7
Swiss Economics
2017 (Figure 1). Although this burden has fallen marginally in the past two years, it is still well
above the critical threshold of 33%.
… and continuing to steer The demand for residential property remains curbed by this. However, strongly varying re-
potential buyers to less strictions emerge between different regions which are primarily due to the prevailing price levels
expensive regions (Figure 2). The home ownership burden is greatest in the areas surrounding Lakes Zurich, Ge-
neva and Zug and is unaffordable for a majority of households. This burden has increased fur-
ther in particular in the Canton of Zurich. We therefore expect a continued shift of some of the
demand to regions with more affordable prices and correspondingly lower imputed affordability.
Demand determined by demographics in the long term
Demographics are a key As well as economic performance and the affordability of single-family dwellings and condomini-
driver of demand for resi- ums, the demographic trend is also decisive for the demand for residential property. Unlike the
dential property two initially mentioned factors, demographic effects barely exert any impact on demand in the
short term. However, their long-term effect is all the more substantial. Knowledge of the age
structure of home owners and information about when households switch from a rental apart-
ment to home ownership and when they give this up again are therefore crucial to understanding
the owner-occupied property market.
Babyboomers: According to the latest figures from 2015, the average home owner in Switzerland is 58 years
key buyers of old. He therefore belongs to the babyboomer generation, that is, the high birth rate age groups
residential property born from 1946 to 1964. Babyboomers account for 42% of home owners despite the fact that
they only have a share of around 31% of all households.
Home ownership only wide- The major importance of the babyboomers for demand is also a result of their age. While hardly
spread after reaching mid- any young households own their own homes, the number of home owners rises with increasing
thirties age (Figure 3). Although the quest for ownership already lies dormant in many young adults, the
desire for flexibility and mobility initially dominates among the young. They also often lack the
necessary income and/or assets. This means that while just 13.5% of all 30 to 34-year-olds are
home owners, the share among the babyboomers is almost 51%.
Home ownership in the life The age and in particular also the composition of the household play a role not only in the choice
cycle of owners of home ownership but also in the choice between single-family dwelling (SFD) and condomini-
um (CON). Figure 4 illustrates this situation based on an observation of the age cohorts of the
year 2015. It shows how the number of home owners in the individual age groups has increased
or decreased in the immediately preceding five-year period from 2010 to 2015. It emerges that
the behavior of younger households (age groups 25 to 44) differs clearly from that of middle-
aged (age groups 45 to 69) and older households (age groups 70 and above).
Figure 3: Number of home owners by age Figure 4: Growth of home owner cohorts
Number of owner households by age 2015 cohorts over the period 2010 to 2015
30,000 40,000 Cohort growth CON 2010–2015
SFD CON Cohort growth SFD 2010–2015
Cohort growth residential property 2010–2015
25,000 30,000
20,000
20,000
10,000
15,000
0
10,000
-10,000
5,000
-20,000
25–29
30–34
35–39
40–44
45–49
50–54
55–59
60–64
65–69
70–74
75–79
80–84
85–89
0
20 25 30 35 40 45 50 55 60 65 70 75 80 85 90 95 100
Source: Swiss Federal Statistical Office, Credit Suisse Source: Swiss Federal Statistical Office, Credit Suisse
Condominiums While condominiums are also valued by younger households, they primarily gain importance for
gain importance the age cohorts above 45 that at the start of the five-year period were aged 40 and above.
with age These will comprise urban households that did not venture into home ownership until a late
stage, childless couples and those switching to a condominium after their children leave home as
Real Estate Market 2018 I February 2018 8
Swiss Economics
well as households finding the lack of age suitability or maintenance of a single-family dwelling a
burden.
The share of home owners The preference for condominiums is also apparent among older households. However, due to
falls from the age of 70 deaths and switches to age-friendly housing types the number of home owners falls from the
age of 70 so that the growth of the cohort and therefore the demand for residential property
prove negative (Figure 4). The single-family dwelling is primarily affected by this. By contrast,
the condominium continues to gain importance right into the age group of 70 to 74-year-olds.
Young households continue Young households are often the buyers of these single-family dwellings as they become vacant
to prefer the single-family (Figure 4). The single-family dwelling dominates growth in the young age groups. This may at
dwelling first glance seem surprising since single-family dwellings when new are generally significantly
more expensive due to their higher share of land. However, older single-family dwellings for
which the value of the building has largely depreciated can also be affordable for younger
households, particularly at locations outside the urban areas. Having said this, such a purchase
is frequently associated with layouts that are no longer in keeping with the times and a backlog
of refurbishment requirements entailing additional costs. Nevertheless, the single-family dwelling
ultimately remains the preferred form of ownership for many couples with children.
Outlook: Based on the structure of home owners by age and taking account of the expected population
Demand remains scarce growth, it is possible to forecast the demand for residential property in the years to come. This
at its existing level estimate disregards cyclical fluctuations in demand. On average we expect additional demand
potential of almost 23,000 home owners nationwide by the year 2025, which is slightly below
the growth of the period from 2010 to 2015. The growth is set to be somewhat higher at the
beginning as above all middle-aged households will remain as potential buyers of property. To-
ward the end of the period, however, demand is likely to fall below the aforementioned potential
as the lack of babyboomers is increasingly felt. The average age of home owners will also rise
further due to the aging population. However, this does not automatically mean that the buyers
of properties advertised on the market increase in age. As the willingness to move decreases
rapidly with increasing age, the growth is instead concentrated on young and middle-aged buy-
ers in a manner similar to that illustrated in Figure 4.
Figure 5: Regional demand potential until 2025 Figure 6: Age structure of second home owners
Forecast of annual expected demand potential for residential property, as % Distribution of second home owners by age group, in %
> 2% 14%
1.6 – 2%
1.2 – 1.6% 12%
0.8 – 1.2%
0.4 – 0.8%
0 – 0.4%
10%
< 0%
8%
6%
4%
2%
0%
20–24
25–29
30–34
35–39
40–44
45–49
50–54
55–59
60–64
65–69
70–74
75–79
80–84
85–89
90+
Source: Credit Suisse, Swiss Federal Statistical Office, Geostat Source: Swiss Federal Statistical Office, Credit Suisse
Major differences Major differences are manifested regionally in terms of future demand potential. We see the
in regional demand poten- greatest future potential for home ownership in German-speaking Switzerland in the catchment
tial area of the major center of Zurich (Figure 5). Here, the annual potential in Zurich Unterland, for
instance, is expected to amount to 2.1% of the current stock of property. However, demand in
Western Switzerland is also set to grow above average, particularly in the Canton of Fribourg,
the Vaud hinterland and in Lower Valais. By contrast, demand in many rural regions is barely
expected to rise further and we even anticipate a fall in demand in the regions of Schwarzwasser
and Goms.
Real Estate Market 2018 I February 2018 9
Swiss Economics
Demand for second homes In the tourist regions the demand for first homes is supplemented by that for second homes,
is undergoing upheaval which is likewise dependent on the aging population. For many households of the babyboomer
generation, owning a vacation home in the Swiss mountains is an achievement, a status symbol,
a place of retreat or all in one. By contrast, the generation of millennials has other preferences.
The young generation wishes to be as spontaneous as possible, to experience a lot and discover
the world. Thanks to budget airlines, trendy and fancy regions of the world lie just around the
corner. Sharing rather than owning has become the motto thanks to the sharing economy. For
an excursion to the mountains, an apartment is rented for a few days via Airbnb. However, the
purchase of a vacation home is no longer a priority. The outcome of this development is that the
buyers of vacation homes are getting increasingly older. Even today the average owner of a
vacation home is 61 years old, and at almost 14%, the age group of 65 to 69-year-olds com-
prises the largest cohort (Figure 6). An increasing number of households will accordingly reach
an age in the years to come at which they decide to give up their vacation home. If the children
do not wish to take over the home, it will have to be sold on a market with falling demand in the
long term. This is set in future to create a more challenging market environment in particular
outside the top tourist destinations.
Supply: Continued fall in construction activity
Condominiums Much attention is normally devoted to new construction activity, including that of condominiums.
becoming increasingly pop- Although at around 22,000 units the production of residential property in 2017 was impressive
ular in itself, compared to existing stock it is just a dwarf. What do we know about existing stock?
While it is dominated by single-family dwellings, condominiums are catching up as can be seen
from a breakdown by construction period and age (Figure 7). Condominiums are on average
considerably younger than single-family dwellings. Condominiums completed since 2001 by
themselves account for 34.7% of their entire stock. By contrast, only 16.6% of single-family
dwellings originate from the same period.
Condominium concept fac- From a legal perspective, condominium ownership as a form of housing has only existed since
ing test of endurance 1965, which explains the young age structure of condominiums. Condominiums dating from
before this have been created from conversions of multi-family dwellings into condominium own-
ership. Owing to sharp land price increases and a growing scarcity of building land at well con-
nected locations, condominiums today dominate construction activity versus single-family dwell-
ings at a ratio of 2:1. However the benefits of condominiums are also offset by disadvantages.
These include the difficulties of reaching decisions within communities of condominium owners.
This topic is set to gain even more relevance in the future as in 2015 almost 19% of all condo-
miniums were between 30 and 44 years old. Major renovation work such as to the roof or the
facade becomes increasingly difficult to postpone at this age.
Figure 7: Housing stock by construction period Figure 8: Share of condominiums more than 25 years
old
Share per construction period, measured against applicable stock (first homes), 2015 First homes, as %, 2015
16% CON SFD Share of condominiums more than 25 years old
< 20%
14% 20 – 30%
30 – 40%
12% 40 – 50%
10% 50 – 60%
60 – 70%
8% > 70%
6%
4%
2%
0%
1919–1945
1946–1960
1961–1970
1971–1980
1981–1985
1986–1990
1991–1995
1996–2000
2001–2005
2006–2010
2011–2015
< 1919
Source: Swiss Federal Statistical Office, Credit Suisse Source: Swiss Federal Statistical Office, Credit Suisse, Geostat
Real Estate Market 2018 I February 2018 10Swiss Economics
Urban locations offer Above all a lack of financial resources and disagreement regarding the procedure in most cases
more options for solving prevent an optimum renovation strategy. Illustrative examples are in future set increasingly to be
decision-making blockades observed in the regions, where the share of condominiums over 25 years old is high. This is
particularly the case south of the Alps, at the southern foot of the Jura and in Basel and Berne
(Figure 8). Thanks to the sharp increase in the value of building land, selling offers an additional
possible solution in urban regions, while potentially increasing the number of floors in combina-
tion with large-scale refurbishment can also pose an attractive option.1 These possibilities are
often lacking in the Alpine regions apart from at top destinations. This situation is further exacer-
bated by the fact that the heterogeneity within communities of condominium owners is even
greater in the case of second homes.
The number of new owner- The construction activity of residential property is set to decrease further in 2018. Altogether we
occupied properties will fall expect an additional 21,200 residential units (Figure 9). As in the previous year, the condomini-
further in 2018 um segment is likely to be affected most by this decline. An estimated 13,800 condominiums
are expected to be completed, down 5.5% compared with the previous year. However, meas-
ured against existing stock, the expansion remains at a respectable level at 2%. We only expect
a downturn of 1.1% for single-family dwellings, with around 7,400 houses (0.5% of existing
stock) set to come onto the market. From a regional perspective, with the exception of Geneva
and Nyon, it is not the urban centers or high-price regions that are displaying a lively expansion
of residential property but regions located further away from the urban areas (Figure 11).
Figure 9: Net increase and expansion of residential Figure 10: Condominium building permits by project size
property
Net increase in residential units; right-hand scale: expansion as % of stock Project size in number of apartments, share in %
Single-family dwellings (SFD) Condominiums (CON)
SFD expansion as % of stock CON expansion as % of stock 1–10 11–25 26–50 51–100 101–200 > 200
45,000 4.5% 100%
40,000 4.0% 90%
35,000 3.5% 80%
70%
30,000 3.0%
60%
25,000 2.5%
50%
20,000 2.0%
40%
15,000 1.5%
30%
10,000 1.0% 20%
5,000 0.5% 10%
0 0.0% 0%
2001 2003 2005 2007 2009 2011 2013 2015 2017 2002 2004 2006 2008 2010 2012 2014 2016
Source: Credit Suisse, Baublatt, Swiss Federal Statistical Office Source: Credit Suisse, Baublatt
Promoters starting to aban- The decline in the production of condominiums is primarily the consequence of the sharp tight-
don their restraint ening of financing requirements. Particularly threshold households in urban areas are no longer
able to venture into home ownership. The promoters have therefore been more cautious in re-
cent years in the development of new condominium projects. This caution is reflected in smaller
project sizes. While in 2011 around 25% of all newly approved condominiums were attributable
to projects with more than 50 apartments, by the end of 2017 this share had fallen to 14%
(Figure 10). The successful soft landing of residential property so far is now prompting investors
to increase their planning activity again. This is set to become visible in the next two years in
planning applications and building permits.
Conversions can The extent of the expansion of owner-occupied properties is currently afflicted by greater uncer-
increase expansion tainty than is otherwise normally the case. Many investors are increasingly planning both condo-
miniums and rental apartments in the case of major projects. This way they wish to keep open
the option of switching from one segment to the other shortly before completion and marketing.
Growing marketing difficulties on the rental accommodation market are also prompting investors
to advertise properties already completed as condominiums – not infrequently with success.
“Buy-to-let” properties A further uncertainty factor is posed by “buy-to-let” investments. These comprise individual con-
could likewise boost supply dominiums or single-family dwellings purchased by private individuals with the objective of letting
1
Galliker, P., Mötteli, M., Qelaj, D. (2017). Ausschöpfung des Verdichtungspotenzials im Stockwerkeigentum durch Aufstockung,
Lucerne University of Applied Sciences and Arts
Real Estate Market 2018 I February 2018 11Swiss Economics
them out for investment purposes. It is estimated that almost a fifth of all newly completed con-
dominiums fall under this category. Their owners bear a high cluster risk and are likely to dispose
of these apartments again in the event of a further rise in vacancies. A detailed examination of
rental apartments advertised on online platforms reveals that 7,150 advertised rental apartments
are located in properties that also contain condominiums. Measured against the total number of
91,700 advertised rental apartments, this is a substantial number. The current overproduction of
rental apartments could therefore also trigger an upturn in supply on the residential property
market. However, as the target groups of these two housing types differ relatively significantly
from each other, conversions involve challenges that mean that we do not expect all that great
an effect in terms of volumes.
Figure 11: Planned expansion of residential property
As % of housing stock and compared with the previous year (arrows)
> 1.75%
1.5 – 1.75%
1.25 – 1.5%
1 – 1.25%
0.75 – 1%
0.5 – 0.75%
< 0.5%
YoY change
Sharp increase
Slight increase
Sideways movement
Slight decrease
Sharp decrease
Source: Credit Suisse, Baublatt, Geostat
Market outcome: Residential property prices rising again
Supply and demand Supply and demand on the market for owner-occupied residential property remain close to each
lie close to each other other. The cautious expansion of residential property by the promoters corresponds well with the
deliberate curbing of demand by the regulators so that in volume terms no noticeable imbalances
have emerged. Vacancies have therefore only increased slightly in the past year. The vacancy
rate of condominiums rose from 0.84% to 0.87% (Figure 12), which is equivalent to 332 addi-
tional vacant condominiums. At 220 houses, the increase for single-family dwellings was even
lower. The vacancy rate of single-family dwellings rose from 0.40% to 0.41%. Vacancies thus
remained at a low and unproblematic level in both segments.
Vacancies only at a high A decrease in vacancies was even recorded in several regions (Figure 13). Vacancies fell in
level in the Alps particular in the areas surrounding Switzerland’s major population magnets in the Lake Geneva
and Zurich areas. The highest residential property vacancy rates continue to be recorded in the
Alpine regions. Partially they have been somewhat reduced. However, the oversupply brought
about by the second home initiative and the uncertainty among buyers have obviously not yet
been completely digested.
Supply rate even In contrast to vacancies, the number of advertised existing properties is actually falling slightly at
falling present (Figure 14). Compared with the previous year, the supply rate of condominiums de-
creased again slightly from 3.4% to 3.3%. In the case of single-family dwellings it fell from
1.7% to 1.6%. The decline to levels recorded in the boom years of 2010 to 2012 illustrates
Real Estate Market 2018 I February 2018 12Swiss Economics
how strong demand would actually be if it were not artificially stifled by the high financial re-
quirements for mortgage lending.
Figure 12: Vacancies of residential property Figure 13: Regional vacancies of residential property
Left-hand scale: as % of applicable stock; right-hand scale: absolute change As % of stock of residential property
CON absolute change (r.h.s.) Vacancies 2017
1.50% SFD absolute change (r.h.s.) 1,600 > 1.5%
CON vacancies as % 1.25 – 1.5%
SFD vacancies as % 1 – 1.25%
1.25% 1,200 0.75 – 1%
0.5 – 0.75%
0.25 – 0.5%
1.00% 800 < 0.25%
0.75% 400
0.50% 0
0.25% -400
Change 2016 – 2017
0.00% -800 Sharp increase
2001 2003 2005 2007 2009 2011 2013 2015 2017 Slight increase
Sideways movement
Slight decrease
Sharp decrease
Source: Swiss Federal Statistical Office, Credit Suisse Source: Swiss Federal Statistical Office, Credit Suisse, Geostat
Time on market has fallen The increase in time on market following the entry into force of the lowest value principle and
again recently higher payback requirements due to tighter self-regulation measures in the fall of 2014 serves to
prove that the regulatory measures are having an effect (Figure 14). Since then, potential buyers
have had to contribute more equity in all cases in which the purchase price exceeds the lending
value. Furthermore, the imputed affordability has deteriorated further owing to the higher repay-
ments. The tightening of affordability has now come to a halt and the time on market and hence
the marketing costs have fallen again somewhat in the last few quarters. This will be attributable
to the price correction at the end of 2016 and start of 2017 that benefited the attractiveness of
owner-occupied properties.
Expensive residential prop- The marketing costs have for some years risen all the more with the increasing price level. This
erty causes the greatest applies to the majority of regions and refers less to the absolute than to the relative price level in
marketing costs a region. For this reason we have analyzed the price level of the advertised properties in relation
to the average in the corresponding region. The evaluation in Figure 15 shows that properties
sold at the average price in 2017 were on average advertised for 129 days. By contrast, the
average time on market in the most expensive price category in which the price level is at least
50% above the average was 45 days longer at 174 days. In some cases the time on market of
expensive properties lasted for more than 60 days longer than for the average property. Howev-
er, the different times on market have started to converge again since mid-2016.
Figure 14: Supply rate and time on market Figure 15: Time on market by price segment
Existing properties, supply rate as % of applicable stock, time on market in number Time on market in number of days
of days
150 Supply rate, CON (r.h.s.) 6.0% 200 +++ (top price segment)
Supply rate, SFD (r.h.s.) ++
Time on market, CON (l.h.s.) +
180 = (medium price segment)
125 Time on market, SFD (l.h.s.) 5.0% -
--
160 --- (bottom price segment)
100 4.0%
140
75 3.0%
120
50 2.0%
100
25 1.0% 80
0 0.0% 60
2007 2008 2009 2010 2011 2012 2013 2014 2015 2016 2017 2007 2009 2011 2013 2015 2017
Source: Meta-Sys AG, Credit Suisse Source: Meta-Sys AG, Credit Suisse
Real Estate Market 2018 I February 2018 13Swiss Economics
Vacancies should remain In view of the economic performance supporting demand and the continued decline in construc-
low and prices increase tion activity, we expect a relative shortage of residential property. This will be reflected in 2018 in
moderately in 2018 continued low vacancies. Even a slight fall in vacancies lies within the realms of possibility. We
therefore anticipate a solid positive price performance again for 2018. After still remaining nega-
tive at the end of 2016 and the start of 2017, there was a turnaround over the past year in the
price trend for owner-occupied residential property (Figure 16). Compared with the prior-year
quarter, the latest price increase came to 1.4% for condominiums and 1.9% for single-family
dwellings (3rd quarter 2017). Even in the area around Lake Geneva, where the recent price
correction was felt the most, the majority of prices rose again. Moderate price falls are still cur-
rently being recorded in particular in the cantons of Valais, Schwyz, Glarus, the two Appenzells
and in parts of the cantons of Ticino and Graubünden (Figure 17). Altogether we expect moder-
ate price growth of 2-2.5% for 2018, with prices in the Zurich/Zug area set to rise most sharp-
ly. In the high-price segment as well the correction of prices should be completed. However, we
do not expect a return to an overheated owner-occupied housing market as the momentum is
being too strongly neutralized by the high price level and regulatory restrictions for this to hap-
pen.
Figure 16: Price growth of residential property Figure 17: Price growth of residential property (regional)
Annual growth rates in the medium price segment Annual growth rates of residential property (medium segment), Q3 2017
Annual growth single-family dwellings Annual growth
10%
> 4%
Annual growth condominiums
2 – 4%
8% Annual growth residential property 1 – 2%
0 – 1%
6% -1 – 0%
-2 – -1%
4% -4 – -2%
< -4%
2%
0%
-2%
-4% Compared with
2000 – 2016 p.a.
-6% Well above average
Slightly above average
2011 2012 2013 2014 2015 2016 2017 Average
Slightly below average
Well below average
Source: Wüest Partner, Credit Suisse Source: Wüest Partner, Credit Suisse, Geostat
Imbalances As property prices increase once more, the discussions concerning the sustainability of price
set to increase again performance are set to flare up again. We still consider the current price level in a majority of
regions to be unsustainable. While in many places the widening gulf between property prices and
income has been narrowed somewhat thanks to the price falls at the end of 2016 and the start
of 2017, the discrepancies still remain substantial. However, the imbalances are not the result of
speculative exaggerations but of an equally unsustainable interest rate level. The future changes
to the interest rate level will therefore define the path for bringing property prices better into line
with incomes again in the long term.
Real Estate Market 2018 I February 2018 14Swiss Economics
Outlook for owner-occupied housing in 2018
Ausblick Wohneigentum 2018
Seite 15 mit separater PDF-Seite ersetzen
(Dokument: „IS18_Ausblick_Wohneigentum_Outlook_vTranslation_EN“)
Mortgage interest rates
5-year fix mortgage 10-year fix mortgage LIBOR mortgage
(3-month LIBOR)
2.00%
1.27% 1.40% 1.59%
1.00% 1.00%
2017 2018 2017 2018 2017 2018
Demand Supply
Net increase in no. of homes
20 000 2018
+ 7 400 Single-family dwellings
+ 13 800 Condominiums
15 000 2017
+ 7 500 Single-family dwellings
+ 14 600 Condominiums
10 000
5 000
Curbed demand:
•L ow mortgage interest rates and an improved economy 0
boosting demand 2013 2014 2015 2016 2017 2018
• High prices and regulatory requirements curbing demand Single-family dwellings Condominiums
2018: Demand neutralized Falling new construction activity losing momentum:
•P romoters starting to abandon restraint
• Increased conversions of rental apartments to owner-occupied
housing
2018: Supply to fall again due to delayed impact
Vacancies
• Even a slight fall in vacancies is possible due to the falling demand
• Marketing costs will nevertheless remain high
2018: Vacancies of owner-occupied housing to remain at a low level
Prices
Growth of transaction prices in %
Single-family dwellings Condominiums
2016 2017 * 2018
+1.9% +2.5% +1.4% +2.0%
+0.5% –3.1%
2016 2017 * 2018
* Q 3 2017
Real Estate Market 2018 I February 2018 15Swiss Economics
Special focus: Decision process when buying a home
Clear division of roles
The acquisition of owner-occupied housing is one of the most important decisions of a house-
hold. The decision process normally follows a clear sequence of steps from recognizing the
need, seeking a property and evaluating alternatives through to the final purchase decision. The
theory generally ignores the fact that a household consists of individual family members with
different roles and preferences. In order to find out more about this decision process, we have
talked not only to real estate agents but also to our financing specialists with a view to the entire
process from initial viewing to financing.
Joint purchase but Our survey among both agents and financing specialists has revealed that owner-occupied hous-
individual needs ing is in most cases jointly bought and occupied. Almost three quarters of all buyers are couples
with or without children. This is also confirmed by data about home owners from the Swiss Fed-
eral Statistical Office. However, it is interesting to note that single men buy property somewhat
more frequently than women. There are also differences among couples between the genders.
Ninety-seven percent (!) of the real estate agents questioned by us affirm gender-specific differ-
ences in the acquisition of owner-occupied housing and the financing specialists also see clear
differences, although with a lower approval rate of 67%. An identical picture is painted by inter-
national studies.2 Among younger families with children, it is often the mother who expresses the
desire for home ownership. The reasons for this lie in the requirement for more space, the divi-
sion of roles within the family and the financial security offered by home ownership. If, however,
there are no children, the process is equally triggered by both partners. Meanwhile, men are the
driving force behind the desire for home ownership above all in later phases of life.
Women more active in Women are happy to take the lead in the search for a desirable property. Our survey shows that
search for property in 53% of cases it is women who make initial contact with the agent (Figure 18) while men are
only responsible for 41% of initial contacts. The dominant role of women is also manifested in
the initial viewing. Particularly interesting here is what happens when only one of the two part-
ners attends the initial viewing. If it is the man, it is more frequently the case that no transaction
takes place even if he likes the property. The preferences of the woman concerning the property
being focused on therefore carry more weight than those of the man. This may among other
things be due to the fact that functional aspects play a greater role for the partner who mainly
takes care of the children. This is still typically the woman today.
Figure 18: Decision behavior in search for property Figure 19: Decision behavior for financing
Shares in %; agents canvassed: 31 Shares in %; financing specialists canvassed: 96
Woman Man Both together Unknown Woman Man Both together Unknown
70% 70%
60% 60%
50%
50%
40%
40%
30%
30%
20%
20%
10%
10%
0%
0% Who among couples Who among couples Who among couples takes
Who among couples Who among couples Who among couples makes initial contact ultimately plays the the lead in selecting the
makes initial contact plays the crucial role in leads the financial (with the financing crucial role in deciding mortgage (product, term,
(with the agent)? deciding on a property? negotiations? specialist)? on a property? type of repayment)?
Source: Credit Suisse Source: Credit Suisse
2
See, e.g., Levy and Lee (2004). The influence of family members on housing purchase decisions
Real Estate Market 2018 I February 2018 16Swiss Economics
Kitchen, neighbors and But what is it that is important for men and women when selecting a property? Our survey con-
child friendliness are the firms the common clichés according to which men are interested in the technical fittings and
most important criteria for parking space but women in the kitchen and bathroom. It is interesting to observe how clearly
her these patterns emerge (Figure 20). However, the focus of women is not limited to the features
of the property itself. On the basis of insights into areas such as neighbors/social environment,
child friendliness of the property and micro location, particularly also with regard to the reachabil-
ity of kindergartens and schools, it can be seen that the home’s surroundings and location play a
more important role for women. Another significant factor is whether a property has an emotional
appeal. If women do not like a property at the beginning, it generally falls right out of the race.
Financial aspects, parking A very different picture emerges for men. Financial aspects concerning the property are general-
and technical fittings im- ly paramount here (Figure 20). The primary criterion is the price of the property and the potential
portant for him scope for negotiation. Regarding the property itself, alongside parking/garage facilities, the
technical fittings are important for many men. These range from heating systems to electrical
sockets and internet connections. Men are also more likely to question the construction quali-
ty/structure and the refurbishment requirements of existing properties. However, in contrast to
women, the features of the property have less significance and men rarely raise the topics of
children/neighborhood.
Women ultimately decide on As a result of the major differences concerning the importance of the different areas, couples
the choice of property mutually complement each other very well and jointly cover the relevant aspects. In view of the
clear division of roles between the genders, it ultimately comes as little surprise that it is largely
women who play the crucial role in deciding for or against a property (Figure 18). Our survey
among agents reveals that women are responsible for this decision in 56% of cases but men in
only 23% of cases.
Men conduct the price ne- However, the roles are reversed when it comes to price negotiations for the desired property.
gotiations Men are responsible for this in almost two thirds of cases. Women only take on the lead in the
price negotiations in 20% of cases. Here too a classic division of roles between the genders can
therefore be observed.
Figure 20: Topics in search for property Figure 21: Topics for financing
On which topics are the questions of potential buyers concentrated; agents can- On which topics are the questions of potential buyers concentrated; financing spe-
vassed: 31 cialists canvassed: 96
Financial aspects Interest rate
Kitchen Mortgage products
Parking/garage Location/infrastructure
Location Purchase price
Neighbors/social env. Costs
Technical fittings Financial security
Child friendliness Affordability
Bathrooms Expiry of financing
Room uses Conditions
Infrastructure/micro location Uncertainty of affordability
Layout/floor plan Repayment
Constr. quality/refurb. req. Equity/loan-to-value ratio
Women Sale/resale Women
Public transport
Emotion Men Budget/financial planning Men
Less Very Less Very
important important important important
Source: Credit Suisse Source: Credit Suisse
Men contact the bank However, the property acquisition process is not complete with the selection of the desired
property as the financing still has to be secured. This places many households before major and
in some cases insurmountable obstacles specifically in Switzerland with its high property prices
and strict financing guidelines. An opposite division of roles compared to the property search
already emerges at the initial contact with the bank. Initial contact with the bank is made by men
in 52% of cases (Figure 19). Women only establish initial contact in 37% of cases. In financing
issues such as selection of the mortgage product, the desired mortgage term and type of re-
payment, the man assumes the leading role in 41% of cases and the woman in only 28%. This
confirms what was already observed concerning the choice of an object: As soon as financial
aspects come into play, the man is more frequently in the lead.
Real Estate Market 2018 I February 2018 17Swiss Economics
Women focus on security in Aspects important for women when contacting the financing specialists above all revolve around
terms of financing the topic of financial security (Figure 21). The affordability and in particular uncertainties con-
cerning affordability are likewise important discussion points for women. For example, this in-
cludes questions of whether and in what form part-time work after the birth of a child, possible
unemployment or retirement could impact the affordability of the property. The high importance
of the security aspect is also reflected in the fact that the topic of repayment is more frequently
broached by women. It is interesting to note that the topic of location/infrastructure is often
raised again with the financing specialist. Women thus also tend more to seek the expertise of
the financing specialist with regard to the property itself.
Men wish to optimize the By contrast, the prime issue of importance for men in their dealings with the financing specialist
financing is what mortgage interest rate they receive and which costs are ultimately entailed by the mort-
gage. They more closely address the question of mortgage products and their terms. The prop-
erty price also plays an important role for men. This may be influenced by the fact that men see
the acquisition of owner-occupied housing more as an investment and therefore wish to know
from a financing expert whether the price for the selected property is justified. The property’s
resalability often comes up in this respect. With properties recently having become very expen-
sive, verification of the price will no doubt also be aimed at sounding out any potentially existing
scope for price negotiations with the seller.
Women make the final The decision about financing and therefore ultimately about the object of purchase is taken
decision jointly in 36% of cases (Figure 19). Where the decision is not taken jointly, according to the
financing experts women are more frequently responsible for the final decision (35% of cases)
than men (just 24% of cases). This thus confirms the picture gained concerning the choice of
home ownership of women more frequently having the final say. According to the literature, the
differences are relativized accordingly where there are no children. Some of the gender-specific
differences can therefore be explained by the varying division of roles.
Stronger together than Our surveys confirm the results of international research studies according to which clear re-
alone sponsibilities emerge between the genders for the individual process steps in the decision pro-
cess for the purchase of owner-occupied housing. However, a glance at the different focuses of
concern also very nicely illustrates how well the two perspectives complement each other and
how all relevant aspects concerning the purchase of owner-occupied housing are jointly covered.
Couples therefore mutually support each other in an optimum manner and ensure that nothing
gets forgotten.
Utilizing gender differences Sellers and agents can attempt to make strategic use of the differences in decision behavior. In
in negotiations order to sell a property, they primarily need to convince the woman. For this purpose it is essen-
tial to address consciously the areas that are important for women and to provide appropriate
information. Potential buyers should also be aware of this. This is particularly crucial for any price
negotiations. If the woman has already made known how much she would like to have a proper-
ty, the man will barely have any leeway in the price negotiations. The following therefore applies
from the perspective of potential buyers: Don’t put your cards on the table immediately but act
skillfully in order to preserve your scope to act in the event of any price negotiations.
Real Estate Market 2018 I February 2018 18Swiss Economics
Rental apartments
The upturn will not be enough
The outlook on the rental accommodation market is deteriorating further. This is evidenced by
growing vacancies, rising pressure on rents and tenants who outside the major centers are in-
creasingly gaining the upper hand. However, thanks to high yield premiums, investors are not
being put off by the increasing risks and are continuing to invest in the rental accommodation
market. Rental apartment construction therefore remains at a very high level. At the same time
the market is being confronted with falling demand as immigration is continuously losing momen-
tum. However, the rental accommodation market is receiving support at exactly the right time
and the emerging robust economic upturn is set to stabilize demand. It may curb the growth of
vacancies, but it will not be able to halt it.
Demand: Immigration stabilizing
Net migration down again in 2017 was the fourth year in succession with falling net migration. Taking account of immigra-
2017 tions and emigrations of Swiss citizens, net migration over the past year reached an estimated
52,000 persons, a decrease of 12% compared with the previous year (Figure 22). This repre-
sents the lowest net migration since the year preceding the entry into force of the full free
movement of persons with the 15 EU countries ten years ago. The gradual decline in immigra-
tion since 2013 is also almost completely attributable to net migration from EU countries (–50%)
and was brought about by an economic downturn in Switzerland due to the franc shock in com-
bination with an economic upturn in most EU countries. Net migration from Portugal, for in-
stance, that in 2013 on balance amounted to 14,600 persons, changed into a net return migra-
tion of 570 persons in 2017. By contrast, migration from non-European countries has had a
stabilizing effect since 2013 and grown by 28%.
Figure 22: Net migration and economy Figure 23: Permanent and temporary resident population
Net migration of permanent resident population (excluding register corrections, Net migration, 12-month totals, including register corrections
including net outward migration of Swiss citizens); 2017: extrapolation; 2018:
forecast
8% Net migration (rhs) Forecast (rhs) 120,000 90,000 90%
7% YoY employment Diff. GDP YoY CH – Eurozone 110,000 80,000 80%
6% 100,000 70,000 70%
5% 90,000 60,000 60%
4% 80,000 50,000 50%
3% 70,000 Total YoY change (rhs)
40,000 Usual resident foreign population 40%
2% 60,000 30,000 Temporary resident foreign population 30%
1% 50,000 20,000 20%
0% 40,000 10,000 10%
-1% 30,000 0 0%
-2% 20,000 -10,000 -10%
-3% 10,000 -20,000 -20%
-4% 0 -30,000 -30%
2002 2004 2006 2008 2010 2012 2014 2016 2018 2010 2011 2012 2013 2014 2015 2016 2017
Source: State Secretariat for Migration, State Secretariat for Economic Affairs, Swiss Federal Source: State Secretariat for Migration, Credit Suisse
Statistical Office, Datastream, Credit Suisse
Exaggerated decline A closer examination reveals that immigration stabilized toward the end of 2017. Net migration
in immigration even recorded slight year-on-year growth (+1.1%) in the fourth quarter of 2017. The net migra-
tion of short-term residents (temporary resident foreign population) also developed dynamically
and at a good 700 persons was in positive territory again in 2017 for the first time since 2013
(Figure 23). The main reason for this is the safety valve concerning Bulgaria and Romania (EU-
2) ratified by the Federal Council on 1 June 2017 that limits migration from these countries for a
maximum of two years. As it has so far only been applied to residence permits (B permits), there
Real Estate Market 2018 I February 2018 19You can also read