The Logistics Report 2014 - The voice of the industry for 125 years
←
→
Page content transcription
If your browser does not render page correctly, please read the page content below
The Logistics Report 2014

In association with

                            The voice of the industry for 125 years
FTA is one of the UK’s largest trade associations and represents over 14,000 companies relying on or
                 providing transport integration both domestically and internationally, to or from the UK. Our members
                 include hauliers, freight forwarders, rail, sea and air freight operators, through to customers – producers,
                 manufacturers, wholesalers and retailers.They cover all modes of transport – road, rail, air and sea. FTA
                 members operate over 200,000 commercial goods vehicles on the roads in the UK; approximately half
                 of the UK fleet. FTA members also consign around 90 per cent of goods moved by rail and around 70
                 per cent of goods moved by air and sea.

                 You can find more information at www.fta.co.uk, follow us on twitter.com/newsfromfta and join us on
                 facebook.com/ftafb

In association
with

                 The transport and logistics sector is taking centre stage, increasingly recognised as key to stimulating
                 trade, helping business efficiency and supporting economic growth. It is also vital to the nation’s
                 competitiveness and connectivity with the rest of the world.

                 The Government is increasing its focus on transport infrastructure. Developing rail network capacity
                 via HS2 and Crossrail, investing in the road network and planning the next wave of airport capacity
                 expansion evidence this.

                 In an era of accelerated globalisation, with both business and consumers demanding better transport
                 options, an integrated transport strategy is more important than ever. Getting this right will be key to
                 driving the best return on investment.

                 Coolin Desai
                 Transport & Logistics Leader
                 PwC UK

                 PwC UK helps organisations and individuals create the value they’re looking for. We’re a member of the PwC network of firms
                 in 157 countries with more than 184,000 people committed to delivering quality in assurance, tax and advisory services. Tell us
                 what matters to you and find out more by visiting us at www.pwc.com/uk

                 To find out more about our transport and logistics insights please visit www.pwc.co.uk/transport-logistics

                  This publication has been prepared by FTA and, as such, the views and findings it presents in this document are not
                  necessarily those of PwC, unless specifically stated. Those sections which are attributed to PwC have been prepared for
                  general guidance on matters of interest only, and do not constitute professional advice. You should not act upon the PwC
                  contribution contained in this publication without obtaining specific professional advice. No representation or warranty
                  (express or implied) is given as to the accuracy or completeness of the PwC contribution contained in this publication
                  and, to the extent permitted by law, PricewaterhouseCoopers LLP, its members, employees and agents do not accept or
                  assume any liability, responsibility or duty of care for any consequences of you or anyone else acting, or refraining to act, in
                  reliance on the information contained in this publication or for any decision based on it.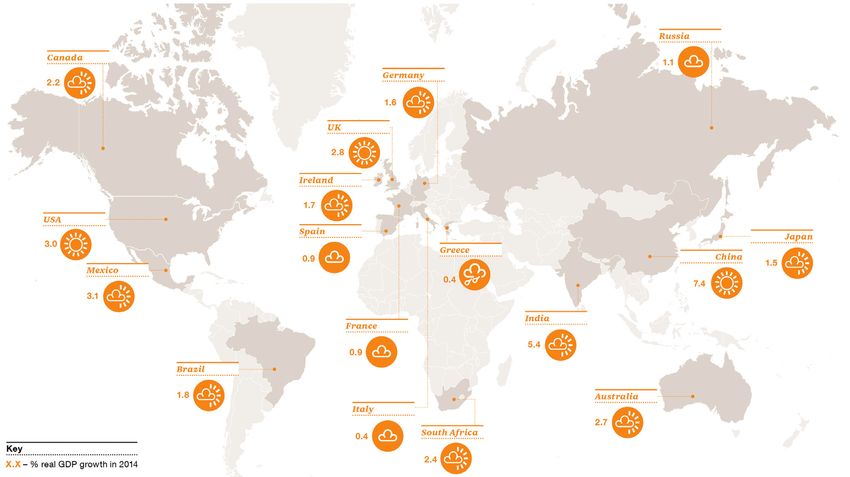
Introduction

                                Welcome to the Logistics Report 2014 – FTA’s analysis of the ideas, news and views
                                that shaped the last year.

                                We are delighted that, once again, PwC has supported this publication, now in its fifth
                                year, allowing us to combine the resources and knowledge of both our organisations
                                and draw on a rich supply of independent and in-house research.

                           This year we review the main developments that will inform politicians’ and other
                           stakeholders’ actions in respect of logistics in the years to come. We also explore the
                           influences that we believe businesses should take into account as they deliberate, plan
                           and invest for the future. With the next General Election a year away, we have focused
                           on the influence of politics on logistics and assessed what debates in Westminster and
in local government will mean for us. We have also focused on the final miles of the supply chain, the continuing
pressure on scarce road space in our towns and cities and the consequences of e-commerce.

Our report would not be complete without an analysis of the logistics market and the sentiment of those engaged
in it.This is made possible through the direct contribution our members make to our policies and research through
Freight Councils, as well as our regular and ad hoc surveys.Their insights and experience add invaluable depth and
breadth to every aspect of our work. This year FTA members report increased optimism about business growth
and key indicators suggest that companies are planning to invest in their people, technology and systems.

We hope you find this report a thought-provoking and refreshing assessment of UK logistics.

Theo de Pencier
Chief Executive
Freight Transport Association
Contents

Introduction                                                                      3

The year in logistics                                                             6

The logistics dashboard                                                        10

Chapter 1

On the road to recovery?                                                       14

Chapter 2

Making connections                                                             38

Chapter 3

Better logistics                                                               58

Chapter 4

Quest for skills                                                               74

Evidence base                                                                  92

                           The Logistics Report 2013 © Freight Transport Association
                                                                                       5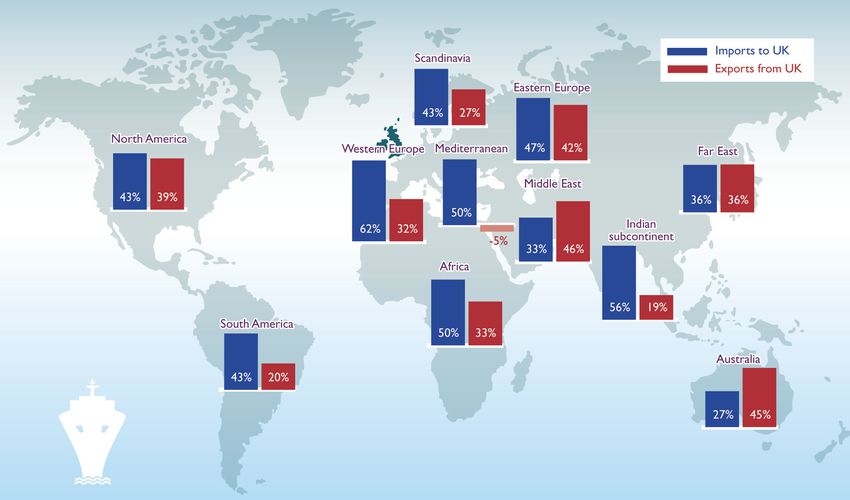
The year in
logistics
The year in logistics
jan FEB MAR APR

MAY JUN JUL AUG

SEP OCT NOV DEC

                                               Economy and business performance
                                                      Economic indicators for UK logistics improved in 2013: demand for movement of goods showed
                                                      the first year-on-year improvement since 2010
                                                      But the number of goods vehicle operator licences continued to fall
                                                      58 per cent of FTA members expect increased business activity during 2014
                                                      FTA members said that UK economic competitiveness recovered in 2013 when compared with
                                                      the rest of the EU and global competitors
                                                      Higher and unpredictable world oil prices and lack of
                                                      economic growth are the main risk areas for logistics
                                                                                                                 UK exports to rest of world begin
                                                                                                                     to increase by just over 1 per
                                                                                                                    cent, in line with increasing hgv
                                                                                                                   movements to mainland Europe
                                                                            Reported profit margins
                                                                           for the top 100 hauliers
                                                                          rose to 3 per cent in 2013
                                                                           from 1 per cent in 2012
                                                                                                                  Inflation as measured by the retail
                                                                                                                    price index (RPI) reduced to 2.7
                                                                                                                   per cent in December 2013 from
                                                                          Fuel prices have remained                 3.1 per cent a year earlier. Basic
                                                                         relatively stable for the past           pay for transport staff only rose by
                                                                        3 years due to fuel duty freeze             2.2 per cent in the same period

                                               Connectivity and consumers
                                                     First scheduled vessel calls at London Gateway
                                                     Airports Commission confirms there is a need for new airport capacity in the south east of
                                                     England
                                                     Government consults on a new night flights regime
                                                     The Office of Rail Regulation continues its Periodic Review and customers are worried about
                                                     future access charges for freight
                                                     Government publishes Investing in Britain’s Future, outlining a major programme of roads
                                                     investment and transformation of the Highways Agency into a publicly owned corporation
                                                     Government decides not to toll improvements to the
                                                     A14
                                                     Mayor of London’s Roads Task Force report signals a                  “The biggest programme
                                                     dramatic change in the way road space is allocated in                   of investment in our
                                                     the Capital                                                              roads in 40 years.”
                                                                                                                    Rt Hon Danny Alexander MP
                                                                                                                     Chief Secretary to the Treasury

8        The Logistics Report 2014 © Freight Transport Association
The year in logistics

Politics of logistics
  HGV Road User Levy Act is passed allowing foreign operators to be charged for using UK roads
  for the first time from 2014
  The FairFuelUK campaign, of which FTA is a key supporter, continues to make the case for cuts in
  fuel duties
  In the Autumn Statement the Chancellor confirms a
  freeze in fuel duty until the end of the Parliament               “And I can tell you today
  Growing uncertainty over implications of High Speed            that  provided we can find the
  2 and concern over the impact on market confidence              savings  to pay for it, I want
  of changes to track access charges for rail freight              to freeze  fuel duty for the
                                                                     rest of this Parliament.”
  Debate over paying for infrastructure escalates with
  Government proposing tolls for the improved section          Rt Hon George Osborne MP
  of the A14                                                    Chancellor of the Exchequer
                                                                 Conservative Party Conference 2013

Safety and environment
  Safety standards for hgvs continue to improve and the number of accidents involving hgvs
  continues to fall nationally
  But six cycling deaths involving hgvs occur in a few weeks toward the end of 2013 sparking calls
  for lorries to be banned from central London at certain times of day
  Hgvs and cyclist safety is a key topic at FTA’s annual Transport Manager conferences
  National Construction Logistics Standard is launched, aimed at improving safety for vulnerable
  road users
  The EU proposes changes to the design of trucks to make them more aerodynamic, greener and
  to improve safety
  The Supreme Court rules that the UK Government has failed in its legal duty to protect people
  from air pollution
  Mayor of London announces that Transport for
  London will investigate an Ultra-Low Emissions Zone              Number of reportable (RIDDOR)
  to be introduced by 2020                                             workplace accidents for
  Chancellor announces extension of duty differential on            transport falls by 29 per cent
  natural gas to 10 years

Skills and training
  FTA members expect the number of redundancies to reduce and the number of staff to increase
  in the next year
  With the hgv Driver CPC deadline a year away concern mounts that some drivers may choose to
  stop driving trucks rather than acquire the qualification
  Levels of youth unemployment were of significant concern to policy makers in 2013
  Almost 1 million driver training days were
  delivered for the Driver CPC
                                                            49 per cent of transport and distribution
                                                               managers and 38 per cent of hgv
                                                                drivers are over the age of 45

                                                               The Logistics Report 2014 © Freight Transport Association
                                                                                                                           9
The logistics
dashboard
The logistics dashboard
Logistics is the backbone of the economy, providing the efficient, cost effective flow of goods on which other commercial sectors
depend.The logistics dashboard brings together a range of over 50 indicators (LDIs) that give different perspectives on logistics and the
performance of the wider economy. The moderately improving UK economy is reflected in the 2014 edition of the logistics dashboard,
which captures the impact of the green shoots of recovery in the UK, and the early signs of an end to the Euro Zone recession.

Goods vehicle operator licences were down 15 per cent in 2012, compared to the onset of the recession in 2008. The number of
van licences was marginally up, by nearly 1 per cent year-on-year. New hgv registrations are just 2 per cent below their 2008 level,
having decreased up until 2012. Since then they have increased for 2 years running by 6 per cent and 23 per cent respectively. Road
transport operator profit margins recovered to around 3 per cent in 2013, compared to 1 per cent for the previous year. The price of
oil has hovered around $110 per barrel (bbl) for the past three years, resulting in little change to the high pump price for a litre of fuel.
Improvements in the Euro Zone saw unaccompanied trailer movements rise in 2013 by 5 per cent compared to 2012.

However, the after effects of the European economic crisis saw a reduction in port traffic and stagnation in air freight traffic in 2013
compared to 2012. Domestic intermodal rail has decreased slightly by 2.5 per cent, down to 6.2 billion tonne kilometres in 2013, and
goods moved by rail grew by 4 per cent over the same period.

In terms of compliance, there was a decrease in detection of incidences of overloading and drivers’ hours infringements but a small
increase in roadworthiness prohibitions in 2012. Hgv and van failure rates both decreased marginally. Safety shows a mixed picture with
workplace accidents reported down by 29 per cent but road casualties linked to hgvs up by 1 per cent year-on-year.

                                                                                                                                                                 Most recent
                                                                                                                                                                                Page
                                              LDI                                    2008        2009        2010         2011            2012          2013     year-on-year
                                                                                                                                                                                 ref
                                                                                                                                                                    change

Road transport industry

    1     Reported profit margin of top 100 road hauliers                             2%          1%          4%            4%              1%           3%                      30

    2     Number of goods vehicle operator licences                                 95,436      91,200      87,747        84,072          80,894                                 21

    3     Population of hgvs licensed                                              416,328     397,160     389,761       383,941         378,775                                 21

    4     Population of vans licensed                                              3,253,416   3,241,047   3,258,445    3,293,451       3,320,431                                22

    5     Population of hgv trailers (based on number tested)                      240,094     230,966     227,057       224,714         220,283                                 22

    6     Hgv registrations                                                         57,410      34,746      34,458        42,944          45,702       56,218

    7     Van registrations                                                        289,463     186,386     222,915       260,153         239,641       271,073

    8     Number of hgv drivers in employment (thousands)                            306         299         274           288             280          255

    9     Claimant count (hgv drivers for December)                                 8,880       10,665      6,550         5,870           5,050         2,875                    28

    10 Hgvs laid up (SORN)                                                          63,390      64,109      60,709        61,979          60,735                                 22

Safety

    11 Hgv motor vehicle test pass rate initial (>3.5tonnes gvw)                    67.6%       72.6%       74.5%         75.3%           77.6%

    12 Van test pass rate initial (Class 7)                                         50.7%       50.0%       49.5%         49.8%           49.7%
          Hgv roadside encounter prohibition rate percentage – mechanical checks
    13                                                                              31.8%       31.1%       26.2%         28.4%           29.5%
          (UK drivers only)
          Hgv roadside encounter failure rate percentage – drivers’ hours checks
    14                                                                              16.7%       14.3%       16.1%         19.7%           19.4%
          (UK drivers only)
          Hgv roadside encounter failure rate percentage – weight checks
    15                                                                              30.6%       37.5%       58.0%         60.6%           59.7%
          (UK drivers only)
    16 RIDDOR reportable workplace accidents for transport                          21,258      19,222      17,255        16,313          11,532

    17 Road casualties linked to hgvs (number killed or seriously injured)          1,712       1,439       1,379         1,334           1,348

Efficiency

    18 Percentage of hgvs empty running                                             28.9%       28.3%       28.7%      not available   not available

    19 Percentage of inland freight moved by rail (billion net tonne kilometres)     9.0%        9.0%        9.0%      not available   not available

1        FTA estimate

12              The Logistics Report 2014 © Freight Transport Association
The logistics dashboard
Most recent
Page
LDI 2008 2009 2010 2011 2012 2013 year-on-year
ref
change
Efficiency (continued)
20 Lading factor percentage for hgvs (>3.5 tonnes gvw) 58.0% 57.0% 59.0% not available not available
21 Hgv fuel consumption (mpg) (articulated vehicles) 7.7 7.7 7.6 not available not available
0.8 mt of oil 1.0 mt of oil 1.2 mt of oil 1.1 mt of oil 1.0 mt of oil
22 Use of alternative fuels in hgvs
equivalent equivalent equivalent equivalent equivalent
23 Average hgv payload capacity (tonnes) 7.2 6.9 7.4 not available not available
Traffic Flows
24 Containers handled by major UK ports (thousand TEUs) 8,714 7,373 8,222 8,141 7,980
25 Freight handled by air (tonnes) 2,282,153 2,047,861 2,324,822 2,297,601 2,302,329
26 Goods moved by hgvs (>3.5 tonnes gvw) (billion tonne kilometres) 146 125 139 not available not available
27 Van kilometres (billion vehicle kilometres) 66.9 65.5 66.1 66.6 66.4
28 Cabotage within the UK (million tonne kilometres) 1,712 1,231 1,272 1,054 not available
29 Goods moved by rail (billion tonne kilometres) 21.08 19.17 18.58 20.97 21.47 22.40
30 Goods moved by domestic intermodal rail (billion tonne kilometres) 5.29 5.30 5.58 6.17 6.36 6.20
31 Channel Tunnel rail freight volumes (tonnes) 1,239,445 1,181,089 1,128,079 1,324,673 1,227,139 1,363,834
32 Number of rail freight train movements 316,684 278,472 265,559 273,897 275,827
Rail freight performance measure (percentage of freight trains arriving on
33 70.2% 74.5% 74.0% 74.8% 75.3% 73.6%
time at their final destination)
34 Percentage penetration of cross-Channel market by UK hgvs 18.6% 19.7% 21.1% 19.9% 18.7% 16.0%
35 Hgv movements to mainland Europe (unaccompanied trailers only) 708,648 610,915 673,236 660,397 619,699 652,060 23
36 Hgv movements to mainland Europe (all powered vehicles) 2,059,694 1,764,087 1,794,376 1,811,521 1,810,652 2,037,229 22
Economic indicators
UK economic activity
37 GDP (Q4 annual percentage change) -4.3% -2.5% 1.8% 1.1% 0.2% 2.7%
38 Average weekly online retail sales (£ million) £264.58 £340.76 £407.31 £480.89 £554.46 £637.60
UK exports
39 Volume of goods exported to the EU (annual percentage change) -3.6% -13.6% +7.9% +4.1% -3.7% -0.2% 23
Volume of goods exported to the rest of the world (annual
40 +7.3% -10.4% +15.5% +9.7% +7.2% +1.1% 23
percentage change)
UK imports
41 Volume of goods imported from the EU (annual percentage change) -3.3% -13.6% +11.2% +2.7% +3.8% +4.8%
Volume of goods imported from the rest of the world (annual
42 +0.9% -11.4% +14.5% -1.7% +1.4% -1.1%
percentage change)
UK inflation and currency
43 Retail Prices Index (annual inflation in December) 0.9% 2.4% 4.8% 4.8% 3.1% 2.7% 27
44 Consumer Prices Index (annual inflation in December) 3.1% 2.9% 3.7% 4.2% 2.7% 2.0%
45 £/$ exchange rate (average for December) $1.4854 $1.6242 $1.5588 $1.5614 $1.6148 $1.6384
46 £/e exchange rate (average for December) e1.1070 e1.1115 e1.1791 e1.1849 e1.2304 e1.1956
Costs
47 Wage settlements (annual change in basic pay) +2.7% +0.1% +2.1% +2.6% +3.0% +2.2% 27
48 Total hgv operating costs (annual change for 44t gvw artic) -1.4% +5.4% +7.0% +4.0% +0.7% +0.9% 30
Fuel
49 Bulk diesel (average pence per litre in December ex VAT) 82.35 89.99 103.30 112.05 110.61 109.62 25
50 Gas oil (average pence per litre in December ex VAT) 39.01 44.05 55.11 64.92 63.47 63.36 25
51 Rotterdam French Diesel (average per tonne in December) $479.78 $624.50 $797.65 $948.10 $955.63 $962.92
52 Brent blend (dated) (average per barrel in December) $40.26 $74.52 $91.78 $108.19 $109.56 $110.67
53 Jet fuel (Rotterdam kerosene) (average per tonne in December) $482.64 $663.11 $831.09 $987.35 $1,007.91 $1,009.06
54 Rotterdam gas oil (average per tonne in December) $457.73 $610.95 $761.87 $926.87 $932.58 $943.20
Note: The publication date for Road Freight Statistics 2011 and 2012 is provisionally September 2014 therefore efficiency indicators (shaded in purple) could not updated at time of going to press.
The Logistics Report 2014 © Freight Transport Association
13Chapter 1 On the road to recovery?
On the road to recovery?
     In the years since the global downturn, politicians and businesses have
     developed a necessary obsession with the bottom line.Their objectives:
     reducing the deficit and continuing to trade.Working towards these goals
     became the defining principle behind logistics’ dialogue with Government,
     and boardroom decisions were characterised by a precautionary approach.
     As UK economic indicators, and those of some of our major trading partners,
     become more positive it seems probable that political emphasis will shift and
     that expectations of positive action and commitment from the private sector
     will increase.Will logistics be ready to take the next step?

     Global economy                                                                           Survey underlines the improving outlook although it is
                                                                                              tempered by caution as to whether the recovery will live
     US tapering starts to affect emerging economies while                                    up to expectations. The US is showing the most positive
                                                                                              indicators, with lower household debt, increased consumer
     core Euro Zone economies begin to look stronger
                                                                                              spending and an expectation of greater fiscal stability over
                                                                                              the coming year. In Q4 2013, US economic output was 6
     As 2013 drew to a close there were signs of growth in
                                                                                              per cent higher than Q4 2007, the second best performing
     advanced economies;1 for the first time since 2010 they
                                                                                              economy of the G7; outstripped only by Canada with
     are expected to contribute about 40 per cent to growth
                                                                                              growth of about 7 per cent.3
     in global GDP in 2014.2 PwC’s 17th Annual Global CEO
                                                                                              China continued to lead emerging market growth and
                                                                                              meet its government target for annual growth but, as
     1     The International Monetary Fund (IMF) classifies 35 economies with a               2013 drew to a close, analysts considered that Brazil,
           high level of gross domestic product per capita and significant level of
           industrialisation as ‘advanced economies’
     2     The Only Way is Up? Predictions for 2014 from our economics and policy practice,
           January 2014, PwC                                                                  3   Global Economy Watch, February and April 2014, PwC

16       The Logistics Report 2014 © Freight Transport Association
On the road to recovery?
India, Indonesia and Turkey are likely to be affected by a The breadth of FTA’s membership and our level
cyclical economic slowdown, persistent current account of engagement with the companies we represent,
deficits and a squeeze on foreign currency; the US Federal especially through our Freight Councils and
Reserve’s move in 2013 to taper its quantitative easing quarterly surveys, give us a valuable insight
policy having wider impacts on the global economy.4 into trading conditions. We detect that business
confidence is higher than 12 months ago and this is
In Europe, economic growth turned more positive overall starting to manifest itself in investment confidence
but especially in Germany, which grew by 0.5 per cent in and improvements in company performance.
2013 and is expected to continue to grow faster than
Theo de Pencier
those on the periphery which are more reliant on external Chief Executive, FTA
demand to drive domestic growth. As 2013 ended,
concerns remained over levels of household debt, public
sector weakness and commitment to economic reform in
the outlying economies. The institutional reforms agreed
with the Euro Zone and European Central Bank, which
are necessary for stability, were not completed in the year
and are in fact not likely to be in place and effective during
UK economy
2014 either.5 Signs of broader based improvements in the
UK economy
The global outlook for 2014 overall therefore appears
more positive; figure 1.1 provides a snapshot of prospects
The UK economy experienced accelerated growth in 2013
for global growth at the start of 2014.
when compared with the previous year, indicating that the
widely anticipated recovery was finally taking root. October
4 The Only Way is Up? Predictions for 2014 from our economics and policy practice, to December GDP growth of 0.7 per cent built on the
January 2014, PwC
5 Ibid
previous quarter’s figure of 0.8 per cent and translates into
Figure 1.1 • Global economic outlook for 2014
Mixed but improving
Source: PwC main scenario projections May 2014, pwc.co.uk/projections
The Logistics Report 2014 © Freight Transport Association
17On the road to recovery?
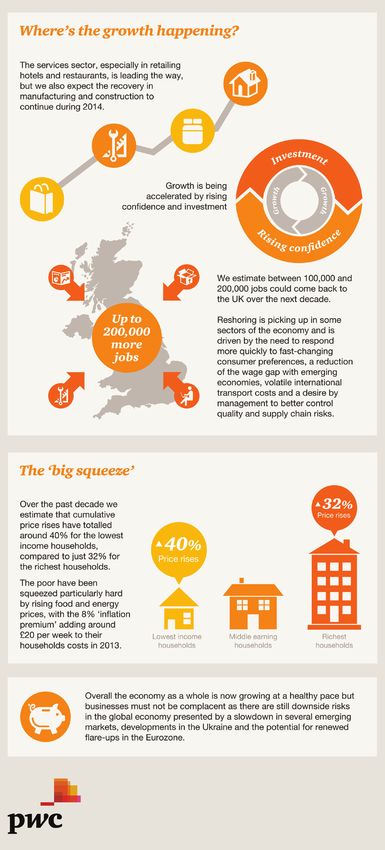
the fastest annual rate of growth since 2007. Unlike the Global logistics sentiment
more modest growth of 2012, which was primarily due to CEOs in transportation and logistics (T & L CEOs)
improvement in the services sector, there were signs of a participating in PwC’s 17th Annual Global CEO Survey
broader based improvement with both construction and remain less optimistic than their peers across industry.
manufacturing also seeing growth. However, their overall perception is that the global
Recent months have seen reports of higher house prices
and the highest level of vehicle registrations since 2007.
These reports indicate that public confidence in the Figure 1.2 • UK economy
economy may finally be turning a corner.
Opportunities and risks
However, this optimism is tempered by several factors
which are likely to arrest the recovery in the near-term.
Whilst unemployment levels have experienced faster than
anticipated falls, it is clear from mixed retail figures over
December that consumption is still somewhat subdued,
due mainly to modest wage growth and substantial
increases in domestic energy and food bills. Interestingly,
whilst some high end retailers reported improvements
in sales over the festive period, mid-range supermarkets
reported reductions in business while their cut-price
counterparts flourished; clearly many of us did Christmas
on a budget.
All of these factors indicate that whilst 2013 saw an
improvement for the average person on the street
compared with 2012, budgets are still squeezed by a
combination of low wage growth and higher monthly
bills.
Prospects for growth
The UK recovery therefore looks much stronger than at
the time of the 2013 Logistics Report but there remains
the risk of Euro Zone flare up, some emerging markets
look vulnerable, lending is still constrained and there is still
a risk of inflation. Consumers remain susceptible to rising
household and utility costs and constraints on discretionary
spending. However, as the wider economy recovers so too
should services such as transport, leading to increased
demand for movement of freight.
Figure 1.2 describes the upside and downside risks for the
economy in 2014.
Transport and logistics growth is traditionally
correlated with overall GDP growth hence an
improving economic climate is welcome news for
the sector, as shown by the year-on-year growth in
demand for movement of goods.
Source: PwC UK Economic Outlook March 2014
Coolin Desai
Transport & Logistics Leader, PwC UK
18 The Logistics Report 2014 © Freight Transport AssociationOn the road to recovery?
Insights • Economy
The UK economy is picking up in 2014 and the recovery is set to continue into 2015, with this year
and next set to see the strongest growth in the recovery so far. However, growth is still not likely to
return to the rate we saw before the crisis when it averaged over 3 per cent. Our forecasts suggest
growth of around 2.8 per cent in 2014 and 2.5 per cent in 2015.The pick-up in growth appears
broad-based. A wide range of service industries and manufacturing industry are all expected to
contribute to growth. At the same time, the improvement in the housing market and a recovery
in investment are likely to benefit the construction industry. The broad-based improvement in the
economy should benefit transport industries – road, rail, air and maritime. If there is a risk to the
transport industries in this environment, it is that costs will start to rise.
Andrew Sentance CBE
Senior Economic Adviser, The general improvement in the global economy could see a further surge in oil prices and fuel
PwC UK costs.There could also be upward pressure on wages arising from a tightening labour market as the
improvement in growth continues to bring down unemployment. It is also likely that interest rates
will start to rise either later this year or next, which will create upward pressure on financing costs.
economy is getting back on track: 45 per cent of T & L
CEOs believe that the economy will improve (compared
to 17 per cent in 2013). However, like their peers they are
concerned about continued slow growth in developed
economies and the increasing tax burden on industry.
Figure 1.3 describes the main issues of concern to CEOs
across the globe.
Significantly, they are also concerned about energy costs
and infrastructure, with a substantial 76 per cent citing
high and volatile energy prices (including crude oil) in
2014 compared to 61 per cent in 2013. Fifty-six per cent
are worried that the basic infrastructure is adequate.
Global logistics CEOs are also focused on the need to
change their talent strategies to cope with future needs;
but only 19 per cent are already doing this and only 30
per cent believe that their human resource departments
are well-prepared.
CEOs are also concerned about over-regulation; although
88 per cent of T & L CEOs agree over the importance
of reducing their environmental impact; carbon emissions
regulation is one area they perceive as a burden from
governments. Many are also concerned about road tolls
and restrictions on use of toll-free roads.
T & L CEOs were asked where they thought that growth
was going to come from; they were asked to exclude
the BRIC countries and South Africa and identify what
they thought were likely to be high growth markets over
the next 3 to 5 years. The UK featured in the top 4 (see
figure 1.4).
The Logistics Report 2014 © Freight Transport Association
19On the road to recovery?
Figure 1.3 • More than half of T&L CEOs are still concerned about a wide range of issues
How concerned are you, if at all, about each of the following threats to your growth prospects? Top choices listed
Continued slow or negative growth in
developed economies
High or volatile energy costs
Over-regulation
Increasing tax burden
Government response to fiscal
deficit and debt burden
Slowdown in high-growth markets
Availability of key skills
Shift in consumer spending and behaviours
Lack of stability in capital markets
Exchange rate volatility
High and volatile raw materials prices
Inadequate basic infrastructure
Protectionist tendencies of
national governments
Bribery and corruption
Base: All respondents (Total sample, 1, 344; T&L, 101)
Note: Respondents who stated ‘extremely’ or ‘somewhat’ concerned
Source: PwC 17th Annual Global CEO Survey 2014
Mergers and acquisitions activity in the US and Euro Zone
had not yet recovered to pre-economic downturn levels,
which affected both the volume and value of deals in
2013.
In 2014, PwC expects US and Euro Zone announcements
to remain well-below pre-economic crisis levels; the focus
of deal-making activity will be emerging economies, such
as China. The overall trend is expected to be fewer and
smaller deals. It is possible that shipping deals may increase,
although PwC believes that in the container sector, alliances
and vessel sharing arrangements are more likely than
mergers. Their report, Intersections notes that: “Trucking
and logistics seem ripe for consolidation, as this more
fragmented part of the sector tends to underperform
other modes. In addition, the relatively low regulatory
barriers to new mergers should let competitors build scale
more easily.”6
6 Intersections: Fourth Quarter 2013 transportation and logistics industry mergers
and aquisitions analysis, PwC, 2014
20 The Logistics Report 2014 © Freight Transport AssociationOn the road to recovery?
UK logistics market showed the first year-on-year improvement since 2010
due to a more established, broad-based growth in the
Demand for the movement of goods shows the industrial economy and improvements in economic
conditions globally.
first improvement since 2010
The number of goods vehicle operator licences continued
In common with the wider market, economic activity
to fall by nearly 4 per cent in 2012 (see LDI 2, page 12
indicators for the logistics industry improved in 2013,
and figure 1.5), reflecting the continued sluggishness in the
marking a turnaround from 2012. Demand for the
economy during that time.
movement of goods (both domestic and international)
The number of hgvs7 in use also fell in 2012 compared
to 2011 (see LDI 3, page 12 and figure 1.6) in line with
Figure 1.4 • E xcluding BRICs and South Africa, which 3
markets do you consider most important
7 Heavy goods vehicles (hgvs), goods vehicles with a gross vehicle weight in
for your growth prospects over the next 3 excess of 3.5 tonnes
to 5 years?
UK in top 4 for growth Figure 1.6 • Number of heavy goods vehicles in use
2000–2012
US
Hgv numbers fall in line with operator licences
Germany
460,000
Indonesia 440,000
UK 420,000
400,000
Turkey
380,000
Japan
360,000
Mexico 340,000
320,000
France
Transportation
and Logistics 300,000
2000
2001
2002
2003
2004
2005
2006
2007
2008
2009
2010
2011
2012
Vietnam
Overall sample
Source: Table VEH103 Transport Statistics Great Britain 2013
Source: PwC 17th Annual Global CEO Survey 2014 Licensed Vehicles by tax class Great Britain (goods vehicles only)
Figure 1.5 • Number of goods vehicle operator licences in Great Britain 2001–2012
Number of transport businesses continued to decrease, tracking the economic cycle
GOODS VEHICLELE
E GOODS VEHICLELE
E GOODS VEHICLELE
E GOODS VEHICLELE
E GOODS VEHICLELE
E GOODS VEHICLELE
E
IDENTITY DISC IDENTITY DISC IDENTITY DISC IDENTITY DISC IDENTITY DISC GOODS VEHICLELE
E
IDENTITY DISC IDENTITY DISC
104,390 102,946 99,889 98,316 91,200 84,072 80,894
2001 2003 2005 2007 2009 2011 2012
Note: figures are for tax years, eg 2012/13, 80,894
Source: Traffic Commissioners’ Annual Reports
The Logistics Report 2014 © Freight Transport Association
21On the road to recovery?
the reduction in operator licences. The number of trailers Figure 1.7 • UK domestic road freight activity sentiment
tested fell by 2 per cent (see LDI 5, page 12) although hgvs
laid up (SORN) fell by 2 per cent (see LDI 10, page 12) Expectation that there will be an increase in domestic
and the number of registered vans increased by just under activity in 2014
1 per cent (see LDI 4, page 12).
70
Business volumes 60
Expectation
The UK freight transport sector saw a turnaround in 50 for 2014
Percentage balance of respondents (%)
business volumes during 2013 with activity exceeding
40
expectations as measured at the end of 2012 (figure 1.7).
This is in line with the improved economic conditions 30
reported for 2013, particularly in the manufacturing and 20
building sectors.
10 Expectation
In the fourth quarter of 2013, FTA conducted its annual for 2013
0
Logistics Industry Survey. Respondents reported that
activity within the domestic road freight sector had -10
exceeded expectations for 2013. There was also strong -20
optimism for 2014, with 58 per cent of the members
surveyed expecting increased activity during this period. -30
-40
Across the top 5 sectors there was an increase in the
2005
2006
2007
2008
2009
2010
2011
2012
2013
2014
business expectation for 2014 compared to 2013 (figure
1.8). Most notable is the turnaround in expectations for
Sources: FTA Logistics Industry Surveys 2012/2013–2013/2014
the construction sector, fuelled by the upsurge in the FTA Quarterly Transport Activity Survey
housing market and building activity during 2013. However,
there is a cautionary note about the sustainability of the
construction sector recovery, with mixed opinions regarding
future house price bubbles and the change announced in Figure 1.8 • usiness expectation for top 5 sectors for
B
November by the Government to its ‘Funding for Lending’ 2014 compared to 2013
scheme which saw an end to support for household
Activity growth in top 5 sectors is positive
mortgages and other loans.
A similarly more positive picture is evident in the
70
international road freight market, with sentiment swinging
Percentage balance of respondents (%)
from negative to positive for the first time since 2010 (figure 60
1.9). An increase in manufacturing activity and continuing 50
improvement in the global economic picture have led to
the expected improvement in 2013. But it should be noted 40
that the actual improvement in 2013 fell a little short of 30
expectations.This is in contrast to the domestic UK picture
20
where the reality exceeded expectation last year, and is
perhaps an indication of the stronger recovery witnessed 10
domestically compared with the UK’s major export
0
destinations.
Distribution,
Recycling,
Manufacturing
Construction
Public
authority
haulage
waste
The outlook for international road freight in 2014 appears
strong with the measured expectation continuing along the
trajectory of actual activity for 2013. As the global recovery
is expected to gather strength beyond these shores, so
Note: Top sectors are defined by the number of respondents
there is cause to be optimistic that the UK international
road freight sector will benefit accordingly. Accompanied
hgv activity to mainland Europe grew by 12.5 per cent
Source: FTA Logistics Industry Survey 2013/2014
in 2013 (see LDI 36, page 13). Unaccompanied trailer
22 The Logistics Report 2014 © Freight Transport AssociationOn the road to recovery?
Figure 1.9 • K international road freight activity
U Figure 1.10 • Economic expectations for 2014
sentiment
Improved optimism for 2014
Expectation that the international market will recover in 2014
Expectation
40 for 2014
35
30
Expectation
Percentage balance of respondents (%)
25 for 2013
20
15
10
5
0
-5
-10
-15
-20
About the same as 2013
-25
2005
2006
2007
2008
2009
2010
2011
2012
2013
2014
Better than 2013
Worse than 2013
Sources: FTA Logistics Industry Surveys 2011/2012–2013/2014
FTA Quarterly Transport Activity Survey Source: FTA Logistics Industry Survey 2013/2014
movements increased by 5 per cent over the same period reported the strongest trade lane growth in North and
(see LDI 35, page 13). South America (figure 1.11). South America in particular
swung from negative growth for the previous year to
Overall, respondents expressed slightly improved optimism strongly positive for 2013. Strength in the Far and Middle
for economic growth in 2014 compared with the previous East lanes continued, reflecting the ongoing resilience to
year (figure 1.10), with just over one half expecting the the global recession of economies in these regions. Overall
coming year to be better than 2013.This is an improvement there were improvements in all lanes with the exception of
on the expectations a year ago, where just under one half the Mediterranean, where growth continues to be stalled
of the respondents expected the outlook to be better.This by the after effects of the Euro Zone crisis.
is also reflected elsewhere, for example in the latest CBI
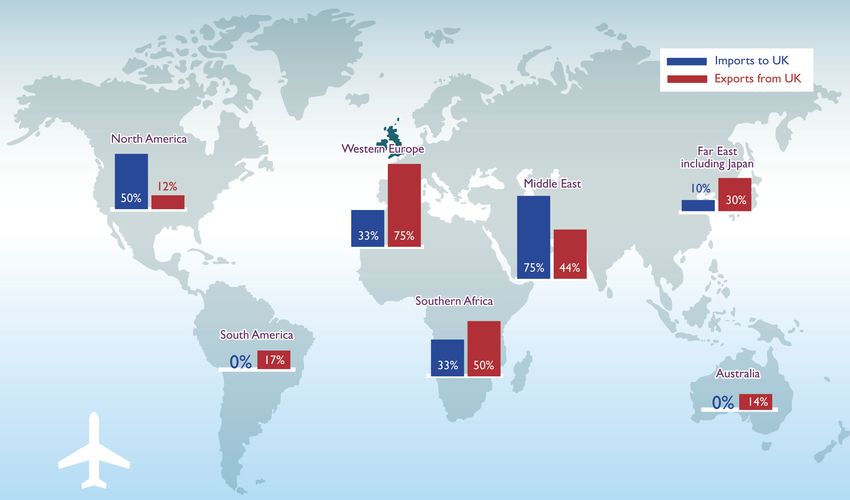
survey8 for 2013 which expects continued modest growth Air freight volumes broadly improved during 2013
throughout 2014, gathering pace in 2015. It also predicts (figure 1.12) with the exception of South America,
that exports will grow by 3.6 per cent and imports by 2.2 which experienced modest falls, and Australia which saw
per cent during the coming year. Indeed, export volumes a more significant drop. This may be in part due to the
outside the EU also grew by 1.1 per cent (see LDI 40, page continuing strength of the Australian Dollar reducing the
13), whilst exports within the EU shrank by a marginal 0.2 competiveness of the country’s exporters.
per cent last year compared with a 3.7 per cent contraction
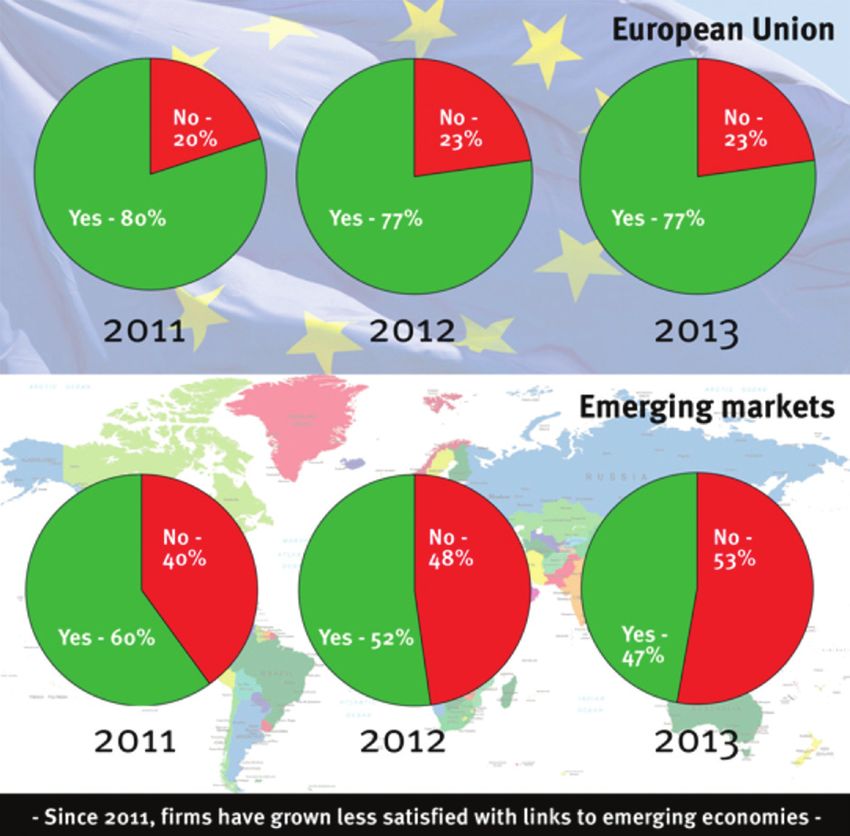
in 2012 (see LDI 39, page 13). Levels of UK competitiveness with the EU and globally
were also measured in the FTA Logistics Industry Survey
Capacity has shown significant improvement in both air 2013/2014. Respondents reported that competiveness
and sea freight modes. Air freight continues the trend of had recovered both within the EU and globally when
underperformance compared to sea, with higher fuel prices compared to 2012 (figure 1.13). This reflects the
winning out over customer sensitivity to speed of delivery. stronger improvement in the UK economy compared to
its trading partners helped perhaps by stagnation in UK
Respondents to the FTA Logistics Industry Survey wages; a trend which is forecast to continue for at least
2013/2014 who are involved in international shipping the coming year.9
8 CBI Economic Forecast, November 2013 9 ECA International press release, 6 November 2013
The Logistics Report 2014 © Freight Transport Association
23On the road to recovery?
Figure 1.11 • Deep sea shipping market sentiment in 2013
Strong growth in nearly all shipping lanes
Source: FTA Logistics Industry Survey 2013/2014
Figure 1.12 • Air freight market sentiment in 2013
Air freight volumes generally robust in 2013
Source: FTA Logistics Industry Survey 2013/2014
24 The Logistics Report 2014 © Freight Transport AssociationOn the road to recovery?
Figure 1.13 • L evel of competitiveness with EU and Figure 1.14 • ail freight moved by market segment
R
globally 2002–03 to 2012–13
Improvement in perceived competitiveness of UK Intermodal rail freight sees growth continue while key
compared to other countries conventional, bulk markets begin modest recovery
1.7 16
1.6 14
Billion net tonne kilometres
12
1.5
Average rating
10
1.4
8
1.3 6
1.2 4
Level of competitiveness globally
2
1.1 Level of competitiveness with EU
0
1.0
2002–03
2003–04
2004–05
2005–06
2006–07
2007–08
2008–09
2009–10
2010–11
2011–12
2012–13
2009 2010 2011 2012 2013
0 = Not at all competitive 4 = Extremely competitive
Bulk or semibulk, ie conventional services Intermodal services
Source: FTA Logistics Industry Survey 2013/2014 Source: Office for Rail Regulation (ORR)
For 2013 the top country for UK exports was the United The continued strength of freight flows to international
States and the top trading partner for imports was markets outside the EU is once again evidenced by
Germany. In terms of imports, China moved from eighth modest improvement in intermodal services which is
place in 2003 to third place 10 years later, with Norway strongly linked to deep sea container shipping outside of
appearing for the first time and Japan no longer in the top the EU. These services showed a 1.92 per cent increase
10. In terms of exports China was not in the top 10 in 2003 compared to 2012. Bulk services showed flat growth for
but now claims seventh place, with UAE also appearing for the year but if the upturn in construction activity continues,
the first time (tables 1.1 and 1.2 on page 26). then growth in these services should be expected over the
coming year. Demand for intermodal container services fell
by 2.5 per cent in 2013 compared to 2012, reflecting the
Euro Zone problems (figure1.14).
Fuel prices
Fuel prices at the end of 2013 were broadly unchanged
from a year earlier (table 1.3 on page 27) due to little
change in the price of crude oil or the Sterling exchange
rate year-on-year. The average price of a barrel of crude
oil in December 2013 was around $108 which is only
marginally lower than the $111 seen at the end of 2012.
At the same time GBP/USD averaged around $1.64 in
December 2013, which compares to $1.61 a year earlier.
At an average of 109.6 pence per litre (ppl) for the month,
bulk diesel prices in December 2013 were 0.9 per cent
lower than a year previously (see LDI 49, page 13), and
bulk gas oil prices were 0.1 per cent lower (see LDI 50,
page 13).
The outlook for 2014 is somewhat uncertain with many
observers citing an increase in production as a reason
The Logistics Report 2014 © Freight Transport Association
25On the road to recovery?
Table 1.1 • UK top 10 trading partners – imports
Rank 2003 2013 Movement
Germany Germany
1 £33,142 million £55,320 million
USA Netherlands
2 £23,691 million £33,957 million
France China
3 £19,783 million £31,576 million
Netherlands USA
4 £15,672 million £30,983 million
Belgium France
5 £12,189 million £24,759 million
Italy Belgium
6 £11,720 million £19,926 million
Irish Republic Norway
7 £10,031 million £16,774 million
NEW
ENTRY
China Italy
8 £8,554 million £15,135 million
Spain Spain
9 £8,445 million £11,936 million
Japan Irish Republic
10 £8,247 million £11,907 million
Source: HM Revenue and Customs,
Overseas Trade Statistics (December 2013)
Table 1.2 • UK top 10 trading partners – exports
Rank 2003 2013 Movement
USA USA
1 £29,074 million £39,740 million
Germany Germany
2 £20,392 million £30,744 million
France Netherlands
3 £18,508 million £23,896 million
Netherlands France
4 £13,279 million £22,486 million
Irish Republic Irish Republic
5 £12,786 million £18,113 million
Belgium Belgium
6 £10,783 million £13,622 million
Spain China
7 £8,767 million £11,584 million
NEW
ENTRY
Italy Spain
8 £8,477 million £8,441 million
Sweden Italy
9 £3,802 million £8,385 million
Japan UAE
10 £3,738 million £5,834 million
NEW
ENTRY
Source: HM Revenue and Customs,
Overseas Trade Statistics (December 2013)
26 The Logistics Report 2014 © Freight Transport AssociationOn the road to recovery?
Table 1.3 • Change in principal transport fuel costs in 2013
All fuel product prices broadly unchanged
Product Application December 2012 price December 2013 price % change
Diesel Hgvs, vans 110.61ppl 109.62ppl -0.90
Gas oil Rail freight 63.47ppl 63.36ppl -0.17
Marine bunker fuel* Deep sea shipping 1,439 (index) 1,415 (index) -1.63
Jet kerosene Air freight $1,007.91/tonne $1,009.06/tonne 0.11
* Bunkerworld Index
to expect the price of crude oil to fall during 2014.10 In the case of road freight, fuel now represents around
However, the International Energy Agency has recently 40 per cent of total hgv operating costs for a 44 tonne
lifted its forecast for the crude oil price, citing increased articulated truck, up from 34 per cent in 2009. According
demand in the US.11 to FTA’s Manager’s Guide to Distribution Costs, in 2013 the
fuel costs of operating a fleet of 10 x 44 tonne articulated
For bulk domestic diesel, the expectation is for the price trucks in the UK was just over £520,000.
to remain broadly unchanged throughout 2014 (figure
1.15). This continues the trend of actual prices seen for
Labour costs
2013 which were flat across most of the year, driven by the
abandonment of plans to increase fuel duty and a continuing In 2013, basic pay for transport staff rose by 2.2 per cent
absence of upward pressure on crude oil prices. (see LDI 47, page 13), which is half of 1 per cent below the
inflation rate of 2.7 per cent for the same period (see LDI
43, page 13). This is well ahead of average earnings growth
of 0.8 per cent (excluding bonuses).
10 www.fool.com/investing/general/2013/12/20/oil-prices-2014-what-to-expect.aspx In the Logistics Industry Survey 2012/2013 respondents
11 www.ft.com/cms/s/0/c4983fb0-6248-11e3-bba5-00144feabdc0. indicated that they expected to increase salaries in 2013,
html#axzz2pzSB3Y7p
Figure 1.15 • Bulk diesel prices and price expectations for 2014
Diesel prices not expected to change
120
115
110
Pence per litre (ppl) ex VAT
105
100
95
90
85
80
75
Jan 09
Jul 09
Jan 10
Jul 10
Jan 11
Jul 11
Jan 12
Jul 12
Jan 13
Jul 13
Jan 14
Apr 14
Jul 14
Oct 14
Jan 15
Apr 09
Oct 09
Apr 10
Oct 10
Apr 11
Oct 11
Apr 12
Oct 12
Apr 13
Oct 13
Source: EnergyQuote JHA
The Logistics Report 2014 © Freight Transport Association
27On the road to recovery?
having decreased salaries for the previous two years. The
Figure 1.16 • ercentage of respondents changing staff
P
trend of increased salaries is expected to continue in 2014
pay
according to the Logistics Industry Survey 2013/2014
(figure 1.16), with a moderate acceleration of both basic Majority of respondents increased pay in 2013
and gross pay increases year-on-year.
80
The increase in pay levels is also expected to be
accompanied by an increase in the number of transport
70
related staff (figure 1.17). At the same time, the use of
temporary staff and the standing down of staff are both 60
expected to decrease, indicating that business is anticipated
Percentage of respondents (%)
to pick up next year. This is also reflected in the number 50
of hgv drivers claiming unemployment related benefits
(see LDI 9, page 12) which dropped steeply from 5,050 40
to 2,875.
30
In the FTA Logistics Industry Survey 2012/2013 respondents
20
reported that they expected to decrease their use of third
party services. The actual levels showed an increase for
10
2013 according to the Logistics Industry Survey 2013/2014.
This may be because the recovery was slow to manifest 0
itself so businesses continued to ‘buy in’ rather than invest Basic 2013 Basic 2014 Gross 2013 Gross 2014
themselves. However, respondents expect that the use
Freeze Reduce by 1%–5%
of contract hire and contract distribution will decrease in
Increase by 1%–5% Increase by 6%–10%
2014 (figure 1.18).
Note: gross pay is the total of basic pay, overtime,
Hgv operating costs experienced a marginal increase productivity payments and other pay
of just under 1 per cent, according to FTA’s Manager’s
Guide to Distribution Costs. This compares favourably with
Source: FTA Logistics Industry Survey 2013/2014
the moderate 2.7 per cent RPI increase and reflects the
28 The Logistics Report 2014 © Freight Transport AssociationOn the road to recovery?
Figure 1.17 • HR priorities for transport related staff 2013–2014
Companies expect to reduce redundancies and employ more staff in 2014
Number of redundancies 2013
2014
Number of staff
Use of agency drivers
Use of temporary staff
Standing staff down
Amount of overtime
Amount of training
-30 -20 -10 0 10 20 30 40 50
Source: FTA Logistics Industry Survey 2013/2014
Figure 1.18 • Demand for third party services
Increased demand for hauliers but little change to contract hire and distribution
40 Contract distribution
Contract hire
Percentage balance of respondents (%)
30
Hauliers
20
10
0
-10
-20
-30
-40
2005 2006 2007 2008 2009 2010 2011 2012 2013 2014
Sources: FTA Logistics Industry Surveys 2010/2011–2013/2014
FTA Quarterly Transport Activity Survey
The Logistics Report 2014 © Freight Transport Association
29On the road to recovery?
As a result of major investments in Euro V chassis the end of the year at a far greater rate than previously
at the end of 2013, the market for Euro VI will be predicted.
depressed for the early part of 2014. This distortion
should normalise in the second half of this year. FTA’s Manager’s Guide to Distribution Costs reported that
during 2013 operating costs rose by 0.9 per cent (see LDI
Ray Ashworth
Managing Director, DAF Trucks Ltd 48, page 13) which is a marginal increase on the 0.7 per
cent recorded for the previous year. At the same time,
typical haulage rates increased by 1.5 per cent (figure 1.19),
reflecting the moderate upturn in the economy.
relatively stable price of fuel and lack of fuel duty increases The erosion of operating margins in recent years has finally
throughout the year. turned a corner which is welcome news, with margins
recovering to 3 per cent from around 1 per cent a year
Changes in transport costs in 2013 saw moderate earlier (see LDI 1, page 13), although this is still lower than
increases when compared to the previous year, according the 4 per cent reported for both 2010 and 2011.
to the FTA Logistics Industry Survey 2013/2014. The fuel
duty freeze helped to reduce fuel price volatility, in tandem The more positive UK economic picture is reflected in the
with moderate fluctuations in the price of a barrel of oil levels of commercial vehicle registration, which showed
throughout most of 2013. Other costs such as repair significant increases on the previous year for both hgv and
and maintenance and insurance also saw only modest van categories (figure 1.21). However, it should be noted
increases, perhaps due to subdued wage increases across that the registration levels still fall slightly short of pre-
all industrial sectors (see figure 1.20). recession levels.
Fleet investment intentions also saw substantial
Investment intentions
improvement according to the FTA Logistics Industry
For the last few years the recession has had a profound Survey 2013/2014 (figure 1.22). The actual balance of
impact on investment intentions with stagnant business responses for hgv, van and trailer fleets all showed that, for
volumes and ever increasing running costs feeding into 2013, respondents invested more than they had expected
a reduction in investment plans. 2013 may have marked to. A possible explanation is that the Euro VI exhaust
a turning point with economic output returning to more emissions standard for new registrations came into
broad-based growth and unemployment falling towards effect on 1 January 2014 with an associated prohibitive
Figure 1.19 • Trends in operating costs and haulage rates 2005–2013
Long-term hgv operating cost rises continue to outstrip increases in haulage rates
144 RPI
140 Haulage trends
Hgv operating costs
136
132
Index January 2005 = 100
128
124
120
116
112
108
104
100
2005 2006 2007 2008 2009 2010 2011 2012 2013
Source: FTA’s Manager’s Guide to Distribution Costs
30 The Logistics Report 2014 © Freight Transport AssociationOn the road to recovery?
on-cost to operators who had probably stockpiled Euro than it has been for some time, there is still uncertainty
V vehicles as a consequence. With the exception of van around the mid to long-term.
fleets, expected levels of investment for 2014 are lower,
indicating that there is generally sufficient capacity available
for the anticipated business volume for the coming year.
Respondents to FTA Logistics Industry Survey 2013/2014
indicated that across the board, large scale investment
plans for 2014 are downscaled from 2013 (figure 1.23).
This indicates that while the short-term outlook is better
Figure 1.20 • hanges in transport costs in 2013
C
compared to 2012
Little change in fuel price due to fuel duty freeze
2
1.5
–2 = decreased a lot; 2 = increased a lot
1
0.5
0
-0.5
-1
-1.5
-2
Wage Fuel price Insurance Vehicle Repair and
rates volatility costs asset maintenance
costs coss
Source: FTA Logistics Industry Survey 2013/2014
Figure 1.21 • Commercial vehicle registrations 2000–2013
Hgv registrations grew in 2013 but remain below pre-recession levels
60,000 360,000
340,000
55,000
320,000
Hgv registrations
Van registrations
50,000 300,000
280,000
45,000
260,000
40,000 Van registrations 240,000
220,000
35,000 Hgv registrations
200,000
30,000 180,000
2000 2001 2002 2003 2004 2005 2006 2007 2008 2009 2010 2011 2012 2013
Source: SMMT
The Logistics Report 2014 © Freight Transport Association
31On the road to recovery?
had promised to “work towards the introduction of a
FIGURE 1.22 • Fleet investment intentions
new system of hgv road user charging to ensure a fairer
Operators expect to purchase more vans in 2014 than arrangement for UK hauliers.” The HGV Road User Levy
in 2013 will allow foreign operators to be charged for use of UK
roads with domestic operators paying the levy and, in
30 the majority of cases, being compensated through vehicle
excise duty renewals from April 2014. In the course of
2013, Government also announced that it had brought
25
forward the point at which foreign operators would be
Percentage balance of respondents (%)
included within the scheme to align with the date for
UK operators. Draft legislative clauses were published in
20
December, including vital detail on the vehicle excise duty
and HGV Road User Levy rates that will apply.
15
Fuel duty remained the top issue in the last year, as it
has throughout this Parliament. The FairFuelUK (FFUK)
10 campaign continued to make the case for a change in the
approach to taxation of fuel. At the Conservative Party
Conference in September the Chancellor indicated his hope
5
of freezing fuel duty for the remainder of the Parliament.
In his Autumn Statement, delivered in December, he
confirmed that the fuel duty increase that was due to take
0
Hgv fleet Lcv fleet Trailer fleet effect on 1 September 2014, and which had already been
deferred, was cancelled. This was expected to be worth
2013 (expected) 2013 (actual) 2014 (expected)
1.61 pence per litre (ppl), saving industry around £186
Source: FTA Logistics Industry Survey 2013/2014
million. Figure 1.24 shows the significant savings that have
been secured through campaigning in this area.
The politics of logistics Figure 1.23 • L arge-scale business investment plans in
2013 and 2014
Fuel and infrastructure dominate a packed Economic stagnation reflected in fewer businesses
logistics agenda for politicians committing to longer term investment
It is generally accepted that the performance of the economy, 30 2013 2014
and the ability of the main political parties to convince
voters that it is safest in their hands, will be a decisive factor 25
Percentage of respondents (%)
in next year’s General Election. As the parties develop their
manifestos in the run-up to the Election it seems likely that 20
the ambivalent attitude of politicians to logistics will manifest
itself with renewed vigour. Transport and logistics is a vital 15
component of economic health. Issues such as fuel duty, the
future of aviation and infrastructure provision are likely to 10
be hot topics. But while logistics performs an essential role,
elections are also a time when politicians may be tempted 5
to reach for populist messages, in spite of the implications
should they be elected (or re-elected). 0
distribution premises
distribution premises
Relocated business
business
Purchased additional
Rented additional
premises
Acquired another
The 2010 Coalition agreement12 set out a programme for
each area of Government policy. 2013 saw a major element
of this approaching reality; early in the year enactment of
the HGV Road User Levy Act took place. The Coalition
Source: FTA Logistics Industry Survey 2013/2014
12 The Coalition: our programme for Government, HM Government, May 2010
32 The Logistics Report 2014 © Freight Transport AssociationOn the road to recovery?
Figure 1.24 • Fuel duty 2000–2014
Sustained campaigning has kept fuel duty below successive governments’ planned increases
73.00
Actual duty rate (ppl) 14ppl
71.00
69.00 Labour Government planned rises
67.00 Coalition Government planned rises 9ppl
65.00
Diesel duty (pence per litre)
63.00
61.00
59.00
57.00
55.00
53.00
51.00
49.00
47.00
45.00
01/09/2000
01/03/2001
01/09/2001
01/03/2002
01/09/2002
01/03/2003
01/09/2003
01/03/2005
01/09/2005
01/03/2006
01/09/2006
01/03/2007
01/09/2007
01/03/2008
01/09/2008
01/03/2009
01/09/2009
01/03/2010
01/09/2010
01/03/2012
01/09/2012
01/03/2013
01/09/2013
01/03/2011
01/09/2011
01/03/2004
01/09/2004
01/03/2014
Month
Source: FTA, Office for National Statistics
However, there is still no long-term strategy for fuel duty help meet HS2 expenditure. Rail freight customers also
that will enable companies to feel secure in planning in the expressed dissatisfaction at the way in which the process of
event of sudden spikes in the price of oil or the competitive establishing a new track access charging regime for freight
disadvantage felt in comparison to Europe. Neither is impacted business confidence in the long-term future of
there any sense of security that in the future the current the mode, and sought reassurances from the Office of Rail
policy of not pushing ahead with fuel duty increases will Regulation that future negotiations would better reflect
continue. But there is a perception that as politicians seek wider Government policy on modal shift.
measures that will be popular with the general public, a
fuel duty cut could look more attractive. FFUK has already The debate over paying for infrastructure improvements
commissioned two independent studies13 that show the entered a new phase, with the Government consulting on
economic benefits that could be produced by making such improvements to the A14 which would be funded by a toll.
a cut and continued to press for this over the course of The response of consultees underlined the political risks of
the year. this approach and the Rt Hon Danny Alexander MP, Chief
Secretary to the Treasury, announced on 4 December
In 2013, the future of HS2 seemed a little less clear, with that tolls would not be put in place when the improved
Labour Party support appearing to waver. At the party route was opened. It remains to be established how
conferences in September, supporters of the project
underlined the importance of industry support to its success.
However, it is clear that the support of logistics is contingent The Government believes that a modern transport
upon guarantees being received in terms of freight access infrastructure is essential for a dynamic and
to released capacity elsewhere on the rail network and entrepreneurial economy, as well as to improve
upon vital pots of money for road and rail maintenance well-being and quality of life. We need to make the
and the Strategic Freight Network not being diverted to transport sector greener and more sustainable, with
tougher emissions standards and support for new
transport technologies.
13 The impact on the UK economy of a reduction in fuel duty; Centre for
Economics and Business Research, March 2012 and The Impact of Fuel Duty on The Coalition: our programme for Government
the Macro-Economy NIESR, September 2012 HM Government, May 2010
The Logistics Report 2014 © Freight Transport Association
33You can also read