PURCHASING PRACTICES OF GERMAN DISCOUNT RETAILERS AND LABOUR CONDITIONS ON SOUTH AFRICAN WINE AND GRAPE FARMS
←
→
Page content transcription
If your browser does not render page correctly, please read the page content below
PURCHASING PRACTICES OF GERMAN DISCOUNT
 RETAILERS AND LABOUR CONDITIONS ON SOUTH
       AFRICAN WINE AND GRAPE FARMS

                          Sustainability Institute South Africa

                                     09 June 2017

This report was compiled from the cumulative findings of fieldwork conducted by Glenise
Levendal, the 2017 WFP Labour Conditions Survey and an analysis of the grape and wine
               industries by Stefanie Swanepoel and Tawanda Maradure.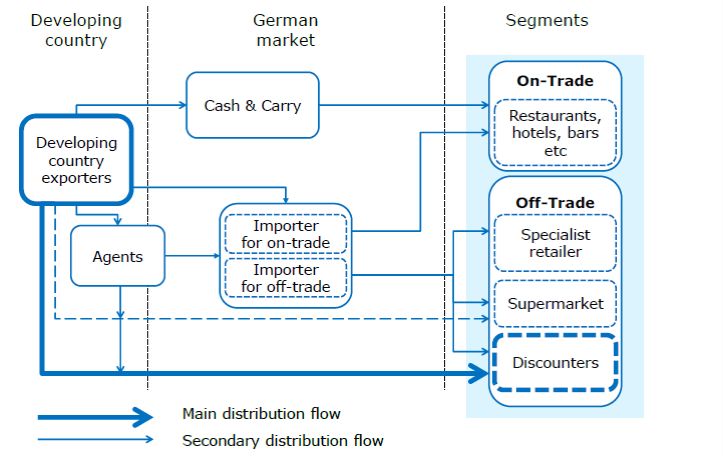
Contents
Abbreviations and acronyms ..................................................................................................... 4
List of tables ............................................................................................................................... 4
List of figures .............................................................................................................................. 4
1.      Introduction ........................................................................................................................ 1
     1.1      Background................................................................................................................. 1
     1.2      Methodology .............................................................................................................. 4
     1.3      Report structure ......................................................................................................... 5
2.      The global & local grape and wine markets ....................................................................... 6
     2.1      The table grape market .............................................................................................. 6
        2.1.1        An overview of the South African table grape market ....................................... 7
        2.1.2. South Africa’s export relationship with Germany ................................................... 8
        2.1.3. The table grape supply value chain ......................................................................... 9
        2.1.4. External factors influencing the market .................................................................. 9
        2.1.5. Internal factors influencing the market................................................................. 10
        2.1.6. Employment conditions in the table grape sector ................................................ 10
     2.2 The wine grape market ................................................................................................. 12
        2.2.1        An overview of the South African wine grape market ..................................... 13
        2.2.2        External factors influencing the market ........................................................... 15
        2.2.3        Internal factors influencing the market ............................................................ 16
        2.2.4        The economic outlook for the wine sector....................................................... 17
3.      Labour conditions on South Africa’s grape and wine farms ............................................ 20
     3.1      Farm worker revolt 2012/13 .................................................................................... 21
     3.2      Revision of the sectoral determination.................................................................... 22
     3.3      Non-wage related violations .................................................................................... 23
        3.3.1        A note on the minimum wage .......................................................................... 27
        3.3.2        A note on categorisation of workers ................................................................ 30
     3.4      The struggle continues ............................................................................................. 30
     3.5      A brighter future for farm workers? ........................................................................ 32
     3.6      Trends affecting labour in the wine sector .............................................................. 33
        3.6.1        Declining employment opportunities ............................................................... 33
        3.6.2        Casualisation and externalisation of labour ..................................................... 33
        3.6.3        Mechanisation .................................................................................................. 38
4.      An analysis of accreditation schemes............................................................................... 40
     4.1      The Wine Industry Ethical Initiative ......................................................................... 40
4.2 Fairtrade in South Africa .......................................................................................... 41
4.3 The Sustainability Seal.............................................................................................. 42
4.4 South African Ethical Trade Initiative ....................................................................... 43
4.6 The Business Social Compliance Initiative ............................................................... 44
5. South Africa’s export market: a focus on Germany............................................................. 45
5.1 The export table grape market ................................................................................ 45
5.2 The export wine market ........................................................................................... 45
5.3 The German wine market ........................................................................................ 46
5.3.1 German wine consumers .................................................................................. 46
5.3.2 The German wine import market ..................................................................... 47
5.4 Overview of leading German discounters and supermarkets ................................. 48
5.4.1. The EDEKA Group .................................................................................................. 48
5.4.2. ALDI Group............................................................................................................. 48
5.4.3. The Lidl Group (part of the Schwarz Group) ......................................................... 48
5.5 Wine exports from South Africa to Germany .......................................................... 49
5.5.1 Trading conditions in the German market........................................................ 49
5.5.2 Key trends ......................................................................................................... 50
A bulk wine market .......................................................................................................... 57
6. Conclusions .......................................................................................................................... 67
7. Recommendations ............................................................................................................... 70
Reference list ........................................................................................................................... 73ABBREVIATIONS AND ACRONYMS BFAP Bureau for Food and Agricultural Policy BWI Biodiversity Wine Initiative FSA Fruit South Africa IBETA International Bulk Exchange, Trade and Auction IPW Integrated Wine Production OIV International Organization of Vine and Wine PACSA Pietermaritzburg Agency for Community Social Action PIC Public Investment Corporation PWC PricewaterhouseCoopers SATI South African Table Grape Industry SAWIS South African Wine Industry Information & Systems SIZA Sustainability Initiative of South Africa SWSA Sustainable Wine South Africa WFP Women on Farms Project WIETA Wine Industry Ethical Trading Association WISE Wine Industry Strategic Exercise WOSA Wines of South Africa LIST OF TABLES Table 1: Global table grape producing and exporting countries 2015 (Seccia et al. 2015).......7 Table 2: Shifting employment numbers in table grape industry, South Africa, 2013–2015 ...10 LIST OF FIGURES Figure 1: Area under table grape production 2012/13–2014/15 (Source: DAFF 2015) ............8 Figure 2: Worker profile per province June 2016 (Source: SIZA 2016) ...................................11 Figure 3: South Africa’s wine producing regions (Source: WOSA 2016) .................................13 Figure 4: The wine supply chain (Source: VinPro 2016) ..........................................................14 Figure 5: Trade channels for wine in Germany (Source: Profound 2015) ...............................47
1.     INTRODUCTION

1.1    Background
The apartheid system supported the emergence of unequal power relationships between
black African/coloured workers and white farm owners. South Africa is transitioning
towards a more just and equal system, but very slowly. It has taken the country more than
two decades to recognize poor working conditions as a national issue.

 Racial classification in South Africa

 Racial classification in South Africa is still based on the apartheid-era Population Registration Act
 (1950). This act recognised four main groups: White (of European descent), Natives (black
 Africans), Indians (of Asian descent) and Coloured people (of mixed descent) (SAhistory.org.za
 n.d.). These categories are still used as descriptors of racial groups, and requested as identifiers
 in government documentation (Parcsa.co.za n.d.).

A 2011 Human Rights Watch Report highlighted the poor living conditions of South Africa’s
farm workers, noting issues regarding sub-standard housing conditions, poor occupational
health and safety conditions, lack of access to basic services and low wages (Human Rights
Watch 2011). While conditions have improved for some, for many these findings still form
the day-to-day reality of their lives.

In late 2012 farmworkers in De Doorns and the surrounding areas in the Western Cape went
on a widespread strike in reaction to low wages and poor services. This unprecedented and
widespread action highlighted the underdevelopment and exploitation taking place in South
Africa’s rural hinterland. These issues have been consistently neglected in post-apartheid
South Africa. Farmworkers in the De Doorns region demanded a wage increase from R69 to
R150 a day and highlighted poor employment conditions on local farms. Farmers argued
that this increase would make farming unviable, cost the industry jobs and aggravate the
social problems associated with widespread unemployment.

Non-government organisations, in particular the Women on Farms Project (WFP), countered
this argument based on their work with farming communities (Donnely 2013). It argued that
there was scope to improve conditions, including through increasing salaries and by
providing farmworkers with their own land to enable them to improve food security. In
response, the South African government commissioned a study to explore working
conditions on farms. The Bureau for Food and Agricultural Policy (BFAP), a research body
based at Pretoria and Stellenbosch universities, undertook the study.

                                                  1
The study interrogated agricultural wages across the country and highlighted the pressure
felt on both sides of the divide, noting that the dilemma facing farmers and farmworkers
was potentially “highly disruptive” to the industry (BFAP 2012). It called for an improvement
in policy to manage the resultant conflict. Further, the report highlighted growing evidence
of commercial farmers shifting from using “permanent workers to using more seasonal
workers and that many people who used to live on and work on farmers no longer [did] so”
(BFAP 2012).
It identified a significant problem in that even if farmworkers were paid R150 a day, which
seemed unaffordable to most farmers, “most [farmworker] households [still] cannot
provide the nutrition that is needed to make them food secure.” The existing “hunger
wages” did not cover basic necessities for families; workers stopped striking in places where
wages were increased and met basic needs (De Waal 2012).
In addition, the report argued that South Africa’s agricultural sector had always been
dependent on the availability of cheap and unskilled labour, which was not a tenable long-
term strategy for the sector. Unskilled labour typically refers to those who do not hold
formal qualifications to undertake the work they perform; i.e. it excludes knowledge gained
through experience, and marginalises jobs not viewed as formal, such as harvesting. The
official sectoral determination for the farmworker sector that outlines minimum wages,
working hours, leave days and termination processes, applies to all workers on a farm,
including domestic workers and security guards (Labour.gov.za n.d.). This does not,
however, automatically confer protection on workers hired under different designations
(casual, part-time, etc.) that leave them vulnerable to exploitation.
Farmers were already turning to the use of less, but more skilled and better-paid workers.
Policy, however, was not aligned with this transition in production systems and not geared
to ease the difficulties that both farmers and workers would face. There is very little
evidence even that significant role players in the private and public sector recognise this as
a problem. This transition has also encompassed the casualisation of labour to avoid the
regulatory burden (minimum wage, paid leave, etc.) placed on the use of permanent
employees (Visser & Ferrer 2015).
This issue is complex in that wage demands are but one aspect of the outrage felt about the
legacy of inequality, which is compounded by significant food price inflation. The
Pietermaritzburg Agency for Community Social Action (PACSA) publishes regular food price
barometers tracking increases in selected basic food items. It reveals in its last report of
2016 that the price of a basic food basket increased 16.7 percent between October 2015
and 2016. The basket equates to the average monthly food spend of a low-income
household. PACSA notes that this basket is not nutritionally sufficient and that for a low-
income family of seven people to eat nutritiously they would need to spend at least
R4 197.31 a month. Almost half of South Africans (47 percent) earn less.
2StatsSA’s 2015 Labour Market Dynamics Survey calculates the median monthly earnings for
Africans at just R2 900. Even the recommended national minimum wage introduced by the
National Economic Development and Labour Council (Nedlac) in 2016 at R3 500 a month
(R20 an hour) is insufficient to guarantee nutritional security. Low wages also have other
negative consequences.
When families do not have the money to meet basic daily needs, they often take on credit
to survive (Donnely 2013). WFP estimates that many farmworkers – about 70 percent of the
work force – are hired as seasonal workers; most of these are women.
The gendered nature of the agricultural sector is a socially exclusionary one in that women
are discriminated against and adversely incorporated into exploitative household
reproduction and labour relations (Hickey & du Toit 2007). Social and cultural identity play
very important roles in processes of social exclusion and adverse incorporation, as do the
ways in which culturally embedded gender norms and roles work to marginalise women.
In addition, the shift to using seasonal labour is linked to an increase in legal and illegal
evictions of farm workers from farms, and, a result, growth in the number and size of
informal settlements in the surrounding areas. A 2011 study focused on the growth of
informal settlements around Rawsonville in the Breede River Valley area surveyed residents
to find that 68 percent of respondents had been evicted from nearby farms. Many of these
were ‘constructed evictions’ in that farmers had cut off electricity and/or water supplies to
force farmworker families to move.
Although much of the focus has been on the relationship between farmers and farmworkers
within the boundaries of farm production, a broader analysis of the food economy within
which farmworkers find themselves provides another useful way of understanding what
seems to be an intractable challenge. Indeed, a systemic approach to the broader system is
generally absent from both agricultural policymaking and popular discussions of the
agricultural sector (van der Heijden, 2013). A different picture and different strategies may
emerge when considering the entire food system, from the farm to the consumer's plate.
According to van der Heijden, a food-economy approach demonstrates that outcomes in
land reform, rural poverty and retail food prices are interrelated and are the result of
specific systemic policy choices rather than any “inevitable” workings of the market.
A modern, industrialised food system, which is dominant in South Africa, is characterised by
distance between farmer and consumer, and long supply chains. Farmers and consumers no
longer deal directly with each other but through intermediaries such as processors,
wholesalers and supermarkets. In these supply chains the basic economic assumptions of
demand, supply and equilibrium price seldom apply in neatly predictable ways. Instead,
value sharing and cost sharing along the supply chain are determined to a considerable
degree by who has power and who does not. Increasingly, it is the processors and
supermarkets that have power in the system.
3Smaller farmers and poorer consumers – including farmworkers – tend to have the least
power of all. Long supply chains in themselves add costs, logistics, marketing and the profit
imperative of many stakeholders. This food-economy structure is the main reason many
farmers claim they cannot afford to pay decent wages, why small and emerging farmers
struggle to make a living, and why most South Africans cannot afford to buy basic, nutritious
food, even when they are employed.
This is not to argue that focus should be taken away from farms, but rather that they must
be situated within a broader food system to allow for points of influence and leverage to be
identified. For example, South Africa is a major supplier of bulk wine to the European
market. It exported more than 61 million litres of bulk wine to Germany in 2015, 76 percent
of exports to the country (South African Wine Information Systems [SAWIS] 2016). While
South Africa is a significant bulk wine supplier in the global market, it fetches among the
lowest prices for wine sold in this way. The shift to exporting bulk wine resulted in a loss of
local revenue of almost R1.9 billion in 2014 (Harpers.co.uk 2015). Looking at the wine
industry from a broader systemic perspective begs new questions and ideas about how to
support the improvement of farmworker conditions in South Africa.
Considering the many challenges faced by the South African agricultural sector, this report
investigates possible linkages between the purchasing practices of German discount
supermarkets and labour conditions on South African grape farms. The research was
commissioned as a side project of the WFP/ODE Programme on Labour Rights, which
explores the context and causes for the labour rights situation in the South African grape
and wine market to develop adequate advocacy strategies to improve the situation.
1.2 Methodology
A review of literature focused on South Africa’s wine industry, its value chains and export
links revealed the dearth of peer-reviewed literature on this sector. Most information in this
study was drawn from annual reports and general news sites. The factual framework was
countered by a series of interviews, telephone conversations and email correspondence
with key stakeholders in the wine industry, including wine farmers, import and export
companies and marketing organisations.
This enabled a sense of the reality of farmers to emerge, which is countered by the results
of two focus group discussions conducted by WFP in the Western Cape in 2016 with women
farmworkers. This report draws on WFP’s 2017 Labour Conditions Survey, based on a
participatory research methodology that employed both focus group discussions and a
survey of 343 female farmworkers in the Western Cape and Northern Cape provinces. While
the sample size is not necessarily representative the congruence in findings across farms
and the provinces does illustrate common themes.
41.3 Report structure
The report is structured as follows:
Chapter 2 looks at the global and local South African grape and wine markets. The
chapter also provides an in-depth look at labour conditions in the wine production
regions and an overview of the organisations and initiatives that aim to support
transformation.
Chapter 3 provides an overview of labour conditions on South Africa's wine farms,
including the trends that affect these conditions, such as declining employment
opportunities and the casualisation of labour.
Chapter 4 expands on the different accreditation schemes applicable to the South
African grape and wine sectors.
Chapter 5 analyses the wine export market, with a particular focus on Germany. It
explores South Africa's trade in wine with Germany and the key trends that
determine local producers' ability to enter and succeed in the market.
Chapter 6 summarises key observations from the preceding chapters.
Chapter 7 concludes the report, recommending key themes around which Oxfam
and its partners could build advocacy campaigns to improve working conditions for
wine and grape workers in South Africa.
52. THE GLOBAL & LOCAL GRAPE AND WINE MARKETS
More than 24.9 million tons of grapes are produced each year (2020 Foresight 2015), mostly
in China, the United States, Italy, France, Spain, Turkey, Chile, Argentina, Iran and South
Africa (2 percent market share) (Countryranker.com 2016). About 70 percent of grapes is
used to make wine, 27 percent is eaten as fresh fruit and the balance is sold as dried fruit
(Perfectinsider.com 2016). Both grapes and wine are traded as commodities and for the
best price possible. Price is determined by factors such as the state of the global economy,
consumer demand, brand reputation and the purchasing power of the wine buyer –
importer, supermarkets, blenders and discounters.
The South African grape and wine industry is one of the country’s leading exporters of
agricultural products. The industry accounted for 1.2 percent of the national GDP in 2013,
contributing R36.1 billion to the national economy (VinPro 2015). This was a 37.8 percent
increase from the industries’ 2008 contribution, despite the global economic recession
(VinPro, 2015). The grape and wine industries contribute to the national economy through
wine tourism, agriculture, manufacturing, trade and hospitality.
Multilateral trade agreements between Europe and South Africa have expanded the export
market for South African producers.
The grape and wine industry employs more than 300 000 people directly and indirectly,
including farmworkers, packers, retailers and those working in wine tourism (VinPro 2015).
2.1 The table grape market
International trade in table grapes has grown significantly since the 1980s due to
technological production, storage and transporation innovations, increasing consumer
demand and enabling trade agreements (Seccia et al. 2015).
While some countries dominate exports, this is not necessarily a concentrated market in
that recent entrants such as Peru have quickly been able to capture significant share (Seccia
et al. 2015). China is the biggest consumer of grapes (more than 5 million tons in 2013),
followed by India (2.09 million tons) and the United States (1.21 million tons). Despite
European Union countries holding significant production roles, the region remains a net
importer of table grapes, primarily from South African and Chile (Seccia et al. 2015).
6Table 1: Global table grape producing and exporting countries 2015 (Seccia et al. 2015)
Table grape producing countries Table grape exporting countries
(% of global production 2015) (% of global market share 2015)
China 12% Chile 20%
Italy 9.1% United States 12%
United States 8.7% Italy 12%
France 7.6% The Netherlands 7.5%
Spain 7.4% South Africa 6.7%
Turkey 5.5% Turkey 5.7%
Chile 4% China 5.4%
South Africa 2.3%
It is interesting to note that the Netherlands with 7.5 percent of the export market is not a
grape-producing country, but serves as a trans-shipping point to other countries, both in the
northern and southern hemispheres (Seccia et al. 2015).
2.1.1 An overview of the South African table grape market
There are an estimated 627 table grape producers in South Africa (DAFF 2015). A 2015
report by the Department of Agriculture, Forestry and Fisheries on the country’s table grape
value chain noted a significant increase (47 percent) in the number of table grape producers
between 2013 and 2015, mainly in the Hex River and Orange River regions (DAFF 2015b).
Total production volume increased by 15 percent between 2014 and 2015 (DAFF 2015b).
About 35 percent of the total area planted to deciduous fruit in South Africa is dedicated to
table grapes and nearly 2 million tons of grapes are produced per year (DAFF 2015). Most
production takes place in the Western Cape’s Hex River Valley, which produces more than
half of all grapes for export, followed by the Northern Cape with some production in the
Eastern Cape, Free State and Limpopo provinces (DAFF 2012). The sector contributes more
than R3 billion to South Africa’s GDP; R183 million of which was generated by black-owned
farmers (Fin24.com 2016). The total value of production was just more than R4 billion in
2015 – the significant increase in value from 2006 is driven by local inflation as opposed to
increased production (DAFF 2015).
7Figure 1: Area under table grape production 2012/13–2014/15 (Source: DAFF 2015)
South Africa produced about 270 million tons of grapes in the 2015/16 growing season –
nearly 90 percent of this was exported (SATGI 2016b). Just more than 80 percent of grapes
were exported to the United Kingdom and Europe and while prices were slightly down
compared to the previous season, they increased in Germany where the wholesale prices
were 5 percent higher in 2015/16 than the year before (SATGI 2016b). South Africa captured
6.18 percent of the global fresh grape market, and 4.38 percent of the dried grape market in
2014 (DAFF 2015), rising to 6.7 percent in 2015 (Seccia et al. 2015). The country is the
second largest exporter of table grapes in the southern hemisphere (Seccia et al. 2015), yet
still imports grapes from other African countries to satisfy local demand (DAFF 2015b). In
2014, South Africa exported just over 9 292 tons to Germany, far less than the amounts
exported to the Netherlands (134 481 tons) and the United Kingdom (65 732 tons) (DAFF
2015).
2.1.2. South Africa’s export relationship with Germany
Most German retailers and wholesalers prefer to deal with producers through an agent or
import company – direct relationships are not common (USAID 2007). Specialist importers
normally handle fruit sales to retailers (USAID 2007). South Africa does supply directly to
Germany, although it is not one of the country’s prime markets, but it is also possible that
South African grapes find their way into Germany through the Netherlands (USAID 2007).
Major importers/wholesalers/retailers dealing with grapes in Germany are the Rewe Group,
Metro AG, Edeka, Aldi, ITT Ltd., Tengelmann, WalMart, Real and Fruticola, among others
(USAID 2007).
8The exporter plays a critical role in liaising with many elements along the supply chain,
including management of the cold chain to ensure that quality is maintained until point of
sale abroad (DAFF 2015b). The Fresh Produce Exporters Forum represents South African
fruit exporters and aims to act as a gateway between local producers and international
markets.
Fruit is exported directly to an importer with help or not from an agent, or sold through a
cooperative (DAFF 2015b). Few exporters have long-term contracts with
wholesaler/retailers, although there is a shift in this trend given the increasing strictness of
phytosanitary regulations and the need for long-term planning (DAFF 2015b). The South
African Table Grape Industry organisation sent a delegation to Germany in 2015 to improve
understanding of the key trade practices of European buyers. The representatives on this
trip noted that German discount chains were beginning to dominate the United Kingdom
retail space with discount retail practices, and this would require producers to amend their
marketing strategies (SATGI 2015b).
2.1.3. The table grape supply value chain
Producer Pack house Cold storage Exporter Transporter
Inspection services Port and terminal operators Retailers
Consumers
The supply chain between producers and consumers is long and complex. The above
illustration does not include labour, financial institutions, government and other traders,
which also play a role in the production, sale and consumption of table grapes
(DAFF 2015b).
2.1.4. External factors influencing the market
The global recession, which started in 2009, and the subsequent local recession have
affected both the wine and grape industries.
The grape industry is buffered, however, by the rising demand for grapes and prices have
increased year-on-year since 2012 with projections that consumer prices will remain about
2.5 percent above current inflation rates for the next decade (ARC 2013). In addition,
competition from developed countries within the European Union is diminishing as
producers there face increasing production costs and competitive markets (Seccia et al.
2015). South Africa also enjoys preferential market access to the European Union through
the Trade Development and Cooperation Agreement, and this region remains the most
significant market for table grape exports (DAFF 2015b). While the United Kingdom’s
departure from the European Union will not affect South African table grape producers
because its existing treaties remain in place during the transition period, producers are
increasingly looking to Asian markets to offset the risk of losing preferred status in these
markets (SATGI 2016b).
92.1.5. Internal factors influencing the market
The costs of production have increased significantly since 2012. Costs for fertiliser and
organic material have grown by 40 percent since 2012, for pesticides and herbicides by
almost 80 percent and for labour by more than 25 percent (SIZA 2016). In addition, the
increase in produced volume means that South African producers are under pressure to find
new markets, but have historically battled to access the Asian markets (DAFF 2015b).
There has been some bad press in recent years about the perceived reliability of South
African grape exporters, due to unfavourable weather in the Orange River and Berg River
regions that affected the quality and quantity of grapes available for export (DAFF 2015b). In
addition, the prevalence of bugs, such as the fruit fly, cotton stainer bug and vine snout
beetle, has affected the quality of export grapes (DAFF 2015b). The consumer trend is
towards seedless varieties of grapes, which is an expensive shift for farmers to make.
A statutory levy was passed in October 2016 on exported table grapes for 9.22 cents a
kilogram; the levy will incrementally increase to 10.89 cents a kilogram by 2019 (DAFF
2016). The levy will be used to support research (70 percent of levies paid), pay
administrative costs (10 percent) and establish transformation initiatives (20 percent) (DAFF
2016).
2.1.6. Employment conditions in the table grape sector
Just more than 10 800 permanent workers were employed in the sector in 2015 with about
192 500 dependents (DAFF 2015b). This is an increase in the number of permanent workers
in 2014, but still 8.6 percent lower than the number employed in 2013 (DAFF 2015b). This is
possibly accredited to a shift towards using seasonal or contract labour. The table below
indicates the shift in employment patterns between 2013 and 2015.
Table 2: Shifting employment numbers in table grape industry, South Africa, 2013–2015
Region 2013 2014 2015
Seasonal Permanent Seasonal Permanent Seasonal Permanent
Berg River 18 879 3 535 13 215 2 474 11 409 2 474
Hex River 8 795 4 580 7 527 3 995 7 600 3 266
Northern 2 951 850 3 008 722 7 635 1 698
provinces
Olifants 3 500 750 3 736 880 4 046 968
River
Orange 1 6874 2 156 12 971 1 274 11 603 2 439
River
TOTAL 50 999 11 871 40 457 9 345 42 293 10 845
Source: Adapted from SATI Statistical Yearbook, 2015
10A Sustainability Initiative of South Africa (SIZA) 2015 monitoring and evaluation report notes
the worker profile across the various provinces, as depicted in the figure below. What is
evident are the significant levels of temporary labour used throughout the country. There is
insufficient monitoring and evaluation of the extent of labour rights protection and abuse
happening at this level.
Figure 2: Worker profile per province June 2016 (Source: SIZA 2016)
A 2009 film Land of Dust (https://sacsis.org.za/site/article/2009) highlights some of the
issues that farm workers on table grape farms in the Berg and Hex River Valley faced. The
state provides for a minimum wage for farm workers.
Up until February 2017, the minimum hourly wage was R14.25 and daily wage was R128.26
based on a nine-hour working day (DAFF 2015b). The rate increases each year by the
Consumer Price Index amount plus 1.5 percent (DAFF 2015b). The last census on the sector
was conducted in 2008 and it indicated that at that time, almost 40 percent of permanent
workers had medical benefits and 96.2 percent had unemployment insurance, with 17.4
percent of seasonal workers having access to medical benefits (DAFF 2015).
A 2015 government report noted that most farms were compliant with broad-based black
economic empowerment (B-BBEE) legislation, the number of farms owned by women was
growing and that historically disadvantaged people had owned 9 percent of agricultural land
dedicated to table grape production by 2008 – the last year for which information is
available (DAFF 2015).
11Fruit South Africa (FSA) is a non-profit organisation comprising representatives of the Citrus
Growers’ Association of Southern Africa, HORTGRO, SUBTROP, the Fresh Produce Exporters
Forum and the South African Table Grape Industry (SATI) (FSA n.d.). Among its various
objectives, the organisation aims to promote broad-based black economic empowerment,
skills development and transformation (FSA n.d.). One of its initiatives in this regard was the
launch of an ethical trade programme in 2008, which became the Sustainability Initiative of
South Africa (SIZA) because of demand from retailers and consumers that fair labour
practices be used on the farms that supply them. The ethical standard was developed in
South Africa, but is aligned to the Global Social Compliance Programme (SIZA n.d.). This
programme is supported by local and international retailers, such as Tesco, Walmart, Ahold,
COOP Switzerland, Carrefour, and Delahize (SIZA n.d.). SIZA monitors both environmental
issues and labour legislation compliance (SIZA n.d.).
This programme provides support to producers wanting to run ethically compliant
businesses and improve labour conditions on farms (FSA n.d.b). It promotes an ethical
standard to be used as a benchmark for best practice; the standard aligns with international
requirements (FSA n.d.b). The organisation monitors and verifies compliance with the
standard among its members through self-assessments and third-party audits (FSA. n.d.b).
SIZA has a membership of 1 523 – 14.87 percent of those are from the table grape industry
and 3.03 percent from the wine industry (SIZA n.d.). It has conducted 271 ethical audits
since January 2016 (SIZA n.d.). It provides its members with a variety of resources, including
the Ethical Trade Handbook and practical training courses (SIZA n.d.). The latest monitoring
and evaluation report of 2016 notes that non-compliance issues mostly focus on health and
safety (40 percent of all instances), wages and terms of employment, and working hours
issues (SIZA 2016). There has been a marketing attempt in Germany to grow awareness of
SIZA accreditation, but there is no literature available on the success of this strategy (SIZA
n.d.), although SIZA is recognised as a partner by GLOBALGAP (FSA n.d.c.).
2.2 The wine grape market
International trade in wine is nothing new. It has been traded across borders for at least
3 600 years (Winepros.org n.d.). More than a thousand years ago, the Roman Empire began
exporting wine in barrels to Spain, Germany, England and France (Winepros.org n.d.). More
than 270 million hectolitres of wine was produced in 2015 (Union Italiana Vini [UIV] 2015),
mostly by the top 15 wine producers: Italy, France, Spain, the United States, Australia,
China, Chile, South Africa, Argentina, Germany, Russia, Romania, New Zealand and Hungary
(Italianwinecentral.com 2016). The biggest importers of wine are the United States (41.45
percent of all imports) followed by the United Kingdom (28.7 percent), China (18.73
percent) and Germany (17.8 percent) (UIV 2016). Figures from the first quarter of 2016,
though, indicate that Germany is currently the world’s leading wine importer (UIV 2016).
12The value of international trade in wine was about $31 billion in 2015; more than $22.5
billion of this was in the form of packaged wine, $5.7 billion in sparkling wine and
$3.1 billion in bulk wine (UIV 2016). The proportion of wine shipped in bulk has increased
dramatically growing from 830 million litres in 2010 to about 870 million litres in 2015
(UIV 2016).
2.2.1 An overview of the South African wine grape market
There is an estimated 98 597 hectares dedicated to producing wine grapes in South Africa
(WOSA 2016). South African wine production is concentrated in the Western Cape Province
with major vineyards around Paarl, Stellenbosch and Worcester (VinPro 2015). There are six
regions in the Western Cape, namely Breede River Valley, Cape South Coast, Coastal Region,
Klein Karoo, Olifants River and Boberg (Figure 3). The regions encompass 26 diverse districts
and 69 smaller wards. Other wine-producing regions in the country are found in the
KwaZulu-Natal, Northern Cape, Eastern Cape and Limpopo provinces (Ponte & Ewert 2009).
The best-known South African wine estates are in the Cape Winelands, which include the
areas of Stellenbosch, Paarl, Franschhoek, Wellington, Constantia, Robertson, the
Swartland, the Breede River Valley, and Durbanville (WOSA 2016). The wine farms in these
areas produce different varieties, including Cabernet, Shiraz, Chenin Blanc and Riesling,
Merlot, Chardonnay, Sauvignon Blanc and Gewürztraminer (Ponte & Ewert 2007). South
Africa also produces lesser known varieties, such as Cinsaut, Tinta Barocca and Pinotage.
Figure 3: South Africa’s wine producing regions (Source: WOSA 2016)
There were about 3 300 primary grape producers in South Africa in 2013 – a marked
decrease from 3 800 in 2008, indicating a fair level of consolidation, most likely due to
declining local demand and rising production costs putting pressure on smaller producers
(SAWIS 2015).
13Producers have formed partnerships to reduce production costs and some have closed
operations (March 2016). This figure remained relatively stable at 3 314 primary producers
in 2015 (WOSA 2016c).
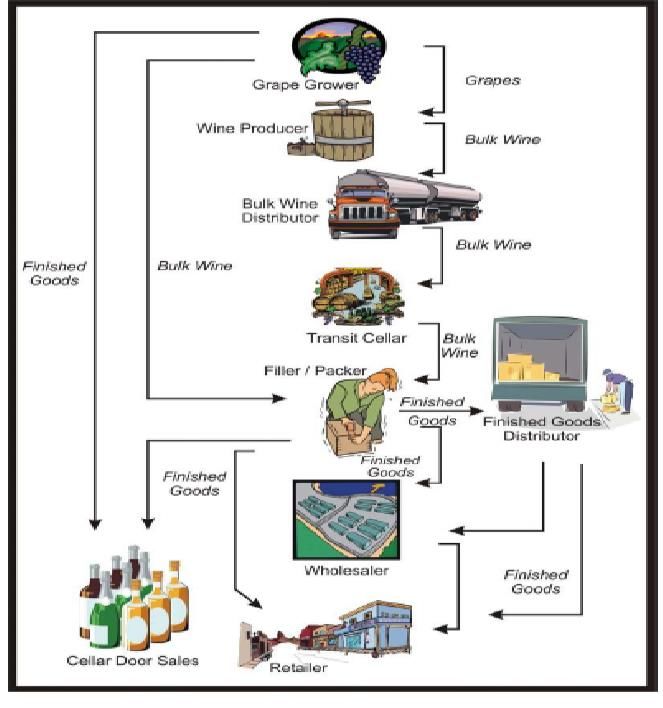
Figure 4: The wine supply chain (Source: VinPro 2016)
The wine production sector in South Africa can be divided into (Topwinesa.com 2016):
Close on 500 private wine cellars, which is more than double the 218 in 1996.
About 50 producer cellars (cooperatives and companies) with 34 having the ability to
crush more than 10 000 tons of grapes a year. Cooperative wine cellars press about 80
percent of all wine grapes harvested in South Africa.
71 export-only wholesalers and 47 general and producer wholesalers who market,
distribute and export wine in packaged or bulk form in 2013. This figure has decreased
quite significantly to only 25 producer wholesalers operating in 2015 (WOSA 2016c),
which points to a trend of consolidation. Producer wholesalers are responsible for the
bulk of exports.
The ability to deliver high volumes of bulk wine has been shaped by the country’s
cooperative cellar history. These producer cellars have the advantage of supplying volumes
of reasonable to good quality wine at low prices (Bezuidenhout 2014). Wine is typically
received by the producer cellar from growers/members and is sent onto bulk wine
merchants or bottled on site; otherwise it is sold as bulk wine for export or to corporate
wine companies (Bezuidenhout 2014).
14The number of producer cellars has decreased from 66 in 2003 to 50 in 2012; some through
mergers to create Uni-Wines in Rawsonville, Bonnievale Winery in Bonnievale and Orange
River Cellars in Upington (Bezuidenhout 2014). The 50 producer cellars produce about
12 million litres of wine a year (Bezuidenhout 2014).
Discounters handle about 41 percent of off-trade wine sales and supermarkets between
35 percent and 39 percent (Deutsches Weininstitute GmbH 2014). On-consumption trade is
facilitated by the hospitality industry and bottle stores, specialist wine retailers and direct
sales.
The wine industry in South Africa employs about 300 000 people directly and indirectly,
including farm workers and those involved in packaging, transportation, retailing and wine
tourism (SAWIS 2015); these numbers include about 121 000 African and coloured people
employed as mostly seasonal fruit and wine farm workers in the Western Cape province.
Since 1994, South African wine producers have increasingly looked to wine exports to
sustain the local industry. The export trend is driven by the overproduction of red wine on
the South African market, stagnant local consumption rates, the returns provided by the
declining value of the Rand and, more recently, the increase of the duty-free allocation on
exports to the European Union, which came into effect in 2016 (SAWIS 2015).
South Africa exported 99.9 million litres in 1996, nearly 272 million litres in 2006 and more
than 412 million litres in 2015 (WOSA.co.za 2016c). Exports reached a high in 2013 at 525
million litres of wine (SAWIS 2015).
As percentage of local production, exports grew from 38.3 percent in 2003 to 57.4 percent
in 2013 before declining to 43.4 percent in 2015 (SAWIS 2016). The value of exports has
nearly doubled from 2008 to reach about R8.5 million in 2013 (SAWIS 2015). Primary export
destinations are the United Kingdom (26 percent of all exports in 2015), with Germany
absorbing 19 percent and the Netherlands, Sweden and other African countries accounting
for a further 16 percent (WOSA 2016c).
2.2.2 External factors influencing the market
The global recession, which started in 2009, and the subsequent local recession have
affected both the wine and grape industries. The wine industry has had to contend with the
global glut in wine (although this is starting to subside) and stagnating global consumption
rates (ANZ 2015). Global vineyard plantings are shrinking and the industry is becoming
increasingly consolidated (ANZ 2015), allowing larger organisations, particularly those
controlling distribution, to effectively control the market.
It is difficult to break into international markets, unless you have the connections or
money for big marketing campaigns. WOSA [Wines of South Africa] does provide
some support in this, but they are also underfunded... (Interview: Wine Estate 2016).
152.2.3 Internal factors influencing the market
Local wine producers overestimated the local demand for red varietals increasing
production significantly by about 18 percent between 2003 and 2013; this resulted in a
market glut, which further depressed local prices (SAWIS 2015). South Africa also has a
relatively stagnant domestic consumption rate – an increase of just 0.7 percent since 1998
(SAWIS 2015). Per capita consumption is relatively low at 7.5 litres in 2015 compared to 23.8
litres in Australia and 37.5 litres in France and Italy (SAWIS 2016). The decrease of nearly
2 litres a year from 2013 can possibly be accredited to aggressive marketing of beer in the
country (SAWIS 2015) and the inability of the wine industry to capture the emergent black
market.
Wine does not have a history in South Africa’s black community; we need to find
ways to communicate wine knowledge and encourage a love of wine… (Interview:
Producer wholesaler 2016).
Growth in the sector is thus driven by increased local consumption of wines in the premium
and super premium sectors (SAWIS 2015). Both wine and grape producers are also facing
intensifying cost pressures; total production costs have risen by 95 percent a hectare
between 2006 and 2015 (Vinpro 2015). Production costs (including electricity, fertiliser and
pest and disease control costs) have risen by about 50 percent compared to a 38 percent
increase in income per ton of grapes produced (SAWIS 2015).
Packaging costs have increased by 146 percent more than the overall inflation rate for the
period 2008–2013 (SAWIS 2015).
Besides electricity costs, the devaluation of the Rand has affected us because it
increases the capital costs to replace machinery, barrels, etc. (Interview: Wine
Estate 2016)
The results of a PriceWaterhouseCooper (PWC) survey conducted in 2015 indicate that
rising energy costs, and increasingly the threat of an unreliable energy supply, are of most
concern to farmers with labour productivity coming in third, and the cost of labour fifth
(PWC 2015). There are also concerns about land reform, which have increased since 2014
(PWC 2015). There is an increasing shift in the industry to measuring labour productivity and
the offering of performance-based payments (PWC 2015).
South African farms are under pressure to keep their prices the same... However, the
cost of labour, electricity and fuel has gone up dramatically. So, the farmer ends up
not getting more for his product, but less. (Interview: Wine exporter 2016)
Labour costs have increased... making up 37 percent of total costs. (Interview: Wine
cellar 2016)
A recent Wine.co.za article notes that the average producer makes a profit of just R3 on a
bottle of R50 wine (Wine.co.za 2016). An interview with a leading wine estate confirms this.
16If you take a R40 bottle of wine and take off VAT, excise duty, retail margins, etc. the
profit seen by the producer is really only about R3. The cost of everything is
increasing but the cost to the consumer can’t go up too much, which means that
profit margins are shrinking. Farms need to look to alternatives, different distribution
mechanisms, different markets… (Interview: Wine company).
There will be differences between producers as to what percentage return this is. The
average expected profit is 30 percent, but it is not clear how many producers manage to
achieve this (March 2016). Taxes on a R50 bottle of wine amount to R32 (March 2016),
operational costs in 2012 were about R29 000 a hectare a year prior to de-stemming and
fermenting, ageing, filtration and bottling (Blankbottle.co.za 2012).
Energy as a significant factor of production costs
Energy is increasingly a significant factor in production costs (Heyns 2016). Two adaptation
options are behavioural change, which entails raising awareness of the need to conserve
energy to both farmers and farm workers, and technical interventions (Heyns 2016).
Energy is used in the processing and packaging stages (Boisset 2009). Mechanised
harvesting, transporting of grapes and refrigeration also contribute to overall energy usage,
and add significantly to greenhouse gas emissions (Boisset 2009). Further to this, the release
of volatile organic compounds during the fermentation process (such as benzene, polycyclic
aromatic hydrocarbons and 1,3 butadiene) pollute the air and can be harmful to humans.
In response, many farms have set up solar electricity projects and water infiltration systems.
Some producers monitor their carbon footprint in response to growing concerns about the
emissions associated with wine production, and the looming possibility of a carbon tax. The
demand for organic grapes and wines is increasing on the local (Boisset 2009) and the
international market (VinPro 2015).
The trend towards mechanisation will place further pressure on this cost centre, contribute
to South Africa’s already high carbon emissions, and exacerbate the social consequences of
high unemployment rates. See section 3.6.3 on mechanisation as trend affecting labour in
the wine sector.
2.2.4 The economic outlook for the wine sector
The industry is one of South Africa’s leading agricultural exporters. It contributed close to
R36 billion to annual gross domestic product in 2013 (about 1.2 percent) and supported the
direct employment of about 290 000 people. More than 50 percent of which are unskilled
and close on 30 percent are semi-skilled (SAWIS 2015). It is both a labour- and capital-
intensive industry throughout the value chain (SAWIS 2015).
17Only an estimated 15 percent of South African wine farms, however, are running
economically sustainable businesses (PWC 2015) with about 33 percent of producers
experiencing negative net farming incomes (SAWIS 2015). There is an apparent direct
correlation between production yields and income – those generating significant yields with
low production costs are profitable, while those generating low yields are breaking even or
operating at a loss (March 2016). Some producers are heavily indebted and some have
switched to other farming enterprises or have closed their operations (Ponte & Ewert 2009).
The 2015 PWC report further notes that most of the wine producers participating in the
survey are “not confident about revenue growth at all” with only 22 percent very confident
about revenue growth in the short to medium terms (PWC 2015). The implications of wine
farms closing stretch along the value chain, affecting not just farm worker positions, but also
the jobs of those that work at producer wineries, logistics and bottling firms.
As a wholesale producer, our biggest risks are the cost of raw grapes. If there is no
sustainable production or producers can’t afford to stay in the game and produce
grapes for wine, we have got nothing to sell. (Interview: Wholesale producer 2016)
While the weakened South African Rand has provided some benefit to exporters wanting to
gain access to international markets, the sale price of wine has remained relatively stable
and the PWC report (2015) cautions producers that it will be difficult to make the necessary
price gains when the Rand strengthens. The weakened Rand has meant that South African
premium wines have been made more affordable in the European market – almost 25
percent cheaper when using US$ rates and 16 percent cheaper when using € rates (Peens
2016). Producers are starting to charge in US dollars and Euros to mitigate this loss
(Peens 2016).
There are fundamental economic issues with agriculture as a business in South Africa
because it historically has relied on a supply of cheap labour, facilitated by apartheid-era
legislation and policies. The effect of these has been the marginalisation of farm worker
rights and opportunities, and unequal power relations that largely determine the labour
conditions on South Africa’s grape and wine farms.
There are fundamental economic issues with wine production as a business in South
Africa. The industry is struggling to remain economically viable. Perhaps if the
industry was more financially stable this would translate into better labour
conditions. (Interview: Wine Estate 2016).
The local and international wine market is very competitive. To get an edge and
maybe make money to put into social development is tough. There is no incentive or
support provided by government. (Interview: Wine company)
I would like to think that if South African producers were able to generate more
profits from production that this would translate into better take-home salaries for
workers, but you can’t guarantee it. (Interview: Wine Cellar 2016)
18Economic conditions are often perceived or presented as a rationale for not improving
social conditions, with some farm workers interviewed by WFP noting that farmers will
abide by the letter of the law (labour legislation), but not the spirit. There has been no
discernable improvement in farm worker conditions related to additional income being
generated through, for example, increased exports or the addition of wine tourism activities
(restaurants, guesthouses, activities) to existing income streams.
193. LABOUR CONDITIONS ON SOUTH AFRICA’S GRAPE AND WINE
FARMS
The power dynamics between employers and farm workers in the Cape Winelands cannot
be ignored as a determinant of working conditions.
The contemporary unequal power relationships between farmers and African or coloured
workers emerged during the apartheid era and the transition to a more just and equitable
system is a very slow one. This historic unequal bargaining power is compounded by
common issues experienced in South Africa’s rural areas, such as high levels of alcohol and
drug abuse, tuberculosis, HIV/Aids, crime, teenage pregnancies, illiteracy, domestic violence
and foetal alcohol syndrome (BAWSI 2011).
The 2011 Human Rights Watch report on the living conditions of South Africa’s farm
workers notes the sub-standard housing conditions, poor occupational health and safety
conditions, forced evictions, and lack of access to drinking water, handwashing facilities or
toilets, which are required by labour regulations (Human Rights Watch 2011). In addition,
the report noted the very low wages, lack of contracts and discrimination towards women
workers (Human Rights Watch 2011). This report was based on interviews conducted in
2010 and 2011 with more than 260 people, nearly half of them farm workers.
In 2012, BFAP analysed agricultural wages in the country and its findings highlighted the
pressure felt by both farmers and farm workers (BFAP 2012). A 2015 report based on
research commissioned by the Pretoria office of the International Labour Organization,
exploring the key trends, emergent issues and structural problems in the farm worker
industry in South Africa, noted that the historically unequal power relationships had left
workers often ignorant of their rights, or afraid to demand them for for fear of losing their
jobs, and, if living on the farm, their homes (Visser & Ferrer 2015). This confirms the findings
of the Human Rights Watch Report of the general lack of awareness among farm workers of
their basic rights, including the right to adequate representation in the form of trade unions.
Salaries are typically negotiated directly between the employer and the farm worker
(81.4 percent) with labour unions negotiating for only 9 percent of permanent employees
(Visser & Ferrer 2015). WFP’s 2017 Labour Conditions Survey indicates that many workers
do not know that there was a union they could join or that they had never had contact with
a union; only about 12 percent of farm workers belong to a trade union, and that many are
disillusioned about the benefits (Devereux et al. 2017):
I was a member but the trade union people never came back after joining.
Many people left the union because they didn’t know what their rights were.
A prohibitive factor to increased trade unionisation on farms is the inability to gain access to
farms.
20The 2017 WFP Labour Conditions Survey notes that among those surveyed, 73 percent
indicated that the farmer does not allow union representatives onto the property, and 54
percent noted that the farmer does not allow workers to attend union meetings (Devereux
et al. 2017).
The BFAP report identified that the pressure felt by both farmers and workers would
potentially be “highly disruptive” to the industry and policy needed to be upgraded to
manage any resulting conflict.
Further, it argued that the agricultural system’s dependency on cheap and unskilled labour
was not sustainable, and that the future of agriculture in the country would be
characterised by fewer, but more skilled and better-paid workers. The high levels of
unemployment in the country ensure a large pool of reserve labour, enabling farmers to
disregard the rights of their workers (Human Rights Watch 2011). A case in point was the
discovery of three children of school-going age working in the vineyards of Royal
Mushrooms Farm outside of De Doorns (Knoetze 2014). The children allegedly worked for at
least 15 hours a day with no safety gear and were paid according to their age – the eldest
received R150 for a week of labour (Knoetze 2014). The matter was not fully investigated
because the parents refused to comment for fear of reprisals and the lack of evidence
presented by the whistle blowers.
The transition between these production systems is already in motion, and has many policy
implications; one thing that has become evident with the current spate of labour unrest is
that public policy is not geared to ease this transition for either the workers or the farmers.
It has taken South African society almost 20 years to recognise that poor working conditions
are a national issue. Local history, culture, gender, identity and chronic rural poverty play an
important role in determining the political economy of South Africa’s agricultural industry
(Du Toit 2005). Households living in rural poverty depend on a combination of wage
employment, subsistence agriculture, social grants and remittances from family members
working in urban areas or in mines to survive. The challenges of poverty and unemployment
are compounded by limited access to basic municipal services such as water, sanitation and
electricity, as well as a lack of good quality social services including education, health and
ambulances, and transport services in terms of roads and buses.
3.1 Farm worker revolt 2012/13
In November 2012, however, the desperation felt by farm workers about their living
conditions escalated into violent protest in the Western Cape (Visser & Ferrer 2015). The
strike began in the De Doorns area, spread to Paarl, Riebeeck West, Malmesbury,
Moorreesburg, Ceres, Prince Alfred Hamlet and Saron and then to the surrounding farming
districts. The general demand was for a living wage of R150 a day and improved living and
working conditions (Politicsweb.co.za 2012).
21You can also read