GREEN PAPER - CENTRAL EUROPEAN AGEING STRATEGY - Zentrum für Soziale Innovation
←
→
Page content transcription
If your browser does not render page correctly, please read the page content below

- GREEN PAPER -
                    CENTRAL EUROPEAN
                     AGEING STRATEGY
           Central European (CE) Knowledge Platform for an Ageing Society
       A project co-funded by the ERDF through the CENTRAL EUROPE Programme

IMPRINT

Anette Scoppetta, Jana Machačová, Petra Moser
ZSI (Centre for Social Innovation), www.zsi.at

Publisher: CE-Ageing Platform, a project implemented through the CENTRAL EUROPE
Programme co-financed by the European Regional Development Fund (ERDF)
www.ce-ageing.eu

The information and views set out in this paper are those of the authors and do not
necessarily reflect the official opinion of the European Union. Neither the European Union
institutions and bodies nor any person acting on their behalf may be held responsible for the
use which may be made of the information contained therein.

Vienna, Austria
February 2013

                                                                                            i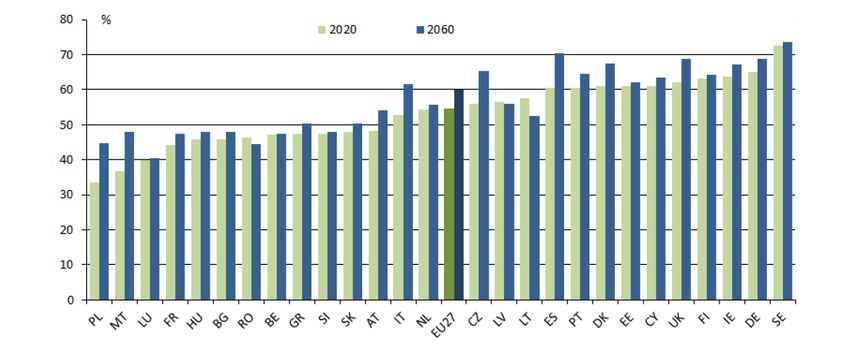
Abstract

Over the next decades Central Europe will face unprecedented demographic challenges
such as an ageing and shrinking population and ‘ageing regions’ due to demographic factors
such as greater life expectancy and decreased fertility of CE citizens, just to name some.
Enhanced migration to CE as well as within CE to more affluent regions next to changes in
family structures are likely to occur. Consequently, fast changes in social life are to be
expected. In order to minimise the negative effects on the CE economy and society,
successful and effective co-operation of public, private and civil society organizations are
required.

Based on the CE-Ageing Vision, the CE-Ageing Platform identified existing potentials,
established recommendations for policy change and now presents the CE-Ageing Strategy
as green paper to the public. The strategy covers a wide range of policy interventions aiming
at sustainable economic growth and social cohesion. The recommendations link policies
horizontally but also vertically, i.e. local and regional actions should go hand in hand with
policy changes at the national and international levels. A set of up to 200 practices are
provided out of which the regions shall choose those fitting to their particular requirements. A
‘rough’ three-folded division of CE into urban conglomerates as well as rural Eastern and
rural Western CE enables local and regional public authorities to clearly view aspects
relevant to their territory. Still, all stakeholders are in demand in supporting policy change in
order to achieve the vision.

Four major areas of concern are in focus in regard to actions to be taken by local and
regional public authorities in particular. These comprise:

   1. Employability: Undisputable, employability is the key for labour force participation and
      social inclusion. Investment in human capital is regarded as the cornerstone for
      enhancing employability.
   2. Migration: Courageous and proactive migration policies both within CE regions as
      well as to CE together with measures enhancing the integration of migrants are
      central to responding to the demographic challenges faced.
   3. Family: Modifications in the field of work and care provision due to changes in the
      family structures and household communities pose challenges to manage work-life-
      balance. These policies go hand in hand with ‘Employability’
   4. Healthy ageing: Promotion of healthy active ageing is essential for all CE regions in
      order to enable for longer, healthier and happier lives of CE citizens.

While the main target course of the Demography Report (2010) was confirmed by the CE-
Ageing Platform, the minor role given to human capital was criticised. In respect of CE
regions’ specificities, the platform remarked that particular attention need to be drawn to the
persisting regional differences within CE, partly along the lines of growing rural and urban
differences. The platform regards 1) counterbalancing inequalities, 2) the adaptation of CE
governance systems to change, 3) investments in human capital, i.e. education, training and
life-long learning, next to 4) making work-life-balance happen as key for CE’s success. The
conflict of work for pay versus work for family needs to be solved. A paradigm shift in respect
to organising and valuing work and private life is required.

It is our belief that the required policies changes should be implemented in cooperation with
stakeholders: a multi-governance matrix is needed in which various perspectives are
integrated and efforts as well as responsibilities jointly taken to build a desirable future.

                                                                                                i
Acknowledgements
The Central European Ageing Strategy has been developed by the project consortium of the
Central European Knowledge Platform for an Ageing Society, in short CE-Ageing Platform.
The strategy was written based on the work concluded by the Age-Steering Group as
decision making body responsible for overall strategy development. Particular thanks go to
all CE-Ageing Platform project partners.
Information embedded into the strategy has been collected during an online-survey with the
public, analysis of questionnaires and three workshops held together with external experts of
research and applied science as well as civil servants from public authorities at the national
levels of CE countries. We would like to express our gratitude to the following external
experts who comprehensibly contributed to the strategy’s content and provided information
during all development phases: Dr. Dragana Avramov (Population and Social Policy
Consultants), Prof. Dr. Andreas Hoff (Zittau/Görlitz University of Applied Sciences), Dr.
Dimiter Philipov (Vienna Institute of Demography), Prof. Dr. Reinhold Sackmann (Martin-
Luther-University Halle-Wittenberg) and Dr. Pieter Vanhuysse (European Centre for Social
Welfare Policy and Research, Vienna).
Results of the pilot projects, the annual conferences and the peer reviews implemented in
the frame of the CE-Ageing Platform fed into the document in hand.
We are very grateful to the comprehensive contributions received!
iiTABLE OF CONTENTS
Abstract i
Acknowledgements ii
Preface iii
Table of Content iv
List of Tables v
List of Figures v
Abbreviations vi
1. Introduction: Why a CE-Ageing Strategy? 1
2. The Context 3
2.1. Demographic change: some facts and figures in CE 3
2.2. Economic and social figures 7
2.3. Relevant country-specific strategies 11
3. The Background 14
3.1. The Guiding Principles 14
3.2. The Aims 15
3.3. The Method 15
3.4. The Partners 16
3.5. The Activities implemented within the project 17
3.6. How can local and regional actors contribute? 20
4. The Strategy 20
4.1. The CE-Ageing Vision 20
4.2. Current challenges and needs for action 22
4.3. Scenarios 2030 and 2050 23
4.4. The CE-Ageing Strategy Cube 26
4.4.1. The Challenge Matrix 28
4.4.2. The Action Matrix 30
4.4.3. The Practice Matrix 34
4.5. General policy recommendations 37
4.6. Summary 39
References and sources of information for further interest 40
Annexes 44
CE-Ageing Vision 44
Actions/Strategies implemented in the CE countries 47
CE-Ageing Platform’s regional pilots 51
Best practice examples 56
Glossary 63
iiiList of Tables
Table 1 Median Age of the total population of CE countries and EU27 average for selected years
Table 2 Percentage distribution of the population in CE countries by age groups, 2009 and 2050
Table 3 Natural change and net migration (the difference of immigrants and emigrants) for selected
years within CE countries and EU27 (in thousands)
Table 4 GNI per capita in PPP (purchasing power parity) terms for the years indicated below starting in
2000 and HDI rank of the countries in 2000 and 2011
Table 5 Total employment rate, age group 20-64
Table 6 Social protection benefits by function groups as % of total social benefits (TSB) and as % of
GDP in 2008 as well as total expenditures on social protection as % of GDP in 2005
Table 7 Public expenditure on pensions as % of GDP 2009, 2035 and 2060
Table 8 Core partners of the CE-Ageing Platform
Table 9 Strategic Partners of the CE-Ageing Platform
Table 10 The scenarios and their main characteristics
Table 11 The Challenge Matrix
Table 12 The Action Matrix
Table 13 The Practice Matrix
List of Figures
Figure 1 Schematic view of the CE-Ageing Strategy Development Process
Figure 2 Projected total population change of the projection period 2008-2060 (2008=100) for the EU
Member States, Norway and Switzerland
Figure 3 Employment rate projections by age group 55-64, EU27 (percentage)
Figure 4 Activities implemented by the platform
Figure 5 Overview on challenges and scenarios
Figure 6 The CE-Ageing Strategy Cube
Figure 7 Overview of the strategy’s key issues
ivAbbreviations
For abbreviations of countries the EU-categorisation has been followed (see
http://publications.europa.eu/code/pdf/370000en.htm).
AAI Active Ageing Index
AK OÖ Chamber of Labour Upper Austria
ASG Age-Steering group of the CE-Ageing Platform
BEM Integrative management in companies (Betriebliches Eingliederungsmanagement)
CE Central Europe
CEE Central and Eastern Europe
CEO Chief Executive Officer
EC European Commission
EQUAL Community Initiative within the European Social Fund of the European Union
ERDF European Regional Development Fund
ESF European Social Fund
ESF OP European Social Fund - Operational Programme
EU European Union
EU 2020 European 2020 Strategy
EU27 All 27 European Member States
ICT Information and communication technology
IZIP Web-based personal health record
GDP Gross domestic product
GNI Gross national income
GRUNDTVIG Adult Education Programme under the European Commission’s Lifelong Learning Programme
HDI Human Development Index
HR Human Resources
HRD Human Resource Development
LEONARDO Vocational Education and Training under the European Commission’s Lifelong Learning
Programme
NGO Non Governmental Organisation
NPO Non-profit Organisation
NRP National Reform Programme
OECD Organisation for Economic Co-operation and Development
PES Public Employment Service
PLS Pilot exchange and Policy Learning Seminar of the CE-Ageing Platform
PPP Purchasing power parity
PSC Project Steering Committee of the CE-Ageing Platform
RTC Regional Training Concepts
SME Small and Medium sized enterprises
TSB Total social benefits
SWOT Strengths, Weaknesses, Opportunities and Threats
UNECE United Nations Economic Committee for Europe
UNFPA United Nations Population Fund
WP Work package
v1. Introduction: Why a CE-Ageing Strategy?
The challenges faced in Central Europe
Over the next decades, Central Europe1 will face unprecedented demographic challenges
such as an ageing and shrinking population and ‘ageing regions’ due to demographic factors
such as greater and also healthier2 life expectancy and decreased fertility of CE-citizens, just
to name some. Enhanced migration to CE as well as within CE to more affluent regions next
to changes in family structures are likely to occur. Consequently, fast changes in social life
are to be expected across CE and beyond. The European Union has itself set five key policy
responses to manage demographic change:
1. supporting demographic renewal through better conditions for families and improved
reconciliation of working and family life;
2. boosting employment – more jobs and longer working lives of better quality;
3. raising productivity and economic performance through investing in education and
research;
4. receiving and integrating migrants into Europe; and
5. ensuring sustainable public finances to guarantee adequate pensions, health care
and long-term care.3
These targets require successful and effective co-operation of public, private and civil society
organizations at the various spatial scales. The CE-Ageing Strategy contributes to
developing and finding solutions for major challenges faced by an ageing society through
raising awareness, conducting research and implementing activities by stakeholder involved.
The strategy has been developed with and for CE regions to establish coordinated actions at
the transnational, the national, the regional and the local levels. It serves as joint strategic
guideline for regions in order to manage and adequately respond to the challenges in order
to minimize negative effects of demographic change.
Based on the CE-Ageing Vision, which reads as follows ‘In 2050 we want to live in an
integrative society in which human well-being has top priority and equity is a reality’4, the
platform identified existing potentials within CE, established recommendations for policy
change and now presents the CE-Ageing Strategy as a green paper to the public.
An answer provided: The CE-Ageing Strategy
The strategy is a core output of the Central European Knowledge Platform for an Ageing
Society, in brief CE-Ageing Platform5, a project co-funded by the CENTRAL EUROPE
Programme as well as by national co-financing contribution of the involved partner’s
countries.6 The strategy is developed in a participatory process involving a variety of actors
from the private, public and civil society organisations. The target group of the strategy
include policy makers and persons responsible for policy actions like governments,
ministries, elected governors and mayors, intermediary bodies, public employment services,
and local public authorities, next to employees, SME’s (especially HRD managers and
CEO’s), NGOs, training institutions as well as experts of various policy fields.
1
The countries included are Austria, Czech Republic, Germany, Hungary, Italy, Poland, Slovak Republic and Slovenia.
2
Healthy life expectancy at birth adds up expectation of life for different health states, adjusted for severity distribution making it
sensitive to changes over time or differences between countries in the severity distribution of health states (see definition of
WHO, http://www.who.int/healthinfo/statistics/indhale/en/)
3
See EU Policy Paper 2006, http://ec.europa.eu/social/main.jsp?catId=502&langId=en
4
See chapter 4.1. ‘The CE-Ageing Vision’
5
See http://www.ce-ageing.eu
6
The CE-Ageing Platform has been labelled as a project supporting the EU Strategy for the Danube Region (EUSDR),
especially in the Priority Area 9 ‘To Invest in People and Skills.’ The EUSDR is a macro-regional strategy developed by the
European Commission in cooperation with the Danube Region countries and key stakeholders in order to address common
challenges together. The main aim of the EUSDR is to create synergies and coordination between existing policies and
initiatives taking place across the Danube Region.
1The CE-Ageing Platform comprises 13 partners from eight CE countries (Austria, Czech
Republic, Germany, Hungary, Italy, Poland, Slovak Republic and Slovenia), representing
public and private institutions operating at the national, the regional and the local level
including several ministries, vocational training organisations, counselling and research
institutions, regional development agencies and NGOs. The partnership is build by
institutions active in the fields of regional economic development, employment, social and
educational policy.
The strategy development process covered the establishment of a joint vision for 2050,
thereby collecting and merging ideas from all CE regions (see figure 1). NGOs, universities,
companies and private persons (older workers, job-seekers) were consulted to complement
the vision via online questionnaires. With assistance of high-level experts of research and
applied science7, trends and scenarios were developed. Actions were collected by taking
different policy areas into account such as demography, economy, migration, health,
ergonomics, labour market and social policy8. Three workshops were concluded together
with civil servants to incorporate up-to-date information on policy actions taken in CE.
Figure 1: Schematic view of the CE-Ageing Strategy Development Process
CE-Ageing Strategy Development Process
Vision
Consultation process
(CE-Ageing Green paper)
Individual country
CE-Ageing
White paper
CE-Ageing
CE-Ageing
Strategy
strategies
Strategy
CE-Ageing
Strategy
Joint
implementati
on of the
CE-Ageing
Strategy*
Medium-term Scenarios Long-term Scenarios
Challenges
(2012 - 2015)
Scenarios *targeted
The strategy covers a wide range of policy interventions aiming at sustainable economic
growth and social cohesion. Regional recommendations presented in the strategy aim to not
only link policies horizontally but require coordinated changes at the transnational, the
national, the regional and the local levels. A set of up to 200 practices are provided out of
which the regions shall choose those fitting to their respective requirements. A ‘rough’ three-
folded division of CE into urban conglomerates as well as rural Eastern and Western CE
enables local and regional public authorities to view aspects relevant to their territory. The
strategy facilitates the setting-up of bundles of measures on the various spatial scales, all to
be adapted to respective territorial conditions.
The development process included the establishment of an Age-Steering Group (ASG) as
decision making body responsible for the overall strategy development. The ASG consulted
twice a year in 2011 and 2012, identified existing potentials and established
7
Three questionnaires were completed by the experts during the development process comprising current challenges, trends
and scenarios, policy actions and regional recommendations. The experts further contributed during workshops and reviewed
the key issues covered by the strategy.
8
To a limited degree also environmental issues were considered.
2recommendations. Conclusions from annual CE-Ageing conferences and peer reviews held
within the project fed into the strategy. The ASG presents the CE-Ageing Strategy as a green
paper to the public in order to consult it with a broad audience. Face-to-face consultations
will be held during the first half of 2013 and online-consultation offered in order to, finally,
integrate consultation results into the strategy and publish a white paper by the end of 2013.
2. The Context
This chapter provides an overview on the current demographic situation and demographic
trends for upcoming decades in the CE countries.
2.1. Demographic change: facts and figures in CE9
Ageing societies is one of the grand societal challenges faced in the 21st century. Most CE
countries are currently facing declining or stagnating fertility. Besides, an increase of life
expectancy is recorded in the western CE countries. These phenomena are the main source
for the ageing population. In addition, migration has an important impact on the age structure
of the population and influences demography. Based on prognoses of Eurostat the majority
of the CE countries will have a smaller population by 2060 compared to 2008 as figure 2
illustrates. With the exception of Austria10 all CE countries will face population decline.
Figure 2: Projected total population change of the projection period 2008-2060 (2008=100) for the EU Member
States, Norway and Switzerland
11
Source: Eurostat, EUROPOP2008 convergence scenario
Next to the population decrease CE’s population will become the oldest in Europe. By 2060,
the median age of the population in the CE countries will be above the EU27 average of
47.2 years as shown in table 1. Decreased fertility and increased life expectancy will be the
main cause for the rising median age of the population in EU27 by 2060. Some countries like
Poland and the Slovak Republic will face a dramatically rise. Especially the post-communist
countries in CE are currently facing an even tremendously faster demographic change
9
In this chapter data from the eight involved CE-Ageing Platform countries is presented. Although only some parts of Italy and
Germany belong to the CE regions, data of the whole country is indicated.
10
Austria’s population will increase around 9%.
11
The current scenario was primarily used in the context of the European Commission’s analysis of the impact of ageing
populations on public spending in 2008 describing the population projections until 2060.
3compared to Western European countries12 with implications in various policy areas.13 Hoff
(2011) argues that ‘(the) course and impact of population ageing in Central Europe and
Eastern Europe (CEE) will be more severe due to lack of comprehensive social security,
health care/long-term care systems, social services and significant private savings’.14 The
post-communist countries are still coping with social and economic impacts of the transitions
which are influencing population ageing.15
Table 1: Median Age of the total population of CE countries and EU27 average for selected years
Median Age
2010 2030 2060
Austria 41.7 45.5 47.7
Czech Republic 39.4 45.8 48.1
Germany 44.2 48.8 50.8
Hungary 39.8 45.7 50.5
Italy 43.1 48.4 50.2
Poland 37.7 45.3 51.2
Slovak Republic 36.9 45.1 50.7
Slovenia 41.4 47.0 48.7
EU27 39.8 44.4 47.2
Source: Own illustration based on Eurostat,
EUROPOP2010
By taking a closer look at the development of the age groups the substantial demographic
change is even more obvious (see table 2 below). The percentage share of the age group
60+ will range between 33% (Hungary) and 39.5% (Germany) by 2050 whilst other age
groups (0-14 years and 15-59 years) will decrease in the majority of CE countries until 2050.
Table 2: Percentage distribution of the population in CE countries by age groups, 2009 and 2050
2009 2050
0-14 15-59 60+ 0-14 15-59 60+
Austria 14.9 62.2 22.9 14.0 50.2 35.8
Czech Republic 14.1 64.2 21.8 15.4 50.1 34.5
Germany 13.5 60.8 25.7 12.6 47.9 39.5
Hungary 14.8 63.0 22.1 14.8 52.2 33.0
Italy 14.2 59.5 26.4 13.5 47.4 39.1
Poland 15.0 66.2 18.8 12.7 49.2 38.0
Slovak Republic 15.4 67.4 17.3 13.4 50.4 36.2
Slovenia 13.8 64.3 21.9 14.3 48.7 37.0
Source: Own illustration based on data from ‘United Nations: World Population Prospects. The 2008 Revision’
12
In 2030, almost the half of the population in Western Europe will be aged 50+. While the ageing population in Western Europe
set in on an earlier stage back in the 1990s, the CE countries were affected on a later stage.
13
See Hoff, 2011
14
Ibid, p.4
15
See Hoff, 2008
4Low fertility and high life expectancy16 influences labour force participation17. The latter will
decrease because of a shrinking number of young people and a growing number of elderly.
According to Muenz (2007) the size of the working age population (15-64 years) will decline
after 2015 in the CE countries by minus 18% until the year 2050 compared to 2005.18 Some
CE countries are again hit stronger: In Poland, the labour force will tremendously decrease
(by 27.3%) until 2050. Germany (minus 25.1%) and Slovak Republic (minus 24.5%) will be
characterised by a similar development. The Italian labour force will increase until 2025 and
then start to decrease continuously until 2050. In Hungary, the labour force will only start to
decrease after 2020. All other CE countries will face a decline before or after 2015.19
The employment rate of the particular age group of 55+ has, however, increased over the
last decade (2000 – 2010) in EU27 but with differences between the countries: Whilst the
highest employment rate within the age group 55-59 was observed in Sweden (80.7%) and
Denmark (75.9%) in 2010, the lowest rate was recorded in Poland (45.8%), Slovenia (46.9%)
and Malta (49.3%).20 According to projected employment rates, the target of the European
Employment Strategy of at least 50% employment rate amongst people 55-64 will be
reached by 2060 in most CE countries, as shown in figure 3. Poland (~ 44%), Hungary
(~48%) and Slovenia (~48%), however, will not achieve the goal until 2060.
Figure 3: Employment rate projections by age group 55-64, EU27 (percentage)
Source: European Commission and Committee of the Regions: Active Ageing: local and regional solutions. 2011
Since demographic changes are caused by three main factors, namely fertility, life
expectancy and migration, balancing population decrease with migration is likely to occur.
Migration influences the age structure of populations since the age structure of immigrants
differs from the one of the host society. The average age of immigrants is far below the
average age of the host society: ‘While the median age of the total population of all EU
Member States was 40.6 on 31 December 2008, the median age of immigrants in 2008 was
28.4.’21 Still, positive net migration will not compensate the natural changes (birth and death
rate ratio)22 in CE and in EU27 sufficiently as shown in table 323. As a consequence of the
16
Life expectancy will rise above the EU27 level in almost all CE countries. Only in Austria, Italy and Germany the life
expectancy of male as well as female is below the EU27 projection according to data provided by Dr. Dimiter Philipov based on
Eurostat 2008.
17
Labour force refers to working-age persons in an economy who are i) employed and ii) unemployed but looking for a job.
Typically people between the ages of 16-64 are defined as this certain group. People in those age group who are not counted
as participating in the labour force are typically students, homemakers, and persons under the age of 64 who are retired.
18
See Muenz, 2007
19
For more details about the development of labour force please consult ‘The 2012 Ageing Report: Economic and budgetary
projections for the 27 EU Member States (2010-2060)” (page 308) at
http://ec.europa.eu/economy_finance/publications/european_economy/2012/pdf/ee-2012-2_en.pdf
20
See Eurostat, 2012b
21
European Union, 2011b, p.20
22
According to EUROPOP2008 convergence scenario it will start from 2015 the number of annual births will drop below the
number of deaths in EU27
23
With the exception of Austria and Germany where Net Migration will compensate to a high extent
5natural change and the net migration (which will also decrease in many CE countries) the
total population in EU27 will start decreasing from 2035 onwards.24
Table 3: Natural change and net migration (the difference of immigrants and emigrants) for selected years within
CE countries and EU27 (in thousands)
Natural growth Net migration
(births minus deaths) (incl. corrections)
2009 2030 2050 2009 2030 2050
Austria -1.0 -11.0 -30.6 21.1 31.2 24.7
Czech Republic 10.9 -47.0 -53.3 28.3 22.9 21.9
Germany -189.4 -365.8 -508.5 -10.7 187.1 135.7
Hungary -34.0 -47.5 -49.1 17.3 17.3 17.9
Italy -22.8 -215.8 -337.6 318.1 248.7 193.4
Poland 32.6 -153.3 -225.7 -1.2 -1.3 26.4
Slovak Republic 8.3 -21.9 -34.3 4.4 3.9 6.1
Slovenia 3.1 -9.1 -12.3 11.5 3.4 3.0
EU27 523.1 -846.1 -1,695.6 877.1 1,093.1 924.3
Source: Own table based on data of the Demography Report 2010, Eurostat
The Active Ageing Index (AAI) is a newly developed tool in order to measure and promote
active ageing potentials of the 27 EU countries.25 The countries’ implementation of active
ageing is evaluated in four domains: employment of older workers, social activity and
participation of older people, independent and autonomous living of older persons, and an
environment that enables active ageing. The CE countries are ranked as follows26: Germany
ranks 8, Austria 10, Czech Republic 12, Italy 16, Slovenia 19, Hungary 23, Slovakia 24 and
Poland ranks 25. Poland, Slovakia and Hungary thus require greater policy efforts to promote
active and healthy ageing.27 While Germany shows higher outcome in terms of employment
rate for the 60-64 age group which reflects the better work incentives in pension systems
towards extending working life, Poland has greatest potentials for improvements in the
employment domain: Poland fares comparatively worse in all four domains but mainly the
low employment rate of older workers 55-64 affects adversely the ranking of this country. In
addition, a high correlation of the values of the AAI with per capita GDP has been
determined: countries with relatively high living standards and wealth perform better in active
ageing.
To sum up, all CE countries will face population ageing to a greater extent than the EU27
average. Population will decline in all CE countries with the exception of Austria by 2060.
Consequently, CE countries will be affected by labour force shrinkage during the upcoming
decades which will bring diverse economic and social challenges in terms of employment,
public expenditure on social protection, pensions, just to name some.
24
See Giannakouris, 2008
25
The AAI has been developed by the European Centre for Social Welfare Policy and Research in collaboration with the United
Nations Economic Committee for Europe (UNECE) and the European Commission’s DG Employment, Social Affairs and
Inclusion.
26
The value can be interpreted as the gap between the achievement of the full active ageing potential and the current situation
in a given country. The higher the value the better the active ageing outcome: Germany has a value of 34 (out of 100), Austria
has 33, Czech Republic 33, Italy 32, Slovenia 30, Hungary 28, Slovakia 27 and Poland 27.
27
European Centre for Social Welfare Policy and Research, 2012
62.2. Economic and social figures
The chapter provides an overview on economic and additional social figures in the CE
countries.
The economic situation in CE is characterised by diversity. The economic crisis, starting in
2008, has manifested in different ways and with various impacts. CE countries mostly
experienced rapid economic growth (measured in terms of GDP) before the crises and even
in 2008 the CE regions were ‘remarkably resilient to the global economic and financial crisis.
This is partly due to the fact that the region had no or only negligible exposures to subprime
or subprime-related assets. However, part of this resilience can also be explained with
standard vulnerability indicators, which at the onset of the crisis indicated in several
dimensions a stronger position of the region compared with previous crises.’28 Still, there are
differences between CE regions observable. While the highest levels of GDP are recorded in
touristic regions (e.g. Tyrol) and the national capitals of Germany, Italy and Austria, the
lowest GDP levels are registered in Poland and Hungary. Inequalities primarily exist between
rural and urban areas. ‘A good example of this is Mazowieckie Region in Poland.
Mazowieckie has the highest GDP in the country, owing largely to the fact that it includes
Poland’s capital, Warsaw; however, the same region includes municipalities that are
classified as some of the poorest in Poland.’ 29
Today, most CE countries have already recovered from the economic decrease when
viewing the gross national income (GNI). The GNI, which is the GDP added up with net
income from abroad, provides information about economic capacity of countries. In
Germany, Austria, Slovak Republic and Poland the GNI slightly increased between 2009 and
2011. In Hungary, the GNI in 2011 was equal to the one in 2008. Only in Slovenia, in Czech
Republic and in Italy the index value is still slightly below. Poland’s index did not decrease
after the year of crisis in 2008 and has been continuously growing since 2000. Given that the
GNI is not providing a comprehensive picture with respect of wealth development of the
countries, the Human Development Index (HDI) ranking is indicated in the table 4 in
addition to the GNI (HDI is used by the United Nations providing information about the
human development in a social and economic context; HDI ranks of 187 countries; rank 1 =
highest human development, rank 187 = lowest human development).
Table 4: GNI per capita in PPP (purchasing power parity) terms for the years indicated below starting in 2000 and
30
HDI rank of the countries in 2000 and 2011
HDI HDI Country 2000 2005 2006 2007 2008 2009 2011
Rank Rank
31
2000 2011
14 9 Germany 30,262 31,740 33,133 33,954 34,294 32,709 34,854
16 19 Austria 31,163 33,050 33,996 35,145 35,694 34,310 35,719
29 21 Slovenia 19,726 23,300 24,490 25,780 26,570 24,195 24,914
19 24 Italy 27,510 28,060 28,505 28,591 27,736 26,120 26,484
34 27 Czech Republic 16,499 19,450 20,598 21,264 21,570 20,682 21,405
40 35 Slovakia 12,496 15,500 16,865 18,541 19,894 18,558 19,998
43 38 Hungary 13,017 16,060 16,652 16,610 16,581 15,886 16,581
44 39 Poland 11,694 13,480 14,243 15,061 16,010 16,172 17,451
Source: United Nations Development Programme (2011): Human Development Report 2011. Calculations based on data from
World Bank (2011), IMF (2011) and UNSD (2011). Data of 2001, 2002, 2003, 2004 and 2010 not available,
http://hdrstats.undp.org/en/indicators/100106.html
28
Gardó and Martin, 2010, p.5
29
ÖIR - Österreichisches Institut für Raumplanung, 2012, p. 40
30
Data of 2001, 2002, 2003, 2004 and 2010 not available
31
See HDI Ranking 2000. In: United Nations Development Programme, 2002
7The Gini coefficient represents an index for equality/inequality, i.e. is a ‘measure of the
deviation of the distribution of income (or consumption) among individuals or households
within a country from a perfectly equal distribution.’32 A value of 0 represents absolute
equality, a value of 100 absolute inequalities. Out of the CE countries, Italy has the highest
Gini coefficient (36.0), where more income is being taken in by a small group of population.
Germany records the lowest coefficient (28.3) indicating that income is distributed rather
equal. 33
According to the EU 2020 target, 75% of EU27 population should be employed. Due to the
crisis most CE countries recorded stagnating or decreasing employment rates in 2008 but
recovery was recorded starting in 2010 with the exception of Slovenia (see table 5). As data
from Eurostat (2012c) further shows, the current employment rate of the age group 20-64 in
CE countries was mostly below the EU27 average of 68.6% in the year 2011. Only in Austria,
Czech Republic and Germany the employment rate was above the EU27 average in 2011.
However, the regional disparities in terms of employment rate between CE countries are
high. In Eastern regions and Italy the rate is below or around 65% while the rates in Western
CE regions (Eastern Germany, Austria and Czech Republic) are higher.34
Table 5: Total employment rate, age group 20-64
Employment 2005 2006 2007 2008 2009 2010 2011 EU 2020
rate target
EU27 68 69 69.9 70.3 69 68.6 68.6 75
Austria 71.7 73.2 74.4 75.1 74.7 74.9 75.2 77
Czech 70.7 71.2 72.0 72.4 70.9 70.4 70.9 75
Republic
Germany 69.4 71.1 72.9 74.0 74.2 74.9 76.3 77
Hungary 62.2 62.6 62.6 61.9 60.5 60.4 60.7 75
Italy 61.6 62.5 62.8 63.0 61.7 61.1 61.2 67
Poland 58.3 60.1 62.7 65.0 64.9 64.6 64.8 71
Slovak 64.5 66.0 67.2 68.8 66.4 64.6 65.1 72
Republic
Slovenia 71.1 71.5 72.4 73.0 71.9 70.3 68.4 75
Source: Eurostat (2012c)
http://epp.eurostat.ec.europa.eu/tgm/table.do?tab=table&init=1&plugin=0&language=en&pcode=t2020_10&tableSelection=1
Changes in demographic structure are regarded as the key driver for changes in public social
spending. Countries with a high proportion of older persons more likely have higher public
social spending than countries with a ‘younger’ population even though the latter have higher
costs with regard to education.35 Table 6 informs on the total expenditure on social
protection benefits (TSB) in CE countries and EU27 as percentage of GDP.36 Social
protection expenditures are defined as the outlay for all social protection interventions and
contributions in the respective country. Those expenditures comprise i) social benefits to
households or individuals to support them of burden of a set of risks, ii) administration costs
of managing the social protection system, iii) other miscellaneous expenditures of the social
32
See United Nations Development Programme (2011): Human Development Report 2011 – Human Development Statistical
Tables. http://hdr.undp.org/en/media/HDR_2011_Statistical_Tables.xls. Download date: 03.01.2013.
33
See United Nations Development Programme (2011): Human Development Report 2011 – Human Development Statistical
Tables. Data to be downloaded on http://hdr.undp.org/en/media/HDR_2011_Statistical_Tables.xls (Gini Coefficient is available
in spreadsheet 3 of the table
34
See ESPON Factsheet – Central Europe, November 2012
35
See OECD, 2012
www.oecd.org/els/socialpoliciesanddata/OECD%282012%29_Social%20spending%20after%20the%20crisis_8pages.pdf
36
See Golinowska et al., 2009
8protection system.37 The total expenditure on social protection in CE countries was below the
EU27 average level of 27.2% of GDP in 2005 in all other countries with the exception of
Austria and Germany. The largest single component of social protection expenditures is the
social protection benefits, totalling 96%.38 Those are structured the following way: old age,
sickness/health care, family/children, disability, survivors, unemployment and housing and
social exclusion. In 2008 the expenditures on benefits for the old age and survivors group
(45.4% of TSB) and sickness/health care group (29.7% of TSB) were dominant in the EU27
The proportions of expenditures differ from country to country: in Italy and Poland, for
instance, around 60% of the TSB are expenditures on old-age and survivors’ benefits with
expenditures on family/children amounting to only half of the average of EU27. CE countries
also differ in respect to expenditure on housing and social exclusion compared to the EU27
proportions. While within the EU27 3.4% of TSB was allocated to housing and social
exclusion, CE countries spend considerably less (with the exception of Hungary which
spends 3.8% of TSB on housing and social exclusion.
Table 6: Social protection benefits by function groups as % of total social benefits (TSB) and as % of GDP in 2008
as well as total expenditure on social protection as % of GDP in 2005
Old-age & Sickness/ Disability Family/ Unemployment Housing & TOTAL
survivors health care children social ex- Expenditu
clusion re on
social
protection
(2005)39
% of % of % of % of % of % of % of % of % of % of % of % of % of GDP
TSB GDP TSB GDP TSB GDP TSB GDP TSB GDP TSB GDP
EU27 45.4 11.5 29.7 7.5 8.1 2.0 8.3 2.1 5.2 1.3 3.4 0.9 27.2
Austria 49.2 13.4 26.1 7.1 7.8 2.1 10.3 2.8 5.0 1.4 1.6 0.4 28.8
Czech 45.8 8.3 33.3 6.0 8.2 1.5 8.0 1.5 3.5 0.6 1.2 0.2 19.1
Republic
Germany 43.0 11.5 30.5 8.1 7.8 2.1 10.6 2.8 5.4 1.4 2.8 0.7 29.4
Hungary 45.4 10.1 25.0 5.6 9.4 2.1 12.7 2.8 3.7 0.8 3.8 0.9 21.9
Italy 60.7 16.1 26.4 7.0 5.9 1.6 4.7 1.3 1.9 0.5 0.3 0.1 26.4
Poland 59.6 10.9 24.4 4.4 8.8 1.6 4.0 0.7 1.9 0.4 1.2 0.2 19.6
Slovak 42.5 6.6 32.5 5.0 9.0 1.4 9.5 1.5 4.0 0.6 2.4 0.4 16.9
Republic
Slovenia 45.8 9.6 33.8 7.1 7.8 1.6 8.5 1.8 2.0 0.4 2.1 0.4 23.4
Source: Puglia (2011). In: Eurostat Statistics in Focus, 17/2011
CE countries differ also in regard to expenditure for ‘care for the elderly’: Social protection
expenditure billed to old age care, which includes expenditure to cover care allowances,
accommodation and assistance in carrying out daily tasks, amounts to 0.41% of GDP in the
EU27 in 2008 With the exception of Austria (1%) and the Czech Republic (0.54%) all CE
countries spend less than the EU27 average within this category (Slovak Republic: 0.36%,
Hungary: 0.32%, Poland: 0.22%, Germany and Slovenia: 0.15% and Italy: 0.14% of GDP).40
In the years 2001 and 2008, social protection expenditures grew continuously in EU27 until
2003. Whilst from 2003 to 2005 the public social spending was stabile, a slight decrease
followed in 2006 and 2007 (from 27.1% of GDP to 26.7% in 2006 and to 25.7% in 2007). In
the 2008, the percentage of expenditure increased again to 26.4% of GDP. In CE, however,
a different picture comes forth: while in Italy expenditure constantly grew between 2001 and
2008, in Slovenia and Slovak Republic the figures mainly decreased within the same
period.41
37
See Eurostat Glossary
http://epp.eurostat.ec.europa.eu/statistics_explained/index.php/Glossary:Social_protection_expenditure
38
See Puglia, 2011, In: Eurostat Statistics in Focus, 17/2011
39
Data of Eurostat collected in 2008. In: Golinowska et al., 2009
40
See Eurostat, 2012a
41
See Puglia, 2011
9As the table 6 shows expenditure on old-age and survivors, which includes pension
expenditures, represent the greatest proportion of TSB. Demographic change will bring
challenges for public funds of pension but before taking a closer look on expenditure on
pensions, total public expenditure on education will be pointed out as an important
indicator of public social spending. Again, CE countries differ: According to the Eurostat
demography report (2011) total public expenditure on education in EU27 amounted to 5% of
the GDP in 2009. Austria’s expenditures were the highest in the CE countries and above the
EU27 average (5.4%). Slovenia and Hungary spend 5.2% of GDP on education. Total public
expenditure on education was below the EU27 in the other CE countries (Czech Republic:
4.2%, Germany: 4.5%, Italy: 4.3%, Poland: 4.9%. Slovakia: 3.6%). Expenditure on education
in the Slovak Republic was the lowest in the CE countries and also one of the lowest in
EU27.42
Public pension arrangements are very diverse in the CE countries ‘due to both different
traditions on how to provide retirement income, and Member States being in different phases
of the reform process of pension systems.’ 43 However, the pension systems in CE countries
do not differ from the most common ones in the EU: in most CE countries (AT, CZ, HU and
SI) a defined benefit system is applied. Germany and the Slovak Republic are implementing
the pension point system and Italy and Poland apply the notional defined contribution
system.44 Due to population ageing increasing pension expenditure could be expected (on
the long run) in all CE countries but as projections show the expenditure will decrease in four
of the eight CE countries, namely in Austria, Germany, Italy and Poland (see table 7). Poland
shows the highest deviation in public expenditures compared to other CE countries. Public
spending on pensions will reach only 8.8% in 2060 according to the projections of the
demography report published by Eurostat.45
Table 7: Public expenditure on pensions as % of GDP 2009, 2035 and 2060
Member state 2009 2035 2060
EU27 13.5 11.9 12.6
Austria 15.5 13.9 13.6
Czech Republic 9.8 7.5 11.0
Germany 13.5 11.9 12.8
Hungary 12.2 11.4 13.8
Italy 17.7 15.2 13.6
Poland 12.5 9.3 8.8
Slovak Republic 8.0 7.8 10.2
Slovenia 11.3 14.7 18.6
Source: Own table based on data of the European Union (2011a): Demography Report 2010
In the other CE countries (Czech Republic, Hungary, Slovak Republic and Slovenia)
expenditure will increase until 2060 but not continuously. In Czech Republic, Hungary and
Slovak Republic expenditure will first decrease until 2035 and then continue to increase until
2060. In contrast, the prognosis show that in Slovenia, for instance, pension expenditure will
continuously increase from 11.3% in 2009 up to 18.6% in 2060. In EU27 an overall reduction
of public spending on pensions is envisaged according to the Demography Report (2010).
Greater reliance on private contribution systems, increasing retirement age and less
generous indexation will impact public spending on pensions.
42
See European Union, 2011a
43
European Union, 2012, p. 87
44
According to an OECD publication (Whitehouse, 2010, p.8) the defined benefit system is a constant accrual rate for each year
of service paid and it is based on average re-valued earnings during lifetime. The pension point system calculates pension
points by dividing earnings by the cost of the pension points. The notional defined contribution multiplies the inflow each year by
the contribution rate and the notional capital is increased each year. At retirement, the accumulated notional capital is divided by
a notional annuity factor.
45
See European Union, 2011a
1046
Envisaged retirement age in CE countries :
Austria: 65 years for men and women (who were born after 2nd June 1968)
Czech Republic: 65 years for men and 62-65 years for women depending on the number of
47
children
Germany: 67 years for men and women (by 2029)
Hungary: 65 years for men and women
Italy: 67 years for men and women
Poland: 67 years for men and women
Slovak Republic: 62 years for men and women
Slovenia: 63 years for men and 61 years for women
Since new legislations (pension policy reforms in the CE countries) will start having an
impact only from approximately 2030 onwards, all CE countries would be expected to have
higher expenditure on pensions during the next 20 years but according to the prospects in
the Demography Report public expenditure in all CE countries will decrease between 2009
and 2035. A reason for that might be the increase of and private schemes in total pension
provision. ‘Participation in second- and third pillar schemes has been encouraged or even
made mandatory to decrease the financial burden of ageing populations in public pension
schemes. However, the major part of pension income is still accrued in the latter schemes,
as privately managed pension schemes are rather young and their contribution to pensions
in payment rather low.’48 Besides the different pillar schemes which have an impact on the
public expenditures on pensions, CE countries focussed on reducing the benefit ratios of
pensions. The reduction often refer to recently modified ‘pension indexation rules from full
wage indexation to partial wage indexation (using the weighted average of prices and wages,
known as the Swiss formula and its variations) or, even further, to price indexation.’ 49
To sum up, CE countries’ economic situation has recovered since the crisis started in 2008.
Poland, for instance, didn’t record a decrease in economic terms at all when viewing the GNI.
The labour market also recovered from the crises. In all CE countries, except in Slovenia,
employment rates started to increase from 2010 onwards. Still, the share of older workers on
the labour market is too low in order to meet the EU 2020 goals. In terms of social
expenditure and its forecasted development CE countries mostly lag behind the EU27
average. Investments in health care, child care services, education, etc. contribute to
economic growth. An increase of the participation of older workers requires sustainable
investments on social services. Without such investments the impact of demographic change
could be more intense in CE countries. Adjusting the governance systems to challenges is
certainly crucial. Services need to be adapted and structures provided for elderly to keep
them in the labour force as long as possible and as healthy as possible.
2.3. Relevant country-specific strategies50
Recalling the EU 2020 goals in respect to 75% of employment rate of the age group 20-64,
the EU countries were advised to develop national strategies on ageing.51 Without active
ageing strategies and policies fostering solidarity and intergenerational justice, the objectives
of EU 2020 will hardly be achieved. Reaching the goal of 75 % employment rate requires a
‘greater involvement of women, older workers and the better integration of migrants in the
work force.’ 52 Furthermore, sustainable economic growth requires the provision of supporting
46
See Hirose, 2011 and ‘Country fiches” on CE-Ageing Platform: www.ce-
ageing.eu/index.php?option=com_content&view=article&id=12&Itemid=119
47
OECD, 2011, p. 212
48
European Union, 2012, p. 107
49
Hirose, 2011, p. 15
50
See short summary on each CE country in the ANNEX
51
See European Commission, 2010: Europe 2020 Strategy http://eur-
lex.europa.eu/LexUriServ/LexUriServ.do?uri=COM:2010:2020:FIN:EN:PDF
52
ibid p.10
11structures and services for elderly in order to enable for active ageing and societal
participation. Smart growth as one of the main targets of the EU 2020 strategy as well as
sustainable and inclusive growth includes new and flexible working structures maintaining
people longer in working processes.53
Before giving an overview on several active ageing policies and strategies in CE countries
we take a look at the push and pull factors influencing the employment rate of elderly.
Participation rate in continuous education and training, part time models for older workers
and employability, etc. are pull factors contributing to maintain older workers/employees in
the labour market as long as possible. Therefore, pull factors are defined as important factors
to prevent high rates of early retirement or low effective retirement age. In contrast, push
factors support or facilitate an early withdraw from the labour market. Such factors are
relative wage costs (seniority wages), incentives for early retirement, high labour costs
related to younger employees or missing/insufficient qualifications, etc.54 In the following,
several examples of policies on active ageing in CE countries mainly targeting on increasing
the employment rate of elderly will be illustrated.
By viewing national active ageing policies amongst CE countries certain differences are
observable. While all National Reform Programmes (NRP) refer to topics like ageing, labour
force participation of older people, and lifelong learning at least to a certain extent, only few
country-specific strategies and programmes on (active) ageing have been developed. The
Czech Republic introduced a National Programme of Preparation for Ageing for 2008 – 2012
which sets actions to increase the quality of life of older people.55 The German government
recently introduced a new strategy on demography called ‘Every year counts’ (‘Jedes Alter
zählt’).56 The strategy is managed by federal government in cooperation with provinces,
municipalities, social partners and other stakeholders. A cross-policy approach is followed by
linking economy to public administration and social systems. In Hungary, a similar approach
combining health care, educational, employment and economic dimensions has been
implemented. The Hungarian National Ageing Strategy has been introduced with an action
plan 2010-2012 on ageing policies in 2009. Several bottom-up initiatives are implemented
within the frame of the strategy. The most successful ones will be integrated into the
Hungarian national policy documents57. In Poland, the government adapted a programme
called ‘Solidarity of generations 50+’ in 2008 (‘Solidarność Pokoleń. Działania na rzecz
aktywizacji zawodowej osób w wieku 50+’) with considerably results achieved so far (e.g. the
average age of retirement was increased from 57 to 59 within two years; the employment
rate of people between 55 and 64 increased from 31.6% in 2008 to 34% in 2011).58
In Austria and Italy no specific topic-related strategies were developed but several measures
were implemented in respect to active ageing. The Austrian Operational Programme for
Employment 2007-2013 (ESF OP), for instance, focuses on maintaining and fostering the
employability of older workers. In 2011, the Austrian social partners established a working
group in order to link together strategically and operationally for working condition
improvements in terms of sustainable and continuing working life.59 In Italy, ageing is
focussed within the labour market reform implemented in July 2012. Specific measures for
reintegrating 50+ workers into jobs are implemented and income support provided. The
reform also enables for giving incentives for enterprises when hiring long-term unemployed
aged 50+. A longer duration for job protection measures is envisaged and unemployment
benefits for people over 50 years old provided from the year 2016 onwards.60
53
AGE Platform Europe, Committee of the Regions and European Commission, 2011, p. 8
54
See Scoppetta et.al, 2007
55
See ‘Country fiches” on CE-Ageing Platform: www.ce-
ageing.eu/index.php?option=com_content&view=article&id=12&Itemid=119
56
See ibid
57
See ibid
58
See ibid
59
See ibid
60
See ibid
12In the Slovak Republic and Slovenia, national programmes are currently under preparation.
In the Slovak Republic, a comprehensive strategy for active ageing is expected to be
finalised in the end of 2012/beginning of 2013. Next to that, other national strategies and
measures focussing on population ageing were developed. Back in 1999, the National
Programme for Protection of Elderly People was approved which focused on social and
health issues such as care and support services for elderly in order to increase social
participation. In Slovenia, ageing is an important aspect within the National Reform
Programme 201261. The pensions system was planned to be reformed but has been rejected
at a referendum (the draft included flexible working hours for older workers and gradual
withdrawal from the labour market). Nevertheless, a new strategy called ‘Ageing, Solidarity
and Good Intergenerational Relations’ is currently under preparation and expected to be
adopted in the end of 2012/beginning of 2013.62
To achieve the EU 2020 goal of an employment rate of 75% of the age group 20-64 and the
targets set within the National Reform Programmes63 most CE countries have already
reformed (or are currently reforming) their pension system which also includes the increase
in retirement ages. Germany already declared to rise the retirement age up to 67 years for
women and men in the year 2029. Italy will gradually increase the retirement age to 66 years
by 2018 and will introduce the same statutory retirement age of women and men.64 A similar
reform was set up in Poland. In June 2012, the Polish president signed a law for extending
the age for retirement to 67 years equally for women and men in order to counteract social
and economic challenges.65 In the frame of the Slovakian National Reform Programme
(NRP) measures were set in order to support employment of older people and increase
justice in pensions. The early old-age pension system has been improved and implemented
in January 2011 in order to motivate older workers to stay as long as possible in the labour
market.66 Only people without income or compulsory pension insurance can apply for the
early old-age pension. Retirement age is also an important part of the Slovenian NRP 2012.
As described above, CE countries’ policies and strategies on demographic change are
similar in the objectives but show some differences in implementation. It will be crucial not
only applying national solutions but also involving regional actors to reach the EU 2020
goals. National structures should support local and regional actors in active ageing which can
be an added-value to policy development.67 Moreover, the European Commission highlighted
recommendations to be implemented by the Member States coping with the impact of the
economic crises. Maximising employment years and minimising voluntary career breaks will
be necessary for ensuring future pensions and long-term sustainability of pensions systems
in the EU27. To increase the employment rate (also of elderly) the Member States are
advised to adapt labour market also to contribute to the sustainability of social protection
system and making work attractive.68 Those recommendations will be essential also for the
CE countries and should be considered when implementing their National Reform
Programmes.
61
See European Commission (online): National Reform Programme: Slovenia
http://ec.europa.eu/europe2020/pdf/nrp/nrp_slovenia_en.pdf
62
See ‘Country fiches” on CE-Ageing Platform: www.ce-
ageing.eu/index.php?option=com_content&view=article&id=12&Itemid=119
63
Czech Republic and Germany show the most ambitious target amongst the CE countries for increasing the employment rate
of the age group 55-64 by 2020: 55% (CZ) and 65% (DE)
64
See European Commission (online): National Reform Programme: Italy
http://ec.europa.eu/europe2020/pdf/nrp/nrp_italy_en.pdf
65
See ‘Country fiches” on CE-Ageing Platform http://www.ce-
ageing.eu/index.php?option=com_content&view=article&id=12&Itemid=119
66
See European Commission (online): National Reform Programme: Slovakia
http://ec.europa.eu/europe2020/pdf/nrp/nrp_slovakia_en.pdf
67
See more in chapter 3.6 ‘How can local and regional actors contribute?’
68
See Council of European Union, 2011
133. The Background
3.1. The Guiding Principles
The strategy grounds on the WHO understanding of active ageing: ‘Active ageing is the
process of optimizing opportunities for health, participation and security in order to enhance
quality of life as people age’.69 The word ‘active’ refers to continuing participation in social,
economic, cultural, spiritual and civic affairs, not just the ability to be physically active or to
participate in the labour force. When talking about ageing, it is essential to distinguish
between population or demographic ageing as the process whereby older individuals
become a proportionately larger share of the total population and individual ageing, the
process of individuals growing older. Similar to the UNFPA report (2012), the strategy’s main
focus is on population ageing but refers to individual ageing in terms of health and well-being
and experiences of later life.70
Intergenerational solidarity and social inclusion are the main overall aims for actions
promoted by the strategy and regarded as underlining approach. The strategy also builds on
the Vienna International Plan of Action on Aging (UN 1982) which states in its preamble that
‘the fundamental and inalienable rights enshrined in the Universal Declaration of Human
Rights apply fully and undiminishedly to the aging’.71 Accordingly, many policy areas as well
as all age groups are to be targeted when promoting activities in the field of active ageing.
Because of European’s demography and the need for change in various policy areas, the
Council of the European Union recently adopted the Guiding Principles for Active Ageing and
Solidarity between Generations. These principles serve as basis for the strategy in hand and
as checklist for national authorities and other stakeholders on what needs to be done to
promote active ageing beyond the European Year 2012. The principles encompass the areas
of employment, participation in society and independent living.72
The CE-Ageing Strategy is subject to the following main guiding principles:
Life-cycle approach:
Following the practice used by European institutions,73 the strategy applies the life-cycle
approach: all ages are in the focus since, first of all, ‘old’ is not a question of specific ages, in
particular in respect to the labour market. Second, active ageing starts whenever life starts.
Given that also different meanings are apparent within societies, no definition of ‘old’ is used,
i.e. recommended activities target all ages. No specific age limits are applied also when
tailor-made measures are in the focus (e.g. ‘older’ workers).
Linking policy fields, stakeholders and territories
It is our belief that the demographic challenges faced cannot be solved by single working
institutions on their own. Stakeholders need to be linked horizontally as well as vertically
(i.e. local and regional actions must go hand in hand with policy changes at the national and
international geographical scales). Multi-level governance is a must in order to tackle the
problems. Migration flows, for instance, are evident across CE with effects on all territories,
immigration and emigration regions. The challenges faced ask for cross-cutting policy
69
See www.who.int/ageing/active_ageing/en/index.html, The United Nations (UN) have been active in the field of ageing since
many years. The Second World Assembly on Ageing, held in Madrid, Spain in 2002, for instance, produced a bold, rights-based
and policy-relevant Political Declaration and Plan of Action on Ageing to manage the challenges of population ageing in the 21st
century. The Madrid Plan was preceded by two international documents on ageing: the Vienna International Plan of
Action on Ageing and the United Nations Principles for Older Persons.
70
UNFPA, 2012, p.20
71
United Nations, 1982, p.5.; The Vienna International Plan of Action on Aging which was adopted by the World Assembly on
Aging held in Vienna, Austria from 26 July to 6 August 1982.
72
See Council of the European Union, 2012
73
E.g. European Commission (2006): The demographic future of Europe – From challenge to opportunity; COM(2006) 571 final
14You can also read