Plastics Materials and Machinery exPort Guide - A Reference for U.S. Exporters in the Plastics Industry
←
→
Page content transcription
If your browser does not render page correctly, please read the page content below

P l a s t i c s M at e r i a l s
and Machinery Export Guide
A Reference for U.S. Exporters in the Plastics Industry

                                                                     Prepared by:
                                              U.S. Commercial Service, Commercial
                                         Specialists and the CS Manufacturing Team

                                                                      March 2018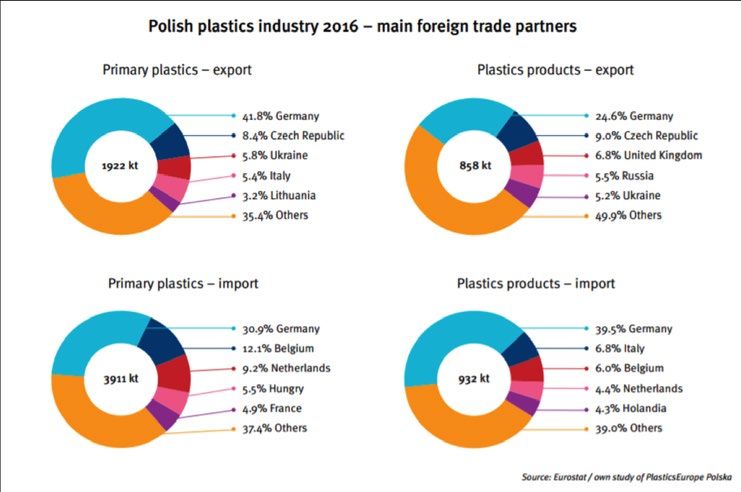
Ta b l e o f C o n t e n t s
U.S. Commercial Service Support for U.S. Exporters 4
Country Snapshots:
Argentina8
Australia 11
Brazil14
China19
Costa Rica 24
Croatia26
Czech Republic 30
Dominican Republic 33
Egypt35
El Salvador 37
European Union 40
France42
Germany49
India54
Israel61
Italy64
Malaysia68
Facilitating Today’s Innovations, Mexico71
Morocco74
For a Safer Tomorrow. Peru77
Poland79
Portugal84
Your Experts for plastics material s election, testing and certification Russia87
For more than 120 years, UL has been a trusted safety partner to governments, manufacturers,
Singapore90
retailers and consumers. UL has been testing plastics since 1941. We work closely with plastic
industry stakeholders to maintain and enhance existing UL Standards, establish new Spain94
requirements, and develop certification and testing programs that address emerging Turkey97
technologies and product applications. Discover our unsurpassed capabilities in plastics
United Kingdom 101
technology, capacity, quality and expertise.
www.ul.com/plastics U.S. Commercial Service Offices in the United States and Abroad 106
UL and the UL logo are trademarks of UL LLC © 2018 3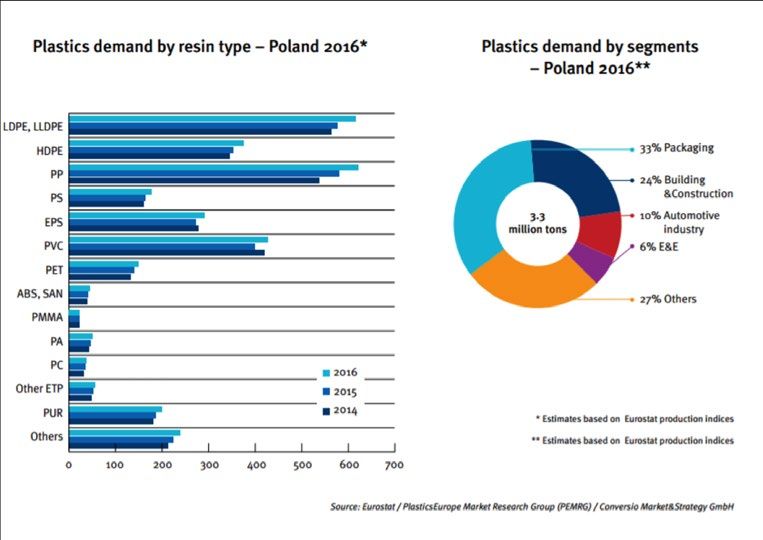
U.S. Commercial Service Support for U.S. Exporters:                                                          About the Market Briefs:
The U.S. Commercial Service is the export-promotion agency of the United States Department of                This is a “Plastics Market Briefs” booklet produced by the U.S. Commercial Service. It contains insights
Commerce. We provide a wide range of services and programs to help U.S. companies increase their             into important markets for U.S. firms. The purpose of this booklet is to provide market intelligence to
sales of goods and services to foreign markets. Our U.S. trade specialists and foreign commercial            support U.S. companies in the plastics industry that are interested in entering new markets with
specialists will assist you in identifying trade opportunities, finding local business partners, launching   enormous export potential. We hope this booklet will be a source of practical, hands-on information.
your company, promoting your products and services, obtaining valuable market research reports and           These market briefs were written by the commercial specialists responsible for the plastics sector in
protecting your intellectual property rights. U.S. Commercial Service trade specialists in over 100 U.S.     their respective countries. Their contact information may be found on top of each market brief. Please
cities and in nearly 80 countries stand ready to help you get started in exporting or increasing your        feel free to contact us for further information.
sales to foreign markets.
                                                                                                             NOTE: The information contained in this booklet is intended to be a basic market snapshot for U.S.
Why U.S. Exporters Should Work with Us:                                                                      exporters of plastics/rubber materials and machinery. It is not a comprehensive market report.
• Our specialists will assess markets of opportunity and connect you with qualified distributors and
                                                                                                             We would like to thank our sponsor, Underwriters Laboratories, and the contributing partners for
   partners.
                                                                                                             making this booklet possible.
• Through our customized programs, such as the International Partner Search or the Gold Key Service,
   we can connect you to potential partners.
• Our overseas specialists can provide you with market research, industry-specific or custom-tailored
   information on growth sectors, local competition etc.
• Our services will help you maximize your time at international trade shows, including matchmaking
   and pre-show promotional programs.
• We can assist you to overcome trade obstacles and provide guidance on trade financing.

To learn more about what we can do for you and how we can provide market research, information on
trade events, trade leads, and guidance on how to export, please visit www.export.gov.
Contact us today to connect with a world of opportunity.

4                                                                                                                                                                                                                  5
Free Trade Agreements                                                                                      FTA Tariff Tool
If you are looking to export your product or service, consider export markets with which the United        To determine if your product qualifies for preferential tariff treatment under any of these FTAs, the
States has negotiated a Free Trade Agreement (FTA). FTAs have proven to be one of the most effective       International Trade Administration (ITA) has developed the FTA Tariff Tool. The FTA Tariff Tool
ways for U.S. exporters to access foreign markets, making it easier and cheaper for U.S. businesses.       provides a searchable database for the relevant tariff/rule of origin requirements for any product
These agreements provide a competitive advantage versus products from other economies because              (agricultural or industrial). In addition, it generates market access reports/charts across industrial
they reduce tariffs and barriers to U.S. exports, protect U.S. interests, and enhance the rule of law in   sectors or product groups and creates a snapshot of current tariff and trade trends under the
the FTA partner country. In 2016, the United States exported $32.6 billion in plastic materials and        different U.S. FTAs. The Tool can be accessed from http://www.export.gov/FTA/FTATariffTool/.
products to our 20 FTA partners and $898.3 million in machinery for plastics. FTA trade in these           The website also contains an instructional video, quick start guide, and user’s manual.
goods favored the United States, giving us a trade surplus of $13.2 billion in plastic materials and
products and $131.2 million in machinery for plastics. FTA trade comprises 58.5 percent of total
exports for plastic materials and products and 53.7 percent for machinery for plastics.

U.S. FTA Partner Countries
As of January 1, 2014, the United States has 14 FTAs in force with 20 countries.
   • Australia                                  • Jordan
   • B ahrain                                   • Korea
   •C  hile                                     • Morocco
   •C  olombia                                  • NAFTA:
   •D  R-CAFTA:                                    Canada & Mexico
      Costa Rica, Dominican Republic,            • Oman
      El Salvador, Guatemala, Honduras           • Panama
      & Nicaragua                                • Peru
   • Israel                                     • Singapore

Information on these countries is available at http://www.export.gov.

6                                                                                                                                                                                                                   7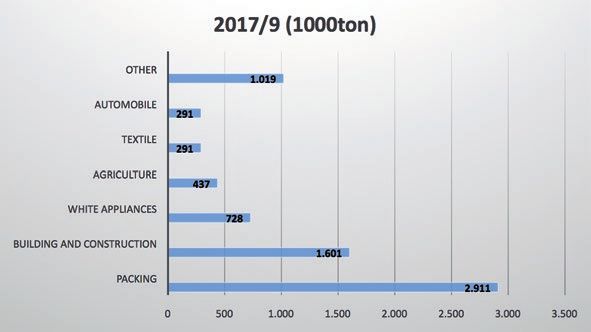
Argentina                                                                                                                                                                                        Argentina

                                                                                                          Imports of raw materials reached US$1.26 billion and imports of processing machinery and
                                                                                                          equipment, parts, molds and matrixes amounted to US$1.21 billion in 2016.

                                                                                                          The U.S. is the second largest exporter of plastic raw materials to Argentina with 26 percent of the
                                                                     U.S. Commercial Service              import market after Brazil, and is the third largest exporter of semi-finished and finished plastic
                                                                     Contact Information                  products, after China and Brazil, with a 7 percent import-market share. Imports of machinery and
C a p i ta l Buenos Aires		                          N a m e Liliana Paz                                  equipment, particularly in injection, extrusion, blow-molding, thermoforming and presses were mainly
P o p u l at i o n 44 million		                      P o s i t i o n Senior Commercial Specialist         imported from Europe and Asia, with the U.S. increasing its market share to 3.4 percent in 2016 (vis-
G D P US$ 585 billion (est. 2016)                    E - m a i l Liliana.Paz@trade.gov                    a-vis 2 percent in 2013).
C u r r e n c y Argentine Peso (ARS)                 P h o n e (54-11) 57774519
L a n g u a g e Spanish                                                                                   Injection is the most important plastic transforming activity in Argentina. Plants transforming plastic
                                                                                                          through injection operate in industries such as packaging, which represents almost 50 percent of the
                                                                                                          activity, followed by construction, electronics, automotive, agribusiness, household and furniture and
                                                                                                          others.
S u mm a r y
Argentina remains a key market for U.S. exports to Latin America, with a more open import                 Approximately 90 percent of injection molding equipment is imported. U.S. machinery tends to require
environment since late 2015. Argentina’s plastics sector is one of the most important sectors to the      higher economies of scale than its competitors. The best potential Argentine clients are those that
economy, representing 1.5 percent of the GDP in 2016. U.S. exports to Argentina in the raw materials      require high productivity and that produce high-technology products for international clients or for the
segment represented US$ 341 million in 2016, second only to Brazil. However, in the equipment/            local high-technology market. They may be a small number of companies, but it is a profitable niche
molds subsectors, U.S. exports lagged behind European and Asian competitors, due to the strong            that deserves consideration.
promotion and incentives granted by companies from these countries. U.S. exporters are encouraged
to explore opportunities in higher-end technology segments.                                               M a i n C o mp e t i t o r s
                                                                                                          As of 2016, there were approximately 2,800 manufacturing plants, primarily concentrated in the
Market Entry                                                                                              province of Buenos Aires, employing 54,500 workers. Most firms are small or medium-sized, with only
The Mercosur common external tariff (CET) applies to imports from countries outside the MERCOSUR          5 percent employing more than 50 workers. International companies such as DowDuPont and BASF,
area (Argentina, Brazil, Uruguay, and Paraguay) and duties average 14 percent for plastics and articles   are large players in the Argentine plastics market,
thereof (Chapter 39).
                                                                                                          Local machinery is generally positioned in a different and less-demanding segment (low cost and
U.S. companies exporting to Argentina typically market their products and services through Argentine      performance). U.S. injection molding machinery usually competes with similar products from Italy and
agents, representatives and distributors. The U.S. Commercial Service can help identify a potential       Germany in terms of quality and price. European companies also enjoy a longtime presence and are
distributor through one of our matchmaking services. An important component of the marketing mix is       active in offering promotion and training workshops. However, Chinese sales have been growing
promotion. Companies are encouraged to attend or exhibit at local trade shows as well as visit trade      significantly in recent years and have become market leaders in overall equipment imports.
shows in the U.S. attended by Argentine buyers.
                                                                                                          M a r k e t I s s u e s a n d O b s ta c l e s
Current Demand                                                                                            Although many of the most onerous import restrictions have been removed since December 2015,
Plastic consumption per capita quadrupled from 11 kg in 1990 to almost 44 kg in 2016. The local           importers must still request Non-Automatic Import Licenses (NAILs) on over 1,000 items, mainly in the
industry transformed 1.42 million tons of raw materials in 2016, increasing production by 4 percent.      consumer-goods sectors. It is also important to protect intellectual property and engage qualified local
This was mainly due to the recent investments of large international players in expanding capacity of     professionals and lawyers in contract negotiations.
their manufacturing facilities.

8                                                                                                                                                                                                               9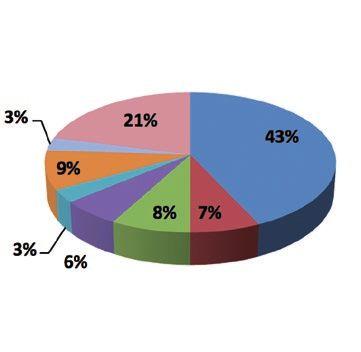
Argentina
                                                                                                  Australia
Trade Events
Name of Event: Argenplás
Date:          June 11-14, 2018
Location:      Centro Costa Salguero, Buenos Aires, Argentina                                                                                                           U.S. Commercial Service
Website:       http://www.argenplas.com.ar/en/                                                                                                                          Contact Information
Description:	Argenplás is the leading plastics show, held in Argentina every two years.
                                                                                                  CA P ITAL Canberra                                    NA M E John Kanawati
Source:        CAIP – Argentine Plastics Industry Chamber: www.caip.org.ar
                                                                                                  P O P ULATION 24.13 million                           P OSITION Commercial Specialist
                                                                                                  G D P US$ 1.205 trillion (est.)                       E M AIL John.Kanawati@trade.gov
Name of Event:    Envase/Alimentek/Farmatek
                                                                                                  CURRENCY AUD                                          P HONE +61-2-9373-9207
Date:             September 10-13, 2019
                                                                                                  LAN G UA G E English
Location:         Centro Costa Salguero, Buenos Aires, Argentina
Website:          http://www.envase.org
Description:      Envase show is the leading packaging show, held in Argentina every two years.
Source:           Instituto Argentino del Envase: http://www.packaging.com.ar/web.                SU M M ARY
                                                                                                  In 2017 Australia surpassed the world record for the longest period of uninterrupted economic growth,
                                                                                                  26 years, held by the Netherlands. With few barriers to entry, a familiar legal and corporate framework,
                                                                                                  sophisticated consumer and industrial sectors, and a straightforward, English-speaking business
                                                                                                  culture, Australia remains a vibrant and important pro-U.S. market for American goods and services.

                                                                                                  Under the Australia U.S. Free Trade Agreement, over 99 percent of U.S. exports now enter Australia
                                                                                                  duty-free. This includes all plastics and articles of plastic under HS Chapter 39.

                                                                                                  Total demand in Australia for plastics and articles of plastics under HS Chapter 39 is estimated at
                                                                                                  US$ 6.2 billion. Imports satisfy 70 percent of the Australian market. Demand can be described as
                                                                                                  stable with little change recorded between 2014-2016.

                                                                                                  M ARKET ENTRY
                                                                                                  It is rare for overseas suppliers to sell directly to Australian end-users. In some cases U.S. job shops
                                                                                                  have produced plastic parts and components for Australian customers, but these customers have
                                                                                                  usually been local subsidiaries of multinational operations.

                                                                                                  The most common method of market entry is to appoint a local Australian stocking-distributor. Sales
                                                                                                  representatives or agents are virtually non-existent in Australia.

10                                                                                                                                                                                                    11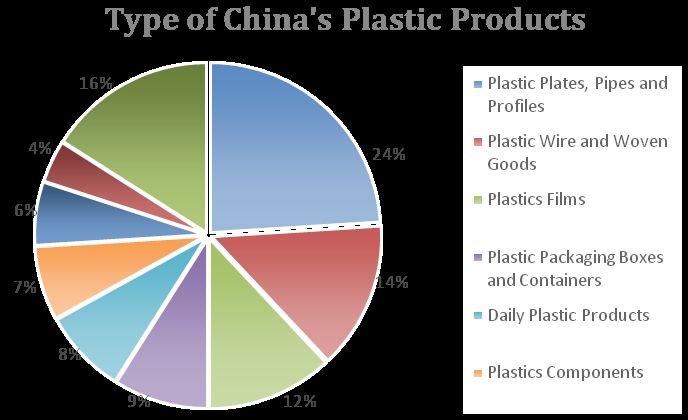
Australia                                                                                                                                                                                   Australia

Distributors interested in a product will often request national exclusivity. In some cases Australian    M AIN CO M P ETITORS
distributors will have networks that allow them to also market to New Zealand.
                                                                                                          According to the Global Trade Atlas (www.gtis.com), in 2016 Australia imported US$ 5.4 billion in
                                                                                                          plastics and articles of plastics under HS Chapter 39. There was little change in demand over the
The distance from many of their trading partners and the sheer size of the Australian continent –
                                                                                                          2014-2016 period. China was the main supplier, holding a 33 percent import-market share, followed
comparable to the continental U.S. – causes Australian firms to stress the importance of local support
                                                                                                          by the U.S (10%), Thailand (6%) and Malaysia (5%). In 2016 Australia exported US$825 million under
and service. American companies should visit Australia both to meet prospective partners and
                                                                                                          HS 39. Local production represents 30 percent of total market demand.
demonstrate ongoing support, as this is the common practice of their competitors.
                                                                                                          In 2016 Australia imported US$ 118 million in machinery and equipment used for working rubber or
A small number of well-established associations servicing various aspects of the plastics industry
                                                                                                          plastics. China was the dominant supplier with an import-market share of 24 percent followed by
exist. These associations can offer one way for U.S. companies to locate potential representatives and
                                                                                                          Germany (21%) and the U.S. (10%). Injection- molding machines represented the largest subsector,
distributors. Australia does not have any trade shows designed exclusively for the plastics industry.
                                                                                                          with China, Canada, Germany and South Korea being the main suppliers. Blow-molding machines
Depending on the applications offered by plastic-based solutions, suppliers and distributors will often
                                                                                                          represented the second largest subsector, with Japan, China, India and Germany being the main
exhibit in other industry-specific trade shows.
                                                                                                          suppliers.
Most of the criteria American firms use to select distributors in markets throughout the world are also
                                                                                                          M ARKET ISSUES AND OBSTACLES
applicable to Australia, with expectations adjusted to the scale of the market, given the population of
24 million. Performing due diligence is just as important in Australia as in the United States, and the   Australia’s remote location from the United States is often cited as the single most significant
Commercial Service in Australia offers resources to assist in this area.                                  non-tariff barrier to trade.

CURRENT DE M AND                                                                                          American companies may find that Australian and third-country competitors in Australia have some
                                                                                                          long-established brands with strong reputations and well-established supplier relationships.
Total demand in Australia for plastics and articles of plastics under HS Chapter 39 is estimated at
US$6.2 billion. Imports satisfy 70 percent of the Australian market. The majority of companies in the
                                                                                                          Australia has ready access to Asian and other low-cost producers. American firms must therefore
plastics industry are wholesale distributors that service key channels.
                                                                                                          demonstrate sufficient added value to overcome the costs of getting the product to market, and to
                                                                                                          compete. The Australian market is very price-sensitive.
Flexible-plastic product manufacturing in Australia covers packaging film, plastic bags, shrink wrap,
builder’s film and agricultural films such as bale wrap. Rigid plastics manufacturing is focused on
bottle and container manufacturing as well as for pipe manufacturing. Furniture, toys and kitchenware
are primarily imported.

There are a number of Australian companies with extrusion blow-molding and injection-molding
capabilities. There is a market for machinery and ancillary equipment that supports this subsector.

More than 1.5 million tons of plastic is consumed annually with less than 20 percent recycled.
Emerging opportunities exist for plastics-recycling technologies and solutions. Australia currently has
over 100 sorting facilities. Local councils use private waste-management firms to collect recyclables.
Almost all recycling is undertaken by private companies.

12                                                                                                                                                                                                       13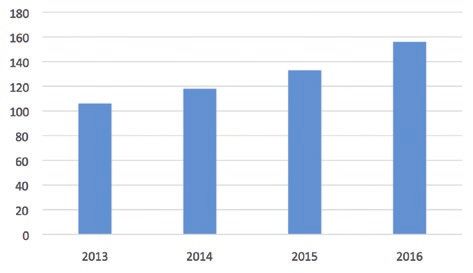
Brazil                                                                                                                                                                                                     Brazil

                                                                                                            Doing Business in Brazil
                                                                                                            Indicator                                          2016    2017       2018         2019          2020
                                                                                                            Real GDP growth                                    -3.6%   0.5%       1.9%         2.1%          2.2%
                                                                      U.S. Commercial Service
                                                                                                            Consumer price inflation (av)                      8.7%    4.3%       4.5%         4.7%          4.5%
                                                                      Contact Information
                                                                                                            Exports of goods fob (US$bn)                       $184    $197       $197         $206          $216
CA P ITAL Brasilia                                    NA M E Moacir Rodovalho
P O P ULATION 207.7 million (2016)                    P OSITION Commercial Specialist                       Imports of goods fob (US$bn)                       $139    $151       $163         $178          $191
G D P US$ 1.8 trillion                                E M AIL Moacir.Rodovalho@trade.gov                    Source: The Economist Intelligence Unit; 07 April, 2017
CURRENCY Real                                         P HONE +55 81-3416-3123
LAN G UA G E Portuguese
                                                                                                            President Temer took over as interim President after the impeachment of former President Dilma
                                                                                                            Rousseff began in May 2016; he officially took office in August 2016 after the impeachment was
                                                                                                            completed. President Temer has pursued corrective macroeconomic policies to stabilize the economy.
SU M M ARY                                                                                                  Additionally, the Brazilian Congress approved a landmark constitutional federal spending cap in
Brazil is the second largest economy in the hemisphere behind the United States and the ninth largest       December 2016 and is now debating complementary constitutional reforms to curb social security
economy in the world. In 2015, the United Nations Conference on Trade and Development (UNCTAD)              spending. If robust social security reform is approved, financial analysts assert that investor confidence
named Brazil the eighth largest destination for global Foreign Direct Investment (FDI) flows. The U.S. is   in debt sustainability will strengthen.
a major investor in Brazil; and in recent years Brazil has received more than half of South America’s
total incoming FDI. The Brazilian Central Bank (BCB) indicated that the United States had the largest       Additional reforms to increase labor-market flexibility and to rationalize Brazil’s complex tax system
single-country stock of FDI (US$ 112 billion) in Brazil in 2014, the latest year with available data.       are also on the agenda. International capital markets have recognized the efforts of the Temer
                                                                                                            administration, including lowering risk premiums significantly from 2015 peak levels and boosting the
The Government of Brazil (GOB) has made attracting private investment in infrastructure a top priority      value of the real. Likewise, 2016 and 2017 foreign direct investment inflows have been strong. Both
for 2017. Brazil’s recession has been longer and deeper than most economists anticipated. The               portfolio and direct investors, however, remain sensitive to political uncertainties linked to ongoing
country’s GDP contracted by 3.6 percent in 2016 and is projected to grow only 0.5 percent in 2017.          corruption scandal investigations, and Brazilian risk premiums fluctuate accordingly. Brazil has been
Per capita GDP decreased 4.4 percent in 2016 for a combined drop of almost 10% over two years.              taking steps to improve infrastructure and education, expand trade, and increase the presence of
While unemployment stood at just 6.5 percent as recently as 2014, it ended 2016 at 12% and is               multinational businesses in the development of Brazil’s huge oil reserves. Brazil’s large and diversified
projected to end 2017 above 13%.                                                                            economy makes it attractive for investors.

In 2015, Brazil was the world’s eighth largest destination for Foreign Direct Investment (FDI) with         In 2016, the United States was the second-largest goods exporter to Brazil, accounting for 16 percent
inflows of US$64.6 billion, according to UNCTAD. The nominal deficit stood at 9 percent of GDP              of Brazil’s total imported goods, behind China, and followed by Germany, Argentina, and South Korea.
(US$161.7 billion) in 2016 and is projected to end 2017 at around 10% of GDP (US$ 180.1 billion).           In 2016, Brazil imported US$30.3 billion from the United States – a 4 percent decrease from 2015,
Brazil’s debt-to-GDP ratio reached 70% in 2016 and is projected to reach 77% by the end of 2017. In         attributable to Brazil’s economic recession. Brazil ranked as the United States’ 12th largest export
part due to the slower than anticipated return to growth, annual inflation fell to 6.3 percent by the end   market for goods in 2016. Brazil is also a large market for U.S. services, accounting for US$24.9
of 2016 – inside the Brazilian Central Bank’s (BCB) target range of 4.5 percent +/- two percentage          billion in exports in 2016, the most recent year for which services data is available. Overall, the United
points – for the first time in two years. This allowed the BCB to cut its benchmark interest rate to        States’ estimated goods and services surplus with Brazil in 2016 totaled US$22.3 billion, and Brazil
11.25% (from a high of 14.25% in 2016) in April 2017.                                                       remains the United States’ largest trading partner with which it maintains a trade surplus. (Source:
                                                                                                            Global Trade Atlas).

14                                                                                                                                                                                                                  15
Brazil                                                                                                                                                                                                      Brazil

Brazil represents an excellent partner for experienced U.S. exporters. Major reasons to export to Brazil      The year of 2016 came to an end with 12 million people unemployed in the country. The production of
include:                                                                                                      the typical inputs of the construction sector, the main consumer of the processed-plastic industry,
• Representing the largest market in Latin America, Brazil’s population of 207 million is the fifth          recorded a drop of nearly 24% in the past two years. In addition, the automotive industry, the 3rd
   largest in the world, totaling nearly 3 percent of global consumers.                                       major processed-plastic consumer sector, also recorded a drop of nearly 40% in production in the
• Brazil is also a traditional leader among emerging markets. A BRICS member, many multi-national            past 2 years.
   companies consider it as an essential market for truly global businesses.
• Brazil has a natural affinity for the United States and a high regard for American products, brands        The processed-plastics industry produced 403,000 tons (valued at USD1.9 billion) in 2015 and
   and technology.                                                                                            330,000 tons (USD1.6 billion) in 2016, representing a historical drop, attributable to diminished
• The Brazilian Government is actively cultivating relationships with international and U.S. businesses      imports.
   and prioritizing macroeconomic stability.
                                                                                                              The United States occupies the third position as the principal origin of imports of processed plastics
M ARKET ENTRY                                                                                                 into Brazil, only behind China and Uruguay. The main destinations of processed plastic exports were
Success in Brazil’s business culture relies heavily upon the development of strong personal                   Argentina, United States, and Paraguay.
relationship, which is the keystone of productive business partnerships. In most cases, U.S. firms need
a local presence, and therefore, should invest time in developing relationships through frequent visits       M AIN CO M P ETITORS
to Brazil. Some firms may also need to establish an office or joint venture in Brazil.                        Domestic competition: There are about 92 manufacturers of machines and accessories for the plastics
                                                                                                              industry in Brazil, whose products serve the extrusion, injection, blow-molding, cutting and welding,
It is essential to work through a qualified representative or distributor when developing new business        printing, thermoforming, recycling and machine-accessory businesses. These companies are
in the Brazilian market. It is difficult for U.S. companies to get involved in public-sector procurement at   members of the Brazilian Association of Machine Manufacturers. Information on the companies is
the federal or state levels without a Brazilian partner or a physical presence in Brazil.                     available at this link:
                                                                                                              http://www.camaras.org.br/site.aspx/Associadas-da-CSMAIP
CURRENT DE M AND
The plastics sector has over 11,459 companies distributed throughout Brazil. Considering company              International competition: Major international plastic-machine manufacturers presently operate in
revenues, 41% of plastics firms are micro and small enterprises, which reflects a high rate of                Brazil with manufacturing facilities, sales offices or commercial representatives. In order to avoid the
entrepreneurship in the sector, as well as the presence of family-owned businesses. Fifty-nine percent        strong competitive influence of local producers and the established local representation of imported
are medium and large enterprises that dictate the sector’s growth and technological dynamism.                 machinery, import representatives tend to search for niche products for which the number of suppliers
Additionally, many of these companies belong to multinational corporations that produce on a global           is smaller than conventional machines, thus increasing their profit margins.
scale – such as construction, automotive, food and beverages – and conform with strict production
and quality standards required worldwide. This demonstrates the competence of the Brazilian                   M ARKET ISSUES AND OBSTACLES
companies.                                                                                                    There are no restrictions whatsoever to the import of plastic resins, technology, or services. The tariff
                                                                                                              on most machines imported into Brazil is at 14%, however other taxes and costs related to importing
The plastics sector employs more than 313,000 workers nationwide, down from about 355,000 in                  into Brazil increase the final price of imported machinery by about 60%.
2007. Even so, this sector is still the fourth-biggest employer in the Brazilian transformation industry.
                                                                                                              In order to incentivize Brazilian industries to invest in technologies not available in Brazil and enable
In 2016, sales of the plastics-transformation sector in Brazil reached US$ 20.89 billion. The                 the production of higher-quality products and generate future exports, the Government of Brazil
consumption of plastics products in Brazil was at R$ 22.82 billion, a decrease of 11% compared to             adopted a program called ‘’Ex-Tarifario”. The program reduced the import tariff of various industrial
2015. Exports and imports of processed plastics in 2016 were 256,000 tons (valued at USD1.1                   machinery to 2 or 0 percent for a two-year period.
billion) and 586,000 tons (valued at USD2.7 billion) respectively. The constant drop in processed-
plastic imports is attributable to the shrinkage in Brazilian consumption caused by the existing crisis.

16                                                                                                                                                                                                                  17
Brazil
China
Doing business in Brazil requires intimate knowledge of the local environment, including both the
direct and indirect costs (referred to as “Custo Brasil”). Such costs are often related to distribution,
government procedures, employee benefits, complex labor code, environmental laws and a complex
tax structure. Logistics also pose a particular challenge, given the lack of sufficient infrastructure.
According to the World Economic Forum, Brazil ranks 107th out of 144 countries in the level of U.S. Commercial Service
infrastructure development. In addition to high tariffs, U.S. companies need to navigate a complex Contact Information
legal system and customs procedures. The Government of Brazil is the nation’s largest buyer of goods CA P ITAL Beijing NA M E Ken Shen
and services. Navigating the government procurement process, however, is challenging. U.S. exporters P O P ULATION 1.39 billion P OSITION Commercial Specialist
may find themselves at a competitive disadvantage if they do not have a significant in-country G D P US$ 1.379 billion (2016) E M AIL Ken.Shen@trade.gov
presence – whether via established partnerships with Brazilian entities or some type of company CURRENCY Renminbi (RMB) or P HONE (86-21) 6279 8789
subsidiary – as well as the patience and financial resources to respond to legal challenges and Yuan
bureaucratic delays. LAN G UA G E Chinese
TRADE EVENTS
Name of Event: Interplast SU M M ARY
Date: August 14 – 17, 2018 China is currently the third largest export market for U.S. goods (after Canada and Mexico), and the
Location: Complexo Expoville – Joinville, Santa Catarina United States is China’s largest export market. Two-way trade in goods between China and the United
Website: www.interplast.com.br/en/ States has reached USD 578.59 billion in 2016. The Chinese government recently introduced an
Description: Bi-annual Trade Show. Interplast is an event geared exclusively to the plastics ambitious agenda to restructure China from a large, low-cost manufacturing country to a leading
industry. The fair is held in Rio Grande do Sul - the second largest plastics market advanced-manufacturing country. Accordingly, China’s plastics industry is undergoing a critical stage
in South America. The region also has a considerable number of global brands of upgrading its structure.
that manufacture for various industries, such as automotive, home appliance,
construction, furniture, cosmetics and personal care, pharmaceutical, packaging China has become the largest consumer and producer of plastics in the world since 2010. China’s
and housewares, forming an extensive supply chain. plastics industry recorded a double-digit growth rate before 2012 and maintained a steady growth
rate in the following years until 2015. In 2015 and 2016, China’s plastics industry experienced a bout
Name of Event: Feiplastic of slower growth because of low macroeconomic growth.
Date: April 08 – 12, 2019
Location: Expo Center Norte – São Paulo, SP Plastics Products:
Website: www.feiplastic.com.br/en/home/ In 2016, China reported production of 69.89 million tons of plastics products. It generated revenue
Description: Bi-annual and the largest trade show in Latin America. Feiplastic is one of the top from principal businesses of RMB 2285.51 billion yuan (USD 362.77 billion). At the same time, China
trade shows in the plastics industry for introducing trends, showcasing product imported 25.70 million tons of plastics in primary forms, amounting to USD 41.32 billion, and 5.81
launches, and networking opportunities. million tons of natural and synthetic rubber valued at 57.66 billion yuan (USD 9 billion). The largest
plastic materials and products consumed in China are for packaging, agricultural, building, electronics,
AVAILABLE M ARKET RESEARCH automobile and consumer-goods industries.
ABIPLAST – The Brazilian Association of Plastics Transformers publishes statistics on the plastics
industry in Brazil: www.abiplast.org.br Plastics production is mainly concentrated in the east, south and central China regions, with five major
provinces (Zhejiang, Guangdong, Jiangsu, Henan and Hubei) accounting for more than 50 % of
China’s output of plastic products in 2016.
18 19China China
The U.S. Department of Commerce, United States Foreign Commercial Service (USFCS) offers
customized solutions to help U.S. companies, including small- and medium-sized enterprises, succeed
in the China market. USFCS stands ready to help U.S. companies develop comprehensive market-
entry or expansion plans, learn about export- and customs-related requirements, obtain export
financing and identify potential partners, agents, and distributors through business matchmaking
programs, trade shows, and trade missions led by senior U.S. government officials.
CURRENT DE M AND
The plastics industry in China is entering a new stage for structural optimization and industry
upgrading, driven by the Chinese government’s encouragement on technological progress and
innovation. Although China has a huge plastics industry, most domestic companies only have the
capability to produce low- and middle-level plastic products. They rely on importing products for high-
end plastic materials, such as special-engineering plastics, high-end medical-plastic materials and
materials for special industry pipes. The following are some key areas where China is seeking
Plastics Machinery common and pivotal-technology breakthroughs:
China is the world’s largest market for plastic machinery, representing 20% of the global total. In
2016, Chinese plastic-machinery manufacturers generated revenue from principal businesses of RMB • High-end polyolefin pipe materials, 3D printing additive, medical-plastics, bio-based polymer and
59.59 billion yuan (USD 9.4 billion). Although China-made plastics machinery accounts for over 80% biodegradable plastics.
of the total domestic plastic machinery market, China still relies on foreign supplies for high-end • Functional-polymer alloy
plastic machinery. Ninety percent of high-end plastic machinery in China is imported. In 2016, China • Aromatic heterocyclic polymer and its high-performance composites and modified materials.
imported 28,297 sets of plastics machines with a value of USD 1.63 billion, particularly injection • Selective porous membrane, especially microfiltration film, ultrafiltration film, nanofiltration film.
molding, extruder, and blowing-molding machinery. The top three suppliers are Japan, Germany and • High-end battery diaphragm, optical film and film for OLED
Taiwan. • Bio-based plastic auto component and packaging product, high-performance PE building and
construction materials, high-performance rigid PVC foam product, large caliber high strength PO pipe.
• Waterborne polyurethane synthetic leather
M ARKET ENTRY
Companies should consider their own resources, previous export or business experience abroad, and
M AIN CO M P ETITORS
long-term business strategy before entering the China market. Representation in China by Chinese
agents, distributors or partners who can provide essential local knowledge and contacts will be critical Domestic Competitors
for success. Intellectual Property rights holders should understand how to protect their IP under In China, there were about 150,000 enterprises above the designated size producing plastics products
Chinese law before entering the China market, and should conduct thorough due diligence on potential and 403 enterprises above the designated size manufacturing plastics machinery by the end of 2016,
partners or buyers before entering into any transaction. Foreign companies have a wide range of according to the statistics from China Plastics Industry Association and China Plastic Machinery
options for corporate formation in China, including wholly-foreign-owned enterprises, joint ventures, Industry Association (Note: “enterprise above designated size” is a statistic term used by the Chinese
representative offices and other investment vehicles. Each option has its own advantages, government since 1996, the threshold is that an enterprise need to generate revenue from its principal
disadvantages and risks. All companies (IP rights holders and others), should consult closely with business at and above RMB 20 million/USD 3.23 million). Most of these plastics-production
lawyers who have extensive experience with the China market, including lawyers based in the United enterprises are small-size companies. Large-scale enterprises total 143, the medium-size enterprises
States and China. 1666. There are also thousands of small and medium size enterprises in the plastic industry not
included in the statistics because of their revenue generation. The huge and complex Chinese market
offers various business opportunities for all kinds of companies at home and abroad. Local companies
have grown quickly and have acquired sophisticated technology over the years. Competition is
inevitable and fosters the rapid development of the industry.
20 21China China
International Competitors TRADE EVENTS
China’s market includes international brands and products. In 2016, the key suppliers of plastics
materials were Saudi Arabia, South Korean, Singapore, the United Arab Emirates, the United States,
Name of Event: ChinaPlas 2019
Thailand, Iran, Qatar and Taiwan. The key suppliers of plastic machinery Japan, Germany, Taiwan, Italy,
Date: May, 2019
South Korean, the United States and Austria. The United States was ranked as the 6th largest importer,
Location: Guangzhou, China
accounting for 3.06% of China’s total import of plastic machinery.
Website: www.chinaplasonline.com
Description: ChinaPlas is the second-largest exhibition in the world for the plastics industry. It is
U.S. companies have better market opportunities if they offer innovative materials or substances to
held alternately in Guangzhou and Shanghai. In 2017, the show was held in
enhance plastics, or the processing of plastics. Chinese companies are constantly trying to improve
Guangzhou, attracting over 155,258 visitors and 3,487 exhibitors from 38 countries
their products. Chinese companies like to turn to U.S. companies for innovative technology and
and regions. ChinaPlas has been organized by the Hong Kong-based Adsale
products such as energy-saving production solutions, new and lightweight materials, bio-based
Exhibition Services Ltd. for over 20 years.
polymers, plastics-recycling technology/equipment, engineering plastics and manufacturing
equipment, etc.
AVAILABLE M ARKET RESEARCH
M ARKET ISSUES AND OBSTACLES China: Country Commercial Guide 2017
China is a challenging place to do business. According to the American Chamber of Commerce in
Major Chinese Plastics Industry Associations:
China (AmCham), in 2016, American businesses in China faced headwinds arising from slowing
China Plastics Processing Industry Association (www.cppia.com.cn/)
economic growth, inconsistent and generally unfavorable interpretations of regulations, growing
China Plastics Machinery Industry Association (cpmia.org.cn/)
pressures from domestic industrial policy, and rising costs of doing business. AmCham’s most recent
China Synthetic Resin Supply and Sale Association (www.csra.org.cn/)
member-survey reported that 81 percent of respondents felt foreign businesses were less welcome in
Shanghai General Plastics Association (www.sspi.com.cn)
China than before. Likewise, less than three-quarters of U.S. China Business Council member
Guangdong Plastics Industry Association (www.gdpia.com)
companies have an optimistic five-year outlook, the lowest total over the past decade.
Day-to-day business operations present a variety of obstacles. The World Bank, in its Ease of Doing
Business Report, ranks China 78th out of 190 countries with respect to opening and running a
business while complying with local regulations. For starting a business, the World Bank ranked China
127th, reporting that starting a business requires at least 11 procedures in Shanghai and Beijing that
average more than 30 days to complete. Despite significant Chinese government efforts to streamline
bureaucracy and reduce red tape, foreign companies continue to complain about administrative
procedures, especially with respect to registration and licensing.
China also continues to pursue industrial policies that seek to limit market access for imported goods,
foreign manufacturers, and foreign-services providers, while offering substantial government
guidance, resources, and regulatory support to Chinese industries. The principal beneficiaries of these
policies are state-owned enterprises, as well as other favored domestic companies attempting to
move up the economic value chain. Provincial and local governments often have an ownership stake
in private companies, which can result in government support. Foreign enterprises report that Chinese
government officials may set conditions for approvals on a foreign enterprise’s agreement for
technology transfer; to conduct research and development in China; and satisfy performance
requirements relating to exportation or the use of local-content concessions.
22 23C o s ta R i c a C o s ta R i c a
CURRENT DE M AND
The plastic industry represents approximately 2.5% of GDP. Approximately 5% of Costa Rica’s plastic
production is exported. Almost half of the exports is made under CAFTA/DR (Dominican Republic-
U.S. Commercial Service Central America Free Trade Agreement). 34% of the plastic products are used in the industrial sector
Contact Information and 24% in the food sector.
CA P ITAL San Jose NA M E Emilio Cordoba
For 2016, imports were $1.4 billion and exports were $360 million.
P O P ULATION 4.93 million P OSITION Commercial Specialist
G D P US$ 80.7 billion (est.) E M AIL Emilio.Cordoba@trade.gov
CURRENCY Colones P HONE (506) 2519-2203 M AIN CO M P ETITORS
LAN G UA G E Spanish The industrial plastic sector is comprised of about 160 processing and manufacturing companies.
Distribution and size of companies:
Approximately 160 converters and recyclers:
SU M M ARY • 15% large companies
Since 2010, Costa Rica has enjoyed strong and consistent economic growth. Costa Rica’s government, • 73% of medium and small companies
democratic traditions, and commercial- promotion efforts have made the country a leader in the • 12% micro-enterprises
region for international business and tourism. Costa Rica has attracted one of the highest levels of • Employment generation: Around 14,000 direct jobs
foreign-direct investment per capita in Latin America. The United States remains Costa Rica’s largest
trading partner and Costa Rica’s largest foreign-direct investor. In 2016, the U.S. had a US$1.6 billion Approximately 50% of companies that manufacture plastics are located in the capital, San José. 80%
trade surplus with Costa Rica Foreign-direct investment in Costa Rica reached US$2.85 billion in of the technical workforce is employed by large companies. Imports of plastics come mainly from the
2015. Nearly 53% of that investment came from the United States. Costa Rica’s economy also faces United States. 34% of plastic products are destined for the industrial sector, while 24% is utilized by
challenges due to a rising fiscal deficit, rising public debt and relatively low levels of domestic revenue. the food sector.
M ARKET ENTRY M ARKET ISSUES AND OBSTACLES
Costa Rica has few market entry challenges. U.S. products and services enjoy an excellent reputation, By 2021, Costa Rica will try to eliminate 80% of single-use plastic by replacing it with materials with
making Costa Rica a good market for U.S. companies. One of the most common market entry options less of an environmental impact.
is to appoint an agent or distributor. Another is to find a local partner who can provide market
knowledge and contacts. Other businesses have been successful via licenses or franchises. The U.S. TRADE EVENTS
Commercial Service in Costa Rica advises U.S. companies on how best to enter the market and offers
There is no plastics-focused trade show taking place in Costa Rica at present.
a range of services to assist U.S. companies in finding a local partner or promote, through the local
partner, products already being commercialized or soon to be launched in the market. The U.S.
Commercial Service can also assist with due diligence on a prospective local-company partner. AVAILABLE M ARKET RESEARCH
Costa Rica Country Commercial Guide
24 25CROATIA CROATIA
Industry income $23.491 Million (2016)
Total number of employees 8,522 - 4.0% of Croatian manufacturing industry (2016)
Number of active companies 698 firms - 1 large, 21 medium, 131 small, 542 micro (2016)
Plastic imports $681,2 Million (2016)
U.S. Commercial Service Rubber imports $254,5 Million (2016)
Contact Information Plastic exports $357,2 Million (2016)
CA P ITAL Zagreb NA M E Suzana Vezilic Rubber exports $68,9 Million (2016)
P O P ULATION 4.171 million P OSITION Commercial Specialist Share of total exports 2.96% (2016)
G D P US$ 50,4 billion (est.) E M AIL Suzana.Vezilic@trade.gov
CURRENCY Kuna (HRK) P HONE (3851) 661-2020 M ARKET ENTRY
LAN G UA G E Croatian
With Croatia’s accession into the EU, U.S companies based in the EU are facing considerably less
barriers to entry than in previous years. Croatia has completed the legal harmonization process with
the EU, and there are no unique legal barriers for the rubber and plastic industry in Croatia. US firms
SU M M ARY have similar regulatory regimes to exist in Croatia as in other EU countries. Because the Croatian
After Croatia’s EU Accession on July 1, 2013, the need for product double-testing and customs market is fairly sophisticated, businesses considering entry should plan well and consider:
clearances when distributing goods and services between the EU countries and Croatia was
eliminated. U.S. companies already exporting to the EU now have an additional market opportunity, • The price sensitive nature of consumer demand in Croatia;
accessible without any further administrative burden. EU accession negotiations provided an additional • A judicious selection of one of three low-risk entry strategies: representation, agency, or
impetus for the Croatian Government to undertake measures in recent years to address corruption distributorship. (Note that a Croatian agent or distributor is preferable to a “European office” due to
and bureaucratic and judicial inefficiency. The current Croatian Government (elected in October 2016) the difficulty of the language and other idiosyncratic market factors);
has demonstrated its determination to further strengthen these reforms as well as to find new and • The entrenched bias of a conservative market that sticks to known suppliers and therefore requires
more effective ways to consolidate public spending, improve the business climate and foster economic sustained market development.
growth.
CURRENT DE M AND
The country’s population of roughly 4.2 million is largely homogenous in ethnicity, language and The Croatian plastic industry is a very healthy and growing sector of Croatia’s manufacturing sector.
religion; but in the summer months its numbers are doubled by tourists from throughout Europe and Small and especially medium sized businesses are showing healthy growth and an increasing appetite
the world, making it a cosmopolitan market for products and services. Its ports and transportation for capital investments in production and innovative technology.
infrastructure make Croatia a natural trade gateway into southeast Europe. In brief, Croatia is a market According to the Croatian Chamber of Economy, the Croatian rubber and plastics industry is heavily
of opportunity, but one that should be entered with due diligence. dependent on raw materials. Many of the larger Croatian firms process raw materials themselves,
while some smaller firms are more likely to use semi-finished materials.
Analysis of movements in economy of industrial processing of plastics and rubber from 2008 to 2016
show that this industry branch, during this period, was more resistant to the economic crisis. Overall Due to the implementation of EU environmental regulations, demand for pollution control and green
industrial activity of processing plastics and rubber in 2013 was 0.55 percent higher than in 2008. manufacturing equipment is on the rise. There has been increasing interest in sustainable technology
The Croatian rubber and plastics industry relies heavily on imported raw materials. Croatia imported and techniques as they relate to the rubber and plastics industry. Bio plastics and tire recycling are
approximately $680 million worth of plastics and $250 million worth of rubber products in 2016. Key rising in prominence within the Croatian market.
areas of growth in Croatian imports are in the pneumatic rubber tire industry and plastic packaging
industry. An overview of the Croatian plastics and rubber industry is provided bellow:
26 27CROATIA CROATIA
M AIN CO M P ETITORS US exporters unfamiliar with EU CE-Marking should consult the US Commercial Service’s EU
Commercial Guide for more information. The EU Commercial Guide can be accessed free of charge at
Domestic: There are 698 Croatian rubber and plastic manufacturers. Gumiipex, MuraPlast, AD Plastik,
http://export.gov/europeanunion/eustandardsandcertification/index.asp
Stražaplastika, Alpla, Wachem, Bomark Pak, Vargon, Heplast-Pipe, Aquestil Plus and Alpro-Att are
largest companies in the Croatian rubber and plastic industry.
TRADE EVENTS
International: German firms are by far the largest exporters of rubber and plastics to Croatia. Italy and Name of Event: Plastics and Circular Economy
Hungary import much of Croatia’s rubber and plastic products and raw materials. Date: October, 2018
Location: Croatian Chamber of Economy, Zagreb
M ARKET ISSUES AND OBSTACLES Description: Croatian Chamber of Economy is organizing a conference in association with the
Slovenian Chamber of Economy, Plasttechnics Cluster Slovenia and the EU
Croatia has been fully integrated into the European common market. So, exporter’s familiar with EU
association PlasticsEurope. This will be 12th conference in a row organized in
regulations such as CE-marking and REACH, will encounter similar regulations regarding exports to
order to support the plastics and rubber industry in Croatia and the neighboring
Croatia. More information on REACH and CE-Marking can be found on the export.gov webpage
countries.
http://export.gov/europeanunion/eustandardsandcertification/index.asp
Name of Event: ModernPack
REACH Date: May 2019 (date TBD)
REACH, “Registration, Evaluation and Authorization and Restriction of Chemicals”, is the system for Location: Zagreb Fair
controlling chemicals in the EU and it came into force in 2007 (Regulation 1907/2006). Virtually every Website: http://www.eventseye.com/fairs/f-modernpak-3451-1.html
industrial sector, from automobiles to textiles, is affected by this policy. REACH requires chemicals http://www.zv.hr/fairs-2863/modernpak-3110/visitors-3112/about-fair-3113/3113
produced or imported into the EU in volumes above 1 ton per year to be registered with a central Description: All relevant international and local manufacturers of equipment, finished products
database handled by the European Chemicals Agency (ECHA). U.S. companies without a presence in and auxiliary materials in the field of printing, paper, packaging materials and the
Europe cannot register directly and must have their chemicals registered through their importer or EU- packaging industry will be gathered under a single roof.
based ‘Only Representative of non-EU manufacturer’. A list of Only Representatives (ORs) can be
found on the website of the U.S. Mission to the EU: Their participation in these fairs is sufficient indication that INTERGRAFIKA and MODERNPAK are the
http://export.gov/europeanunion/reachclp/index.asp most important printing and packaging industry fairs in the region.
Material Safety Data Sheets (MSDS) must be updated to be REACH compliant. For more information, AVAILABLE M ARKET RESEARCH
see the guidance on the compilation of safety data sheets:
Croatia Country Commercial Guide:
https://echa.europa.eu/documents/10162/23036412/sds_nutshell_guidance_en.pdf/5d5eff4a-
http://www.buyusainfo.net/docs/x_9017539.pdf
3596-4ba8-a4c8-3311ba4ad07b
http://export.gov/croatia/marketresearch/index.asp
U.S. exporters to the EU should carefully consider the REACH ‘Candidate List’ of Substances of Very
Institute of Packing and Graphing Art
High Concern (SVHCs) and the Authorization List. Substances on the Candidate List are subject to
http://www.ambalaza.hr/en/
communication requirements. Companies seeking to export products containing substances on the
Authorization List will require an authorization. The Candidate List can be found at:
https://echa.europa.eu/documents/10162/23036412/sds_en.pdf/01c29e23-2cbe-49c0-aca7-
72f22e101e20
28 29Nejvíce chemických látek a chemických přípravků bylo z ČR vyvezeno tradičně do Německa (podíl 22 %).
CZECH RE P UBLIC CZECH RE P UBLIC
Následují Polsko a Slovensko s 12 % podílem. Mezi další významná odbytiště patřily v loňském roce
Maďarsko s podílem 7 %, Itálie (6% podíl), Rakousko s 4% podílem, USA a Francie s 3 % podílem (graf
10.4.3).
Total Největší podíl na vývozu
Czech production má of
capacity výrobková skupina CZ-CPA
primary plastics 20.1.
amounted to one million tons in 2016 (Unipetrol PE
470 kt,
Největší Spolana
podíl PVC 130
na dovozu mělokt, Syntos
stejně jakoPS
na100 kt, etc.).
vývozu Approximately
Německo, a to 30 %. 50% of thePolsko
Následuje outputs podílem
was exported
8 %,
primarily
Francie, to EU countries.
Nizozemsko a Itálie se 6% podílem, dále Belgie s 5 %, Slovensko s 4 % a Rusko s 3 %. Nejvýraznější
podíl na vývozu měla výrobková skupina CZ-CPA 20.1.
U.S. Commercial Service Below are graphs showing imports and exports for 2016:
Contact Information
Graph 10.4.3 Foreign trade with CZ-CPA 20 products
CA P ITAL Prague NA M E Zdenek Svoboda Import territories in 2016 Export territories in 2016
P O P ULATION 10.5 million P OSITION Commercial Specialist
G D P US$ 192.9 billion (est.) E M AIL Zdenek.Svoboda@trade.gov other
Germany
CURRENCY Czech Crown (1 US$=20 CZK) P HONE (+420) 257-022-323 other
32%
Germany
30%
31%
22%
LAN G UA G E Czech France
3%
Slovakia
USA 12%
Poland
Russia 3%
8% Italy
3% France Poland
Austria 6%
SU M M ARY Slovakia
4%
Italy
6%
6% 4% 12%
The manufacture of rubber and plastic products (NACE 22) is one of the most important sectors Belgium
5%
Netherlands Hungary
6% 7%
contributing to the stability and growth of the Czech national economy. The sector accounted for 7.5
Source:
Source: CSO
CZSO,data
dataasas
ofof
3/5/2017
% of total Czech industrial production and generated revenues of $11.9 billion in 2016; exports 3 May 2017
reached $7.4 billion and imports $6.9 billion. Exports of primary plastics (HS 3901-3914) reached
$1.3 billion and imports $3.1 billion. U.S. exports of primary plastics and plastic products to the Czech CURRENT DE M AND
Republic represented $172 million, of which primary plastics accounted for $59 million. The Czech
High-performance plastics, bioplastics, biodegradable plastics, nano-composites and wood-plastics
consumption of plastics was 1.2 million tons in 2016, which represented the ninth highest
composites have good market potential. Demand for additives to improve traditional plastic
consumption among the EU member states.
performance is also high.
M ARKET DATA While typical major European plastic-consumption sectors are packaging (39.4%), construction
Annual sales of the manufacture of rubber and plastic products and the number of employees in the (20.3%), automotive (8.2%) and electrical/electronics (5.5%), the structure of Czech plastic
sector: consumption is slightly different. Due to enormous car production capacities in the Czech Republic,
the automotive and electrical/ electronical sectors consume 15-25% of rubber and plastic production.
Annual
sales
of
the
manufacture
of
rubber
and
plasBc
35 000
Average number of employees The demand for polystyrene (PS) thermal insulation in the construction sector is also high and rose to
products
30 000 a record of 62,100 tons in 2016.
13,00
P LASTIC M ACHINERY
12,63
25 000
12,31
12,00
11,96
20 000
Machinery for injection molding, extrusion and pressing is imported mainly from Germany and Italy.
US$
billions
11,00
11,07
11,24
31 283
10,67
30 101
29 166
However, imports of cheaper Asian equipment have been increasing. The U.S. import share of plastics-
28 754
28 659
28 631
28 594
28 445
28 113
15 000
10,00
9,91
9,73
10 000
processing machinery is approximately 2%; however, some American companies supply and service
9,00
8,43
European markets through their European manufacturing facilities. About 48% of plastic-packaging
8,00
5 000
waste is recycled and plastic-recycling lines are also in demand.
7,00
0
2008
2009
2010
2011
2012
2013
2014
2015
2016
2008 2009 2010 2011 2012 2013 2014 2015 2016
30
Nejvíce chemických látek a chemických přípravků bylo z ČR vyvezeno tradičně do Německa (podíl 22 %). 31
Následují Polsko a Slovensko s 12 % podílem. Mezi další významná odbytiště patřily v loňském roceYou can also read