2018 Rainforest Alliance Impacts Report - Partnership, Learning, and Change
←
→
Page content transcription
If your browser does not render page correctly, please read the page content below

2018
Rainforest Alliance
Impacts Report
Partnership, Learning, and Change
Deanna Newsom and Jeffrey C. Milder
2018 RAINFOREST ALLIANCE IMPACTS REPORT

Foreword                                                                                              4

Executive Summary                                                                                     6

  CHAPTER 1                           CHAPTER 2                           CHAPTER 3
  An Introduction to the              Report Methodology                  Our Global Reach
  Rainforest Alliance
  Sustainable Agriculture
  Certification Program

  10                                  14                                  20
  CHAPTER 4                           CHAPTER 5                           CHAPTER 6
  Protecting and Improving            Conserving Natural                  Minimizing Pesticide Use
  the Livelihoods of Farmers          Ecosystems                          and Risk
  and Farm Workers

  30                                  42                                  50
  CHAPTER 7                           CHAPTER 8
  Learning and Change                 Conclusion

  58                                  64
ANNEX A                                              ANNEX D
Global Reach, by Country                      68     Monitoring and Evaluation Indicators            79

ANNEX B                                              ANNEX E
Methodology                                    71    Bibliography                                    84

ANNEX C                                              ANNEX F
Theory of Change                               75    Endnotes                                        86

                                                                                                      3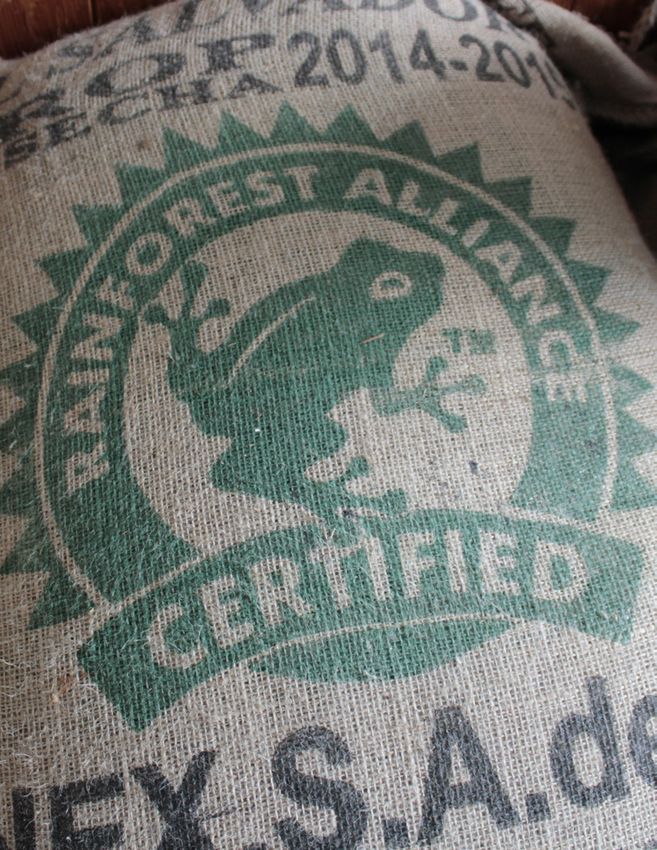
4
2018 RAINFOREST ALLIANCE IMPACTS REPORT

Foreword

As any farmer who produces Rainforest Alliance Certi-        producers that are directly involved in the program?
fied™ crops would surely attest, farms are busy places.      Learning and change: how can we be quicker and more
Farmers, hired workers, and oftentimes family mem-           effective in responding and adapting the program to the
bers are there on a daily basis, doing the hard work         sustainability challenges and opportunities that arise
that’s required to turn plants, sunshine, soil, and water    across a diverse set of crops and landscapes? Through-
into certified coffee, tea, bananas, and other products      out this report, these key aspects of the program are
that eventually make their way to markets and tables         highlighted in green-colored sidebars, as well as in a fi-
around the world. Things get even busier during a cer-       nal section on learning and change.
tification audit. Accredited auditors can spend days
on the farm, examining all aspects of an operation to        Has the Rainforest Alliance certification program been
assess compliance with the certification standard. And       successful? That question inspired the document you
long before any certification audit takes place, many        are currently reading. This 2018 Rainforest Alliance
farmers have already participated in training programs       Impacts Report presents the available evidence on the
conducted or developed by Rainforest Alliance agrono-        outcomes and impacts of the certification program.
mists or trainers; these programs cover many different       (The report focuses solely on the Rainforest Alliance
topics, such as disease-resistant plant varieties, produc-   certification program, which is being run separately
tivity-boosting pruning techniques, water conservation,      from the UTZ certification program until the publica-
and wildlife-friendly practices.                             tion of our single new standard in 2019.) In addition
                                                             to statistics and trends on the production of certified
But at the Rainforest Alliance, an enormous amount           products and the program’s geographic scope and par-
of work also occurs off the farm. We partner with or-        ticipants, the report also summarize the findings of in-
ganizations all over the globe to develop a vision and       dependent scientific studies that compare conditions
practical approach to sustainability that guide us when      on Rainforest Alliance Certified farms with those on
revising our standard, designing training programs, or       non-certified farms. And it analyzes data from certifi-
planning on-the-ground projects. Implementing this           cation audit reports to understand how certification is
approach often requires focusing extra attention on          addressing three important issues: protecting farmer
specific topics and contexts. For example, exposure to       and farm-worker livelihoods; conserving natural eco-
pesticides has been shown to cause asthma, neurolog-         systems; and reducing pesticide use and risk.
ical problems, and other illnesses among the children
of farm workers; how can this outcome be prevented?          The impacts and partnerships featured in this report link
Many farm families lack sufficient food to eat; what can     the Rainforest Alliance certification program to broader
be done to address this cruel irony? Partnerships—with       global shifts: the movement toward a world where agri-
the ISEAL Pesticides Working Group, the Global Living        culture is productive, efficient, and sustainable; where
Wage Coalition, and other issue-specific initiatives—en-     farmers and farm workers have a decent standard of
able the Rainforest Alliance certification program to        living; and where rural landscapes and communities are
devise collective strategies aimed at tackling these com-    healthy, resilient, and protective of forests, ecosystems,
plex problems. Rainforest Alliance’s recent merger with      and wildlife. We are proud to be a part of this movement
UTZ, which has operated its own successful agriculture       and invite you to join us.
certification program for over a decade, promises to be
our most powerful partnership yet.

This brings us to the key themes for this report: part-
nership, learning, and change. Partnership: how can we
better collaborate to address deeply rooted sustainabil-
ity challenges, and expand the reach and impact of sus-                          Han de Groot
tainable agriculture beyond the more than 1.3 million                            CEO

                                                                                                                     5
6
2018 RAINFOREST ALLIANCE IMPACTS REPORT
Executive
As the year 2018 begins, many environmental and social
challenges loom larger than ever: rural poverty remains
widespread, deforestation and ecosystem degradation
Summary
continue nearly unabated, and climate change threat-
ens our ability to feed a growing population. Farmers
and farm workers tend to experience these challenges
especially acutely.
The Rainforest Alliance was founded in 1987 to address
these complex issues in the context of rural landscapes
and commodity value chains. The organization seeks
to conserve biodiversity and support sustainable live-
lihoods by transforming land-use practices, business
practices, and consumer behavior. The Rainforest Alli-
ance’s sustainable agriculture certification program is
a primary means of doing so. This program includes a
sustainability standard, auditing processes, and a con-
sumer-facing label, as well as training and other support
to facilitate the transition to sustainable agriculture.
These activities are implemented or supported with a
wide range of partners, including agronomists, trainers,
certification bodies, scientists, government officials, pri-
vate companies, and other innovators who have joined
forces to devise solutions to these urgent problems.
At the close of 2017, the Rainforest Alliance certifi-
cation program included about 1.3 million farmers in
57 countries, covering a total area of about 3.5 million
hectares. Production from Rainforest Alliance Certified
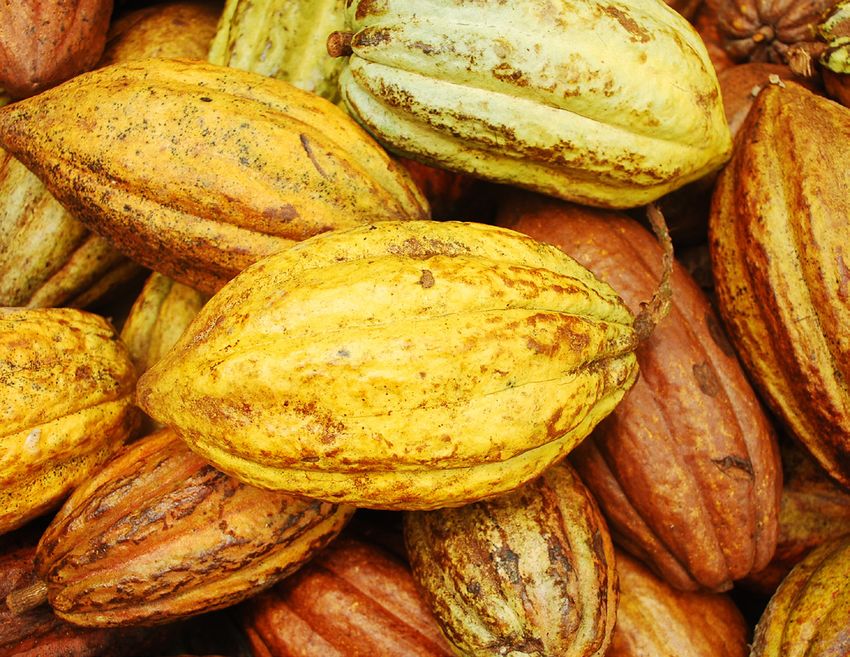
farms accounted for approximately 10.2 percent of the
world’s total production of cocoa, 19.9 percent of the
world’s tea, 5.6 percent of the world’s coffee, and 6.4
percent of the world’s bananas, as well as smaller pro-
portions of numerous other crops.
As part of its commitment to monitoring, evaluation,
and learning, the Rainforest Alliance regularly takes
stock of available evidence to assess the results and ef-
fectiveness of its certification program. This work draws
on a diversity of information including data on the size,
location, and characteristics of certified farms; audit
reports that document levels of compliance with the
certification standard; independent scientific research
that compares certified farms to their non-certified
neighbors; and firsthand observations from farmers,
scientists, and other experts. We present this informa-
tion to our stakeholders—including producers, com-
modity-buying companies, and the general public—and
use it to better understand and improve the impacts of
this program.
The first comprehensive impacts report on the Rainfor-
est Alliance certification program covered the time peri-
od from 2010 through the end of 2014. The current re-
port continues where that one left off, evaluating results
through the close of 2017 and incorporating scientific
literature up until the date of its publication. This report
begins by presenting a snapshot of the distribution and
characteristics of Rainforest Alliance Certified farms
7
Workers apply Rainforest Alliance Certified stickers to banana bunches at the Platanera Río Sixaola farm in Costa Rica.

and identifies trends over time. It then focuses on three            certified farms were members of a group. While 82
topics of special interest: improving the livelihoods of             percent of group members are smallholder farm-
farmers and farm workers; conserving natural ecosys-                 ers with farms of 2.0 hectares or less, large farms
tems; and minimizing pesticide use and risk. Throughout              (greater than 50 hectares) make up the majority of
the report, we also highlight key partnerships through               certified farm area in Mesoamerica, South America,
which the Rainforest Alliance works to address these                 East and Southeast Asia, and South Asia.
topics. We conclude by illustrating how the organiza-
tion uses monitoring and evaluation results to improve          •    Banana and tea operations in all regions were
its programs and by highlighting some upcoming im-                   widely compliant with the certification criteria
provements to the M&E system.                                        we examined related to improving livelihoods for
                                                                     farmers and farm workers (demonstrating aver-
The report draws the following conclusions:                          age compliance scores of 80 or above, out of 100)1.
                                                                     Cocoa and coffee farms also performed well, with
•   The certified farm area and crop production vol-                 average scores above 80 for the vast majority of
    ume continues to increase in some sectors while                  criteria. Lower compliance (average scores of 60
    remaining flat in others. The production of certi-               or less) was observed in some regions for criteria
    fied bananas increased markedly since 2015, par-                 related to annual medical exams for workers con-
    ticularly in Colombia and Ecuador, and the produc-               ducting hazardous tasks and/or applying agro-
    tion of certified tea continues its steady upward                chemicals, and soil and crop fertilization programs.
    growth. The area of Rainforest Alliance Certified
    cocoa farms declined in 2015 but has since stabi-           •    Certificates for all crops in all regions had average
    lized, while certified coffee farm area and produc-              compliance scores of 80 or above for six of the 10
    tion volumes both increased in the past three years,             criteria we examined related to the conservation
    recovering somewhat from a dip between 2013                      of natural ecosystems. Areas of consistently good
    and 2014.                                                        performance included the protection of nearby
                                                                     natural areas and wildlife habitat, and the creation
•   Africa continues to dominate the portfolio. By                   of buffers between natural areas and agrochem-
    the close of 2017, the top six countries, in terms of            ical-use areas. Many crop-region groupings per-
    number of certified farms, were located in Africa.               formed poorly (with average scores below 70) for
    Côte d’Ivoire and Kenya contained the largest and                criteria addressing buffers between crop areas and
    third largest total certified area, respectively.                aquatic areas or areas of human activity, a result
                                                                     that is likely due to the difficulty of smallholders al-
•   Group certification is widespread within the Rain-               locating their limited land to such buffer zones.
    forest Alliance program. At the close of 2017, 43
    percent of Rainforest Alliance certificates were            •    Certificates for all crops in all regions had average
    group certificates, and more than 99 percent of                  compliance scores of 80 or above for seven of the

8
14 criteria we examined related to minimizing                fied farms may reflect the widespread implementa-
    pesticide use and risk. The areas with consistently          tion of certain sustainable farming practices across
    good performance included the criteria aimed at              the entire Costa Rican banana sector.
    eliminating the most toxic pesticides, and criteria
    that seek to prevent excess chemical application         •   The Rainforest Alliance certification program
    and fumigation. Performance was mixed with re-               is supporting continuous improvement among
    gard to the storage and transport of agrochemicals,          farms and farmer groups that remain certified for
    with no clear trends across crop-region groupings.           multiple years. When compliance scores were av-
                                                                 eraged across all crop-region groupings, we found
•   Two recent independent studies found that Rain-              that certified operations increased their scores
    forest Alliance certification was associated with            by at least 10 points for five of the 41 certifica-
    higher household incomes and lower rates of pov-             tion criteria that we examined in this report (and
    erty for coffee-farming households, compared to              decreased their compliance scores by at least 10
    non-certified farms. One study, conducted in Ethio-          points for two of the criteria). The focus on contin-
    pia, attributed these differences to the price premi-        uous improvement is now being advanced further
    um paid to certified farmers, while the other, con-          with the implementation of the new Rainforest
    ducted in Uganda, attributed it to the significantly         Alliance Sustainable Agriculture Standard, which
    higher productivity of certified farms. A third inde-        went into effect in July 2017. This standard codifies
    pendent study found that certified cocoa farmers             continuous improvement by requiring time-bound
    in Ghana reported positive change in income, sav-            changes related to key elements of sustainability.
    ings, and numerous other financial variables since
    achieving certification, in contrast to non-certified    The positive results described above are the direct re-
    farmers, who reported either no change or nega-          sult of years—and sometimes decades—of collaborative
    tive change over the same time period.                   effort, but there is much more to be done. The new 2017
                                                             Rainforest Alliance Standard brings a more rigorous,
•    Three recent independent studies found that             science-based, and farmer-centric approach to address-
     Rainforest Alliance certification had a positive        ing key topics, including ecosystem conservation and
     effect on forest quality. Two studies examined the      restoration, living wage and living income, pesticides,
    “forest coffee” region of Ethiopia. One found im-        and worker wellbeing. New and existing partnerships
     provements in forest quality on certified forest cof-   support efforts to address complex sustainability issues
     fee areas over a five-year period, and drastic forest   by working collaboratively with industry, government,
     degradation on non-certified areas over the same        producer associations, and other certification pro-
     time period, with the positive changes extending        grams. And new upgrades to the certification program’s
     beyond the boundaries of the certified coffee areas.    monitoring and evaluation system will bring new data
     The other study found that the premium associated       and insight to better document on-the-ground impacts,
     with certified coffee helped incentivize farmers to     and support sound decision-making and continuous im-
     maintain forest production systems that are valu-       provement by certified producers and the program itself.
     able for biodiversity. In the third study, conducted    As we learn more about the successes and challenges of
     in Ghana, certified farmers reported increases in       our certification program, we work to strengthen it on a
     the number of native shade trees and the presence       continual basis, together with forward-looking farmers
     of vegetative barriers, while non-certified farmers     and partners around the world.
     reported no change or a decrease in these vari-
     ables over the same time period.

•   One recent independent study found that Rain-            A woman sorts coffee beans on a farm in Ethiopia.
    forest Alliance certification had a positive effect
    on pesticide safety and the use of alternative
    pest-control practices, while a separate study
    found that certification had no effect on pesticide
    use patterns. The first study found that certified
    cocoa farmers in Ghana reported improved re-
    cordkeeping related to pesticide and fertilizer use,
    improved agrochemical storage practices, and an
    increased frequency of alternative pest-control
    measures since certification; non-certified farmers
    reported no change or a decrease in the adoption
    of these practices over the same time period. The
    second study found that pesticide usage patterns
    and bird species composition on certified banana
    farms in Costa Rica were comparable to those on
    non-certified farms, while insect diversity was low-
    er. The similarity between certified and non-certi-

                                                                                                                    9
10
2018 RAINFOREST ALLIANCE IMPACTS REPORT

CHAPTER 1                                 The Rainforest Alliance green frog seal, found on Rain-
                                          forest Alliance Certified™ coffee, bananas, and dozens
                                          of other products, is a simple symbol that represents a

An Introduction
                                          holistic sustainability approach and a rigorous imple-
                                          mentation process. This section describes the different
                                          elements of the certification program, including the

to the Rainforest
                                          Rainforest Alliance Sustainable Agriculture Standard,
                                          the certification assurance process, training and techni-
                                          cal support, and market development. Collectively, we

Alliance
                                          refer to these elements as the “Rainforest Alliance sus-
                                          tainable agriculture certification program,” or, hereafter,
                                          simply the “Rainforest Alliance certification program.”

Sustainable                               At the center of this certification program is the Rain-
                                          forest Alliance Sustainable Agriculture Standard. This

Agriculture
                                          standard was initially developed by the Sustainable
                                          Agriculture Network (SAN), a network of 11 conser-
                                          vation and rural development NGOs from an assort-

Certification
                                          ment of countries. Since November 15, 2017, this
                                          standard—formerly known as the SAN Standard—has
                                          been managed by the Rainforest Alliance, which now is

Program
                                          also responsible for other functions that were formerly
                                          conducted by the SAN, such as developing and admin-
                                          istering certification policies, auditor training programs,
                                          and the accreditation process for certification bodies.
                                          Throughout this document, we refer to the Rainforest
                                          Alliance Sustainable Agriculture Standard as the 2017
                                          Rainforest Alliance Standard.

                                           During the large majority of the evaluation period that
                                           is the focus of this report (January 2015 to December
                                           2017) the 2010 SAN Standard was in force. Therefore,
                                           we often refer to the criteria of the 2010 SAN Standard
                                           when discussing farm practice adoption and other re-
                                           sults, while also noting places where the approach of
                                           the new 2017 Rainforest Alliance Standard differs.2 The
                                           2010 SAN Standard contained 100 criteria, 23 of which
                                           were mandatory “critical criteria” that were required
                                           to be fulfilled to achieve and maintain certification. The
                                           remainder (77) were “continuous improvement criteria,”
                                           of which certified producers were required to meet a
                                           minimum percentage: at least 50 percent of all appli-
                                           cable criteria for each principle and at least 80 percent
                                           of all applicable criteria for the entire standard.3 For
                                           each criterion, auditors score the farm or farmer group
                                           that is applying for certification as either “fully compli-
                                           ant,” “non-compliant with a minor non-conformity,” or
                                          “non-compliant with a major non-conformity.”

                                          Farmer training and technical assistance supports the
                                          certification program in important ways, and is conduct-
                                          ed both in preparation for the first certification audit
                                          and as a means of promoting continuous improvement
                                          of farming practices on already-certified operations.
                                          Training programs vary in scope and length, but they
                                          generally provide in-person and online training of farm-
                                          ers and farm managers. To date, Rainforest Alliance
                                          trainers have trained thousands of farmers in 19 coun-
                                          tries, while the Farmer Training App and online training

                                                                                                   11
materials are available globally.4 The Rainforest Alliance ing improved farmer well-being, the conservation of
and its partners also develop, implement, and support biodiversity and other natural resources, and increased
other efforts to help farmers overcome the constraints farm productivity and profitability. When these out-
they face in adopting more sustainable, productive, and comes are replicated across many farms, and supported
profitable farming practices—for instance, by helping and magnified by the activities of other stakeholders,
to provide them with access to improved planting ma- they contribute to the program’s intended broader im-
terials, fertilizers, and financing for farm investments. pact—namely, that rural landscapes become sustainable
Further down the supply chain, the Rainforest Alliance and resilient. Alongside these field activities, a comple-
works to develop markets for certified products by in- mentary set of activities promotes market transforma-
creasing consumer, company, and government demand tion, consumer awareness, and supply-chain investment
for sustainably produced agricultural products. to increase the demand and business case for sustain-
able agriculture.
The relationship among these different elements of
the certification program is elaborated in a “theory of The theory of change provides a guiding framework
change,” which describes the means by which program not only for the standard-setting process but also for
activities and investments are intended to cause or monitoring, evaluating, and reporting the effects of the
contribute to the desired results. Specifically, farmer certification program. This monitoring and evaluation
training and certification at the field level are expected process, in turn, is used to adapt and improve the sys-
to improve farmer knowledge and the adoption of more tem’s standards, strategies, and activities to deliver key
sustainable farming practices. These results, in turn, are outcomes more effectively over time. The full theory of
expected to contribute to field-level outcomes, includ- change is provided in Annex C.
A Rainforest Alliance trainer meets with a cocoa farmer as part of the Climate, Nature and Communities in Guatemala pro-
gram, which supports the country in reducing the negative impacts of climate change and conserving its natural resources.
12SIDEBAR
Developing the 2017 Rainforest Alliance Standard
The sustainability standard that underlies the Rainfor-
est Alliance certification program is periodically revised
to incorporate evolving stakeholder expectations as
well as the most recent science, knowledge, and prac-
tice related to sustainable agriculture. The present
Rainforest Alliance Standard, which went into effect
in July 2017, is the result of a full, multi-year revision
process.
The standard revision process was led by the Sustain-
able Agriculture Network (SAN) and followed the best
practices outlined in the ISEAL Alliance’s Code of Good
Practice for Setting Social and Environmental Stan-
dards, including extensive processes of consultation
and technical analysis. This included four rounds of
public consultation using a variety of outreach methods
including online consultation platforms, webinars, and The revised Rainforest Alliance Standard includes a frame-
workshops, which were conducted in both urban and work for providing a living wage for farm workers, like this
rural areas to make them accessible to all stakeholders. woman on a tea estate in Sri Lanka.
These consultations resulted in feedback from more
than a thousand stakeholders in over 50 countries. As
the revision progressed, the SAN also held intensive
discussion forums with the standard’s users, including needs framework to provide a decent standard of living
producers, auditors, and sustainability advisors. In addi- for farmers and farm workers; increased protection
tion, the SAN conducted two rounds of field tests with for worker rights; the inclusion of the internationally
both smallholder groups and large plantations, applying recognized High Conservation Value concept to help
a draft of the revised standard on banana, cocoa, coffee, identify and protect key conservation values; and a new
and tea farms, as well as in cattle production systems science-based approach to pesticides, including an up-
in Africa, Asia, and Latin America. Finally, the SAN also dated list of prohibited pesticides, a new pesticide risk
conducted a special round of consultation on its new mitigation process, and the mandatory use of integrat-
list of prohibited pesticides. This process resulted in nu- ed pest management. (Please see the respective report
merous refinements that optimize the new standard’s sections on each of these topics for further detail.)
rigor, practicability, and potential for positive impact.
After the 2017 Standard was published in September
The 2017 Rainforest Alliance Standard contains many 2016, the global network of almost 400 auditors asso-
noteworthy innovations designed to further advance ciated with the program’s accredited certification bod-
sustainable livelihoods, improve farm productivity, pro- ies was trained via a half-year online forum in which
tect forests and ecosystems, and increase resiliency to SAN training managers presented updated guidance
climate change. One important change is the creation of documents and training tools. This online phase was
a “continuous improvement framework,” which defines enriched by six regional one-week training events that
three performance levels and requires time-bound im- included practical exercises to assess risk and compli-
provements related to key elements of sustainability. ance related to the new criteria, as well as field trips to
As in the 2010 SAN Standard, compliance with critical farms. The program’s technical community of auditors
criteria remains mandatory and a prerequisite for cer- and sustainability advisors has played a critical role in
tification. However, under the 2017 Rainforest Alliance teaching certified farmers and interested non-certified
Standard, non-critical or continuous improvement cri- farmers about the new standard.
teria are associated with a specific timeframe for imple-
mentation, denoted by levels C, B, and A. This phased Please note that the 2010 SAN Standard was in force
implementation approach ensures improvement over until June 30, 2017, after which date the 2017 SAN
time and guides farmers to invest in the most essential Standard (subsequently renamed the 2017 Rainforest
improvements first, while also making certification ac- Alliance Standard) took effect. Therefore, the majority
cessible, thereby encouraging more farmers to embark of the monitoring and data and evaluation findings pre-
on the journey toward sustainability. sented in this report reflect the results of the 2010 SAN
Standard and associated program elements.
Other important changes include the introduction of
the “Living Wage” concept and the associated essential – Oliver Bach, Sustainable Agriculture Network
1314
2018 RAINFOREST ALLIANCE IMPACTS REPORT

CHAPTER 2                                 The Rainforest Alliance operates a monitoring and
                                          evaluation (M&E) system for its agriculture certifica-
                                          tion program to assess the extent to which the desired

Report
                                          results identified in the theory of change are being
                                          achieved. Designed in accordance with the ISEAL Alli-
                                          ance’s Code of Good Practice for Assessing the Impacts

Methodology
                                          of Social and Environmental Standards Systems (ISEAL
                                          Impacts Code), the M&E system utilizes multiple data
                                          sources and approaches to monitor results, assess the
                                          program’s effectiveness, and identify opportunities
                                          for improvement (see Table 1). Consistent with the
                                          approach recommended by the ISEAL Alliance, the
                                          M&E system collects, analyzes, and synthesizes many
                                          different types of information from both internal and
                                          external sources, including regular on-farm audits, data
                                          collected through specialized monitoring tools and ini-
                                          tiatives, and impact evaluation studies conducted by
                                          independent researchers. See Annex D for more detail
                                          about each element of the M&E system.

                                          The information gathered though the M&E system is
                                          analyzed, communicated, and applied in multiple ways.
                                          Most fundamentally, the information is used to moni-
                                          tor performance and progress relative to the theory of
                                          change outcomes, and to share these results, both pos-
                                          itive and negative, with stakeholders and partners. Re-
                                          latedly, M&E data support the certification program’s
                                          commitment to transparency—for instance, through
                                          the publication of a full, updated map of all Rainforest
                                          Alliance certificates5 and their basic attributes. Insights
                                          from the M&E system are also used to help customize
                                          farmer training programs, quickly pinpoint implemen-
                                          tation challenges reflected in lower compliance scores,
                                          and periodically revise the certification standard. See
                                          Chapter 7 for more information about the ways that
                                          M&E data are being used to improve the certification
                                          program, as well as an overview of some current efforts
                                          to improve and upgrade the M&E system.

                                          Data Sources

                                          The evidence presented in this report falls into four
                                          main categories:

                                          1.   Basic statistics on the program’s geographic, sec-
                                               toral, and market reach and characteristics
                                          2.   Rates of compliance with criteria in the certifica-
                                               tion standard
                                          3.   Results of scientific studies conducted by indepen-
                                               dent third parties
                                          4.   Interviews with scientists and farm workers

                                          Each of these sources of evidence is described in great-
                                          er detail below, and in Annex C.

                                          The reach and characteristics of the Rainforest Alli-
                                          ance’s certification program are analyzed using infor-
                                          mation on the area (in hectares) and amount of product
                                          grown (in kg) on each certified farm or group of farms.

                                                                                                  15
TABLE 1 Overview of the monitoring and evaluation system
results level sections of this report where
(from Theory of Change) data sources and methods results are presented
Elements of the Rainforest Alliance Introduction to the Certification
Support strategies certification program, including Program (page 11)
standards, policies, training pro-
grams, market development, and
partnerships.
Reach of the Rainforest Alliance Our Global Reach (page 21)
Outputs system; characteristics of partic-
operations, farmers, and ipating operations, farmers, and Annex A: Global Reach, by Country
lands to which support strat- lands; and trends over time are (page 68)
egies are applied analyzed based on data from the
Rainforest Alliance Certificate
Database.
Changes in farm practices are ana- Practice adoption data are
Direct results lyzed based on audit conformance presented related to farmer and
short-term effects on farm data for selected crops and regions. farm worker livelihoods (page 32),
practices, management More detailed evaluation of prac- natural ecosystem conservation
systems, and purchasing tice adoption (including compari- (page 44) and pesticide use and risk
decisions sons to non-certified farms) is the (page 53).
focus of several scientific studies
reviewed in this report.
Sustainable (certified) purchasing Data on market share and sales are
is tracked through Rainforest reported in the Executive Summary
Alliance’s traceability database and (page 7) and in Our Global Reach
market share analysis. (page 21).
Intermediate results at the farm Intermediate results are reviewed
Intermediate results level are assessed through con- related to farmer and worker liveli-
changes in social, environ- text-specific evaluation studies hoods (page 34), natural ecosystem
mental, and farm productivity conducted by third-party research- conservation (page 45) and pesti-
outcomes—and in business ers or, in some cases, with the cide use and risk (page 52).
practices and policies—re- involvement of NGOs that provide
sulting from support strate- certification training and support.
gies and direct results Many of these studies include com-
parisons to non-certified farms.
Broader impacts (beyond the Broader results related to coffee
Broader impacts farm level) are assessed through certification are reviewed in the
transformation of farming context-specific evaluation studies section on natural ecosystem con-
landscapes toward long-term conducted by third-party re- servation (page 45).
sustainability searchers. To date, broader impact
studies are available only for
coffee-producing landscapes.
16These data are then aggregated by region and crop, three of the 2010 SAN Standard through November
and when possible, are presented as a time series to 30, 2015, and version four of the 2010 SAN Standard
illustrate multi-year trends. The data analyzed in this from December 1, 2015 to June 30, 2017. Changes
section are derived from the Rainforest Alliance Certif- made from version three to version four were limited to
icate Database, and reflect the certification portfolio as a handful of criteria and do not significantly affect the
of December 31, 2017. analysis of compliance data during the 2015-2016 peri-
od. Criteria numbers cited in this report refer to those in
In addition to information on the basic characteristics the 2010 SAN Standard version 4.
of each certificate, the report draws upon audit data
documenting each certificate’s level of compliance (full, For the analysis of audit compliance data, we select-
partial, or non-compliance) with each of the 100 criteria ed a sample of key crops and regions: banana farms in
in the 2010 SAN Standard. These compliance data are Central and South America; cocoa farms in West Africa,
recorded in each certificate’s annual audit report and South America, and Indonesia; coffee farms in Central
are based on auditors’ field observations, interviews, America and Brazil; and tea farms in East Africa, India,
and analyses of farm records and other documentation. and Indonesia. To enable time-series assessments, this
Compliance data analyzed in this report are based on analysis was limited to operations that had been certi-
the version of the 2010 SAN Standard in force at the fied for at least two years and had available compliance
time of each audit report within the dataset: version data from a recent audit (usually 2015 or 2016) and at
Auditors survey the Finca San Francisco coffee farm in Guatemala.
17Auditors review ledgers on a cocoa farm in Ghana. Part of the audit process includes documenting traceability.
least one earlier audit (2012–2015). For crop-region
Number of certified operations in- groupings with more than 100 such certificates, a ran-
TABLE 2 cluded in the compliance analysis for dom sample was selected for analysis. In crop-region
each crop-region grouping groupings with fewer certificates that met these param-
eters, all operations with at least two years of compli-
ance data were included in the analysis (see Table 2). In
total total, this analysis included 383 certificates encompass-
certificates certificates in ing 224,262 individual farms.
included in crop-region
analysis grouping For each time period (“most recent audit” and “older
audit”), the average compliance level was calculated
banana - 66 138 for each crop-region grouping (for example, bananas
Central in in Central America or coffee in Brazil) against each
America 2010 SAN Standard criterion. This score was calculat-
ed by assigning 100 points for full compliance with a
banana - 66 248 given criterion, 50 points for partial compliance (i.e., a
South America minor non-conformity), and 0 points for non-compli-
ance (i.e., a major non-conformity). For example, the
cocoa - 10 10 compliance score for the criterion related to soil ero-
Indonesia sion control measures for a hypothetical region that
had four certificates, two in full compliance with this
cocoa - 58 186 criterion and two in partial compliance, would be 75
West Africa ((100+100+50+50)/4).
cocoa - 15 36 For each of the topics that this report examines in depth—
South America protecting the livelihoods of farmers and farm workers,
conserving natural ecosystems, and decreasing the
coffee - Brazil 30 73 risks of pesticide use—the focus was on the 10 to 20 cri-
teria that most directly addressed that topic. For exam-
coffee - 58 278 ple, the examination of farmer and worker livelihoods
Central considered criteria related to access to medical services
America (criterion 5.16), fair wages (criterion 5.5), clean and safe
housing (criterion 5.14), and others. The compliance
tea - India 52 117 data for each selected set of criteria were analyzed to
characterize performance levels during the most recent
tea - Indonesia 8 15 time period, assess changes over time, and highlight any
crop-region groupings with notably high or low rates of
tea - 20 98 compliance, as well as those with substantial changes in
East Africa compliance. Criterion-level information on compliance
18and trends for each crop-region grouping helps to high-
light areas and topics for which sustainable practices
are well entrenched among certified farms, as well as
areas of persistent challenge where additional training,
support, and partnerships may be required to overcome
barriers to improvement.
The report also presents the results of studies conduct-
ed by academic researchers or other scientists, inde-
pendent of the Rainforest Alliance. Such studies can be
particularly insightful, as they are typically designed to
assess attribution—that is, they use rigorous method-
ologies that allow researchers to determine whether
differences between certified farms and non-certified
farms are attributable to the Rainforest Alliance certifi-
cation program or to other factors. In sidebars through-
out this report, the results of new scientific studies (pub-
lished since the 2015 SAN/Rainforest Alliance Impacts
Report) are summarized. These studies examine farm
productivity and farmer poverty on cocoa and coffee
farms (page 34), forest quality on and around certified
cocoa and coffee farms (page 45), and practices related
to pesticide use and pesticide alternatives on cocoa and
banana farms (page 52).
Finally, the report also contains interviews with farmers
who participate in the Rainforest Alliance certification
program and scientists who have worked closely to help
Members of the Rainforest Alliance Certified Maraba small- develop, implement, or evaluate the 2017 Rainforest
holder coffee cooperative in Butare, Rwanda sort beans at Alliance Standard and the Rainforest Alliance certifica-
the cooperative’s washing station. tion program. These narratives supplement the report’s
scientific data with rich observations from the field.
SIDEBAR
The Rainforest Alliance-UTZ Merger
In June 2017, the Rainforest Alliance and UTZ an-
nounced their intent to merge. This decision was mo- Han de Groot, former UTZ executive director and new
tivated by the desire of both organizations to increase Rainforest Alliance CEO, with former Rainforest Alliance
the reach, positive impact, and value to farmers of certi- president Nigel Sizer, now the organization’s chief program
fication, training, and other programs. In early 2018, the officer.
merger became official, and the new organization—also
called the Rainforest Alliance—is now in a stronger po-
sition to tackle today’s urgent environmental and social
challenges, including climate change, deforestation, ru-
ral poverty, and unsustainable farming practices.
Currently and for the near future, the new organization
continues to operate the existing Rainforest Alliance
and UTZ certification programs side by side while a
new, unified certification program and standard are
developed. The new Rainforest Alliance also intends to
broaden the scope of its work on policy, advocacy, and
landscape-level partnerships to address deep-seated
sustainability challenges and increase the scale and im-
pact of the organization’s work.
1920
2018 RAINFOREST ALLIANCE IMPACTS REPORT

CHAPTER 3                                 The reach of the Rainforest Alliance sustainable agri-
                                          culture certification program has continued to grow,
                                          with the number of Rainforest Alliance Certified farms

Our Global Reach
                                          reaching 1.3 million by the close of 2017 (Figure 1). To-
                                          tal certified farm area dipped in 2015 but rose again in
                                          recent years, reaching 3.5 million hectares by the end of
                                          2017 (Figure 2). Similarly, the total area used to produce
                                          certified crops—which excludes farm areas used for in-
                                          frastructure, conserved as natural ecosystems, or pro-

                                                               Growth in Rainforest Alliance
                                            FIGURE 1
                                                               Certified producers

                                          1,400,000

                                          1,200,000

                                          1,000,000

                                           800,000

                                           600,000

                                           400,000

                                           200,000

                                                  0
                                                        2009      2011      2013      2015      2017

                                                               Rainforest Alliance Certified produc-
                                                               tion area and total area (in hectares).
                                                               Production area refers to land under
                                                               certified crops only. Total area refers
                                                               to the total size of certified farms,
                                            FIGURE 2
                                                               including on-farm infrastructure,
                                                               conservation areas, and land devoted
                                                               to crops and livestock that are not
                                                               commercialized as Rainforest Alliance
                                                               Certified.

                                             production area       total area

                                          3,500,000

                                          3,000,000

                                          2,500,000

                                          2,000,000

                                          1,500,000

                                          1,000,000

                                           500,000

                                                  0
                                                        2009      2011      2013      2015      2017

                                                                                                    21
Number of Rainforest Alliance agri- Number of Rainforest Alliance
FIGURE 3 culture certificates per country, as of FIGURE 5 Certified farms per country, as of
December 2017 December 2017
Colombia Kenya
Ecuador Côte d’Ivoire
Guatemala Tanzania
India Rwanda
Côte d’Ivoire Burundi
Kenya Ghana
Costa Rica Indonesia
Brazil Turkey
El Salvador Uganda
Nicaragua Ethiopia
all others all others
0 100 200 300 400 500 600 700 0 200K 400K 600K 800K
Percentage of Rainforest Percentage of Rainforest Alliance Cer-
FIGURE 4 Alliance certificates by region, as of FIGURE 6 tified farms by region, as of December
December 2017 2017
Caribbean 1.5% other 1.6% North Africa & South America 2.1%
East & Southeast Asia Middle East 2.6% South Asia 1.8%
West & East & other 1.1%
Central 5.9% Southeast
Africa Asia
8.2% South 4.6%
America
35.5% West &
South
Asia 9% Central 12.1%
Africa
East & 12.2%
Southern
Africa
26%
75.6%
Mesoamerica East &
Southern Africa
ducing non-certified crops—rose notably over the past
two years, reaching 2.2 million hectares by the end of number of farms per country. Kenya, with its vast
2017 (Figure 2). groups of smallholder tea farmer cooperatives man-
aged by the Kenya Tea Development Agency (KTDA),
Where and With Whom We Work contains by far the largest number of certified farms,
at nearly 750,000. The five countries with the next
At the close of 2017, there were 2,135 active Rainfor- highest numbers of certified farms are also located in
est Alliance agriculture certificates in 57 countries. The Africa: Côte d’Ivoire, Tanzania, Burundi, Rwanda, and
countries with the most certificates were Colombia Ghana. Not surprisingly, Africa dominates the regional
(254), followed by Ecuador (244) and Guatemala (182). breakdown of farm numbers, with nearly 90 percent
The past three years saw substantial growth in the num- of certified farms located there (75.6 percent in East
ber of certificates in Colombia and Ecuador due to an and Southern Africa; 12.1 percent in West and Central
increase in certified banana farms in those countries. Africa).
Globally, more than 60 percent of certificates are locat-
ed in South America or Mesoamerica. Shifting lenses again, to look at the total certified area
by country, reveals yet a different picture. Côte d’Ivoire
The picture changes, however, when the focus is shift- dominates, with 618,000 hectares, followed by Brazil
ed from the number of certificates per country to the (367,000 hectares), Kenya (362,000 hectares), and In-
22Rainforest Alliance Certified land Rainforest Alliance Certified crops by
FIGURE 7 area per country (in hectares), as of FIGURE 9 production area (in hectares), as of
December 2017 December 2017
Côte d’Ivoire cocoa
Brazil tea
Kenya coffee (arabica)
India banana
Ghana oil palm
Colombia orange
Indonesia pineapple
Guatemala rubber
Peru coffee (robusta)
Ethiopia cattle
all others all others
0 200K 400K 600K 800K 1M 1.2M 0 200K 400K 600K 800K
largest Rainforest Alliance Certified crops by produc-
Percentage of Rainforest Alliance tion area: cocoa, coffee, tea, and bananas. For banan-
FIGURE 8 Certified land area by region, as of as, the production area and quantity of fruit produced
December 2017 increased markedly since 2015, jumps that are attrib-
utable primarily to the growth in Rainforest Alliance
banana certification in Colombia and Ecuador. Tea
North Africa & Caribbean 1.1% production area and quantity experienced consistently
Middle East 1.4% other 0.4% steady growth over time. Rainforest Alliance Certified
East & Southeast Asia West & cocoa production area and quantity both contracted
Central Africa between 2014 and 2015, then showed modest growth
Mesoamerica 6.3%
25.5%
between 2015 and 2017. This trend can largely be at-
9.7% tributed to a temporary mismatch between the supply
and demand for certified cocoa: despite buyer commit-
ments to purchase Rainforest Alliance Certified cocoa
South 9.9% in the early 2010s, some purchases took longer than ex-
Asia
pected to materialize, while other publicly-stated com-
pany commitments to third-party certification were
23%
22.7%
East & South A cocoa nursery in Côte d’Ivoire, home to more Rainforest
Southern America
Africa Alliance certified land area than any other country.
dia (244,000 hectares). Regionally, Africa accounts for
48.2 percent of the total certified farm area.
Rainforest Alliance Certified Crops
Nearly 750,000 hectares of farmland produce Rain-
forest Alliance Certified cocoa, roughly one-third of all
Rainforest Alliance Certified crop production area. Tea
and coffee are the next most dominant crops by pro-
duction area, followed by banana and oil palm. Accord-
ing to the most recent data available, production from
Rainforest Alliance Certified farms was estimated to ac-
count for 10.2 percent of the total global production of
cocoa, 19.9 percent of the world’s tea, 5.6 percent of the
world’s coffee, and 6.4 percent of the world’s bananas.6
The figures on pages 24 and 25 show trends in produc-
tion area and quantity of crop produced for the four
23Rainforest Alliance Certified coffee Rainforest Alliance Certified cocoa
FIGURE 10 FIGURE 13
production area (in hectares) production area (in hectares)
500,000 900,000
400,000 700,000
300,000
500,000
200,000
300,000
100,000
100,000
0 0
2010 2011 2012 2013 2014 2015 2016 2017 2010 2011 2012 2013 2014 2015 2016 2017
Rainforest Alliance Certified coffee Rainforest Alliance Certified cocoa
FIGURE 11 FIGURE 14
production (in metric tons) production (in metric tons)
600,000 600,000
500,000 500,000
400,000 400,000
300,000 300,000
200,000 200,000
100,000 100,000
0 0
2003 2005 2007 2009 2011 2013 2015 2017 2005 2007 2009 2011 2013 2015 2017
Rainforest Alliance Certified coffee Rainforest Alliance Certified cocoa
FIGURE 12 FIGURE 15
production, by country production, by country
El Salvador
1.2% Tanzania
Guatemala
Colombia 5.9% 1.7%
Honduras Uganda 2.2% Nigeria
14.5% 5.1%
1.3%
Kenya Ecuador
2.3% Côte d’Ivoire
Costa 7.6%
61.1%
Rica
Brazil Vietnam
5%
34.8% 3.8%
1.2%
Ethiopia 3.3%
Peru Ghana
other
7.1% 16.4%
Mexico 1.4% 4.1% 1.5%
1.3% Indonesia
India 1.1%
Tanzania Dominican 4.9% 5.6%
Nicaragua 5.7%
Indonesia Republic
other
24Rainforest Alliance Certified tea Rainforest Alliance Certified banana
FIGURE 16 FIGURE 19
production area (in hectares) production area (in hectares)
600,000 180,000
500,000 150,000
400,000 120,000
300,000 90,000
200,000 60,000
100,000 30,000
0 0
2010 2011 2012 2013 2014 2015 2016 2017 2010 2011 2012 2013 2014 2015 2016 2017
Rainforest Alliance Certified tea Rainforest Alliance Certified banana
FIGURE 17 FIGURE 20
production (in metric tons) production (in metric tons)
1,200,000 8,000,000
7,000,000
1,000,000
6,000,000
800,000
5,000,000
600,000 4,000,000
3,000,000
400,000
2,000,000
200,000
1,000,000
0 0
2009 2011 2013 2015 2017 2010 2011 2012 2013 2014 2015 2016 2017
Rainforest Alliance Certified tea Rainforest Alliance Certified banana
FIGURE 18 FIGURE 21
production, by country production, by country
Bangladesh Zimbabwe
Tanzania Turkey Philippines
1% 1.2% Ecuador
Argentina 1.8% 1.9% 15.3% 3% Guatemala
Sri Lanka Mexico 20.6%
3.6%
5.9%
1.5%
Indonesia Kenya
1.4% China Panama 3% Colombia
5.9% 44.7% 1.2% Dominican
22.1%
Republic
1.6% Vietnam
1.8% Cameroon
2.3% Costa Rica 2.4% Côte d’Ivoire
India 2% 20%
20.5% Honduras
Malawi 2.5% other 2.1%
Uganda 6.1% 1.1%
3.8%
Rwanda other
Belize
25FIGURE 22 General distribution of Rainforest Alliance Certified crops in the Americas
bananas coffee fruit pineapple tea other
cocoa flowers grapes spices vegetables
26FIGURE 23 General distribution of Rainforest Alliance Certified crops in Europe, Africa, and the Middle East
bananas coffee pineapple tea
cocoa fruit spices vegetables
27FIGURE 24 General distribution of Rainforest Alliance Certified crops in Asia
bananas coffee grapes spices vegetables
cocoa fruit pineapple tea other
dropped altogether. This limited demand disappointed farm-by-farm certification model is often inaccessible
some cocoa farmers who had become certified between to smallholders, who may find it difficult for their small
2011 and 2014, leading to the decrease seen in 2015. operations to shoulder the administrative and financial
Coffee production area continued to recover from a dip requirements of the certification and audit process. To
between 2013 and 2014. The quantity of certified cof- address this potential barrier, in 2004 the SAN launched
fee also rose in both 2017, sustaining a trend of moder- the group certification model, which spreads the cost of
ate growth that followed a period of rapid growth from the certification audit over tens, hundreds, and some-
2009 to 2013. times thousands of individual farmers, and relies on
a “group administrator” to provide training, verify the
The Role of Smallholder Farmers in the Rainforest Alli- compliance of individual group members with the cer-
ance Certification Program tification standard, ensure certified and non-certified
products are kept separate, and assess and mitigate any
Rainforest Alliance agriculture certification is available risks. The responsibilities of the group administrator
to all farms within the program’s commodity and geo- are specified in the Group Certification Standard.
graphic scope, regardless of size. A primary objective of
the program is to improve the livelihoods of smallholder In the 14 years since its creation, the group model has
farmers—those who rely primarily on family or house- grown in both size and scope. It now accommodates
hold labor (or reciprocal workforce exchange with other traditional farmer cooperatives, outgrower models, and
members of the community) and who typically farm no structures where a government or non-governmental
more than a few hectares of land. Yet, the traditional entity serves as the group administrator. Today, 43 per-
28Percentage of Rainforest Alliance Percentage of total Rainforest Alli-
FIGURE 25 Certified farms in each size category, FIGURE 26 ance Certified land area in each size
by region category, by region
0–2 ha 2.1–50 ha >50 ha 0–2 ha 2.1–50 ha >50 ha
Mesoamerica Mesoamerica
Caribbean Caribbean
South America South America
Central & Eastern Europe Central & Eastern Europe
North Africa & Middle East North Africa & Middle East
West & Central Africa West & Central Africa
East & Southern Africa East & Southern Africa
South Asia South Asia
East & Southeast Asia East & Southeast Asia
0% 20 40 60 80 100 0% 20 40 60 80 100
cent of Rainforest Alliance certificates are group certif- Central and Eastern Europe, Southern Africa, and South
icates, and more than 99 percent of certified farms are Asia are more than one percent of farms larger than 50
members of a group. hectares, with the percentage of large farms in these re-
gions ranging from 2.3 to 7.3.
The proportion of smallholders in the Rainforest Al-
liance portfolio varies considerably by region. When Although there are comparatively few certified farms
farmer numbers alone are examined, the dominance of of 50 hectares or more, these farms make up the lion’s
smallholders in the portfolio is evident (Figure 25). In share of total certified area in many regions (Figure 26).
East and Southeast Asia, East and Southern Africa, and More than two-thirds of the total certified area in East
North Africa and the Middle East, more than 90 percent and Southeast Asia, Mesoamerica, South America, Cen-
of certified farms are two hectares or less in size. This tral and Eastern Europe, and South Asia is composed of
contrasts with the Caribbean, South America, Cen- large farms. In contrast, only one region—North Africa
tral and Eastern Europe, and West and Central Africa, and the Middle East—can say that smallholder farms of
where more than 90 percent of certified farms are be- two hectares or less make up more than half of its total
tween 2.1 and 50 hectares in size. Only in Mesoamerica, certified area.
FIGURE XX Where Rainforest Alliance Certified products are produced and sold
Certified products are: produced and sold produced only sold only
2930
2018 RAINFOREST ALLIANCE IMPACTS REPORT

CHAPTER 4                                 One of the core goals of the Rainforest Alliance certifi-
                                          cation program is to improve the livelihoods of farmers,
                                          farm workers, and their families. Fundamental to sus-

Protecting and
                                          tainable livelihoods is the ability of persons to meet ‘es-
                                          sential needs’ and attain a decent standard of living for
                                          themselves and their families through safe and dignified

Improving the
                                          work. Essential needs are defined as the basic elements
                                          required for survival and prosperity. According to the
                                          Global Living Wage Coalition7, these include food, wa-

Livelihoods of
                                          ter, housing, education, health care, transport, clothing,
                                          and provision for unexpected events.

Farmers and
                                          Farm owners may fulfill essential needs for themselves
                                          and their families in different ways than farm workers,
                                          reflecting the different characteristics of the cash in-

Farm Workers
                                          come and benefits that each earns or can access in other
                                          ways. These differences are reflected in the require-
                                          ments of the the 2017 Rainforest Alliance Standard
                                          (and previously, the 2010 SAN Standard). For hired
                                          farm workers, the standard contains many provisions in
                                          support of fair pay. These include a critical criterion that
                                          requires workers to be paid at least the minimum wage,
                                          with additional criteria that cap overtime hours and re-
                                          quire higher pay for overtime work and the right to bar-
                                          gain collectively for compensation and other benefits.
                                          Additionally, farm management is required to provide
                                          access to potable water and medical services during
                                          working hours. Workers who live on the farm must be
                                          provided clean, safe housing that adheres to minimum
                                          standards of safety, security, and quality. Finally, the
                                          standard specifies that farms must guarantee access to
                                          education for all school-aged children who live on the
                                          farm.

                                          For farmers who own or manage their farms (i.e., are not
                                          hired workers), access to essential needs is determined
                                          largely by their own food production and cash income,
                                          plus whatever social services and benefits are avail-
                                          able to them. Toward this end, the Rainforest Alliance
                                          certification and training programs focus on improved
                                          agricultural practices that boost farm productivity and
                                          crop quality, increase efficiencies and profitability, build
                                          stronger farm businesses, and work to connect farm-
                                          ers to better, more reliable markets that often provide
                                          market-driven price premiums. Several criteria in the
                                          standard address farm productivity, such as those on
                                          the prevention of soil erosion and the adoption of an
                                          effective soil and crop fertilization program.

                                          Many additional criteria help to protect the health and
                                          safety of farmers and farm workers who apply agro-
                                          chemicals on the job, as well as their families. These in-
                                          clude provisions for medical checkups for workers who
                                          conduct potentially hazardous activities; steps to pre-
                                          vent neighbors from being exposed to agrochemicals;
                                          mandatory use of personal protective equipment for all
                                          workers who come in contact with agrochemicals; ded-
                                          icated showers and changing rooms for workers who
                                          handle agrochemicals; and restrictions on entry to ar-

                                                                                                   31
Performance of certified farms against 2010 SAN Standard criteria related to meeting the essential
TABLE 3
needs of farmers, farm workers, and their families during the most recent audit
average compliance score: 90–100 80–89 70–79 69 or less
increase of at least 10 points since the first audit decrease of at least 10 points since the first audit
* critical criteria since the standard’s inception ** critical criteria since December 1, 2015
Central America
Central America
South America
South America
West Africa
East Africa
Indonesia
Indonesia
banana
banana
coffee
coffee
cocoa
cocoa
cocoa
Brazil
India
tea
tea
tea
Worker Wages & Rights
5.5* Workers earn at least the
minimum wage
5.7 Overtime is voluntary,
with higher pay
5.12* Workers have right to
organize
Housing & Education
5.14** Clean and safe housing
5.17 Access to education for
children living on the
farm
Health & Safety
5.15** Access to potable water
5.16 Access to medical ser-
vices
6.4 Annual medical exam if
conducting hazardous
tasks
6.5 Special medical exams if
applying agrochemicals
32You can also read