IV. Conference on Monitoring & Process Control of Anaerobic Digestion Plants - Reader
←
→
Page content transcription
If your browser does not render page correctly, please read the page content below
Reader

Reader
des Förderprogramms für energetische Biomassenutzung

IV. Conference on
Monitoring & Process Control
of Anaerobic Digestion Plants

March 26 – 27, 2019 in Leipzig, Germany
CONTENT   3

Funding program

Supported by
                                                                                              CONTENT
                                                                                                          BACKGROUND                                                                              7
Project management                   Program support                       Partners
                                                                                                          PROGRAM                                                                                 8

                                                                                              SESSION A LABORATORY MEASUREMENTS: RELIABILITY & VALIDITY

                                                                                                           Laboratory measurements: The Achilles´ heel for the anaerobic digestion
                                                                                                           of complex solid substrates (Francisco Raposo Bejines)
Imprint                                                                                                    Potential of predicting Klason-lignin in digestates by calorimetry
                                                                                                                                                                                                   13

                                                                                                           (Torsten Stefan, René Casaretto)                                                        14
Publisher                                                                                                  Measuring instruments for determining low volume flows (Holger Müller)                   16
Jan Liebetrau and Diana Pfeiffer

Contact                                                                                       Session B MODELLING, SIMULATION & CONTROL OF ADs
DBFZ Deutsches Biomasseforschungszentrum gemeinnützige GmbH
Torgauer Straße 116
D-04347 Leipzig, Germany                                                                                   Thermodynamic modelling of gas storages for optimised demand-driven
Telephone: +49 (0)341 2434-554                                                                             operation of anaerobic digestion plants (Eric Mauky, Mathias Stur, Christian Krebs)     18
Telefax: +49 (0)341 2434-133                                                                               Opening the Black Box: Coupling ADM1 with constraint-based methods to include
E-mail: diana.pfeiffer@dbfz.de
www.energetische-biomassenutzung.de                                                                        intracellular activity in anaerobic digestion modeling (Florian Centler, Sören
                                                                                                           Weinrich, Sabine Koch, Fabian Bonk, Denny Popp, Dirk Benndorf, Steffen Klamt)           20
General Managment
                                                                                                           Optimisation of the three-stage biogas upgrading process (Jürgen Kube)                  21
Scientific Managing Director
Prof. Dr. mont. Michael Nelles
Administrative Managing Director                                                              Session C BATCH & INTERLABORATORY TESTS
Dipl.-Kfm. (FH) LL.M. Daniel Mayer

Editorial stuff                                                                                            Examining the relationship between inoculum to substrate ratio and apparent
Program support of the funding program“Biomass energy use”                                                 hydrolysis rate in biogas batch test assays (Alastair James Ward)                       23
www.energetische-biomassenutzung.de
                                                                                                           Lab tests with a mini-bioreactor test system (all-in-one) for the developement of
Photos                                                                                                     standardised and storabel inocula for BMP-tests (Jörn Heerenklage,
Unless otherwise specified, DBFZ gGmbH retains the rights to images inside this publication.                Dorothea Rechtenbach, Iryna Atamaniuk, Ayah Alassali, Julius Zimmermann,
Layout                                                                                                     Niklas von Borstel, Felix Müller, Claus Marcus Tiemann, Anna Krüger,
Stephan Hautzendorfer, Angela Gröber                                                                       Anne-Catharina Graage, Kerstin Kuchta)                                                  25
                                                                                                           Improving BMP determination with mass-based measurements (Sasha D. Hafner,
Print
sedruck, Leipzig                                                                                           Camilla G. Justesen, Jacob R. Mortensen, Rasmus Thorsen, Sergi Astals,
                                                                                                           Brian K. Richards)                                                                      27
Funding
Created with funds from the Federal Ministry for Economic Affairs and Energy
                                                                                                           Value of batch tests for estimating biogas potentials and degradation kinetics
(BMWi)                                                                                                     in anaerobic digestion (Sören Weinrich, Franziska Schäfer, Jürgen Pröter, J
                                                                                                           an Liebetrau)                                                                           29
ISSN 2366-4169                                                                                             Experiences from the KTBL/VDLUFA Inter-Laboratory Test Biogas regarding the
ISBN 978-3-946629-39-9                                                                                     biogas yield determination in batch tests (Mark Paterson, Hans Oechsner,
                                                                                                           Peter Tillmann)                                                                         31

All rights reserved.
© DBFZ 2019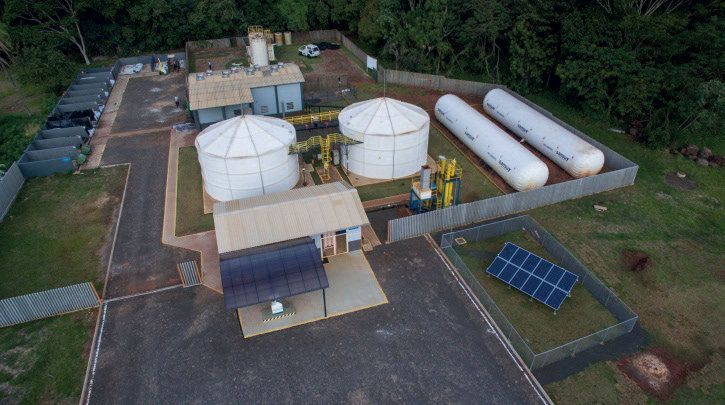
4 CONTENT CONTENT 5
Session D MICROBIOLOGICAL ANALYSIS IN MONITORING & PROCESS CONTROL OF AD PLANTS Light cooking of lignocellulosic biomass as a cheap pre-treatment for Increased
biogas production (Emil Brohus Lassen Agdal, René Casaretto, Jens Born,
Metabolism-centered predictive modeling of anaerobic digestion of Biogas Jens Bo Holm-Nielsen) 54
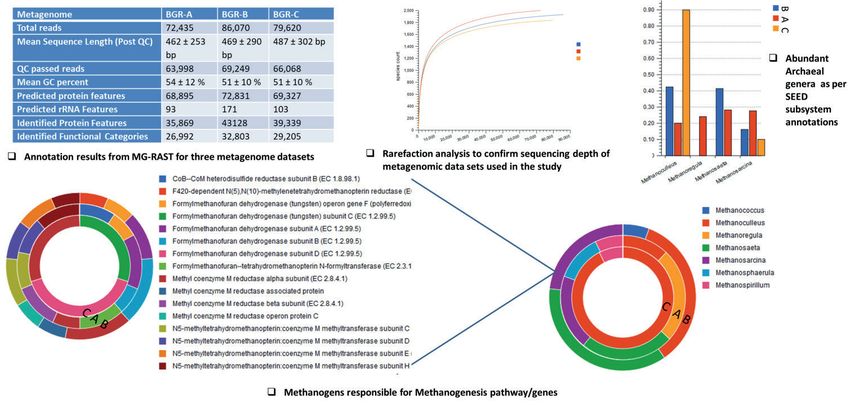
production (Denny Popp, Fabian Bonk, Daniela Becker, Florian Centler) 33 Monitoring and optimizing nine UK biogas plants (Denise Cysneiros) 56
Microbiome analysis to understand the biotransformation reactions responsible Software for measurement and prediction of methane potential (Sasha D. Hafner,
for conversion of food waste to energy in Biogas reactors (Niti B. Jadeja, Konrad Koch, Hélène Carrere, Sergi Astals, Sören Weinrich) 58
Nidhi Sahu, Ram Avatar Pandey, Atya Kapley) 35 Robust VFA measurement in biogas
Evaluation of the process performance at commercial biogas plants using (Hartmann Hieber, Hartmut Gropius, Gabriele Mehl ) 60
compound-specific stable isotope analysis (CSIA) (Anko Fischer, Kevin Kuntze, Residual gas potential difference between the summer and winter samples
Liane Müller, Franziska Schäfer, Marcell Nikolausz) 37 (Benedikt Hülsemann, Lijun Zhou, Hans Oechsner) 62
Opportunities for optimisation and valorisation in real-time production &
Session E MONITORING OF PLANT EFFICIENCY IN FULL-SCALE monitoring of anaerobic digestion (AD) (Sarah Hunter, Zhu Xiaowen, Goa Fan,
Yi Mingjie, Edgar Blanco, Aiduan Borrion) 64
Challenges in data acquisition and application for biogas process modelling in Hydrogen concentration as a possible control parameter for biogas plants
Practice (Johan Grope, Frank Scholwin, Sören Weinrich, Michael Nelles) 39 (Thomas Kirner, Ellen Euchner, Bettina Manns, Hussein Beganovic,
Process control of a high-performance hybrid reactor as a methane stage for Marcus Kiuntke, Dieter Bryniok) 66
biomass with high nitrogen content (Anne Geißler, Christina Dornack) 41 Use of manganese oxide to oxidize hydrogen sulphide in biogas
Control of alkalinity of a full-scale biogas plant treating waste water from the (Izabela Konkol, Jan Cebula, Adam Cenian) 68
cleaning of car tanks transporting food and fodder ...(Wolfgang Pfeiffer, Remote monitoring of biogas plants: Brazilian cases
Van Than Nguyen, Jan Neumann, Dirk Awe, Jens Tränckner) 42 (William Carlos Marenda, Larissa Schmoeller Brandt, Juliana Gaio Somer,
Monitoring of (manufacturer independent) biogas plants with evaluation of all Breno Carneiro Pinheiro) 69
the data of necessary data points (Karlheinz Meier) 44 Increase of safety-related requirements for biogas plants following the example
of the chemical industry – development of model P&ID-flow charts with all
Session F DEVELOPMENTS & PERSPECTIVES IN PROCESS CONTROL safety-related circuits (Gerhard Rettenberger) 71
Model-based process optimization of biogas plant operation
Determining conditions of Intermittently fed digesters from biogas production (Manuel Winkler, Sören Weinrich ) 72
Rate Data (Robin Eccleston, Michael Bongards) 45 Monitoring of ammonia in biogas
Evaluation of pre-treatment methods by in-line particle size distribution (Heike Wünscher, Thomas Frank, Andrea Cyriax, Ingo Tobehn-Steinhäuser,
monitoring with laserlight backreflection (Stefan Junne, Maximilian Quietzsch, Thomas Ortlepp) 74
Chiara Barrilaro, Friedel Schwartz, Peter Neubauer) 46
Minimizing negative effects of liquid digestate recirculation on methane
production and system stability in anaerobic digestion of livestock bio-wastes Sponsors & exhibitors
(Wu Shubiao) 48
Flexible methane production using PI controller with simulation based soft sensor anaero technology 78
(Niloofar Raeyatdoost, Robin Eccleston, Christian Wolf) 50 BayWa r.e. Bioenergy GmbH 79
Bioprocess Control AB 80
BlueSens gas sensor GmbH 81
Poster Exhibition Boreal Europe BV 82
Institute for Biogas, Waste Management & Energy 83
solaga UG 84
Umwelt- und Ingenieurtechnik GmbH Dresden 85
GO GREEN, AIM FOR A GREEN MEETING 86
ORGANIZING INSTITUTIONS 88
FURTHER INFORMATION 89
6 SCIENTIFIC COMMITTEE BACKGROUND 7
Scientific committee
Dr Jan Liebetrau
IV. Conference on
DBFZ Deutsches Biomasseforschungszentrum, Leipzig, DE
Monitoring & Process Control
Dr Fabian Jacobi
Hessian State Laboratory (LHL), Landesbetrieb Hessisches Landeslabor, Gießen, DE of Anaerobic Digestion Plants
Dr Sabine Kleinsteuber
Helmholtz Centre for Environmental Research – UFZ, Leipzig, DE
Background
Prof Jerry D Murphy
University College Cork, UK Anaerobic digestion is a complex process of subsequent and interacting degradation steps.
The requirements and standards for the operation of biogas plants are changing due to
Dr Jean-Philippe Steyer requirements of the legal side and security of supply. Thus, a precise control of this complex
LBE - INRA Narbonne Laboratory of Environmental Biotechnology, FRA biological process is crucial to make the biogas production process more efficient, reliable
and profitable.
Dr Hinrich Uellendahl Currently there is a growing need for flexibility regarding the substrate, energy and material
Aalborg University, DK provision (polygeneration). Thus, challenges increase for operation, monitoring and control of
biogas facilities in all dimensions. Novel and optimized process monitoring and control sys-
Dr Alastair James Ward tems are necessary to improve the performance of anaerobic digestion.
Aarhus University, DK The IV. CMP International Conference on Monitoring & Process Control of Anaerobic Diges-
tion Plants focuses on the requirements of measurement tools, best practices and practically
Prof Christian Wolf implemented applications of monitoring and control devices.
TH Köln, DE Stakeholders in the biogas sector will have the opportunity to meet, exchange experience and
get information on newest solutions to optimize the efficiency of anaerobic digestion plants
from experts in the biogas field at an international level.
The IV. CMP conference is organized by
» the Research Network “Biomass energy use” of the German Federal Ministry of
Economic Affairs and Energy,
» the German Biomass Research Centre (DBFZ Deutsches Biomasseforschungszen-
trum gGmbH),
» the Helmholtz Centre for Environmental Research (UFZ), and
» the Hessian State Laboratory (LHL)
Topics of the conference at a glance
» Modelling & simulation for process control
D A Y S » AD+: Control of coupled processes and demand-oriented production
2 ST R AC TS » Information & communication technology (ICT) and digitalization within AD pro-
cesses
40 AB NTATIONS » Laboratory measurements: Reliability & validity
ES E
29 PR STER FROM » Practical experience of process monitoring and control
O
& 15 P U N T R I ES
» Microbiological analysis in monitoring & process control of AD plants
8 CO
» Measurement technology: Sensor development & application
» Plant efficiency: Monitoring & control of the plant efficiency
WIFI » Monitoring for safety & emission reduction purposes
Network: KUBUS We wish you a most successful, enriching and instructive discussion, but also an enjoyable
Password: Plastikreduzierung2019 conference, and a very pleasant stay in Leipzig.
The organizers
8 PROGRAMM PROGRAM 9
PROGRAM 13:50 – 14:30
Afternoon Break and Voting for Best
Poster
Session C
Batch & Interlabatory Tests
Chair: Hinrich Uellendahl, Flensburg University
of Applied Sciences
1 DAY
ST
2019-03-26
Session B
Modelling, Simulation & Control of ADs
Chair: Christian Wolf, Institute for Automation
and Industrial IT, TH Köln
16:20 – 18:30
Speaker presentation 20´| Discussion
10´per each
Speaker:
1. Alastair James Ward, Aarhus University
Examining the relationship between
09:00 Poster presentation round 14:30 – 16:00 inoculum to substrate ratio and apparent
Registration Chair: Fabian Jacobi, Hessian State Laboratory Speaker presentation 20´| Discussion hydrolysis rate in biogas batch test assays
(LHL) 10´per each
10:00 13:00 – 13:50 Speaker: 2. Joern Heerenklage, Hamburg University
Conference opening 5 min poster presentations 1. Eric Mauky, DBFZ Deutsches Biomasse- of Technology Harburger (cancelled)
forschungszentrum gemeinnützige GmbH Lab tests with a mini-bioreactor test
1. Manuel Winkler, DBFZ Deutsches Thermodynamic modelling of gas storages system (all-in-one) for the development of
Biomasseforschungszentrum gGmbH for optimised demand-driven operation of standardized and storable inocula for BMP-
Session A Model-based process optimization of biogas anaerobic digestion plants tests
Laboratory measurements: plant operation
Reliability & validity 2. Sasha D. Hafner, Aarhus University 2. Florian Centler, Helmholtz Centre for 3. Sasha D. Hafner, Aarhus University
Chair: Fabian Jacobi, Hessian State Software for measurement and prediction of Environmental Research - UFZ Improving BMP determination with mass-
Laboratory (LHL) methane potentia Opening the Black Box: Coupling ADM1 based measurements
with constraint-based methods to include
10:30 – 12:00 3. Gerhard Rettenberger, Ingenieurgruppe intracellular activity in anaerobic digestion
Speaker presentation 20´| Discussion RUK GmbH modeling 4. Sören Weinrich, DBFZ Deutsches
10´per each Increase of safety-related requirements for Biomasseforschungszentrum gGmbH
biogas plants following the example of the Value of batch tests for estimating biogas
Speaker: chemical industry – development of model P&ID- 3. Jürgen Kube, Future Biogas Ltd potentials and degradation kinetics in
1. Francisco Raposo Bejines, Instituto de la flow charts with all safety-related circuits Optimisation of the three-stage biogas anaerobic digestion
Grasa-CSIC upgrading process
Laboratory Measurements: The Achilles´ 4. Denise Cysneiros, Jürgen Kube, Future
heel for the anaerobic digestion of complex Biogas Ltd. 5. Mark Paterson, Kuratorium für Technik
solid substrates Monitoring and optimizing nine UK biogas 16:00 – 16:20 und Bauwesen in der Landwirtschaft e.V.
plants: laboratory and in-situ measurements, Afternoon Break and Voting for Best (KTBL)
2. Torsten Stefan, Christian-Albrechts- key process indicators and data analysis and Poster Experiences from the KTBL/VDLUFA Inter-
Universität Kiel /Hochschule Flensburg interpretation Laboratory Test Biogas regarding the biogas
Potential of predicting Klason-lignin in yield determination in batch tests
digestates by calorimetry 5. Heike Wünscher, CiS Forschungsinstitut für
Mikrosensorik GmbH
3. Holger Müller, BlueSens gas sensor Monitoring of ammonia in biogas 19:00 Guided City Walk
Measuring instruments for determining low “Peaceful Revolution”
volume flows 6. William Carlos Marenda, Centro Internacional
de Energias Renováveis – CIBiogás – ER
Remote monitoring of biogas plants: Brazilian 20:00 | Networking dinner & Winners
12:00 – 13:00 case of the BEST POSTER AWARD
Lunch break Moritzbastei Leipzig
More posters in the poster exhibition in the foyer Kurt-Masur-Platz 1, 04109 Leipzig
www.moritzbastei.de
10 PROGRAMM 11
2 DAYND
2019-03-27
Session D Session E 13:15 – 14:00 | Lunch break
Microbiological analysis: Potential for Monitoring of Plant Efficiency in Full-sc
process monitoring and control of AD ale
plants Session F
Chair: Sabine Kleinsteuber, Helmholtz Chair: Frank Schwolwin, Institute for Biogas,
Centre for Environmental Research - UFZ Waste Management & Energy Developments & Perspectives in
Process Control
09:00 11:15 – 13:15 Chair: Alastair James, Ward Aarhus
Conference opening Speaker presentation 20´| Discussion University
10´per each
09:15 – 10:45 14:00 – 15:30
Speaker presentation 20´| Discussion Speaker: Speaker presentation 20´| Discussion
10´per each 1. Johan Grope, Institute for Biogas, Waste 10´per each
Management & Energy
Speaker: Challenges in data acquisition and Speaker:
1. Denny Popp, Helmholtz Centre for application for biogas process modelling in 1. Robin Eccleston, TH-Köln
Environmental Research - UFZ practice Determining conditions of intermittently fed
Metabolism-centered predictive modeling of digesters from biogas production rate data
Anaerobic digestion of biogas production 2. Anne Geißler, Technische Universität
Dresden 2. Stefan Junne, Technische Universität
Process control of a high-performance Berlin
2. Niti B Jadeja, National Environmental hybrid reactor as a methane stage for Evaluation of pre-treatment methods by in-
Engineering Research Institute, CSIR biomass with high nitrogen content line particle size distribution monitoring with
Microbiome analysis to understand the laserlight backreflection
biotransformation reactions responsible for 3. Wolfgang Pfeiffer, University of Wismar
conversion of food waste to energy in Biogas Control of alkalinity of a full-scale biogas 3. Niloofar Raeyatdoost, TH Köln
reactors plant treating waste water from the cleaning Flexible methane production using PI
of car tanks transporting food and fodder, Controller with simulation based soft sensor
adaption of biogas production to the
3. Anko Fischer, Isodetect GmbH demand and verification of Nordmann
Evaluation of the process performance at titration method for measuring VOA and 15:30– 15:35
commercial biogas plants using compound- alkalinity Conference closing
specific stable isotope analysis (CSIA) during
anaerobic digestion 4. Karlheinz Meier, BayWa r.e. Bioenergy
GmbH 16:00 – 17:00
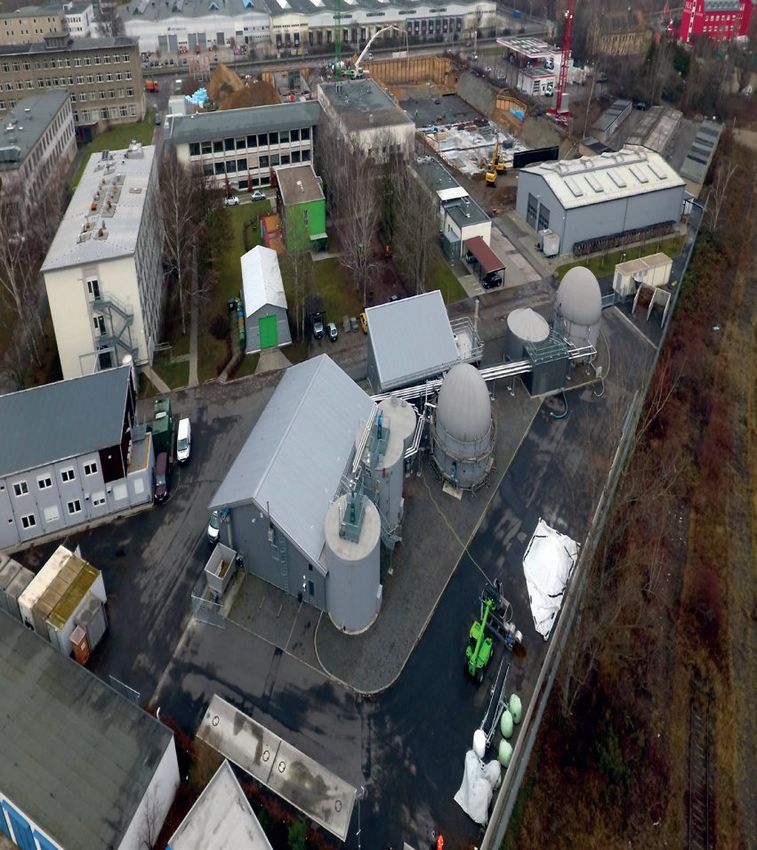
Monitoring of (manufacturer independent) Guided tour to the AD research plant
10:45 – 11:15 | Morning break biogas plants with evaluation of all the data DBFZ | Torgauer Straße 116 |
of necessary data points 04347 Leipzig
(Meeting point 15:45 at the registration
desk in the KUBUS)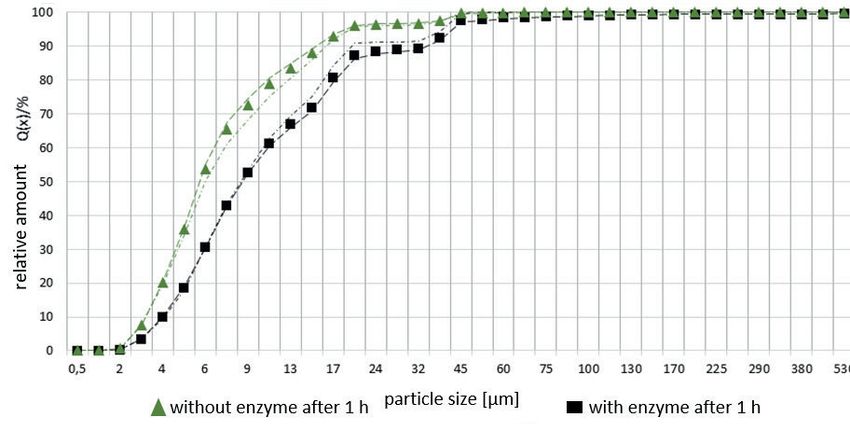
12   ABSTRACTS                                          LABORATORY MEASUREMENTS: THE ACHILLES´ HEEL FOR THE ANAEROBIC DIGESTION OF COMPLEX SOLID SUBSTRATES   13

                             Francisco Raposo Bejines

                             Laboratory measurements: The Achilles´ heel for the
                             anaerobic digestion of complex solid substrates

                             # Analytical methods, chemical oxygen demand, fat, fibre, moisture, protein
                             Background/motivation

                             The solid substrates are characterized using a few analytical methods to provide information
                             about the content of water/ash and also for the overall organic matter (volatile solids and
                             COD). In addition, it is usual to include more specific organic composition in form of the con-
                             tent of fat, fibre and protein. These determinations are carried out by wet chemistry methods
                             that can be classified as empirical methods. Therefore, the results are obtained by indirect
                             measurement of the analyte of interest and unfortunately, the results are in part or in whole
                             dependent on the conditions of the assay.

                             Aim of the work

                 ABSTRACTS
                             Since the anaerobic digestion community has not yet come to a consensus on what empiri-
                             cal method is best suited for the analysis of solid substrates, many different empirical meth-
                             ods are used among laboratories and even within a single laboratory. This situation provides
                             some lack of reliability in the analytical results due to the frequent significant variation
                             among different laboratories.

                             Key research topics and novelty

                             This proposal is not a specific research study. It can be considered as a summary of the trou-
                             bles found at the routinely laboratory work to determine the content of ash, COD, fat, fibre,
                             moisture and protein. Also some recomendations can be provided to the most applicabble
                             analytical methods used in the characterization of solid substrates for anaerobic digestion
                             procedures.

                                                        Francisco Raposo Bejines

                                                        Instituto de la Grasa-CSIC                             Contact
                                                        Campus Universidad Pablo de Olavide,                   +44 (0) 954611550
                                                        Edificio 46 Carretera de Utrera, Km 1, 41013 Sevilla,   fraposo@cica.es
                                                        Spain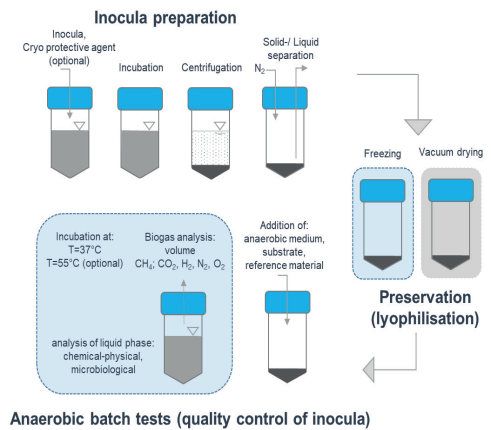
14   POTENTIAL OF PREDICTING KLASON-LIGNIN IN DIGESTATES BY CALORIMETRY                                                                                                                   POTENTIAL OF PREDICTING KLASON-LIGNIN IN DIGESTATES BY CALORIMETRY   15

     Torsten Stefan 1, René Casaretto 2

     Potential of predicting Klason-lignin in digestates by calorimetry

     # Digestates, Klason-lignin, gross calorific value, efficiency
     Evaluating the efficiency of the digestion process of biogas plants based on energy inher-             A possible influence of the substrate composition of the sampled biogas plants on the cor-
     ent in the used biomass seems advantageous for comparison with other biomass conver-                  relation between KL and GCV due to variation in structure of extracted KL (HORST et al. 2015)
     sion processes. However, for process optimization of anaerobic digestion it is necessary to           – examined by adding interactions between GCV and substrate composition to the model
     quantify the portion of energy in substrates and/or digestates, which can be anaerobically            – was not recognizable. The best adj. R² was achieved using GCV, lignocellulosic sugars
     converted to biogas.                                                                                  and extractives as explanatory variables, resulting in adj. R²=0.61. However, further chemi-
                                                                                                           cal analysis of the samples leads to higher analytical demand – in this case lignocellulosic
     Digestates from agricultural biogas plants typically contain lignin as anaerobically non-degra-       sugars and extractives which contradicts the idea of the study (easy and cheap method) and
     dable organic matter. Therefore, it is necessary to know the energy content of the lignin and         does not offer any obviously benefits instead of measuring the Klason-lignin directly.
     non-lignin portion to calculate the anaerobically available residual energy potential of diges-
     tates. Idea of this work is to predict the lignin content from the same calorimetric measure-         The residual biomethane potential showed no correlation with the KL-fraction (R² = 0.02).
     ment, which is used to calculate the total energy of the material streams. This idea is based         Therefore, KL does not seem to be a good predictor for the anaerobically degradable/non-
     on the fact, that lignin has a distinctly higher calorific value than the residual polysaccharide      degradable organic portion of digestates. In combination of all results, the Klason-method
     fraction (hemicellulose/cellulose fibres).                                                             for lignin determination shows no advantage over ADL-methodology. Concluding from the
                                                                                                           examined data set, calorimetry is not an appropriate method for predicting Klason-lignin in
     According to our previous research, the content of acid detergent lignin (ADL) in digestates          digestates from anaerobic digestion.
     can be predicted by gross calorific values (GCV) in the studied range from 0.03–0.36 [kg/kg-
     ODM] with an accuracy of ± 0.086 [kg/kg-ODM] (± 2*RMSECV) by a linear regression model,
     adj. R²=0.89 (Study submitted to Biomass & Bioenergy is in review process). However, JUNG
     et al. (1999) reported, that the ADL-method underestimates the total lignin content, other than the
     Klason-method. So the aim for the present study was to try the Klason-method for the deter-
     mination of lignin to improve the estimation of lignin from gross calorifc values.

     Digestate samples from 34 commercial scale biogas plants were analysed for dry mat-
     ter (DM), organic dry matter (ODM), gross calorific value, Klason-lignin (KL), water- and
     ethanol-soluble extractives and residual biomethane potential. Thirty of these samples were
     additionally analysed for (lignocellulosic) sugars in the hydrolysate from the Klason-lignin-
     extraction. Several uni- and multivariate linear regression models based on both DM- and
     ODM-specific parameters were tested for correlation with the Klason-lignin content. Informa-
     tion about the substrate composition and the hydraulic retention time of the sampled biogas
     plants were used additionally in some models.                                                         References

     Correlation between KL and GCV was significant, but low with adjusted R² = 0.14 (ODM-                  Horst, D. J.; Behainne, J. J. R.; Junior, de Andrade, P. P.; Serpe, L. F. (2015): Assessing the Lignin Fraction Extracted
                                                                                                           from Brazilian Energy Crops. In: American Journal of Environmental Sciences 11 (1), S. 46–54. DOI: 10.3844/
     based). RMSEcv for prediction of KL is 3.7 [% ODM] and therefore better than the ADL-model            ajessp.2015.46.54.
     from our previous study (4.3 [% ODM]). However, the smaller prediction error, despite low R²,         Jung, H.-J. G.; Varel, V. H.; Weimer, P. J.; Ralph, J. (1999): Accuracy of Klason Lignin and Acid Detergent Lignin Methods As
     can be explained by the relatively small spread of the measured KL values in the examined             Assessed by Bomb Calorimetry †. In: J. Agric. Food Chem. 47 (5), S. 2005–2008. DOI: 10.1021/jf981250q.

     population (95 % of all data points for KL fall in a range of ± 4.7 [% ODM] around the mean
     with 34.9 [% of ODM]). The measured GCV from 19.8 to 24.3 [MJ/kg-ODM] shows the low
     sensitivity for the prediction of KL, which ranged from 22.4 to 42.3 [% of ODM].
                                                                                                                                            Torsten Stefan                                                                    René Casaretto
                                                                                                                                            1
                                                                                                                                                Christian-Albrechts-Universität                                               2
                                                                                                                                                                                                                                  Hochschule Flensburg
                                                                                                                                            Kiel
                                                                                                                                            Olshausenstraße 40,                                                               Kanzleistraße 91–93,
                                                                                                                                            24098 Kiel,                                                                       24943 Flensburg

                                                                                                                                            Contact                                                                           Contact
                                                                                                                                            +49 (0) 431 880 1549                                                              +49 (0) 461 805 1524
                                                                                                                                            tstefan@ilv.uni-kiel.de                                                           rene.casaretto@hs-flensburg.de
Messprinzip des Magnet-Hub-Zählers
Der Magnet-Hub-Zähler arbeitet nach dem Prinzip des Verdrängungszählers. Die durch eine
16 MEASURING INSTRUMENTS FOR DETERMINING LOW VOLUME FLOWS
Gasströmung hervorgerufene Kraftwirkung auf einen Kolben in einem Führungsrohr
MEASURING INSTRUMENTS FOR DETERMINING LOW VOLUME FLOWS 17
kompensiert die Gegenkraft des Kolbengewichts. Dadurch baut sich auf Seiten der Gasquelle
ein Druck von ca. 4 hPa auf. Dieser Gasdruck hebt den permanentmagnetischen Kolben an bis
ein Magnetsensor das Ventil betätigt und den Gasausgang frei gibt. Das bewegte Gasvolumen
wird aus der Anzahl der periodisch ausgeführten Kolbenbewegung bestimmt.
Holger Müller 1, Udo Schmale 1, Markus Huth 2, Rainer Tölle 3 Der Magnet-Hub-Zähler enthält eine Steuerung auf der Basis eines Mikrocontrollers, die der
Auswertung der Magnetsensoren und der Betätigung des Ventils dient. Gleichzeitig dient der
Mikrocontroller auch der Umrechnung des Volumenstroms auf die Normbedingungen von
Measuring instruments for determining low volume flows 1013,25 hPa, 0 Grad C und ohne den bei Sättigung enthaltenen Wasserdampf.
Measuring principle of the magnetic stroke counter
# Gas meter, Magnetic Stroke Counter, Biogas, Wastewater) The magnetic stroke counter works according to the principle of a positive displacement meter.
The force effect caused by a gas flow on a piston in a guide tube compensates the counterforce
of the piston weight. This builds up a pressure of approximate 4 hPa on the side of the gas
source. This gas pressure raises the permanent magnet piston until a magnetic sensor actuates
the valve and releases the gas outlet. The number of piston movements carried out periodically
Background/motivation determines the moved gas volume. (Fig. 1)
1 Cylinder
In the case of metabolic processes on a microbiological basis, gas metabolisms provide infor-
mation on the type and intensity of the processes taking place. For process analysis are high- 2 Magnetically plunger
resolution measurements of gas formation or gas consumption of microbiological cultures of 3 Seal with Ferro fluid
great interest. Together with the chemical composition of the gases, which changes also over
time, conclusions can be drawn on the material transformations that take place.
4 Three-way valve
5 Inflowing gas
Aim of the work 6 Effluent gas
The aim of the work is the provision of gas measurement technology especially for low 7 Overflow cannel
volume flows as they typically occur in microbiological laboratory investigations. During the 8 lower magnetic sensor
measurement, the composition of the material flows consisting of different gases should
9 upper magnetic sensor
not change. A large dynamic range in the volume flow of 1 to 10,000 is to be realized. At
the same time, the technology must manage without a minimum volume flow.
The magnetic stroke counter works with a microcontroller, which reads the magnetic sensors
and actuate the valve. The microcontroller also serves to convert the volume flow to the
Key research topics and novelty standard conditions of 1013.25 hPa, 0 degrees C and without the water vapor contained in
saturation.
The magnetic stroke counter works with a microcontroller, which reads the magnetic sen-
Results / Ergebnisse
The devices presented are optimized for use in biogas and wastewater laboratories. The sorsMöglichkeiten
and actuate und the valve.
Grenzen The microcontroller
der Messtechnik werden im Rahmen also
einesserves to convert the volume flow to the
Methodenvergleichs
dargestellt. Dazu dienen die Ergebnisse eines Tests zum Restgaspotential ausgefaulter Gülle.
measuring range covers a volume flow rate from 0 mL/h to 5,000 mL/h. In addition, the standard conditions of 1013.25 hPa, 0 °C and without the water vapor contained in satura-
devices can be used with reduced accuracy up to 12,000 mL/h. The resolution of the vol- tion.
ume measurement per measuring cycle is 1 mL standard gas. The overpressure required
for operation is > 4 hPa. A pressure above 40 hPa activate a safety valve function. In special Results
products the resolution could be scalable from 0.1 to 10 mL per measuring cycle.
Possibilities and limits of measurement technology are presented in the context of a method
Methods – Measuring principle of the magnetic stroke counter comparison. The results of a test on the residual gas potential of digested slurry are used for
this purpose. The gas development of the samples was recorded for 60 days at a tempera-
The magnetic stroke counter works according to the principle of a positive displacement ture of 20 °C and compared with conventionally determined measured values.
meter. The force effect caused by a gas flow on a piston in a guide tube compensates the
counterforce of the piston weight. This builds up a pressure of approximate 4 hPa on the
side of the gas source. This gas pressure raises the permanent magnet piston until a mag-
netic sensor actuates the valve and releases the gas outlet. The number of piston move-
ments carried out periodically determines the moved gas volume. (Fig. 1)
References
Huht, M.; Tolle, R.; Schmidt, U. (2018 ): Messgeräte zur Bestimmung geringer Volumenströme in Biogasversuchen. In:
Tagungsband zum 11. Biogas-Innovationskongress 2018, pp. 69 – 75, PROFAIR Consult + Project GmbH (Ed.)
Holger Müller
BlueSens gas sensor GmbH Contact
Management and Material Flow +49 (0) 2366 499 55 00
Snirgelskamp 25, 45699 Herten, Germany holger.mueller@bluesens.de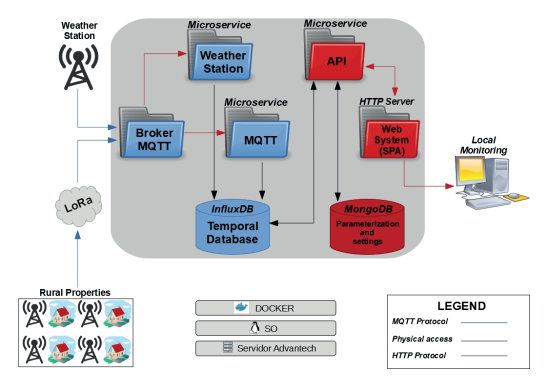
18   THERMODYNAMIC MODELLING OF GAS STORAGES                                                                                                                                                                                         THERMODYNAMIC MODELLING OF GAS STORAGES           19

     Eric Mauky, Mathias Stur, Christian Krebs

     Thermodynamic modelling of gas storages for optimised
     demand-driven operation of anaerobic digestion plants

      # Gas storage, modelling, prediction, demand-driven, emissions
     The changing conditions within the energy sector in Germany force biogas plants to meet new                                A reduction in the net gas storage capacity by up to 20 % results for a tempera-
     requirements as flexible supply of electricity for compensating the divergence between energy                               ture change of 30 K in the gas storage interior during the course of one day.
     demand and energy supply by uncontrolled sources like wind and solar power (LUND et al.
     2012). In order to meet these new requirements, the biogas production needs to be increas-                                 These measured temperature spreads can be transferred to other practical biogas plants.
     ingly adjusted to the demand of a flexible conversion rate. As shown in (MAUKY et al. 2016, 2017)                          Under certain operating conditions, this can lead to an unscheduled reaching of techni-
     one part of the solution can be flexible feeding management. A feeding management requires                                  cally full gas storage with a triggering of the overpressure relief. Therefore, the targeted
     a precise measurement of the resulting variable gas flow rates and a regulation by a precise                                management by predictive thermodynamic models of the gas storage tank contributes
     plant-wide gas management, which optimizes the utilization of the existing storage capacity.                               to a reduction in the losses caused by flare-off or blow-off of potential gas overproduc-
                                                                                                                                tions. A advanced feeding and gas management are recommended, as this makes it pos-
     In the particular case of flexible plant operation, a reliable monitoring of the gas storage fill-                           sible to optimize flexibility, operational safety and efficiency. Biogas plants can offer a
     ing level is the crucial task of a gas management, since it specifies the switching points for                              wide range of services to balance demand and production, but also to stabilize the grid.
     CHPs and the gas flare. Furthermore, the gas utilization strategies have to be adapted to the
     changing weather conditions, which influencing the usable gas storage capacity. An effect                                   The presentation will be focus                       on the Model description                    and the dis-
     of inaccurate measurements can be an overestimation of the available storage volume and                                    cussion of monitoring Results                        from the used research                      biogas plant.
     consequently the unintentional blowing off of biogas by the overpressure safety device when
     the maximum filling level is exceeded (see REINELT et al. 2016).

     In the research project “ManBio” (BMWi Project ID: 03KB094), it was the aim to develop
     technical measures to improve the gas management of biogas plants. On the one hand, dif-
     ferent measuring systems for gas storage filling levels were compared and optimized. On the
     other hand, influencing variables to the available gas storage capacity (e.g. temperature, wind
     force and solar radiation) were mapped in a thermodynamic gas storage model in order to
     be able to predict and control the gas storage level in a forward-looking manner. Based on
     weather forecasts and process data, it is therefore possible to recommend the advance adap-
     IV  CMPof2019
     tation     the feeding or electricity generation regime to prevent under- or over-production.
     Conference on
     Monitoring
     In the case &ofProcess    Control
                     temperature       of Anaerobic on
                                    measurements        Digestion Plants
                                                           the outer side of the light gray protective mem-
     March  26–27, 2019  in Leipzig
     brane of the DBFZ research biogas plant, surface temperatures of up to approx. 68 °C by IR-                                References
     measurements were determined during direct sunlight Figure 1 (left). This consequently also led
     determined during direct sunlight Figure 1(left). This consequently also led to temperature rises in the interior
     to temperature rises in the interior of the gas storage. Figure 1 (right) illustrates the dependence                       Lund H., Andersen A.N., Østergaard P.A., Mathiesen B.V., Connolly D. (2012): From electricity smart grids to smart energy systems – A market
     of the gas storage. Figure 1(right) illustrates the dependence of the net gas storage capacity on the internal             operation based approach and understanding. Energy, 8th World Energy System Conference, 42, 96–102.
     of the net gas storage capacity on the internal gas temperature in a computational example.
                                                                                                                                Mauky E., Weinrich S., Nägele H.-J., Jacobi H.F., Liebetrau J., Nelles M. (2016): Model Predictive Control for Demand-Driven Biogas Production in
     gas temperature in a computational example. A reduction in the net gas storage capacity by up to 20 %
                                                                                                                                Full Scale, Chem. Eng. Technol. 39, pp. 652–664.
     results for a temperature change of 30 K in the gas storage interior during the course of one day.                         Mauky E., Weinrich S., Jacobi H.F., Nägele H.J., Liebetrau J., Nelles M., Demand-driven biogas production by flexible feeding in full-scale – Process
                                                                                                                                stability and flexibility potentials, Anaerobe. 46, pp.86–95.
                                                                                                                                Reinelt T., Liebetrau J., Nelles M. (2016): Analysis of operational methane emissions from pressure relief valves from biogas storages of biogas
                                                                                                                                plants, Bioresource Technology, vol. 217, pp. 257–264.

                                                                                                                                                               Eric Mauky

                                                                                                                                                               DBFZ Deutsches Biomasseforschungszentrum                           Contact
     Figure 1: (right) Temperature effects on the available gas storage capacity; (left) surface temperatures of up
                                                                                                                                                               gemeinnützige GmbH                                                 +49 (0)341 2434 745
     to  approx.
      Figure      68 °C
             1 (right)   on the outer
                       Temperature     sideon
                                    effects  of the
                                                 theavailable
                                                     light graygas
                                                                protective  membrane
                                                                   storage capacity; (left)ofsurface
                                                                                              the DBFZ  research biogas
                                                                                                     temperatures of up plant                                  Torgauer Straße, 116, 04347, Leipzig, Germany                      eric.mauky@dbfz.de
     /toPicture
         approx.by
                 68IR-
                     °Ccamera
                        on the outer side of the light gray protective membrane of the DBFZ research biogas plant /
                                (Mauky/DBFZ)
      Picture by IR- camera (Mauky/DBFZ).
     These measured temperature spreads can be transferred to other practical biogas plants. Under certain
     operating conditions, this can lead to an unscheduled reaching of technically full gas storage with a triggering
     of the overpressure relief. Therefore, the targeted management by predictive thermodynamic models of the
20 OPENING THE BLACK BOX OPTIMISATION OF THE THREE-STAGE BIOGAS UPGRADING PROCESS 21
Sören Weinrich 1, Sabine Koch 2, Fabian Bonk 3, Denny Popp 3, Dirk Benndorf 2,4, Steffen Klamt 2, Florian Centler 3 Jürgen Kube
Opening the Black Box: Coupling ADM1 with constraint-based methods Optimisation of the three-stage biogas upgrading process
to include intracellular activity in anaerobic digestion modeling
# Anaerobic
meta-omics
Digestion Model No.1 (ADM1), flux-balance-analysis (FBA), constraint-based modeling, # Biogas upgrading, Gas permeation, Membrane separation, Non-linear optimisation, boundary
value problem
Since more than 15 years anaerobic digestion has been modeled predominantly by ordinary- The energy demand of a biogas upgrader is one of the largest cost items of a biogas plant.
differential-equation-based (ODE) models such as ADM1. These models resolve individual Typical upgrader processes driven by electric energy require 0.20 to 0.30 kWh per Nm³ raw
process steps but do not consider the phylogenetic diversity at these steps and neglect spe- biogas processed. An average sized gas-permeation, water-scrubber or organic scrubber-
cies-specific microbial activity. In the meantime, meta-omics techniques including metagen- upgrader therefore uses 200 to 400 kW electric energy. Part of operating excellence is the
omics, metatranscriptomics, and metaproteomics have led to the elucidation of microbial identification of optimisation potentials for new and existing upgrader plants. Reducing the
activity down to the enzyme level for individual genera, providing an unprecedented view power demand of the upgrader while maintaining or improving the recovery rate will lead to
on the intracellular activity of microbes embedded in complex communities. However, such significant economic savings and will improve the sustainability of the biogas plant.
data is difficult to integrate with common ODE-type models covering anaerobic digestion.
Instead, they can be incorporated with constraint-based modeling techniques such as Two methods for the optimisation of biogas upgraders are described. The first method is the
Flux-Balance-Analysis (FBA) that consider the intracellular metabolic network of microbes mechanical modelling of a gas-permeation process and the optimisation of the model using
up to the genome-level. FBA allows for the prediction of specific growth rate and metabolic non-linear optimisation with batch The three-stage gas permeation process for a gas mixture
turnover for individual species based on its metabolic network, its biomass composition, and of four components (CH4, CO2, N2, O2) is modelled as a system of 12 coupled boundary value
available substrates. This genotype to phenotype mapping relies on the assumption that equations. The equations have a singular boundary value at the retentate outlet side of the
intracellular metabolites are at steady state and that the cell orchestrates its metabolic flux membrane, when the permeate flow becomes zero, requiring simultaneous solving of the
distribution for optimal growth. A FBA simulation additionally delivers flux values for all enzy- BVP and a nonlinear algebraic equation system. The solution is then subjected to a non-
matic reaction steps contained in the metabolic network, providing a rich data set which can linear optimisation routine using the fmincon-algorithm in MATLAB.
be compared to omics data sets delivering information on enzymatic activity. To harness the The result of the optimisation is a set of optimal temperatures and number of membranes
power of this modeling technique in anaerobic digestion research, we constructed a hybrid per stage plus two pressures governing the process and controlling the gas qualities of the
model that, relying on a mass-based version of ADM1, considers acetoclastic and hydrog- product and lean gas (see figure 1). Further the impact of increased membrane surface and
enotrophic methanogenesis by FBA models of Methanosarcina barkeri and Methanococcus selectivity, changes of setpoints or the addition of permeate compression can be investi-
maripaludis. We first compare simulated steady-state results of ADM1 with our novel hybrid gated under optimal conditions.
model and then consider a dynamic simulation in which a continuous feeding of maize IV CMP 2019
silage is switched to a pulsed daily feeding. While both the ADM1 and the hybrid model Conference on
agree well regarding predictions of process performance, differences regarding microbial Monitoring & Process Control of Anaerobic Digestion Plants
March 26–27, 2019 in Leipzig
activity predictions are observed for the dynamic simulation, which remain to be confirmed
by experimental evidence. Demonstrating the technical feasibility of coupling ADM1 with
constraint-based modeling, we envision a new era of simulation models for complex micro-
bial communities which do no longer merely focus on individual chemical conversion steps,
but are able to explicitly take into account microbial diversity and metabolic capacities of
individual community members. Such models incorporate a more faithful representation of
microbial activity in complex communities and will be elemental in gaining a better control of
processes driven by these systems.
1
DBFZ – Deutsches Biomasseforschungszentrum gGmbH, Biochemical Conversion Department, Torgauer Straße 116, 04347 Leipzig, Germany
2
Max Planck Institute for Dynamics of Complex Technical Systems, Sandtorstr. 1, 39106 Magdeburg, Germany
3
Helmholtz Centre for Environmental Research – UFZ, Permoserstr. 15, 04318 Leipzig, Germany
4
Otto von Guericke University, Universitätsplatz 2, 39106 Magdeburg, Germany
Figure: optimal inlet temperatures of every stage as a function of overall installed membrane surface for a
Figure 1 Optimal
inlet inlet
gas flow of 900temperatures
Nm³/h biogas of every
with 50%stage as aconstraints
CH4. The function ofareoverall
1.5% CO installed membrane
2 in the product surface
gas and 1% for a
CH4 in
inlet gas theoflean
flow 900gas. Optimisation
Nm³/h biogas parameters are .the
with 50 % CH Thetemperatures
constraints atare
the1.5
inlet%ofCO
every
in stage,
the the retentate
product gas and 1 %
4 2
Dr. Florian Centler CH4 inpressure
the lean of the second and third stage. The number of membranes per stage are either fixed in a ratio of
gas. Optimisation parameters are the temperatures at the inlet of every stage, the retentate
1:1:1 (open symbols) or optimisation parameters as well (closed symbols).
pressure of the second and third stage. The number of membranes per stage are either fixed in a ratio of
1:1:1If(open
no mechanical
symbols)model of the upgrader
or optimisation process can
parameters be obtained
as well (closed or it is too complicated for calculation, a
symbols).
Helmholtz Centre for Environmental Research – Contact new method [1] can be used to optimise existing upgrader units. The method is based on the gradient descent
method, but it is extended to fulfil constraints, so the energy demand of the upgrader can be optimised while
UFZ +49 (0) 341 235 1336 maintaining or even improving gas qualities of product and lean gas. The method can be used on all kind of
Permoserstr. 15, 04318 Leipzig, Germany florian.centler@ufz.de upgraders and is not limited to gas permeation. It can be implemented as an on-line process control function
to allow the upgrading unit to automatically adjust its operation parameters to optimize power uptake or
throughput.
[1] KUBE, J.: Verfahren zum Betreiben einer Biogasanlage, DE 10 2017 104 642 A122 OPTIMIZATION OF THE THREE-STAGE BIOGAS UPGRADING PROCESS EXAMINING THE RELATIONSHIP BETWEEN INOCULUM TO SUBSTRATE RATIO AND APPARENT HYDROLYSIS RATE IN BIOGAS BATCH TEST ASSAYS 23
Alastair James Ward
Examining the relationship between inoculum to substrate
ratio and apparent hydrolysis rate in biogas batch test assays
# Biogas, process control, spectroscopy
Finding the apparent hydrolysis rate khyd (measured as the gas production rate) of a continu-
The optimal configuration of a three-stage upgrader is surprisingly straightforward. The first ous biogas process takes a lot of time and measurement. Simple batch tests provide useful
stage should be operated at low temperatures at high selectivity, the third stage should data in terms of the methane potential, but the apparent hydrolysis rate is dependent on the
operate at low selectivity and high capacity, i.e. high temperatures. The distribution of interaction between the inoculum microbial community and the physical and chemical nature
membranes amongst the stages barely has an impact on the power uptake, they can be of the substrate. For the same substrate and inoculum source, the inoculum to substrate (I:S)
distributed in a ratio of 1:1:1. Existing gas-permeation upgraders can be easily readjusted to ratio is a very important parameter in batch tests. Standardised batch test protocols (ANGELIDAKI
optimal process parameters for a reduction of energy demand. et al. 2009) suggest an I:S of 2:1 (in terms of volatile solids or chemical oxygen demand) will
ensure there is a sufficiently high microorganism density to achieve digestion without inhibi-
If no mechanical model of the upgrader process can be obtained or it is too complicated for tion. However, the relatively high single organic load certainly reduces the apparent hydrolysis
calculation, a new method (KUBE 2018) can be used to optimise existing upgrader units. The rate when compared to the smaller organic load experienced at a higher I:S ratio (WARD et al.
method is based on the gradient descent method, but it is extended to fulfil constraints, so 2018). Using a higher I:S in batch assays will give a khyd that is comparable to a continuous
the energy demand of the upgrader can be optimised while maintaining or even improving process (WARD et al. 2018) but tends to increase the error in the results. This is because of the
gas qualities of product and lean gas. The method can be used on all kind of upgraders and natural biogas production from the inoculum, despite attempts to “de-gas” prior to preparing
is not limited to gas permeation. It can be implemented as an on-line process control func- the batch assay bottles. Biogas production from substrates is calculated by subtracting the
tion to allow the upgrading unit to automatically adjust its operation parameters to optimize inoculum gas production measured in control assays, therefore with a greater proportion of
power uptake or throughput. inoculum there will be a corresponding increase in the proportion of inoculum gas production
relative to gas production derived from the substrate.
As shown by Ward et al. (2018) in an experiment using cattle manure, high I:S ratios of 6:1
and 12:1 showed very small differences to each other in terms of khyd, whereas a 1:1 ratio
showed a khyd value that was considerably lower than a 2:1 ratio, which in turn was consider-
ably lower than 6:1 or 12:1 ratios. It was therefore hypothesized that khyd will reach a maxi-
mum at an I:S where microorganism density is not rate limiting. This study examines the rela-
tionship between I:S ratios and khyd with the aim of producing a conversion factor to adjust
measured khyd in batch assays at the recommended (and relatively low) I:S of 2:1 to a khyd
where microorganism density is not rate limiting. The work is intended as a follow up to WARD
et al. (2018) where khyd values were established for estimation of continuous process yields.
References
Kube, J. (2018): Verfahren zum Betreiben einer Biogasanlage, DE 10 2017 104 642 A1.
Dr. Jürgen Kube
Future Biogas Ldt. Contact
Federick Sanger Rd 10-12, GU2 7YD Guildford, UK +44 7808 866 533
juergen.kube@futurebiogas.com24 EXAMINING THE RELATIONSHIP BETWEEN INOCULUM TO SUBSTRATE RATIO AND APPARENT HYDROLYSIS RATE IN BIOGAS BATCH TEST ASSAYS LAB TESTS WITH A MINI-REACTOR 25
Jörn Heerenklage, Dorothea Rechtenbach, Iryna Atamaniuk, Ayah Alassali, Julius Zimmermann,
Niklas von Borstel, Felix Müller, Claus Marcus Tiemann, Anna Krüger, Anne-Catharina Graage, Kerstin Kuchta
Lab tests with a mini-bioreactor test system (all-in-one) for the
developement of standardised and storabel inocula for BMP-tests
# BMP-Tests, biogas, mini-bioreactor, test system, inocula
Batch assays have been prepared using three substrates (maize silage, meadow grass and In the context of anaerobic batch tests (BMP), different origin of inocula might cause sig-
wheat straw) and six different I:S ratios. I:S ratios were: 1:1, 2:1, 4:1, 6:1, 8:1, 12:1, and 16:1, nificant variations of test’s results (RAPOSO et al. 2011; HAGEN et al. 2015; HOLLIGER et al.
the 1:1 ratio reflecting methodology used by some authors. The assays were set up in 1 litre 2016; KOCH et al. 2017), preventing from acquiring reproducible and uniform applications.
bottles with butyl rubber caps, with a total inoculum and substrate mass of 500 g in each The Hamburg University of Technology (TUHH) intends to develop a method to produce
bottle. Control bottles containing inoculum only were also included. All assays were conducted standardised and storable inocula for BMP tests. The aim is to provide a range of inocula
in triplicate and incubated at 35 °C until gas production became negligible. Produced gas for different substrates and research methods, which can be applied in research as well
volume was measured by acidified water displacement (3) at intervals dependent on the rate as in industrial applications (HEERENKLAGE et al. 2017). As a long term preservation method
of gas production. Sub samples of biogas were collected for compositional analysis by gas for anaerobic inocula, freeze-drying was examined. Comprehensive studies of preservation
chromatography. through lyophilisation were implemented using two anaerobic inocula (mesophilic and ther-
mophilic), which were produced on the basis of thin sludge under standardised conditions
Results are not available at the time of writing, but first order models will be fitted to the gas and a selected sludge of a wastewater treatment plant (mesophilic). For the investigation of
production data to provide khyd values. The khyd values will be examined in relation to the I:S the different treatment steps a so called “All-in-one” mini-bioreactor test system (MBR) was
ratio and curves will be fitted to establish a relationship between these two parameters. Spe- developed with specific requirements
cial attention will be given to the error between triplicates, as it is expected that this value will » Low volume assay system for inoculum screenings, » Anaerobic conditions and gas tight-
increase at higher I:S. ness within all process steps, » Possibility of obtaining parallel quantity and quality assess-
ments of solid, liquid and gas phases a various treatment and cultivation steps, » Simple
and cost-effective analysis of biogas production.
The identified requirements could be fulfilled by “All-in-one” test system that consists of
mini-bioreactors (MBR) with a maximum volume of V = 25–50 mL. The main advantage of
such a system is the realization of all process steps, namely: sample preparation (incubation
and centrifugation), lyophilisation and anaerobic digestion according VDI 4630 (2016) in the
same reactor. Moreover, the different preparation steps and procedures were continuously
optimized within the frame of this research. A general and simplified scheme of “All-in-one”
IVMBR
CMP–2019
test system is shown in Figure 1.
Conference on
References Monitoring & Process Control of Anaerobic Digestion Plants
March 26–27, 2019 in Leipzig
Angelidaki, I.; Alves, M.; Bolzonella, D.; Borzacconi, L.; Campos, J. L.; Guwy, A. J.; Kalyuzhnyi, S.; Jenicek, P.; van Lier, J. B. (2009): Defining the biom-
ethane potential (BMP) of solid organic wastes and energy crops: a proposed protocol for batch assays. Water Sci. Technol. 2009, 59 (5), 927–934
DOI: 10.2166/wst.2009.040
Ward, A. J.; Feng, L.; Moset, V.; Moller, H.B. (2018): Estimation of Methane Yields in Continuous Biogas Reactors Using Kinetic and Mass Flow Mod-
els. Chem. Eng. Technol. 41, 4, 761–767. doi.org/10.1002/ceat.201700497
Feng, L.; Wahid, R.; Ward, A. J.; Moller, H.B. (2017): Anaerobic co-digestion of cattle manure and meadow grass: Effect of serial configurations of
continuous stirred tank reactors (CSTRs). Biosyst. Eng. 2017, 160, 1–11. DOI: 10.1016/j.biosystemseng.2017.05.002
Alastair James Ward
Aarhus University, Contact Figure 1 General and
Biological and Chemical Engineering +45 (0) 4112 2494 simplified scheme of “All-
Blichers Allé 20, 8830 Tjele, Denmark alastair.ward@eng.au.dk in-one” mini-bioreactor test
system (MBR)
Figure 1. General and simplified scheme of “All-in-one” mini-bioreactor test system (MBR)
Literature:
Bhattad, Ujwal; Venkiteshwaran, Kaushik; Maki, James S.; Zotomer, Daniel H. (2017): Biochemical methane26 LAB TESTS WITH A MINI-BIOREACTOR TEST SYSTEM (ALL-IN-ONE) FOR THE DEVELOPEMENT OF STANDARDISED AND STORABEL INOCULA FOR BMP-TESTS IMPROVING BMP DETERMINATION WITH MASS-BASED MEASUREMENTS 27
Sasha D. Hafner 1, Camilla G. Justesen 1, Jacob R. Mortensen 1, Rasmus Thorsen 1, Sergi Astals 2, Brian K. Richards 3
Improving BMP determination with mass-based measurements
# Biogas, biochemical methane potential (BMP), gravimetric, laboratory methods, gas density
The test results showed that a preservation of inocula, which are produced under standard- Measurement of biochemical methane potential (BMP) is essential for both research and
ised conditions, is possible. The following anaerobic batch tests of the resuspended inocula optimal operation of biogas plants. But multiple blind comparisons have shown that large
showed a high recovery of expected methane production. However, obtained results indi- biases in BMP measurement exist among laboratories. Although the use of commercial,
cated a lag phase of 7–10 days within the methane production, which is possibly occurring automated systems can reduce variability, purchase costs are high. Conversely, simple
due to the cell damage of microorganisms, as a consequence of the preservation process. manual methods require less expensive equipment, but accuracy may be poor, and labour
Research activities of BHATTAD et al. (2017) reported similar lag phase duration. Further inves- costs can be high. The aim of this work is to describe recent developments in mass-based
tigations will be carried out to optimise the preservation process of the produced inocula for measurements of BMP that can improve the accuracy of BMP measurements and reduce
the aim of decreasingthe lag phase. costs.
Measurement of BMP bottle mass loss in response to removal of biogas provides accurate
and relatively sensitive determination of CH4 production (detection limit of 10 mL). The
general approach was first described nearly 30 years ago (RICHARDS et al. 1991), and recently
refined (HAFNER et al. 2015). Free software provides access to data processing algorithms
(Hafner et al. 2018a). A typical laboratory scale with a readability of 10 mg and limit of 2 kg
is more than sufficient for most BMP trials. Unlike conventional manometric and volumetric
methods, this gravimetric approach is not affected by leaks, and is much less sensitive to
headspace pressure and temperature. One drawback is a higher sensitivity to error in CH4
concentration (ca. 8 % error in CH4 production for an error of 3 % volume). The method also
References has lower sensitivity than conventional volumetric and gravimetric alternatives, but this
Bhattad, U.; Venkiteshwaran, K.; Maki, J. S.; Zotomer, D. H. (2017): Biochemical methane potential assays and anaerobic digester bioaugmentation
IV CMPdifference
2019 is less important than differences in accuracy. New measurements comparing
manometric and gravimetric approaches showed similar random error, but much smaller
using freeze dried bomass. In: Environ. Sci.: Water Res. Technol. 3 (6), S.1152–1161. DOI: 10.1039/C7EW00203C. Conference on
effects of headspace pressure and volume in gravimetric results (Fig. 1).
Hagen, L.; Vivekanand, V.; Pope, P.; Eijsink, V.; Horn, S. (2015): The effect of storage conditions on microbial community composition and biometh- Monitoring & Process Control of Anaerobic Digestion Plants
ane potential in a biogas starter culture, Appl Microbiol Biotechnol 99:5749–5761.
March 26–27, 2019 in Leipzig
Heerenklage, J.; Sahm, K.; Rechtenbach, D.; Roeske, I.; Atamaniuk, I.; Antranikian, G.; Kuchta, K. (2017): Development of a method to produce In many BMP methods it is taken as a matter of faith that biogas leakage is not significant,
standardized inocula for biomethane potential tests. In: Abstract booklet of the International Conference “Progress in Biogas IV – Science meets
but recent work shows this may not be true. Measurement of mass loss during bottle incu-
Practise”, 8th – 11th March 2017, University of Hohenheim, Stuttgart, Germany. new method has promise: BMP values calculated with the two methods were generally within 6% of each
bation provides adifference
simple wayof to9%
detect, and even(Table
correct1).
for,Sampling
leakage (H AFNER et al. 2018b).
Holliger, C.; Alves, M.; Andrade, D.; Angelidaki, I.; Astals, S.; Baier, U.; Bougrier, C.; Buffiere, P.; Carballa, M.; de Wilde, V.; Ebertseder, F.; Fernan- other, with a maximum for ethanol effort is low in the GD method: 2-3
dez, B.; Ficara, E.; Fotidis, I.; Frigon, J.-C.; de Laclos, H. F.; Ghasimi, D. S. M.; Hack, G.; Hartel, M.; Heerenklage, J.; Horvath, I. S.; Jenicek, P.; Koch, In general, losses as low
min. per bottle per sampling event. as 10 % of total biogas production can be detected. Application
K.; Krautwald, J.; Lizasoain, J.; Liu, J.; Mosberger, L.; Nistor, M.; Oechsner, H.; Oliveira, J. V.; Paterson, M.; Pauss, A.; Pommier, S.; Porqueddu, I.;
Raposo, F.; Ribeiro, T.; Rusch Pfund, F.; Stromberg, S.; Torrijos, M.; van Eekert, M.; van Lier, J.; Wedwitschka, H.; Wierinck, I. (2016): Towards a of the method in three trials showed some detectable leakage in each trial, suggesting
standardization of biomethane potential tests. / In: Water Science and Technology, Vol. 74, No. 11, 2016, p. 2515-2522. that researchers
In conclusion, should
gravimetric regularly have
approaches checkthefor leakage.
potentialNew results comparing
to improve three types through: 1) better
BMP measurement
Koch, Konrad; Lippert, Thomas; Drewes, Jörg. (2017): The role of inoculum`s origin on the methane yield of different substrates in biochemical accuracy,
ofby
20eliminating the effect
mm setpa show of leaksthin
that common and(3biases related
mm) butyl septatomaymanometric
leak aboveand volumetric
a pressure of measurement,
methane potentias (BMP) tests. In: Bioresource technology 243, S. 457–463. DOI:10.1016/j.biotech.2017.06.142.
2) lower1cost, by reducing
bar (gauge), equipment
while thicker andbutyl
(13 mm) labour needs,
septa andreliable
are more 3) accessibility,
(Fig. 1). by eliminating the need for
Raposo, F.; Fernández-Cegrí, V.; De la Rubia, M. A.; Borja, R.; Béline, F.; Cavinato, C.; Demirer, G.; Fernández, B.; Fernández-Polanco, M.; Frigon, J.
C.; Ganesh, R.; Kaparaju, P.; Koubova, J.; Méndez, R.; Menin, G.; Peene, A.; Scherer, P.; Torrijos, M.; Uellendahl, H.: Wierinck, I.; de Wilde, V. (2011):
biogas analysis.
Biochemical methane potential (BMP) of solid organic substrates: evaluation of anaerobic biodegradability using data from an international inter-
laboratory study. Journal of Chemical Technology & Biotechnology 86, 1088–1098.
Figure 1 Comparison of
VDI 4630 (2016): Fermentation of organic materials – Characterization of the substrate, sampling, collection of material data, fermentation tests.
VDI - Handbuch Energietechnik. manometric (light grey)
and gravimetric (dark grey)
measurement of BMP of
primary wastewater sludge
(n = 3 bottles, bars show
standard deviation). Meas-
urements were made using
three types of septa and
two headspace fractions
(headspace was 24 % or
51 % of the total bottle
volume). Grey septa used
with the lower headspace
Jörn Heerenklage volume (and higher head-
space pressure) lost 25 %
of biogas production to
Hamburg University of Technology Contact
leakage.
Harburger Schlossstrasse 36, 21079 Hamburg, +49 (0) 40 42878 3526 Figure 1: Comparison of manometric (light grey) and gravimetric (dark grey) measurement of BMP of primary
Germany heerenklage@tuhh.de wastewater
1 sludge. Measurements were made using three types of septa and two headspace fractions
Aarhus University, Aarhus N, Denmark
(headspace
2 was 24% or 51% of the total bottle volume).
Advanced Water Management Centre, The University of Queensland, Brisbane, Australia
3
Cornell University, Ithaca NY, USA
Table 1: Biochemical methane potential (BMP) of five substrates measured using a conventional volumetric
method and the new gas density (GD) method. For all conditions, n = 3 bottles. Substrates A, B, and C were
animal feed ingredients.
Volumetric BMP (mL/g) GD BMP (mL/g)You can also read