Internet Estimating thE ValuE of - ICRIER
←
→
Page content transcription
If your browser does not render page correctly, please read the page content below
J U LY 2 0 17

Estimating the Value of
New Generation

Internet
Based Applications
in India

Rajat Kathuria | Mansi Kedia | Gangesh Sreekumar Varma | Kaushambi Bagchi

                                              July 2017   /   Estimating the Value of New Generation Internet Based Applications in India / 1
2 / Estimating the Value of New Generation Internet Based Applications in India / July 2017

CONTENTS
Acknowledgements.......................................................................................................................................5
Executive Summary.......................................................................................................................................6
Chapter 1. Introduction...............................................................................................................................9
Chapter 2. Measuring the Economic Impact......................................................................................... 11
Chapter 3. Impact Illustration using Case Studies............................................................................... 18
Chapter 4. In lieu of a Conclusion.......................................................................................................... 26
Appendix....................................................................................................................................................... 30
Bibliography.................................................................................................................................................. 52

                                                                 List of Figures
Figure 1: 	Scatter plot for GDP per capita and Internet Density
            across 19 states in India (2015-16)...................................................................................... 12
Figure 2a: 	Scatter plot for GDP per capita and Total Internet Traffic
            across 19 states in India (2015-16)...................................................................................... 13
Figure 2b: 	Scatter plot for GDP per capita and Mobile Internet Traffic
           across 19 states in India (2015-16)...................................................................................... 13
Figure 3:	Framework for Selection of Case Studies.......................................................................... 19

                                                                  List of Tables
Table 1: Descriptive Statistics for cross-country regression (Equations 1 and 2)........................ 14
Table 2: Descriptive Statistics for Regression Models on India (Equations 3 and 4)................... 15
Table 3: Comparison of estimated growth elasticities........................................................................ 16
Table 4: Description, Impact and Challenges for Selected Apps....................................................... 19
Table 5: Categories of App Store guidelines.......................................................................................... 27

                                                                                                     July 2017   /   Estimating the Value of New Generation Internet Based Applications in India / 3
4 / Estimating the Value of New Generation Internet Based Applications in India / July 2017
Acknowledgements
 W
              e gratefully acknowledge the contribution of
              Broadband India Forum (BIF) and its members
              in facilitating this research. We humbly
 recognise the co-operation of T V Ramachandran, Sandhya
 Balasubrahmanyam, and Garima Kapoor from BIF without
 whose constant support and diligence the report would
 not have been possible. We would also like to thank Vivan
 Sharan from Koan Advisory for taking out the time to help
 us connect with app based service companies.The richness
 of the case studies has added immense value to the study
 and the insights of willing representatives from the content
 creators featured in this report have been fundamental.
 We are grateful for their profound interest in our study
 and for making the time to engage with the research team.
 We would also like to thank Usha Andra from CISCO VNI
 who promptly agreed to share invaluable data and helped
 with decoding it. Our diligent interns Saumitra Khullar,
 Tanya Vaidya and Manvi Puri have been nothing short of
 a blessing, always standing by to rescue us from difficult
 situations. We are also grateful to all our colleagues at
 ICRIER for providing a stimulating environment that makes
 such research possible. All errors are our own.

                                            July 2017   /   Estimating the Value of New Generation Internet Based Applications in India / 5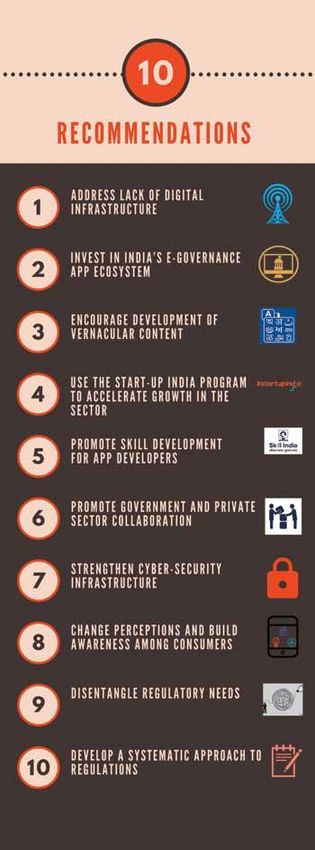
Executive Summary
        T                                                                                     Key results from the econometric
                he growth of the app economy is nothing short of
                extraordinary in India. App Annie recently ranked                             estimation are:
                India as the fourth largest app economy in the world.
        With over 94 percent subscribers connecting to the Internet
        on their mobile phone, it is no surprise that India is leading                          10% increase in global Internet traffic, delivers on average a 1.3%
        the global phablet revolution. India now tops the chart in                            increase in global GDP and a 10% increase in global mobile Internet
        Google Play downloads when compared to Indonesia, Russia,                             traffic, delivers on average a 0.7% increase in global GDP
        Brazil and USA.                                                                         10% increase in India’s total Internet traffic, delivers on average
                                                                                              a 3.3% increase in India’s GDP, and a 10% increase in India’s mobile
        Internet and Internet based applications have drastically and                         Internet traffic, delivers on average a 1.3% increase in India’s GDP
        quickly transformed the architecture of economic activity.
        Their evolution has sent regulators of legacy services such
        as telecommunications, cable and broadcast, commercial
        public transport etc. scrambling to manage disruption. Other
        stakeholders involved in related industries such as advertising
        have also had to adapt to this new revolution.

        The academic economic literature has captured the impact
        of this phenomenon. Several global growth impact studies
        are available and for India ICRIER first estimated the growth
        impact of the Internet in 2012. The estimates have been
        periodically updated. The most recent estimate shows
        that 10% increase in internet penetration results in a 2.4%
        increase in the growth of state per capita GDP.

        The current study is a departure from previous research,
        as it attempts to measure growth elasticity based on
        Internet usage and not Internet penetration. We feel this is
        a refinement in the approach to measure impacts given that
        subscriptions sometimes do not translate into usage. Thus
        usage elasticity is conceptually a more accurate estimate of
        the growth dividend, although it also requires more precise
        data on usage patterns. In this study, we measure Internet
        usage elasticity for India using an instrumental variable
        regression on a panel data set of 19 Indian states. We also
        do a similar exercise for 23 countries in order to draw
        international comparisons with the Indian estimates. The
        growth coefficients of usage, a first for India, are a starting
        point to understand the magnitude of the growth impact of
        app-based usage.

        Since not all Internet usage is app based, we moderate the
        estimate using assumptions on contribution of apps to the
        Internet Economy in India. We measure Internet usage with
        CISCO VNI data on total Internet traffic in petabytes per                                       Figure 1:
        month and mobile Internet traffic in petabytes per month.                                   Estimates for
                                                                                                impact of apps on
        The results from the econometric estimations are fortified                            the global economy
        by case study illustrations of impact generated at the micro-                                  and India’s
                                                                                                         economy
        level using a carefully selected collection of 16 apps. The
        sample of featured apps are chosen to represent the app

6 / Estimating the Value of New Generation Internet Based Applications in India / July 2017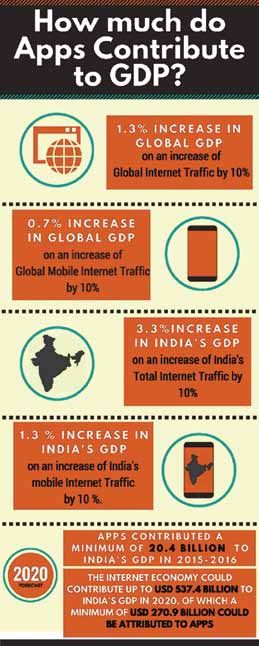
17% increase in India’s Internet traffic during the period 2015-                         ently-abled, Direct employment by each of these apps
2016, resulted in an absolute increase of USD 103.9 billion (Rs. 6,926.5                   including PayTM and MMT which work with a team of
billion) in India’s GDP during the year. An equivalent increase in India’s                 over 1000 employees each
mobile internet traffic during the period 2015-16, would result in an
absolute increase of USD 41.4 billion (Rs. 2759.9 billion) in India’s GDP                   fficiency in Service Delivery (One stop shop for
                                                                                           E
during the year                                                                            multiple services): MP mobile and Umang - Integrated
  Apps contributed a minimum of USD 20.4 billion (Rs. 1357.6                               multiple government services under a single platform
billion) in the year 2015-16 to India’s GDP
                                                                                            roviding smaller businesses/individuals a
                                                                                           P
  The Internet economy could contribute up to USD 537.4                                    platform to market their product/service: MMT-
billion to India’s GDP in 2020, of which a minimum of USD 270.9 billion                    Certification program enabled budget hotels to generate
(Rs.18275.9 billion) could be attributed to apps                                           business through the MMT platform

                                                                                           ncouraging disintermediation and lowering
                                                                                           E
economy in its entirety - across sectors, the traditional and                              cost to buyers and sellers: farMart - Platform
the modern, across urban and rural areas and the established                               enabled demand-supply match lowered cost of
along with those that are new and upcoming.                                                equipment leasing by upto 20%

Each selected app, other than those falling in the                                          opularising use of vernacular languages: Mooshak-
                                                                                           P
e-governance category, address a unique market need,                                       Changing social perceptions on the use of local languages
either left unresolved by the market and/ or government                                    within a society where use of English is more fashionable
intervention. E-governance apps capture the increased
                                                                                           nabling women safety: Truecaller – Caller
                                                                                           E
transparency and efficiency of bringing citizen related
                                                                                           identification has helped women manage and block calls
information and services online. While most apps cater to
                                                                                           from unwanted numbers/ people
the entire population, we have selected a few that focus
only on urban or only on rural users, and some others that                           For apps to thrive, it is necessary that we address the many
are limited to a specific locality. The case study discussions                       challenges that might limit their growth in the future. The
measure the magnitude of impact created, and also identify                           policy challenges exist both on the demand and supply sides.
challenges to their growth. These challenges feed into our
policy discussion.                                                                   On the supply side, most apps are affected by the limited
                                                                                     availability of network infrastructure or Internet connectivity
The broad socio-economic impacts captured by the case                                in the areas they opt to serve. Moreover, app design must
studies are summarized below. It is notable how one single                           be improved to operate in light versions that function even
app delivers multiple impacts - a combination of economic                            where network connectivity is weak and on lower cost
and social development and on occasions, different aspects                           smartphones. Demand side challenges are largely associated
of economic growth or social upliftment. The impacts arising                         with availability of content in regional languages. With a huge
out of apps discussed in this report are:                                            non-English speaking user base, even for e-governance apps
                                                                                     such as MP Mobile the dominance of English is restricting
     Potential for increased income: Urbanclap – Income                             the use of apps by people in semi-urban and rural areas. App
     for service providers within some categories increased                          development and app design must also address the rising
     by upto 4 times                                                                 need for increased data security, especially in case of digital
                                                                                     payment apps.
     Access to information and
     reduced       asymmetry:
     Practo- Created a fresh da-
     tabase of verified doctors
     based on specialization and
     patient feedback

     Impact on the social per-
     ception and self image
     of the differently-abled:
     Inclov- Facilitated matchmak-
     ing for the differently-abled
     and transformed physical
     spaces into accessible areas
     for the differently-abled

     Job Creation: Inclov- Part-
      nered with hotels to create
      employment for the differ-              Figure 2: Framework for Selection of Case Studies

                                                                                                  July 2017   /   Estimating the Value of New Generation Internet Based Applications in India / 7
Apps have facilitated the creation of business models,
        which require regulators to think beyond the comfort
        of traditional businesses that operate in physical spaces
        and require physical movement of goods and services.
        The emergence of digital media, e-pharmacies, etc. falls
        outside the regulations within which each of these sectors
        currently operates. Services delivered through the digital
        platform sometimes constrained by the absence of clarity
        on regulations. As apps become core to many businesses,
        sectoral policies must also align themselves to allow smooth
        functioning and integration of apps into the economy.

        Policy challenges arise in the natural course of innovation
        and disruption.Apps too have stirred policy debates involving
        regulation of Over-the-Top (OTT) services, which broadly
        refer to services that are delivered using existing Internet
        infrastructure and connectivity provided by a third party.This
        study is focused primarily on estimating the economic impact
        of apps. A study of the regulatory environment in which apps
        operate calls for an independent and explicit assessment that
        takes in account global experience, the innovation character
        of apps and an analysis of the instruments, both formal and
        informal, that could be used for regulation.

        app design must be
        improved to operate
        in light versions that
        function even where
        network connectivity is
        weak and on lower cost
        smartphones.

        The discourse on policies towards OTTs and apps is far from
        settled. However, it may be considered that in the case of
        new generation internet based application services that have
        significant socio-economic impact, – it would be premature
        to pass hard rules. Careful and planned approaches to soft
        law can be attempted and later developed into more firm
        rules as the sector matures. The benefits and impacts of the
        app economy are extensively discussed, and reiterated by the                          Figure 3: Recommendations
        findings in this study. All that is left to be done now is to
        nurture growth in the fertile app market that can also serve
        as a catalyst for digital India.

8 / Estimating the Value of New Generation Internet Based Applications in India / July 2017
1. Introduction
Mobile phones have become ubiquitous among Indians,                                       have fallen from around $3.5 to $1.8 in the same period6.
with over a billion connections today.1 In 2016, India grew                               With smartphone penetration set to double by 2022, the
to become the second largest market of mobile phones in                                   increase in data traffic per smartphone is expected to grow
the world, with about half of its population having a mobile                              by more than double, from 4 GB per month in 2016 to 11
phone. In the same year, India also became the second                                     GB per month in 20227.
largest smart phone market in the world. While the smart
phone market continues to grow, its penetration currently                                 Rise of Apps
represents about 30% of the country’s population2. This
growth also represents a significant change in its utility from                           At the heart of the smart phone revolution is the ‘app’.
being merely a communication device using voice telephony                                 The term app is an abbreviated form of ‘application’ and
to a consumption device with numerous offerings ranging                                   is essentially a software application on a mobile device.
from entertainment to e-governance services.                                              The early apps on mobile devices were often termed as
                                                                                          ‘features’ and were pre-loaded on the device. Alarm clocks
Numerous schemes and initiatives of the government                                        and, calculators etc. were some of the simplest and earliest
drive India’s development agenda. Many of these rely on                                   apps that were featured on mobile phones.The iconic ‘snake’
digitization, access to mobile, and access to Internet. Starting                          game on mobile phones was also an app. The fundamental
in 2015, the Digital India initiative consolidated efforts of the                         nature of the app took a turn with the availability of email
government in digitization of government services under a                                 on mobile devices.Among the pioneers that popularized this
single umbrella. This flagship programme of the government                                were Blackberry and Palm OS devices.
envisioned the transformation of India into a digitally
empowered society and knowledge economy beginning
with the provision of digital infrastructure as a core utility to
every citizen. Similarly, JAM (Jan-Dhan, Aadhaar, and Mobile)
proposed linking Jan-Dhan accounts, mobile numbers and
Aadhaar cards to avoid leakages in subsidy programmes.The                                smart phone market
recent demonetization drive of the government resulted in
a significant push towards digital payments.The Smart Cities                             continues to grow, its
Project is also expected to further the need for connectivity                            penetration currently
infrastructure.
                                                                                         represents about
India has often been referred to as a ‘mobile first’3 nation.
As noted above, the government has been leveraging the                                   30% of the country’s
penetration of and access to mobile phones. Over 94%                                     population.
internet connections in India are wireless4. Additionally, a
recent survey suggest as much as 58% consumers accessed
the Internet only through their mobile phones. Consequently,
content and service providers are increasingly focusing on                                With the launch of Apple’s iPhone in 2007, the world of apps
mobile first strategies5. The Indian consumer’s appetite                                  transformed forever. Soon after the iPhone, the App Store
for data has only been growing. The volume of wireless                                    was launched. Interestingly, the initial proposition did not
broadband data consumed by Indians has risen sharply,                                     truly envisage third party app development. At first, Apple
from less than 200 million gigabytes (GB) a month in June                                 offered developers the opportunity to build web-based
2016, to around 1.3 billion GB a month in March 2017. This                                apps, but it wasn’t until a few months later in October 2007
growth includes the disruptive entry of Reliance Jio, which                               that they announced Software Development Kits (SDKs)
started operations in September 2016. Data prices per GB                                  for third party app development8.The new business model

1. GSMA Intelligence 2017. The number of unique subscribers in India were 616 million as on June 2016
2. https://www.statista.com/statistics/257048/smartphone-user-penetration-in-india/
3. The ‘mobile first’ paradigm refers to the use of mobile technology as top priority in a country’s development agenda
4. TRAI Performance Indicators Report, December 2016
5. Zinnov (2016), India as a Mobile First Nation: Opportunities and Challenges; See also https://www.appannie.com/en/insights/mobile-now-first-screen/
6. Internet Trends 2017, Kleiner Perkins Caufield Byer (KPCB)
7. Ericsson (2017) Mobility Report. Available at https://www.ericsson.com/assets/local/mobility-report/documents/2017/ericsson-mobility-report-june-2017-rina.pdf
8. https://www.forbes.com/sites/markrogowsky/2014/07/11/app-store-at-6-how-steve-jobs-biggest-blunder-became-one-of-apples-greatest-strengths/#6a0c77644652

                                                                                                          July 2017   /   Estimating the Value of New Generation Internet Based Applications in India / 9
broke the ‘walled garden’ through which network operators                              spending associated with communication on Whatsapp
        controlled the mobile ecosystem. This idea was not easy to                             amounted to between $9.6 and $18.0 billion12 in India in
        execute and posed significant challenges – the most crucial                            2015. In fact government apps such as Bharat Interface for
        being the balance between providing “an advanced and open                              Money (BHIM), Umang, MyGov, Incredible India, etc. are also
        platform to developers” and “to protect iPhone users from                              helping ease accessibility to government related information
        viruses, malware, privacy attacks, etc”9. It wasn’t until July,                        and services by bringing them online.
        2008 that the App Store was launched, and its success was
        evident with 100 million downloads by November 2008.                                   The evolution of apps had regulators of legacy services such as
        Meanwhile in October 2008, Google launched its Play Store                              telecommunications, cable and broadcast, commercial public
        for the Android OS.                                                                    transport among others scrambling to manage the disruption.
                                                                                               Other stakeholders participating in related industries such as
        In many ways, the fertile ground provided by the mobile                                advertising have also had to adapt to this new revolution. In
        OS platforms for third party app development aided the                                 this background the study seeks to estimate the economic
        proliferation of this new generation of Internet based                                 and social impact of new generation internet based apps and
        mobile apps.                                                                           explore the channels via which such impacts are created.
                                                                                               Understanding the impact will allow regulators to take
        Emergence of the App Economy                                                           decisions based on systematic evidence rather than hastily
                                                                                               responding to groundbreaking innovations.
        Apps have evolved from being offline, and locked-in to devices,
        to being connected online and available across different                               The main objective of the study is to measure and
        operating system platforms. This disruptive innovation                                 demonstrate the impact of apps on GDP. We approach
        resulted in what is commonly referred to as the ‘app economy’.                         the study using two distinct methodologies. The first part
        Apps have time and again challenged existing technology and                            of the study is a quantitative estimation of the impact

          India now tops the chart in Google Play downloads
           when compared to Indonesia, Russia, Brazil and USA.

        services. Right from desktop/laptop based email services, retail                       of apps on GDP using econometric methods applied to
        shopping, taxi services, to voice telephony – all of these have                        quantitative models. These models are reduced forms of a
        had to adapt or compete with new generation Internet based                             set of structural equations that are grounded in economic
        apps. According to a recent report from Flurry Analytics,                              theory. To reinforce the macro-economic results, the
        Asia and India are leading the phablet10 revolution. India now                         second part fortifies these findings though a set of case
        tops the chart in Google Play downloads when compared to                               studies, which examine apps across various sectors and
        Indonesia, Russia, Brazil and USA11. The top downloaded apps                           trace the channels through which economic and social
        from Google’s Playstore by Indian users are Whatsapp and                               impact are generated. Sections 2 and 3 of the paper focus
        Facebook Messenger. Indigenous entertainment apps such as                              on the impact assessments, followed by the concluding
        Hotstar and Jio TV have also climbed the charts as popular                             Section 4 that also reflects on the implications for policy as
        apps among Indians. According to a recent estimate on the                              a result of the disruptions sparked by app based platforms
        economic impacts of Whatsapp, discretionary consumer                                   in the service economy.

        9. https://smarthealthit.org/2009/09/open-and-safe-hit-platforms/
        10. Phablets are devices with screens between 5” to 6.9”
        11. Internet Trends 2017, KPCB
        12. Rafert and Mate, 2017, “The Global and Country-level Economic Impacts of Whatsapp”, Analysis Group

10 / Estimating the Value of New Generation Internet Based Applications in India / July 2017
2. Measuring the Economic Impact
With close to three decades
of empirical analysis, there is
some consensus on the con-
tribution of Information and
Communication Technology
(ICT) to economic growth.
Theoretical research in this
area was initiated by a se-
ries of studies that focused
on measuring the impact of
IT on aggregate productiv-
ity and output growth for
individual countries, mostly
the United States. The initial
papers found little contribu-
tion of ICT to productivity13;
Solow summarized these
findings into his famous aph-
orism“you can see the computer age everywhere but in the pro- have occurred16. In the current era of the “gig” economy17,
ductivity statistics”. Several attempts were made to explain this we can be certain that some of these growth benefits have
productivity paradox in the research that followed. With im- already kicked in. In comparison with electrification, the other
proved data sets and growth accounting methodologies, stud- important GPT era from 1894 to 1930, ICT has shown faster
ies in the new millennium began to show that investment in improvement and higher number of innovations, measured in
ICT did in fact impact economic growth significantly. Ever terms of patents and trademarks issued18.
since, the literature on growth dividends of ICT has evolved
into two distinct streams, one that captures the productivity The technological dynamism of the sector has also found
impacts created by increased production and accumulation expression in the empirical literature. Recent research
of IT capital; and the other that captures the general pur- uses two broad approaches – (i) input output method to
pose technology (GPT) nature of ICT. The former, popularly estimate the impact of ICT infrastructure (telecom, internet
referred to as the “ICT-centered story14” highlights the increase and broadband) on economic growth and employment19
in productivity through direct total factor productivity (TFP) (ii) Multivariate regression analysis to establish a causal
increase in ICT-producing sectors, and through capital deep- link between ICT infrastructure and economic growth.
ening and labour productivity improvements in ICT-using A pioneering study in the latter genre by Roller and
sectors. These studies aggregate findings at the firm-level to Waverman(2001)20 was the first to address the two-way
make macro-economic generalizations. The latter is an “ICT- causality between GDP growth and telecommunications
related story15”, which captures structural shifts and creation investments by building a structural model that endogenised
of spill-over benefits at the macro-economic level.The perva- the latter21. This simply means that the estimation technique
sive use of computers and related equipments across sectors recognizes that causality could also run from income
of the economy, allow ICT to be seen as a GPT. Moreover, level to telephone investment and ignoring this impact
technological innovation has facilitated new ways of running could exaggerate the results. Even after controlling for
and organizing businesses. It is argued that benefits of a new this effect, the results clearly showed a significant impact
GPT are realized only once adequate secondary innovations of telecommunications infrastructure and that it is not
13. Roach (1987, 1989, 1991); Baily (1986b); Zachary (1991); Berndt and Morrison (1995), Jorgenson and Stiroh (1995)
14. Oliner et al, 2007, “Explaining a Productive Decade”, Finance and Economics Discussion Series, Division of Research & Statistics and Monetary Affairs, Federal Reserve
Board, Washington, D.C.
15. Op Cit
16. Helpman and Trajtenberg, 1994,
17. “Gig economy” is a reference to internet enabled labour markets characterized by short term contracts or freelance workers as opposed to permanent jobs
18. Jovanovic and Rousseau, 2005, “General Purpose Technologies” Chapter 18 Handbook of Economic Growth Volume 1 Part , Pages 1881 - 1224
19. Crandall (2003), Katz et al (2009), Katz et al (2008), Atkinson (2009), Libenau (2009)
20. Roller and Waverman, 2001, “Telecommunications Infrastructure and Economic Development: A Simultaneous Approach”, American Economic Review, 91(4), pp. 909-23
21. The authors use a four-equation model with an aggregate production function, telecommunications demand and supply, and a telecommunications production function with
data from 21 OECD and 14 developing countries.
July 2017 / Estimating the Value of New Generation Internet Based Applications in India / 11necessarily linear. Thus telecommunications investment
creates network externalities that are an increasing function
of the number of users. Roller and Waverman’s method
was adapted in several studies (both cross-country and
sub-national) to estimate the impact of different ICT/
telecommunication measures (investment, subscribers,
users, mobile, internet, broadband) on economic growth22. 10% increase
Other studies in this category have adopted Barro’s (1991)23 in internet subscribers
endogenous growth model, popularly used to unpick the
growth impacts of telecommunication infrastructure24.
results in a 2.4% increase
The model is based on a static cross-country regression in the growth of state
framework that estimates the causal effect of various policy/
environmental/infrastructure variables on growth.
per capita GDP.
India, like most emerging markets, has benefitted immensely
from ICT diffusion. The studies undertaken at ICRIER, have business as usual scenario, one more person hired in the
estimated the growth impacts of both mobile and Internet app economy would result in an increase of 1.2 persons in
on the Indian economy over time25. According to the most direct and indirect employment, and 2.9 in direct, indirect
recent estimate a 10% increase in internet subscribers results and induced employment30.
in a 2.4% increase in the growth of state per capita GDP. The
unprecedented increase in Internet subscribers over the last The growth of the app economy in India has been impressive.
few years can help explain why this estimate is higher than the App Annie, an app-analytics company, recently ranked India
global average for developing countries26. While global Internet as the fourth largest app economy in the world, with annual
subscribers increased at an annual average rate of 8.5% during app downloads to touch 7.7 billion by the end of 2017. This
2013-2016, the comparable increase in India was 24.2%, largely growth is however, not uniform. India, often justifiably referred
fueled by the rise of mobile Internet subscribers27. However, to as a subcontinent displays remarkable demographic
Internet usage in India has not increased commensurately, variety across its 29 states and 7 union territories. This
global Internet traffic in peta bytes per month increased at heterogeneity makes measurement of impacts possible at
an annual average rate of about 30% while the comparable the sub-national level. Figure 1 shows the variance in Internet
increase in India was 21.7%28 during the same period. The density and income levels across the states of India. For ease
cost of Internet data plans and smart
phones have inhibited growth in data use,
in a price sensitive market such as India.
Other factors may include inadequate
vernacular content, digital illiteracy, etc.
These trends are gradually reversing
with the lowering cost of technology
and rising competition in the services
market, jolted by Reliance Jio, the new
Schumpeter in India’s telecom market.
This study seeks to quantify the impact Source: TRAI Performance Indicators Report and CSO
of Internet usage, and more importantly
to isolate the impact of Internet based
application services, more generally,
India’s app economy on GDP growth.
In 2015, we estimated the impact of
the app economy on job creation in
India using the input-output model for
India29. Our study found that under the Figure 1: Scatter plot for GDP per capita and Internet Density across 19 states in India (2015-16)
22. Sridhar and Sridhar (2004), Qiang et al (2009), Kathuria et al (2009), Koutrpompis (2009)
23. Barro, 1991, “Economic Growth in a Cross Section of Countries”, Quarterly Journal of Economics, Vol 106, No. 2, pp. 407-443
24. Qiang et al (2009), Adrianaivo and Kpodar (2011), Vu (2011), Chavula (2012)
25. Kathuria et al 2009, Kathuria and Kedia (2012), Kathuria et al (2016)
26. According to a World Bank study, developing economies show a 10% increase in broadband penetration increase per capita GDP growth by 1.3%
27. Internet Live Stats, Accessible at http://www.internetlivestats.com/internet-users/, TRAI Performance Indicators Reports (2013, 2016)
28. CISCO Virtual Networking Index Forecasts
29. Kathuria et al, 2015, “An Inquiry into the Impact of India’s App Economy”, ICRIER
30. 1.2 and 2.9 are the Type I and Type II multipliers respectively
12 / Estimating the Value of New Generation Internet Based Applications in India / July 2017Econometric Model
Internet and Internet based
Source: Performance Indicators Report, CSO, CISCO VNI
applications have drastically
transformed the architecture of
economic activity. The ubiquity of
the Internet makes it impossible to
delineate the digital economy from
other components of the traditional
economy. Brynjolfsson and Joo Hee
Oh32 have commented on how
traditional methods that rely on
direct expenditures and money
Figure 2a: Scatter plot for GDP per capita and Total Internet Traffic across 19 states in India (2015-16) spent fail to capture the value of
digital innovations. Leveraging the
idea of the Attention Economy, the
authors estimate how consumers
Source: TRAI Performance Indicators Report, CSO, CISCO VNI
value digital services and innovations
based on the use of their time
spent on the Internet. While data
availability on Internet and Internet
infrastructure has vastly improved
over the last few years, there is
substantial scope for progress in
recording data on type and intensity
of usage, at the individual, firm and
macro level. In this study we employ
usage as opposed to subscribers as
Figure 2b: Scatter plot for GDP per capita and Mobile Internet Traffic across 19 states in India (2015-16) a key driver of impacts since usage
patterns in terms of time spent
and traffic generated is a preferred
of measurement we use data on 19 telecom circles, which are metric for impact assessment. Using subscriber numbers as
almost contiguous with state boundaries31. The states lie on a proxy to measure value generated by Internet applications
a smooth positively sloped exponential trend line, establishing implicitly assumes that usage across subscribers is uniform
a strong correlation between GDP per capita and Internet and that traffic growth is proportional to subscriber growth.
Density (correlation co-efficient is 0.9). Correlation however With Internet adoption approaching saturation in some
does not imply causation and neither does Internet subscriber countries,33 an assumption of monotonic increase in value
density capture usage trends across demographics and states. (i.e. usage) based on number of users might mistakenly
To isolate the impact of Internet on GDP, usage is an improved overestimate the impact. Internet penetration elasticity is
indicator compared to density. In the absence of data on not the same as Internet usage elasticity. Global literature
state-wise Internet traffic patterns, we assume uniform usage on Internet penetration or Internet user elasticity,
across subscribers and distribute total Internet traffic for finds that a 10% increase in broadband penetration can
India across states in the proportion of subscribers per state. increase GDP growth by 0.9% to 1.5% on average34. The
Data on total Internet traffic in India was made available by corresponding numbers for Internet usage elasticity are
CISCO from their estimates of the Virtual Networking Index significantly lower. A recent study by Deloitte35 reports
(VNI). Figures 2a and 2b display the correlation between total that doubling of mobile data usage can have a positive
Internet traffic and GDP, and mobile Internet traffic and GDP impact on GDP per capita growth ranging between 0.03%
respectively for 19 states in India. We use estimated values to 1.42% over a year. Some research has also estimated
of total Internet traffic and mobile Internet traffic for the the impact of increased broadband speeds on GDP growth,
econometric estimation in the next section. with elasticities ranging from 0.03% to 0.98%.36
31. The assumptions and data modifications are explained in Section 2.1
32. Brynjolfsson and JooHee Oh, 2012, “Measuring the Attention Economy” MIT Initiative on the Digital Economy
33. Internet penetration in United States South Korea, United Kingdom, Japan, Germany, France, Italy, etc. are all over 85%
34. Qiang et al (2009); Koutrompis (2009); McKinsey (2012)
35. Deloitte, 2012, “What is the impact of mobile telephony on economy growth?” A report for the GSM Association. Available at https://www.gsma.com/publicpolicy/wp-content/
uploads/2012/11/gsma-deloitte-impact-mobile-telephony-economic-growth.pdf
36. Deloitte, 2016, “The economic impact of disruptions to Internet connectivity” A report for Facebook. Available at http://globalnetworkinitiative.org/sites/default/files/The-
Economic-Impact-of-Disruptions-to-Internet-Connectivity-Deloitte.pdf
July 2017 / Estimating the Value of New Generation Internet Based Applications in India / 13In this study, we measure Internet usage elasticity for India per 1 million is treated as the instrumental variable. Data
using an instrumental variable regression on a panel data on secure Internet servers for each country has been
set of 19 Indian states. We also do a similar exercise for extracted from the ITU database.
23 countries in order to draw international comparisons
with the Indian estimates. This is the first time that Table 1 below, provides the descriptive statistics for
Internet usage elasticity is calculated for India and it is a equations 1 and 2. The range and standard deviation for
starting point to unpick the magnitude of impact of app- both dependent and independent variables in the cross-
based usage. Since not all Internet usage is app based, we country regressions is relatively large when compared to the
need to moderate the estimate using assumptions on descriptive statistics for the models using data on India.
contribution of apps to the
Internet Economy in India to Table 1: Descriptive Statistics for cross-country regression (Equations 1 and 2)
arrive at an accurate estimate. GDP (PPP in Total Internet Traffic Mobile Internet Traffic Capital/
The model specifications USD billion) (in petabyte per month) (in petabyte per month) Labour38
for the Global and India Mean 3,410 1195 52 1.15
estimations are discussed in Standard 4,450 2081 83 3.09
Box 1 and Box 2 respectively.37 Deviation
We measure Internet usage Minimum 144 43 0.49 0.005
with data on total Internet Maximum 19,800 14667 504 13.4
traffic in petabytes per month
and mobile Internet traffic in
petabytes per month as well. Missing values for annual For the India estimation, the logarithmic value of the
investment in telecom have been either extrapolated number of Base Transceiver Stations (BTSs) is used as an
or interpolated. In either case we assume linearity. The instrument. Data on number of BTSs has been extracted
logarithmic value of the number of secure Internet servers from Lok Sabha starred questions.39
Box 1: Global: Model Specification, Assumptions, Data Sources and Descriptive Statistics
Log GDPit = α + ßLog (K/L)it + ѵLog (TotalInternetTraffic)it + Di +Ɛ……………………(1)
Log GDPit = α + ßLog (K/L)it + ѵLog (MobileInternetTraffic)it + Di + Ɛ………………….(2)
Where i goes across 23 countries and t runs from 2011 to 2015
In equation 1,
Log GDPit is the logarithmic value of PPP adjusted nominal GDP in USD for the ith country in year t. Data for this variable has
been extracted from World Bank’s database
Log (K/L)it is the logarithmic value of capital intensity as measured by Purchasing Power Parity (PPP) adjusted Net Investments
(Net of investments in telecommunication) in the ith country in year t divided by Total Labour Force in the ith country in year
t. Data on Net Investments has been estimated by subtracting investments in telecom from total gross capital formation.
Data on PPP adjusted total Gross Fixed Capital Formation (GFCF) is extracted from World Bank and that for investments in
telecommunication is extracted from ITU. Data on total labour force is also extracted from World Bank’s database
Log (TotalInternetTraffic)it is the logarithmic value of total Internet traffic in petabytes per month for the ith country in year t.
Data on total Internet traffic was made available by CISCO’s VNI database.
Di are 23 country dummies
α and ß are the Constant and Error terms respectively
In equation 2,
All variables remain the same, except Log (MobileInternetTraffic)it which is the logarithmic value
37. Since all models use a logarithmic transformation for dependent and independent variables, the coefficients are all elasticities
38. PPP adjusted Net Investments (Net of Investments in Telecom) in USD million divided by total labour force
39. The data for 2013 and 2014 are March figures, however for 2015 and 2016 they are September 2015 and January 2016 respectively. We work with these numbers as the change
in BTSs is not very dynamic during a year.
14 / Estimating the Value of New Generation Internet Based Applications in India / July 2017Box 2: India: Model Specification, Assumptions, Data Sources and Descriptive Statistics
Log GDPit = α + ßLog (K/L)it + ѵLog (TotalInternetTraffic)it + Di + Ɛ…………………...…(3)
Log GDPit = α + ßLog (K/L)it + ѵLog (MobileInternetTraffic)it + Di + Ɛ……………………(4)
Where i goes across 19 states[1] of India and t runs from 2013 to 20162
In equation 3,
Log GDPit is the logarithmic value of nominal state domestic product in rupees lakhs (using the 2011-12 base) for the ith state in
year t. Data for this variable has been extracted from the State Series data of the National Accounts (CSO)3.
Log (K/L)it is the logarithmic value of capital intensity as measured by Net Investments (Net of investments in telecommunication) in
rupees lakhs for the ith state in year t divided by Total Persons Engaged in the ith state in year t. Data on Net Investments has been
estimated by subtracting investments in telecom from total gross capital formation in the country and distributed across states using
the proportion of factories as distributed across states. Data on Net Investments is extracted from the National Accounts Statistics
(CSO), on number of factories and total persons engaged from the Annual Survey of Industries4.
Log (TotalInternetTraffic)it is the logarithmic value of total Internet traffic in petabytes per month for the ith state in year t. In the
absence of state level data, total Internet traffic has been distributed using the proportion of number of Internet subscribers in
each state. CISCO VNI made data on total Internet traffic in India available and data on Internet users was extracted from TRAI
Performance Indicators Report.
Di are 19 state dummies
α and Ɛ are the Constant and Error terms respectively
In equation 4,
All variables remain the same, except Log (MobileInternetTraffic)it which is the logarithmic value of mobile internet traffic in petabytes
per month for the ith state in year t. In the absence of state level data, mobile Internet traffic has been distributed using the proportion
of number of mobile subscribers in each state. CISCO VNI made data on mobile Internet traffic in India available and data on mobile
users was extracted from TRAI Performance Indicators Report..
1 The 19 states include Andhra Pradesh, Assam, Bihar, Delhi, Gujarat Haryana, Himachal Pradesh, Jammu and Kashmir, Karnataka, Kerala, Madhya Pradesh, North East, Orissa, Punjab, Rajasthan,
Tamil Nadu, Uttar Pradesh and West Bengal. For ease of measurement and concordance with telecom administrative circles North East includes Arunachal Pradesh, Tripura, Mizoram, Meghalaya,
Nagaland and Manipur, Uttar Pradesh includes Uttar Pradesh and Uttarakhand, Madhya Pradesh includes Madhya Pradesh and Chattisgarh, Maharashtra includes Maharashtra and Goa, Bihar
includes Bihar and Jharkhand, Tamil Nadu includes Tamil Nadu and Puducherry, West Bengal includes West Bengal, Andaman and Nicobar islands and Sikkim, Punjab includes Punjab and
Chandigarh, Andhra Pradesh includes Andhra Pradesh and Telengana
2 In 2012, definitions for wireless Internet subscribers was revised by TRAI; comparable numbers on Internet usage are therefore available only from March 2013. Data on Internet and mobile traffic, made available by
CISCO VNI have been extrapolated for 2016, using data for years 2011 to 2015
3 Data on State Domestic Product for the modified states has been estimated by aggregating the individual state estimates
4 Data on number of factories and total persons engaged for the modified states has been estimated by aggregating the individual state estimates
Descriptive statistics for the India model are presented in include Jammu & Kashmir, Assam, Bihar, Uttar Pradesh,
Table 2. Besides statistics for the sample as a whole, we West Bengal, Madhya Pradesh, Rajasthan, North East,
also report statistics for developed and developing states, Odisha and Himachal Pradesh. We use the classification to
categorized on the basis of a threshold state per capita identify difference in magnitude of impact across states in
domestic product. The category of developing states the next section.
Table 2: Descriptive Statistics for Regression Models on India (Equations 3 and 4)
SDP Total Internet Traffic Mobile Internet Traffic Capital/
(In rupees crore) (in petabyte per month) (in petabyte per month) Labour40
Developing Mean 455000 35.02 4.69 0.74
Standard Deviation 350000 28.79 4.73 0.16
Minimum 8281978 5.06 0.38 0.45
Maximum 134000000 125.81 21.97 1.04
Developed Mean 81100000 57.18 5.74 0.91
Standard Deviation 43700000 29.78 3.72 0.31
Minimum 31900000 14.92 0.93 0.45
Maximum 202000000 145.59 16.99 1.7
Total Mean 62400000 45.52 5.19 0.82
Standard 43000000 31.13 4.29 0.26
Deviation
Minimum 8281978 5.1 0.38 0.45
Maximum 202000000 145.59 21.97 1.7
40. Net Investments (Net of telecommunication investments) in rupees lakhs divided by total persons engaged
July 2017 / Estimating the Value of New Generation Internet Based Applications in India / 15The key results of the estimation Internet Economy to account for 5.6% of GDP in India by
are: 201645. For mobile internet, an estimated increase of 8% in
traffic during the year 2015-16, resulted in an absolute increase
The coefficients for total Internet traffic and mobile of USD 19.6 billion in India’s GDP in 2016. Of course this is a
Internet traffic in the cross-country regressions are both subset of the total value created by the Internet.
positive and significant41 and imply that a 10% increase
in global Internet traffic, delivers on average a 1.3% The global elasticity estimates are much lower compared
increase in global GDP and a 10% increase in global to those for India. The set of 23 countries used in the
mobile Internet traffic, delivers on average a 0.7% estimation include only 2 countries that fall within the low
increase in global GDP. or lower middle-income category of the World Bank46.
As a result the estimate is more likely to reflect that of
The comparable coefficients for total Internet traffic developed countries, which as empirical literature suggests,
and mobile Internet traffic in India, both positive and is lower than that for developing countries47. It is argued
significant42, imply that a 10% increase in India’s total that telecommunications compensate for infrastructure
Internet traffic, delivers on average a 3.3% increase and service deficits in developing countries that are well
in India’s GDP, and a 10% increase in India’s mobile provided for in developed countries.
Internet traffic, delivers on average a 1.3% increase in
India’s GDP.
Apps versus Browser and the
Table 3 compares the growth elasticity estimate across the impact on GDP in India
four models.
The complex interconnectivity in
operation and usage, make it hard
Table 3: Comparison of estimated growth elasticitiesStatistics for cross-country regression (Equations 1 and 2)
to delineate the value generated by
India Global apps from that of the total Internet.
Total Internet Mobile Total Internet Mobile Moreover, the recent debates on
Traffic Internet Traffic Traffic Internet Traffic consumer preferences for app-based
Growth Elasticity 0.33 (6.83) 0.13(5.96) 0.13 (16.45) 0.07 (15.96) versus browser-based content48,
The numbers in parentheses are t-values especially on mobile phones, adds
another dimension to the problem.
We split the India sample into developed and developing User behaviour suggests that both apps and web serve
states using a threshold level of per capita income (average a purpose, and are likely to co-exist. Studies conducted
across 4 years of data) and find that the growth dividend for by Flurry, Venturebeat and ComScore in 2015, primarily
the developed category of states is higher. The possibility on US consumers; suggest that apps contribute to about
of Indian states not having reached critical mass values of 80 percent of total time spent on mobile. With over 90
Internet usage could be the reason why developed states percent subscribers accessing the Internet on mobile,
show higher growth impacts.
The magnitude of impact can be translated into in an absolute
amount by multiplying the actual increase in total Internet
and mobile Internet traffic with the elasticity estimate, and
the GDP of the base year. For example, using the growth
elasticity estimate of 0.33 for India, a 17% increase43 in total
India’s Internet traffic
Internet traffic during the period 2015-2016, resulted in an from non-PC devices was
28% of total
absolute increase of USD 103.9 billion44 in GDP. This includes
direct expenditure on the Internet as well as spillovers
into the other sectors of the economy and accounted for
about 5% of Nominal GDP in 2016. The estimate compares Internet traffic in 2015.
favorably with BCG’s estimate of 2012 that projected the
41. Detailed results for co-efficients and significance are provided in Appendix I. The models address the problem of endogeneity using instrumentation and are run under assumptions
of homoskedasticity using robust standard errors. The values for Variance Inflation Factor (VIF) , reported in the appendix, testify the absence of multi-collinearity
42. Detailed results for co-efficients and significance are provided in Appendix II. The models address the problem of endogeneity using instrumentation and are run under assumptions
of homoskedasticity using robust standard errors. The values for Variance Inflation Factor (VIF) , reported in the appendix, testify the absence of multi-collinearity
43. 17% increase in Internet traffic in India is based on linear extrapolation for values between 2011 and 2015 made available by CISCO VNI data
44. This value is given by 0.17 (growth in Internet traffic)*0.33 (growth elasticity) *USD 1,873 billion (Nominal GDP in 2015)
45. According to the same report, for the group of G-20 countries, internet contributed 5.3% of their collective GDP in 2016 “The Internet Economy in the G-20”, 2012, The Boston
Consulting Group. Available at https://www.bcg.com/documents/file100409.pdf
46. Reference to World Bank classification of countries by income. Available at https://datahelpdesk.worldbank.org/knowledgebase/articles/906519
47. Qiang 2009
48. https://www.business.com/articles/mobile-apps-vs-mobile-web-do-you-have-to-choose/
16 / Estimating the Value of New Generation Internet Based Applications in India / July 2017India could fall in the same category. In a comparison In conclusion, our top-line results are:
of mobile and desktop, time spent on mobile Internet
exceeds desktop Internet, by close to double in some
countries49. Though Internet use on mobile has increased 10% increase in global Internet traffic, delivers on average a 1.3%
dramatically in the last few years, according to Cisco increase in global GDP and a 10% increase in global mobile Internet
data, it continues to contribute less than 10% to global traffic, delivers on average a 0.7% increase in global GDP
Internet traffic50. This could also mean that users are 10% increase in India’s total Internet traffic, delivers on average
viewing Internet content on a mobile device but using a a 3.3% increase in India’s GDP, and a 10% increase in India’s mobile
fixed line connection. The proportion of mobile Internet Internet traffic, delivers on average a 1.3% increase in India’s GDP
traffic to total Internet traffic in India is much higher
17% increase in India’s Internet traffic during the period 2015-
than the global average, estimated at 15.8% in 201551. 2016, resulted in an absolute increase of USD 103.9 billion (Rs. 6,926.5
However, traffic cannot be proportionately attributed to billion) in India’s GDP during the year. An equivalent increase in India’s
time spent. For example, video traffic, which contributed mobile internet traffic during the period 2015-16, would result in an
to more than 50% of total Internet traffic, is primarily absolute increase of USD 41.4 billion (Rs. 2759.9 billion) in India’s GDP
during the year
consumed using fixed line Internet, even if viewed on a
mobile device. From a CISCO estimate, India’s Internet Apps contributed a minimum of USD 20.4 billion (Rs. 1357.6
traffic from non-PC devices was 28% of total Internet billion) in the year 2015-16 to India’s GDP
traffic in 201552. According to experts, 70% of mobile or
thE Internet economy could contribute upto USD 537.4 billion
non-PC traffic could be attributable to apps implying that to India’s GDP in 2020, of which a minimum of USD 270.9 billion
apps contributed a minimum of USD 20.4 billion to India’s (Rs.18275.9 billion) could be attributed to apps
economy in the year 2015-1653. Thus the absolute impact
of apps on the Indian economy in 2015-16 is estimated in
the range of USD 20.4 to USD 103.9, the latter an upper
bound in case all internet traffic is assumed to be driven In any case, we can be sure that the Internet economy will
by apps. These estimates do not include non-internet magnify to at least 15% by 2020, with apps contributing at a
based IP traffic generated by apps and to that extent may minimum half of the value.
undervalue the contribution of apps to the economy.
The growth impacts are better understood in conjunction
with the case studies illustrated in the following section.
Forecasts for 2020 These case studies help explain the mechanisms by which
We use our elasticity estimates to project the contribution impact at the micro-level translates into growth at the
of the Internet economy and apps in the future. According macro level. It also helps to understand the sectoral
to CISCO VNI’s forecast for India, Internet traffic in India is configuration of the apps and their associated growth
likely to increase by close to 4.4 times between 2015 and potential in India.
2020. During this time, the distribution of traffic
is also projected to move in favour of non-PC
devices from 28 percent to 72 percent.As a whole
the Internet economy will be worth USD 537.4
billion in 2020 of which USD 270.9 billion is the
estimated lower bound for the app economy54.
The ten-fold increase in the contribution of the
app economy from our 2016 estimate is driven by
not only the increase in total Internet traffic but
also the significant change in access using mobile
devices. The forecast relies on the assumption
that the Internet economy model of today will
continue to be representative of the Internet
economy in 2020. Any disruption in terms of
technological breakthroughs or development
of killer applications could render the model
outdated and the current estimates inaccurate.
49. https://digiday.com/media/mobile-overtaking-desktops-around-world-5-charts/
50. CISCO VNI data 2015
51. Ibid
52. CISCO VNI Complete Forecast Highlights for India
53. Using growth elasticity of 0.33 estimated above, 28% of traffic generated from non-PC devices deliver about USD 29.1 billion; 70% of this value is attributed to apps.
54. Between 2015 and 2020 GDP is forecast to increase by X% while Internet traffic is set to grow by 440 percent implying a cumulative increase of USD 2.7 trillion over the 5 year
period in the internet economy. 72% of total Internet traffic is non-PC devices, of which we continue to assume 70% is through apps even in 2020.
July 2017 / Estimating the Value of New Generation Internet Based Applications in India / 173. Impact Illustration using Case Studies
Internet has transformed the way we interact in the social, not always reflected in data, or translatable into a quantifiable
political and economic environments. With its increased estimate.This creates both a need and an opportunity to look
penetration, especially in the multi-layered emerging market beyond the absolute value created by the app economy. It
economies, it has led to a surge in entrepreneurial activity is necessary to delve deeper into understanding these apps
that generates economic value, besides also empowering civil and the sectors they operate in - their underlying objectives,
society in several ways that impact daily lives.The driving force markets they seek to serve, factors that drive demand for their
behind widespread internet adoption, in emerging markets services, sections of society they impact, and the challenges
like India has been the rise of affordable smartphones and that hinder their growth.
tablets that have allowed for wider adoption of apps. Data
from India show that entrepreneurship is synonymous with While most apps cater to the entire population, we have
technology start-ups and app based solutions and services55. also selected a few that focus only on urban or only on rural
Apps have become a popular medium to reach out to target users, and some others that are limited to a specific locality.
audiences for both businesses and social initiatives. It improves In addition we have identified apps with special category
access, creates efficiencies and generates impacts that are users such as students, women and differently-abled. Apps
simultaneously palpable and intangible. Case studies have are presented based on app-store definitions, although some
served as a powerful tool of analysis in social science research, categories have been aggregated for neater representation
especially when the response to a research question cannot (Figure 3). For example we have clubbed Travel, Health
be fully captured by quantitative methods alone. For this study, and Lifestyle, News and Education and Utility, Finance and
it is essential to acknowledge the vastness and the intrinsic Navigation. The apps are mapped on a continuum of greater
heterogeneity of the app ecosystem that engenders impacts popularity from left to right. A legend identifies user types and
55. The Indian Institute of Technology is the fourth ranked educational institution in the world after Stanford, Harvard and University of California to churn out 13 Unicorn founders.
18 / Estimating the Value of New Generation Internet Based Applications in India / July 2017You can also read