BROADBAND KOREA: INTERNET CASE STUDY - March 2003 - International Telecommunication Union
←
→
Page content transcription
If your browser does not render page correctly, please read the page content below
International Telecommunication Union

         BROADBAND KOREA:
        INTERNET CASE STUDY

              March 2003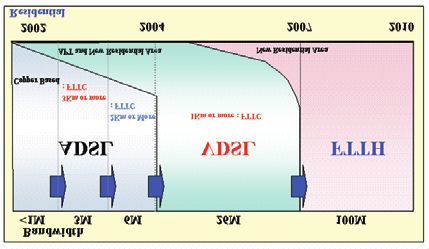
This report was prepared by Tim Kelly, Vanessa Gray and Michael Minges. It is based
on research carried out from 23 to 30 May 2002 as well as articles and reports noted
in the document. The assistance of the Ministry of Information and Communication,
particularly Sang-Hak Lee, was indispensable and highly appreciated. The assistance
of colleagues within ITU is also noted particularly Nathalie Delmas, who formatted the
report and created the cover. Both Jin-Kyu Jeong and Chinyong Chong provided detailed
comments.

The report would not have been possible without the cooperation of the many Korean
organizations who offered their time to the report’s authors. The report is one of a
series examining the Internet in developing nations. Additional information is available
on ITU’s Internet Case Study web page at http://www.itu.int/ITU-D/ict/cs/.

The report may not necessarily reflect the opinions of ITU, its members or the
Government of the Republic of Korea.

The title refers to Korea’s top ranking in broadband Internet penetration.

NOTE: UNLESS STATED OTHERWISE, ALL REFERENCES TO KOREA IN
THE REPORT REFER TO THE REPUBLIC OF KOREA ALSO COMMONLY
KNOWN AS SOUTH KOREA.

                                 © ITU 2003

                                        ii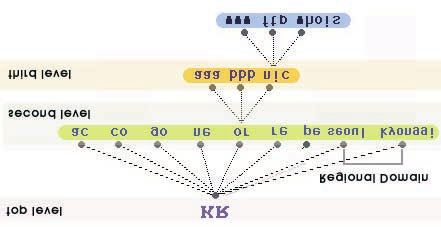
Contents

1. From rags to riches in ICT .................................................... 1
    1.1   The Korea miracle ....................................................................... 1
    1.2   What explains Korea’s success? ..................................................... 2
    1.3   ICT in the Korean economy ........................................................... 3

2. ICT market .......................................................................... 5
    2.1   The end of circuit switching? ......................................................... 5
    2.2   Another broadband path to the home ............................................. 9
    2.3   Broadening Internet .................................................................. 10
    2.4   Mobile Communications .............................................................. 14

3. Sector absorption and ICT applications ............................. 31
    3.1   E-government ........................................................................... 31
    3.2   Education ................................................................................. 39
    3.3   Health ...................................................................................... 45
    3.4   Electronic commerce in Korea ..................................................... 46

4. The Information Society in Korea ...................................... 53
    4.1   The Vision of a Creative, Knowledge-Based Society ........................ 53
    4.2   The Policy Push – creating an information society .......................... 54
    4.3   Information society lifestyles ...................................................... 57

5. Conclusion ......................................................................... 63
    5.1   State of the Internet .................................................................. 63
    5.2   Lies, Damned Lies and Statistics ................................................. 64
    5.3   Learning from Korea .................................................................. 65

Annex 1: List of meetings ........................................................ 71
Annex 2: Acronyms and abbreviations .................................... 72
Annex 3: Framework dimensions ............................................ 75

                                                      iii
Figures
1.1 Korea catches up … ..................................................................... 1
2.1 Network transition ....................................................................... 8
2.2 More and more bandwidth ............................................................ 8
2.3 Top Internet countries ................................................................ 10
2.4 Internet drivers: Content and Broadband ...................................... 11
2.5 Internet exchanges and international bandwidth ............................ 13
2.6 Korea's domain name structure ................................................... 14
2.7 Catching up and overtaking ........................................................ 15
2.8 Mobile evolution in Korea ........................................................... 16
2.9 How are they related? ................................................................ 17
2.10 Growing the mobile data market ................................................. 20
2.11 Mobile data usage patterns ......................................................... 22
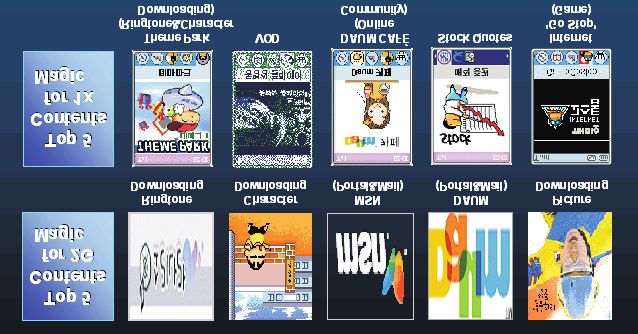
2.12 The top five most popular mobile data services on KTF's 2G
and 1x services ..................................................................... 25
2.13 Ahead of the pack ..................................................................... 27
3.1 Korea's ICT plans ...................................................................... 33
3.2 Korean youth online ................................................................... 39
3.3 A nation of online shoppers ........................................................ 47
3.4 E-commerce usage in Korean companies ...................................... 49
4.1 Korea's IT industry .................................................................... 53
4.2 Korea's broadband users ............................................................ 54
4.3 Information society: lost opportunities and job opportunities .......... 58
4.4 Information Society: hopes and fears ........................................... 59
5.1 State of Internet in the Republic of Korea ..................................... 63
5.2 Recomparing Korea and Switzerland ............................................ 66
Tables
1.1 Socio-demographic indicators ....................................................... 2
1.2 Korea's ICT Sector ....................................................................... 3
2.1 Telephone service competition in Korea .......................................... 5
2.2 Korean mass media indicators ....................................................... 9
2.3 Implementations of mobile data services ...................................... 20
3.1 Korean government ICT budget ................................................... 31
3.2 e-Government initiatives ............................................................ 35
3.3 Ranking e-government ............................................................... 39
3.4 e-education indicators in Korea ................................................... 40
3.5 Summary of Korea's General Plan for Promoting e-Commerce ......... 48
4.1 Korean Government budget for informatization projects ................. 55
5.1 Ranking Korea .......................................................................... 65
5.2 Which factors can be exported? ................................................... 67
ivBoxes
2.1 The Republic of Korea's path to universal service ............................. 6
2.2 One big Intranet? ...................................................................... 11
2.3 Broadband drivers ..................................................................... 12
2.4 1x, 1x EV-DO, IMT-2000: What's the difference? ........................... 19
2.5 Handset wars ............................................................................ 21
3.1 The Korean equilibrium - public and private harmony ..................... 32
3.2 ETRI — Korea's innovation driver ................................................. 37
3.3 From mechanics to web design .................................................... 42
3.4 Dot.school ................................................................................ 44
3.5 Computerizing medical claims ..................................................... 46
3.6 Measuring e-commerce .............................................................. 51
4.1 Critical infrastructure protection .................................................. 56
4.2 The dark side of the information revolution ................................... 60
5.1 And what of the North? .............................................................. 69
v1. From rags to riches in ICT
1. From rags to riches in ICT
1.1 The Korea miracle the world’s fifth largest Internet mar-
ket, with 26 million users. Korea has
The Republic of Korea (Korea) has made the third highest Internet penetration
major strides in Information and in the world and ranks top in Asia
Communication Technology (ICT) over (see Figure 1.1, bottom left).
the last four decades: • Korea leads the world in broadband
• In 1960, Korea had a telephone pen- Internet access penetration. At De-
etration of 0.36 per 100 inhabitants, cember 2002, Korea’s penetration of
barely one tenth of the then world Digital Subscriber Line (DSL) and ca-
average. By 1981, Korea caught up ble modem Internet access was first
with the world average and at the end in the world (see Figure 1.1, bottom
of 2002, its teledensity was 48.8, or right).
almost three times more than the Korea is the leading example of a country
world average (see Figure 1.1, top rising from a low level of ICT access to
left). Today 92 per cent of Korean one of the highest in the world. Is Korea
households have a fixed telephone a miraculous exception or are there
and 79 per cent have a mobile one. lessons to be learned for other
countries? This case study examines the
• In 1995, Korea had less than one factors that have accelerated ICT
Internet user per 100 inhabitants. In development. This chapter looks at the
1999, it surpassed the developed extent to which ICT has permeated
nation average (see Figure 1.1, top Korea in its efforts to transform towards
right) and by the end of 2002 was a knowledge-based society.
Figure 1.1: Korea catches up …
Fixed line telephone subscribers per Internet users per 100 inhabitants
50 100 inhabitants 60 Korea
45
50 Advanced: Western Europe,
40
Korea North America, developed
35 40
30 Asia-Pacific
30 Advanced
25
20
20
15
10 World 10
5
0 0
1960 65 70 75 80 85 90 95 2000 1995 1996 1997 1998 1999 2000 2001 2002
… and starts to take the lead
Top 5 Asian economies by Internet Top 5 economies by broadband
penetration, 2002* penetration, 2002
Korea (Rep.) 55
Korea (Rep.) 21.3
Singapore 52 Hongkong, China 14.6
Japan 45 Canada 11.5
Hongkong, China 43 Iceland 8.6
Taiwan, China 37 Denmark 8.6
Note: *PC-based users.
Source: ITU World Telecommunication Indicators database.
1Korea Internet Case Study
1.2 What explains Korea’s language. Koreans have their own
success? language. Therefore, the country
cannot easily leverage the vast
Korea is not demographically suited amount of content developed in more
to have the highest Internet widely spoken languages. The Korean
penetration in Asia. It is the largest alphabet, known as Han-gul, uses a
of the so-called Four Tigers (the others pictographic font that is not ideally
being Hong Kong, China; Singapore suited to computerization.
and Taiwan, China) both in terms of
land area and population. The Republic On the other hand, Han-gul is phonetic
of Korea’s population stood at with one character representing a
47.7 million in 2001, twice as large sound, making it easy to learn: “Han-
as Taiwan, China, seven times bigger gul is a simple, scientific language.
than Hong Kong, China and more than Learning how to read it is easy, which
11 times larger than Singapore. is probably one of the reasons why
Korea has one of the highest literacy
Korea is also not economically suited rates in the world.”1 This is where the
to have the highest Internet tide starts turning in Korea’s favour.
penetration in Asia. All the other Its literacy rate of 97.6 is the highest
Tigers have a higher per capita income among the Asian Tigers.
than Korea’s US$ 9’400 in 2001 as do
50 other economies. The World Bank Korea also excels in education. Its
classifies Korea as an upper-middle- overall school enrolment rate
income country, one category down (primary, secondary and tertiary) of
from the high-income classification. 90 per cent is the highest among the
Therefore, though Korea is not poor, Asian Tigers. Primary school is
it is not among the world’s wealthiest compulsory (and free) and soon
nations. Hence, Korea’s high level of secondary will be. Korea’s tertiary
Internet penetration is not strongly school enrolment is quite high at
correlated to its income level. 68 per cent. Korea has the highest
level of secondary school graduates
Another factor seemingly weighing among all high-income Asia-Pacific
against Korea’s ICT development is economies.
Table 1.1: Socio-demographic indicators
Selected socio-economic indicators for Asia-Pacific economies
Gross Tertiary
National Population students
Income Land per 100
per capita, area Total Density School inhab- Second
US$, (km2, (000s) Per % enrol- itants -ary+
2001 000s) 2001 km2 Urban Literacy -ment d) c)
Korea (Rep.) 9’400 99 47’676 482 82 97.6 90 5.0 71.8
New Zealand 12’380 268 3’912 15 87 99.0 99 4.6 72.4
Taiwan, China a) 14’188 36 22’406 619 84 95.6 83 3.3 58.2
Australia 19’770 7’682 19’604 3 85 99.0 116 5.4 67.3
Singapore 24’740 0.682 4’131 b) 6'055 100 92.5 75 2.5 55.0
Hong Kong, China 25’920 1.099 6’760 6'151 100 93.3 63 1.6 52.1
Japan 35’990 365 127'370 340 79 99.0 82 3.1 66.2
Note: a) Data for Taiwan, China from Bureau of Statistics. b) Mid-year. c) Per cent of adult population with
at least a secondary education. d) 1995 or latest year available.
Source: National statistics (Population, Secondary+), World Bank (GNI, land area, urban population), UNDP
(literacy, school enrolment), UNESCO (Tertiary students).
21. From rags to riches in ICT
Korea’s high rate of literacy and school the ICT industry in the Korean
enrolment are essential prerequisites economy was 13 per cent in 2000, up
for the widespread adoption of ICTs. from 8.6 per cent in 1997 and the
These factors have helped contribute highest among the Organization of
to the growing impact of ICT in Korean Economic Cooperation and
economy and society. Development (OECD) countries.2
1.3 ICT in the Korean ICT is also adding value to the
economy economy at a rate higher than other
sectors. ICT contributed 50 per cent
Korea’s economic growth is often of the growth in overall GDP in 2000.
described as a miracle. Starting with Apart from the direct benefits to
a per capita income of less than people and companies, ICT has the
US$ 100 in 1960, Korea averaged an indirect benefit of contributing to
annual economic growth rate of eight overall economic wealth and
per cent a year for the next four employment. The ICT sector in Korea
decades. By 2000, per capita income employed 1.3 million people at the end
was US$ 8’910 and Korea’s economy of 2000 and is forecast to grow around
ranked 13th in the world. The focus of fi v e p e r c e n t t h r o u g h 2 0 0 5 ,
growth has been manufacturing and compared to only two per cent for
exports. As Korea’s economy has overall employment.
matured, its manufacturing base has
shifted from textiles, to chemicals, Manufacturing has underpinned
then machinery and later electronics. Ko r e a ’s e c o n o m i c g r o w t h . T h e
Today knowledge and information manufacturing sector has
products and services play an traditionally been dominated by large
important and increasing role in the chaebols that today are known
Korean economy. around the world (e.g., Samsung,
LG, Hyundai, etc.). 3 They produce
Korea divides its ICT sector into three everything from television sets to
segments: Telecommunication semiconductors to mobile phones.
Services, Information Communication W i t h i n t h e Ko r e a n I C T s e c t o r,
Equipment and Software. The ICT equipment forms the biggest market
market accounted for US$ 103 billion segment, accounting for 74 per cent.
in 2001 (see Table 1.2). The share of Exports make up 41 per cent of ICT
Table 1.2: Korea's ICT Sector
Production value of Korea's Information and Communication industry, US$ billion
1997 1998 1999 2000 2001
Information communication services 13 14 16 22 26
Information communication equipment 35 37 54 67 68
Communication equipment 10 9 12 14 13
Information equipment 5 5 8 12 10
Broadcasting equipment 0 1 0 1 1
Electronic components 19 23 33 40 43
Software 3 4 5 9 10
Total 51 54 75 97 103
Rate of increase 37% 6% 40% 29% 7%
Note: Converted to US$ at rate of 31 December 2001.
Source: KISDI.
3Korea Internet Case Study
equipment production. Furthermore, Unlike other nations such as India
ICT products account for a third of that are heavily promoting their
Korea’s total exports. The large offshore software industry, Korea is
equipment industry and its export more focused on hardware. Korea
orientation have a strategic impact on only accounted for 1.3 per cent of
Korea’s ICT sector. It helps explain the global software market in 2000
why Korea has been quick to exploit and runs a large trade deficit in that
new ICT technologies. First, they c a t e g o r y. O n e d i s a d va n t a g e i s
create new domestic markets driving language. Unlike India, which has a
demand for telecommunication strategic advantage by using English
equipment to be produced by local in higher education, Korean is not a
manufacturers. Second, they can give global language. Nonetheless,
Korea a strategic edge in high Ko r e a ’s s o f t w a r e i n d u s t r y a n d
technology exports. Instead of being exports have been growing. Indeed
reliant on other nations, if Korea can software showed the highest rate of
be among the first to develop and use growth among ICT market segments
a new technology, its manufacturers in 2000. Furthermore, there are
will gain experience that can then be certain niche markets, such as online
translated to higher exports. Korean games, where Korea is taking a lead.
companies are already benefiting from The Korean company, NCSoft, is
supplying the domestic broadband already the largest independent
market by winning export orders.4 online gaming company in the world.
Its popular Lineage game has some
One area where Korea does not have two million users in Korea and is sold
an apparent advantage is software. in four other countries.
1
Korean Educational Development Institute. Let’s Learn about Korea. Seoul, 2002.
2
The OECD rankings are based on older data but it is unlikely that Korea’s position would have changed much.
See OECD. Measuring the ICT Sector. http://www.oecd.org/pdf/M00002000/M00002651.pdf.
3
Samsung had the world’s fastest growing brand image in 2001. See “The Best Global Brands.”
BusinessWeek. 5 August 2002. www.businessweek.com/magazine/content/02_31/b3794032.htm.
4
Samsung is the fourth largest ADSL manufacturer in the world. See Samsung. “Samsung is one of the world-
leading ADSL vendors.” Press Release. 9 February 2001.
42. ICT market
2. ICT market
2.1 The end of circuit government fully divested itself of the
switching? company.
Korea’s telecommunication history Korea progressively liberalized its
began in August 1885 when a telecommunication sector during the
telegraph line was installed between 1990s. The first market segment to
Seoul and Inchon. The first be opened was international long
telephones were installed in 1902 distance with the entry of Dacom in
and the first automatic exchange December 1991. Onse Telecom
introduced in 1935. Korea joined the entered the market in October 1997.
International Telecommunication National long distance services were
Union in 1952. By the end of the opened to competition in January
1980s, Korea had achieved a high 1996 when Dacom extended its
level of universal service (see services to this sector of the market
Box 2.1). It signed the World Trade (followed by Onse in December 1999).
Organization (WTO) agreement on Finally, local telephone services were
basic telecommunication services that opened in April 1999 with the entry
became effective in November 1997, of Hanaro. This was notable as it
committing the country to would prove to have a major impact
liberalization of its telecommunication on Korea’s broadband development.
sector. Though KT is still dominant, its market
share has dropped, particularly in
The nation’s historical operator is international long distance (see
Korea Telecom Corporation (KT). It Table 2.1).
began as the government-owned
Korea Telecom Authority in January The Ministry of Information and
1982. Its statute was changed in 1989 Communications (MIC) is
allowing it to be privatized and in responsible for telecommunication
November 1993 the government and broadcasting policy and
began selling its shares in the regulation. This mandate also extends
company. Ten additional share sales to certain areas of information
ensued over the next decade with the technology. The MIC is active in
final one in May 2002 when the promoting and developing the
Table 2.1: Telephone service competition in Korea
Year Korea Telecom
competition market share
Service was introduced 2001
Local (1) 1999 96.9%
Domestic long distance (2) 1996 85.5%
International long distance (2) 1991 67.1%
Note: (1) in terms of subscribers. (2) in terms of revenue.
Source: KT.
5Korea Internet Case Study
Box 2.1: The Republic of Korea's path to universal service
There are around a dozen developing economies technology because of the investment already made
that have graduated to the ranks of the universally in analogue telephone switches in cities. The
served: 90 per cent or greater of households with government also pushed the development of a
a telephone. How did they succeed in achieving locally produced telephone exchange—the TDX—
universal service? The composition of the group to reduce dependency on foreign imports and
tends to reinforce the importance of wealth as well alleviate capacity limitations.
as highlight the advantage that small countries
have. All are high-income economies with GNP per Tariffs were modified to enhance accessibility. The
capita in the range of US$ 11’450 to US$ 23’790. number of local call areas was reduced from about
Hong Kong, China, for example, has a higher 1’600 to about 150 and a national flat-rate usage
GNP per capita than the United Kingdom. Several tariff became a policy goal. Installation charges were
are oil-rich states (Brunei, Kuwait, Qatar, United standardized and used to reduce the gap within
Arab Emirates) and most are relatively small the country by raising urban installation charges
(Bahrain; Cyprus; Hong Kong, China; Macao, China; and lowering rural ones.
Malta, and Singapore).
Money for telecommunication investment was raised
Of these developing countries, the Republic of Korea from several sources. Various laws were established
stands out. It has the largest land area of any to raise funds from bonds. Tariffs were structured
country in the group and has developed its economy to maximize investment funding. Telecommu-
without the benefit of natural resources such as nications was given priority in the Fifth Five-Year
oil. Until the 1960s, telephone services were mainly Socio-Economic Development Program (1982–86),
used for political and military purposes. The rising from less than three per cent of total national
country’s rapid economic growth and consequent investment in the 1970s up to seven per cent in
rise in living standards led to a surge in demand the 1980s.
for telephone service in the 1970s. Waiting lists
grew and the backlog emerged as a social problem. Because of these policies, the country achieved
rapid telecommunication growth through the 1980s.
As a result, upgrading the telecommunication Household telephone penetration increased from
network became a priority and a one-phone, one- 21 per cent in 1980 to 90 per cent by 1990.
family policy was pursued. Korea Telecom was Domestic and international pressure to open the
separated from the Ministry of Communications in telecommunication market began to grow in the
1982 to give it more flexibility to eradicate the 1990s. As in many developed countries, a high level
waiting list. Investment was directed to rural areas of universal service has allowed the Republic of
to minimize disparities with urban regions. Rural Korea to progressively liberalize its
areas were also targeted for the latest digital telecommunication market.
Box Figure 2.1: The way to universal service in the Republic of Korea
Waiting list, percentage of households with telephone and telecom investment,
US$ billion, Republic of Korea
Strong growth… …funded by network investment
Waiting list (000s) (left scale) Telecom investment (US$ b) (left scale)
Households with telephone (%, right scale) As % of GFCF (right scale)
$3.5 8%
500 100
$3.0 7%
400 80 $2.5 6%
5%
300 60 $2.0
4%
$1.5
200 40 3%
$1.0 2%
100 Waiting list 20 $0.5 1%
eliminated
0 0 $- 0%
1982 83 84 85 86 87 88 89 90 91 92 198283 84 85 86 87 88 89 90 91 92
Note: In the right chart, GFCF refers to Gross Fixed Capital Formation.
Source: ITU World Telecommunication Indicators Database.
62. ICT market
communication industry in Korea. One move aggressively into fiber-to-the-
tool it has had at its disposal is home by 2005 (i.e., replace copper
requiring telecommunication lines with fiber) (see Figure 2.2). It
operators to contribute to government forecasts some 5.6 million broadband
programmes for industry subscribers of its own by 2003 (out of
development. Unlike other countries, a nationwide total of 11.9 million).
this money is reinvested in the
telecommunication sector instead of Faced with intense competition from
being transferred to other areas of the new broadband providers, KT
government. abandoned Integrated Services Digital
Networks (ISDN) as its strategy for
Korea’s telecommunication market is data communications over circuit
arguably as open as any in the Asia- switched telephone networks. This
Pa c i f i c r e g i o n . M a r ke t e n t r y i s was a significant move since in other
contingent upon government countries, operators have been
approval and essentially depends on unwilling to rapidly introduce high-
the nature of the service provider. speed Asymmetric Digital Subscriber
Three different classifications exist: Line (ADSL) technologies or price it
(1) Network Service Provider (NSP) competitively for fear of cannibalizing
who build their own facilities and their lucrative ISDN and leased line
which requires a license; (2) Specific offerings. The attraction of ADSL for
Service Provider (SSP), such as KT was that it could leverage its
resellers, who use the facilities of already installed copper lines.
others and which requires Furthermore the economics were
registration; and (3) Value-added compelling. Average Revenue Per User
Service Providers (VSP), such as (ARPU) is seven times higher with
Internet Service Provider (ISP), ADSL than for local and long distance
which requires a simple notification. voice telephone calls. The pay back
period for the ADSL investment is also
Though Korea’s telecom market is fairly quick at a little over a year. At
probably as liberal as any in the Asia- the end of 2001, revenues from
Pacific region, most companies would broadband connection services
have little incentive for entering accounted for eight per cent of total
infrastructure-based segments. First, telecommunication revenues, a higher
the market is already well served with share than long distance.
high penetration levels. Second, Furthermore, local circuit-switched
revenues and profits are declining for telephone services have seen their
traditional circuit-switched voice share of telecommunication revenue
services (see Figure 2.1, left chart). decline from one quarter in 1997 to
Except for KT and one of the mobile 11 per cent by 2001. By 2005,
operators, none of Korea’s facilities- broadband access revenues are
based telecommunication providers forecast to surpass those of local
made a profit in 2001. Third, Korea is telephone service.
inadvertently transitioning to a next-
generation network whose eventual ADSL traffic is separated from circuit-
structure is uncertain. switched traffic and routed over
Internet Protocol (IP) networks. At the
The rapid take-up of broadband has same time, Voice over Internet
radically altered conventional network Protocol (VoIP) is increasingly being
thinking and evolution. By June 2002, used in Korea and bundled into
there were some 10 million broadband offerings by operators. The
subscribers with a broadband Korean VoIP market is expected to
connection. There is now a need to grow around 50 per cent between
offer subscribers increasingly higher 2000 and 2005 while conventional
bandwidth by locating fiber optic cable circuit-switch telephone conversations
closer to the end user. KT plans to offer will show no growth. Thus an
Very high bit rate Digital Subscriber increasing portion of Korea’s
Line (VDSL) services (at up to 26 communication traffic is traversing IP
Mbps) over the next few years and networks and not the circuit- switched
7Korea Internet Case Study
Figure 2.1: Network transition
Distribution of telecommunication market revenue by segment and percentage of telephone lines
connected to digital exchanges and percentage of households with broadband access
Share of revenue Mobile 100%
100% Other 90%
Broadband Internet 80%
80% Leased Circuit
International 70%
60% Long-distance 60% % telephone lines
Local 50% connected to
40% 40% digital
30% exchanges
20% 20% % broadband households
10%
0% 0%
'97 '98 '99 '00 '01 '02 '03 '04 '05 1998 1999 2000 2001 2002 2003 2004 2005
Source: KISDI, ETRI.
network. It is only a matter of time telephone network. Ironically, though
before the packet-switched network Korea has one of the lowest levels of
will replace the conventional local telephone line digitization—only
telephone network. 87.5 per cent in December 2001, one
of the lowest in the world1 —it is at
Broadband Internet access and the same time moving towards a next
growth of IP-related services is having generation communication network.
a great impact on the technical Indeed by the time it would have
evolution of the Korean fixed probably connected all its local
Figure 2.2: More and more bandwidth
Evolution of KT's access network
Source: KT.
82. ICT market
telephone lines to digital exchanges, despite the limited number of
they may not be around any more. terrestrial-based channels and the
lack of satellite television. Only 20 per
2.2 Another broadband path cent of homes subscribed at the end
to the home of 2001. One reason is that relatively
inexpensive alternatives such as
Cable television has been available in videotapes and Digital Video Discs are
Korea since the 1960s. However, these widely available.
so called cable-relay networks simply
provided retransmission of terrestrial The development of cable television
stations in order to improve reception. infrastructure has provided Korea with
True cable television, that is the another method for high speed Internet
provision of additional programming not access. Some 8.3 million Korean
available on terrestrial-based stations, homes—57 per cent of the total—are
started relatively late, in March 1995. passed by cable television.2 Internet
access via cable television was launched
Korea’s cable industry has a by Thrunet in July 1998. At
fragmented structure with exclusive December 2002, there was 3.7 million
licenses awarded on a regional basis. subscribers to broadband cable modem
77 regional system operators provide services. The market leader is Thrunet;
service and deal with customers. The in addition, there are five other cable
electricity company—KEPCO—and KT modem providers. Unlike most other
were charged with building fibre countries, cable ISPs are not system
backbones, which the system operators. They either build out a Hybrid
operators in turn lease to connect their Fibre Coaxial (HFC) cable network or
networks to the source of lease it from system operators. Thrunet
programming. Pay cable television has for example collaborates with 74 of
not proven highly popular in Korea 77 system operators to provide its cable
Table 2.2: Korean mass media indicators
Indicator Value Year Note
Newspaper circulation 40.6% 1996 Population aged 15+ who read
newspaper every day. Source:
National Statistical Office.
Radio sets 47.5 million 1997 Source: UNESCO.
-Per 100 inhabitants 103.9
% of households with a television 94.3% 2000 Colour TV less than 30 inches.
Source: National Statistical
Office.
Households passed by cable television 8.3 million 2001 Source: Thrunet.
-As % of total households 57%
Subscribers to “relay” cable television 7.0 million 2001 Source: Korean Broadcasting
-As % of total households 43% Comission.
Subscribers to “pay” cable television 3.3 million 2001 Source: MIC.
-As % of total households 20%
Cable modem subscribers 3.7 million 2002 Source: MIC.
Source: ITU adapted from sources shown under “Note.”
9Korea Internet Case Study
modem service. It reimburses them a compared to just 0.7 million Internet
portion of the fees it receives from cable users. This anomaly is explained by
modem service. Pricing is competitive with demand for Korean content. Internet
ADSL service. Thrunet charges a monthly content in Korean was lacking so users
fee of Won 38’000 (US$ 28.93), which utilized the services of proprietary
includes unlimited access, an e-mail online services that provided a
account, 50 Mbps of storage and speeds plethora of services in a language they
of up to 10 Mbps. understood. Koreans were wary of
venturing into the Internet world,
2.3 Broadening Internet where most content was in English and
there was a lack of structure to finding
2.3.1 Market information. As the volume of Korean
With 26.3 million users at the end of Internet content expanded—reflected
2002, Korea represents the world’s by a six-fold rise in Korean Internet
fifth largest Internet market hosts between 1996 and 2001—users
(Figure 2.3, left). Its Internet moved over to the Internet
penetration rate, 55.2 per cent at end (Figure 2.4, left). Most online
of 2002, makes it the third highest in providers have now converted to web-
the world (Figure 2.3, right). These based services.
are astounding statistics considering
that five years previously, it had less A second factor driving Internet use
than a million Internet users for a was the growth in broadband access.
penetration rate of 1.6 per cent. When broadband launched, it came
Furthermore, the growth came at a with Internet access. Since the
time of a severe economic downturn. launch of broadband Internet access
What explains this dramatic in July 1998, the number of
turnaround? subscribers has risen to ten million
by the end of 2002. Most services
First, the statistics are a bit that needed broadband access such
misleading. While Korea’s Internet as audio and video streaming,
user population has grown gaming and e-commerce were only
dramatically, it has had a high level of available on the Internet so this
subscribers to non-Internet online created many new Internet users.
services for sometime. For example Today 78 per cent of Internet users
in 1996, it had 1.7 million subscribers log in via a broadband connection
to so-called PC-based services (Figure 2.4, right).
Figure 2.3: Top Internet countries
Top five countries by number of Internet users, 2002 and top five countries by
Internet users per 100 persons, 2002
Top 5 countries by number of Internet Top 5 countries by Internet penetration,
users, 2002, million 2002
USA 155 Iceland 61%
Japan 57 Sweden 57%
China 48 Korea 55%
Germany 35 USA 54%
Korea 26 Netherlands 53%
Source: ITU World Telecommunication Indicators database.
102. ICT market
Figure 2.4: Internet drivers: Content and Broadband
Number of .KR hosts and type of access
Number of .KR hosts Type of Internet Connection, 2002
694
Thousands
548 CATV Dial-up Other
461 10% 2% 2%
Leased
line
18%
203
131
73 xDSL
68%
1996 1997 1998 1999 2000 2001
Source: KRNIC.
Box 2.2: One big Intranet?
Korea is an exception to the argument that limited budding dot-com went public with an offering on
English fluency or non-Latin character alphabets the Korean venture capital stock exchange
are barriers to Internet access. The development (KOSDAQ). The number of its users grew from
of Korean content has been astounding and today 5.7 million at the end of 1999 to 19.6 million at
the nation has one of the highest usage ratios of the end of 2002. Some 90 per cent of all Korean
home grown content. The top 10 web sites accessed Internet users log onto Daum, ranking it first.
by Korean users are all in Korean. The number of Around 450 million pages of Daum’s content is
domains registered using .KR—almost exclusively viewed on an average day. Daum ranks tops in
in the Korean language—ranks the nation fifth in pages per user and session time in the world. Daum
the world.6 Not only has this driven use, but it has is really not much different than other portals except
also reduced the need for expensive international that its business model works. It offers familiar
circuits. It also suggests that in many ways the portal content: e-mail, instant messaging, news,
Internet in Korea is actually one big Intranet with information, shopping, music, videos, etc and
most users preferring to access local sites. makes money from advertising, e-commerce
transactions and members-only portions of its site.
Korea’s top web site is Daum, a start-up company But what allows it to earn money is that it is Korean.
founded in 1995. In 1997, it began operating a Few Koreans surf abroad because of the lack of
web-based email service filling a void created by Korean content and lack of ease with English. So
the slowness of Korea’s proprietary online services Daum has just been better than other Korean
to provide Internet-based content. In 1999, this portals in attracting customers.
2.3.2 Connectivity in this category. The country is criss-
Korea’s local, national and crossed by several nationwide, gigabit
international Internet connectivity is fibre-optic backbones operated by
both qualitatively and quantitatively telecommunication operators,
substantial. Its Internet network today Internet providers and the electric
is very different from its initial company. International connectivity
connectivity to the global network by has been growing rapidly over the last
way of a 56 kbps link to the United several years.
States in 1991. Today, the majority
of Korean users access the Internet Until the mid-1990s, there was no
via broadband and it leads the world national Internet exchange in Korea
11Korea Internet Case Study
Box 2.3: Broadband drivers
43 per cent of the Republic of Korea’s households loop unbundling was not implemented. Hanaro also
had a broadband Internet connection at March faced barriers that discouraged KT customers from
2002, the highest ratio in the world. Korea’s high switching network providers. This included no
broadband penetration can be attributed to the number portability and users having to pay a higher
following factors: connection and subscription charge if they switched
to Hanaro and later reconnected to Korea Telecom.
Geography. 80 per cent of Korea’s population lives One way for Hanaro to break into the market was
in urban areas. Though this figure is not as high as to offer a broadband Internet access service. This
island economies such as Hong Kong, China or exploited KT’s unwillingness to enter the ADSL
Singapore, Korea’s urban geography is dense, market due to its large investment in ISDN. Faced
simplifying broadband access.3 Apartments account with a declining market share, KT entered the ADSL
for 48 per cent of Korea’s housing stock and provide market in June 1999. At October 2001, there were
dwelling for 40 per cent of its population. Another seven companies providing broadband Internet
factor is the proximity of telephone exchanges. The access service. Competition among broadband
average distance of a customer from a telephone technologies has also grown the market through
exchange is 2.2 kilometres, with 95 per cent of greater choice and lower pricing. ADSL is readily
customers within four kilometres, the target range available to the 90 per cent of Korean households
of ADSL. with a fixed telephone line. Some 57 per cent of
Korean homes are passed by cable television,
Competition. Consumer broadband access in Korea providing them with another broadband option
began in July 1998 with the launch of cable modem through cable modem. In addition, there are other
service by Thrunet. The introduction of local loop broadband options such as Local Area Networks
competition with the entry of Hanaro Telecom in (LAN), broadband Wireless Local Loop (WLL) and
April 1999 further fuelled the broadband market. satellite-delivered solutions. As a result of both
With most Koreans already subscribing to market and technological competition, prices are
incumbent Korea Telecom, the market was saturated among the lowest in the world (see right chart
for traditional telephone service. In addition, local below).
SingTel
111
Korea 43% (Singapore)
Telstra
(Australia)
53
Hong Kong,
36% BellSouth
China 50
(USA)
Taiwan, BT (UK) 41
31%
China Monthly ADSL
PCCW (HK,
38 subscription
Ch.)
Singapore 20% Percentage of charge, 2002,
Telecom (N.
households with Zeal.)
34 US$
Japan 16% broadband, 2002 Hanaro (Korea
Rep.)
30
Government support. The government has A growing number of subscribers created economies
facilitated broadband development through an early of scale, which also reduced equipment prices. KT’s
commitment to high-speed infrastructure with specific ADSL equipment purchase cost per line dropped
programs. This has included a positive and supportive from US$ 574 in 1999 to US$ 132 in 2001.5
relationship with the private sector, low interest loans
and a certification program for apartment complexes Mentality. Though more difficult to measure, it is
with high-speed access (for more detail on the widely agreed that Korean “mentality” is also a key
government’s support see Box 3.1). factor. Many Korean Internet users first got a taste
of high-speed access at Internet cafés (so-called
Equipment. Korea’s manufacturing industry has “PC bangs”) and subsequently wanted the same
been an advantage with local suppliers eager to rapidity at home. There is also a “copy-cat”
get into the ADSL market. 4 This has minimized syndrome; once one person gets something
shortages and helped keep equipment prices low. everyone else wants it, too.
122. ICT market
Figure 2.5: Internet exchanges and international bandwidth
Korea's national Internet exchanges and international Internet bandwidth (Mbps)
6’743
Korea's international Internet
bandwidth (Mbps)
2’623
661
3 3 20 116 202
May- 1995 1996 Mar- 1998 1999 2000 2001
95 98
Note: In the right chart, data is for three facilities-based operators.
Source: ITU adapted from KRNIC, NCA.
a n d d o m e s t i c t ra f f i c b e t w e e n Ko r e a h a s a m o n g t h e l o w e s t
different ISPs was routed abroad. broadband Internet prices in the
The National Computerization world. Broadband pricing is flat rate
Agency led the drive to establish a and compared to other countries, the
public exchange, the Korean Internet bandwidth on offer is above average.
Exchange (KIX) in 1995.6 However, Broadband pricing is uniform across
traffic soon exceeded capacity. This providers in Korea. Most packages
led to the Korean Internet Neutral are around US$ 30 per month. The
Exchange (KINX) in June 1999. In variations depend on the amount of
addition, Korea Telecom and Dacom bandwidth. One plan offered by
have established exchanges, KTIX Thrunet proposes users a lower price
a n d D I X r e s p e c t i v e l y. A l l f o u r (US$ 26 per month) in exchange for
exchanges are inter-connected (see receiving e-mail advertisements.
Figure 2.5, left) and most ISPs
connect with each other through the Dial-up Internet prices are not so
exchanges rather than private r e l e va n t c o n s i d e r i n g t h a t m o s t
peering arrangements. subscribers now use broadband. One
important motive for switching to
Korea’s international Internet flat-rate broadband is to avoid the
connectivity has expanded local telephone charge imminent
tremendously and stood at 5.2 Gbps with dial-up subscriptions. A dial-up
at December 2001 (Figure 2.5, right). Internet subscriber must pay local
It has benefited from its proximity to t e l e p h o n e c h a r g e s o f 3 9 Wo n
the sea and hence fibre-optic (3 US cents) per unit (three minutes
submarine cables (it is connected to during peak times and 4.3 minutes
around ten different systems). in off-peak periods). By contrast, an
entry plan ADSL subscription costs
2.3.3 Pricing 30’000 Won (US$ 22.84). After
30 hours of monthly use, it is
The most relevant data to use for cheaper to switch from dial-up to
comparing Korea’s Internet pricing broadband access in Korea. With the
are rates for broadband access (e.g., a v e r a g e Ko r e a n I n t e r n e t u s e r
DSL and cable modem) since the logging on for some 40 hours a
majority of Koreans connect to the month, it is no surprise that so many
Internet in this way. In that regard, have switched to broadband access.7
13Korea Internet Case Study
Leased lines also are being impacted the Internet in Korea.
by consumer broadband technologies.
Former users of ISDN or other low 2.3.5 Regulation
bandwidth leased line services are Korean government involvement in
switching to ADSL and cable modem. the Internet is oriented towards
Only users with very high bandwidth consumer protection and reducing the
requirements (above eight Mbps) are Digital Divide. Entry into the ISP
continuing to lease lines in the market is straightforward. As value-
conventional sense. added service providers, ISPs must
simply notify the government that
2.3.4 Domain they want to go into business. An ISP
The Korea Network Information must lease facilities from licensed
Center (KRNIC) is responsible for infrastructure providers or obtain their
administering Korea’s .KR domain own facilities-based license.
name. Korea uses second level
domain names based on five common 2.4 Mobile Communications
identifiers depending on the type of
organization. In addition, users can 2.4.1 Mobile market players
select the PE or personnel second level Although Korea’s success in
domain name. There are also broadband networks and services has
16 regional domains used by different stolen the headlines, mobile
regions in Korea (see Figure 2.6). communications development has
Charges are KRW 11’000 (US$ 8.36) proved almost as successful. Korea
per year for personal users and 22’000 was relatively slow to introduce digital
for organizations. A person or services, and when it did so it opted
organization must have an address in for the CDMA standard rather than the
Korea to register a domain name. more widely used GSM. 8
Furthermore, businesses require a Nevertheless, Korea now has one of
certification. the highest levels of mobile
penetration in the world. Korea was
KRNIC’s domain name registration is one of the first countries in the Asia-
just one small part of its activities. It Pacific region where mobile phone
is also involved in research and users overtook fixed-line subscribers,
development, industry promotion as an event that happened in
well as compiling information about October 1999. Subsequently, mobile
Figure 2.6: Korea's domain name structure
Source: KRNIC.
142. ICT market
penetration has continued to grow. tober 2000 (although commer-
Korea overtook Australia, Japan and cial services only arrived a few
New Zealand in terms of mobile months later). During this period,
penetration during the late 1990s and penetration grew rapidly to cross
is today ranked fourth in the region the symbolic 50 lines per 100 in-
(Figure 2.7, left chart). As of the end habitants. Few countries have
of 2002, there were some 32.3 million transformed their mobile com-
mobile subscribers compared with just munication sectors so rapidly.
23.3 million fixed-line users.9 This period saw the introduction
of four new operators all using
The evolution of mobile in Korea has CDMA: Shinsegi Telecom
gone through three distinct phases (800 MHz) and three Personal
(see Figure 2.8): Communication Services (PCS)
operators at 1.8 GHz: Korea
• 1984-1994: between the launch Telecom Freetel (now KTF); LG
of Korea Mobile Telecommunica- Telecom and Hansol (later
tion Service’s (KMTS) analogue M.Com).
cellular service in 1984, as a sub-
sidiary of Korea Telecom, and the • 2001 to date: corresponds with
sale of the company to SK Group somewhat slower growth in the
in 1994. 10 During this period number of mobile voice subscrib-
KMTS, which now trades as SK ers, as the market approaches
Telecom, enjoyed a monopoly in saturation. Instead the focus has
the provision of cellular services. shifted to the development of
By 1995, cellular penetration mobile data applications.
rates had reached only two sub- CDMA2000 1x mobile data serv-
scribers for every 100 inhabit- ices were launched in Octo-
ants, one of the lowest levels ber 2000, CDMA2000 1x EV-DO
among the advanced Asia-Pacific in May 2002 and services in the
economies. IMT-2000 2.1 GHz band (for an
explanation of the different
• 1995-2000: between the launch terms, see Box 2.4) were li-
of CDMA digital voice services censed in December 2000 for
(IS-95A) in January 1996 and the launch in 2003. This period also
launch of CDMA2000 1x, in Oc- has seen a consolidation in the
Figure 2.7: Catching up and overtaking
Cellular mobile penetration in Korea, compared with other Asia-Pacific economies, 2002 and with
Australia, Japan and New Zealand, 1995-2002
Japan 62.1 Cellular 70 Cellular subscribers per
subscribers 100 inhabitants
60
New Zealand 62.2 per 100 1995-2002
Korea
inhabitants 50
Macao, China 63.1
year-end 2002
40
Australia 66.6 Japan Australia
30
Korea (Rep. of) 67.9
20 New Zealand
Singapore 77.9
10
Hongkong, China 91.8
0
Taiwan, China 106.4 1995 1996 1997 1998 1999 2000 2001 2002
Source: ITU World Telecommunication Indicators Database.
15Korea Internet Case Study
Figure 2.8: Mobile evolution in Korea
Cellular subscribers per 100 inhabitants, compared with fixed-line teledensity and
tracked against major landmarks in the development of the sector
Penetration rate of fixed and mobile, Mobile evolution in Korea (cellular density)
per 100 inhabitants 70
70 Jan 2002: SK Telecom
60 merges with Shinsegi
60
50 Jan 1996:
50 Fixed telephone lines May 2001:
40 commercial
40 KTF created
CDMA service
30 thru merger
30 Mobile start
overtakes 20
20 1994: KMTC Dec 2000: IMT-
Mobile cellular fixed in Oct.
10 sold to SK 2000 licences
10 subscribers 98 Group awarded
0 0
1990 1992 1994 1996 1998 2000 2002 1990 1992 1994 1996 1998 2000 2002
Source: ITU World Telecommunication Indicators Database and case study research.
number of operators, with SK services (in 1984, as Korean Mobile
Telecom acquiring Shinsegi and Telecommunication Services) and
KT Freetel acquiring Hansol to also the first to offer digital CDMA
become KTF. services (in 1996, after its
acquisition by the SK Group).
Although the IMT-2000 licenses in the
2.1 GHz band introduces some new SK Telecom is considered by the
investors, it effectively locks in this Ministry of Information and
three-company market structure. Communication (MIC) to be the
There are linkages between the three dominant mobile operator, and for
different operators both at a horizontal this reason its prices are regulated.
level and through vertical integration In January 2002, it completed the
with the activities of different chaebol takeover of Shinsegi Telecom, its
and equipment manufacturers. The leading competitor in the CDMA 800
recent acquisition by SK Telecom of MHz field. In order to satisfy MIC
an 11 per cent stake (the biggest requirements for allowing the
single shareholding) in KT further acquisition, SK Telecom had to
complicates competition policy issues reduce its combined market share to
that are raised by the market below 50 per cent. This they did for
structure. Figure 2.9 attempts to one month (June 2001) by a process
summarise the status as of May 2002 they called demarketing (getting rid
with regard to cross-ownership, but of their least profitable subscribers
the situation remains a dynamic one, and not advertising for new ones).
subject to change. Subsequently, market share has
started to grow again.
2.4.1.1 SK Telecom
SK Telecom < www.sktelecom.com> SK has investments in several Asian
is currently the major player in the economies, including Mongolia
Korean mobile market with a 53 per (SkyTel) and Uzbekistan and most
cent market share, as of December recently they have gained a CDMA
2002 and net income in 2001 of license to operate in Viet Nam
Wo n 1 . 1 b i l l i o n Wo n ( U S $ 8 6 8 ( S Te l e c o m ) a n d i n C a m b o d i a .
million) on a turnover of SK Telecom also has technology
Won 6.2 trillion (US$ 5 billion). SK sharing agreements with China
Telecom was the first company in U n i c o m a n d Pe l e p h o n e ( I s ra e l )
Korea to offer analogue mobile related to CDMA technology.
162. ICT market
SK Telecom was the first in the world Like its rival, SK Telecom, KTF has its
to offer mobile data services over its roots in Korea Telecom, which owns a
standard CDMA network (IS-95). In 40 per cent stake. This came about
October 2000, it launched its through KT FreeTel, which merged
CDMA2000 1x service, under the with M.Com (now KTM.Com) in May
brand name Nate, and in 2001. KTF has a CDMA licence to
January 2002 it commercialized its operate in the 1’800 MHz band.
CDMA2000 1x EV-DO (1x Evolution,
data optimized) service. As of KTF claims that it was the first to
December 2002, it had 14.8 million introduce segmented marketing to the
wireless Internet-enabled handsets in Korean market. Among the different
use and 8.4 million regular Nate users segments it identifies and targets are:
(defined as using the service at least up to age 13 (Kid’s market); 13-
once a month). 18 year-olds (Bigi); 18-25 year-olds
(Na); 25-35 year olds (Main); older
2.4.1.2 KTF age groups (silver market); women
KTF is the second (Drama) and corporate sector (Viz).
largest mobile network operator with Average Revenue Per User (ARPU) is
a 32 per cent market share in highest in the “Main” group, but
December 2002 and a turnover of mobile Internet usage is highest
Won 4.49 trillion (US$ 3.7 billion). among the Na and Bigi groups.
Figure 2.9: How are they related?
Selected links between fixed-line, mobile and IMT-2000 operators in the Korean market, May 2002
Fixed-line
SK Group, a major Other KT (Korea Telecom), LG Group, major telecom operators
chaebol with diverse corporate incumbent fixed-line operator equipment manufacturer and
interests investors with 97% market share in basic chaebol
Retains 26.6%
Owns voice services & 49% in BT, UK
Controlling interest, ownership
7% broadband incumbent
acquired since 1994 Other operator
KT and SKT each own DACOM, corporate
Hanaro, Acquired ownership stake
around 11% of each int’l carrier investors
broadband carrier (now 21.7% ) in 1998
other
Owns
40% stake
SK Telecom KTF LG Telecom
SK Telecom (created in KT Freetel (created in LG Telecom (created in
1994 as KMTS), with 53% 1997), with 33% market 1996), with 14% market
market share and a licence share and a licence to share and a licence to
to operate CDMA services operate CDMA services at operate CDMA services at
at 900 MHz. 1’800 MHz. 1’800 MHz.
Shinsegi Telecom acquired KT M.Com (created as
by SK Telecom in January Hansol DACOM) and
CDMA
2000 merged KT Freetel in May Mobile
2001). operators
SK IMT, awarded a wideband KTI.com, awarded a wideband LG TeleCom , awarded a
CDMA licence in Dec. 2000. CDMA licence in Dec. 2000. CDMA2000 licence in August
Ownership consortium has 783 Ownership consortium has 636 2001. Ownership consortium has
members, led by SK members led by KT and KTF. 1’049 members led by LG Group,
Telecom/Shinsegi and POSCO. and including Hanaro and
DACOM.
IMT-2000
operators
Note: Only selected ownership links are shown and these are subject to change.
Source: ITU Korea case study research.
17Korea Internet Case Study
Like SK Telecom, KTF records wireless companies was later awarded a
Internet users as all those that have CDMA2000 licence in August 2001, for
suitably equipped handsets. This which it paid around US$ 900 million.
amounts to 10.2 million in
December 2002, of which 4.9 million In terms of commercial services, it is
are CDMA2000 1x users. not expected that IMT-2000 services
in the 2.1 GHz band will be available
2.4.1.3 LG Telecom until the second half of 2003. By then,
LG Telecom it is likely that the commercially
is the third mobile operator, with a available alternative CDMA2000 1x
market share of 15 per cent in EV-DO service will have stolen a
December 2002. As its name suggests, march on the market and it may be
it is part of the LG Corporation with LG difficult for W-CDMA to make up the
holding a 36 per cent share and BT of lost ground.
the UK a further 17 per cent (though it
is reportedly looking to sell this stake). 2.4.2 Mobile data
LG missed out on the consolidation that 2.4.2.1 What makes Korea
has taken place in the mobile market different?
since the year 2000; being neither In some ways, Korea is ahead of the
acquired not acquiring. It also missed rest of the world in mobile data. Korea
out on the W-CDMA licences for IMT- probably has a higher penetration of
2000, but has a CDMA-2000 licence in users of high-speed mobile Internet
the 2.1 GHz band. service than any other country in the
world. But, on the other hand, until
LG relies heavily on its sister companies recently Korean mobile operators
for distribution. These include, for generated a lower percentage of their
instance, gas stations and revenue from non-voice services than
supermarkets. It has a 1’800 MHz PCS other operators, for instance in Europe
licence, which it markets under the or Japan (see Figure 2.10). How can
brand name “PCS 019”. As of this apparent contradiction be
December 2002, LG Telecom had explained?
3.5 million wireless Internet users and
1.7 million CDMA2000 1x users. One reason is because of the particular
Korean way of counting mobile data
2.4.1.4 IMT-2000 players users. As no subscription payments
There are three IMT-2000 licensees are required, the number of
in Korea. As shown in Figure 2.9, they subscribers recorded are those that
are each aligned with one of the have suitably-equipped handsets. So,
existing mobile operators and also as most Korean subscribers like to
with fixed-line operators, chaebol and have the most up-to-date terminals,
other investors. Indeed, each IMT the recorded number of mobile data
licensee is really a consortium rather users is high. On the other hand, short
that a single company and the message service, which provides the
consortia have 783 (SK IMT), bulk of non-voice revenue for mobile
636 (Kti.Com) and 1’049 (LG operators in the GSM world, is
Telecom) members respectively. relatively modest in Korea. For
instance, SK Telecom reports that on
The licensing of IMT-2000 proceeded basic second generation (2G) SMS-
in two stages. Consortia led by the enabled handsets, average revenue
two major mobile operators were per user (ARPU) from mobile data is
initially awarded two W-CDMA only 1’756 Won (around US$ 1.40) per
licences, in December 2000, at a cost month. In Europe, SMS generates
of around US$ 1 billion each, through many times this level of revenue.
a hybrid beauty contest/auction. The
unsuccessful bidders in this round But the signs are that the situation is
included LG Telecom (the third mobile changing. Mobile data ARPU from
operator) and Hanaro Telecom (a CDMA2000 1x subscribers is more
broadband network operator). A than twice the level of that from basic
consortium including these two 2G users, and for CDMA2000 1x
18You can also read