A Twenty Year Odyssey 1997-2017 - Telecom Regulatory ...
←
→
Page content transcription
If your browser does not render page correctly, please read the page content below
Telecom Regulatory Authority of India                           TRAI
                                                             20 Glorious Years
                                                                1997- 2017

   A Twenty Year Odyssey
                1997-2017

     Telecom Regulatory Authority of India
      Mahanagar Doorsanchar Bhawan, Jawaharlal Nehru Marg,
             (Old Minto Road), New Delhi - 110 002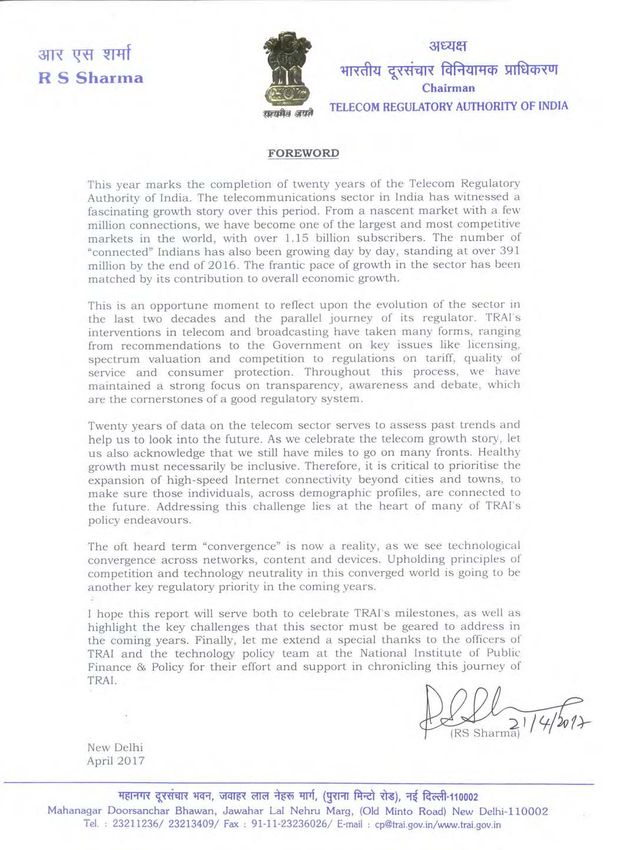
© Telecom Regulatory Authority of India, 2017
All rights reserved, no part of this publication may be
reproduced, stored in a retrieval system, or transmitted,
in any form or by any means, electronic, mechanical,
photocopying, recording and/or otherwise, without the
prior written permission of the Telecom Regulatory
Authority of India, New Delhi.

Prepared at the behest of
Telecom Regulatory Authority of India
by
National Institute of Public Finance and Policy
18/2, Satsang Vihar Marg, Special Institutional Area,
New Delhi - 110067

Designed by Namrata Bhatter
Contents

Executive summary 1                                         Internet access services 57
                                                            Broadcasting and cable services 58
1. An Introduction to TRAI 3                                     Tariff regulation
Background to TRAI 3                                             Consumer protection
Amendments to TRAI Act 4                                         Interconnection
Leadership and structure 4
                                                            6. Engagement with stakeholders 61
Funding and expenditure 6
                                                            Consultative process 61

2. State of the sector 7                                    Interaction with consumers and their organisations 61
                                                            Releases and publications 61
Trends in telecom services 7
                                                            Keeping pace with global developments 63
Trends in Internet services 14
Trends in broadcasting and cable services 18
                                                            7. Current challenges and way forward 64
                                                            Convergence 64
3. Financial health and economic contribution 22
                                                            Coordination with other agencies 65
Financial health of the sector 22
                                                            Bridging the digital divide 66
Contribution to the economy 24
                                                            Independent grievance redress 66
Foreign direct investment in telecom 26
                                                            Towards more innovation 67
Enabling effect on other sectors 28

                                                            References 68
4. Evolution of the policy and regulatory framework 34
Telecom Services 34
                                                            Acknowledgements 71
      National telecom policies
      Licensing framework
      Spectrum allotment and management                     Annex 72
      Universal service obligation                          Annex I - Abbreviations 72
      Value added services                                  Annex II - List of boxes 75
Internet access services 39                                 Annex III - List of figures 76
                                                            Annex IV - List of tables 77
      Development of the policy framework
      Addressing impediments to growth of broadband
      Identifying new backhaul spectrum bands
      National broadband plan: NOFN, Bharatnet and beyond

Broadcasting and cable services 42

      Television broadcasting
      Conditional access systems
      Uplinking/ downlinking norms
      Developments in radio broadcasting
      Community radio stations

5. Important milestones in TRAI's journey 49
Telecom services 49

      Tariff regulation
      Interconnection
      Intelligent networks
      Mobile number portability
      Consumer protection
      Other key initiatives
Executive summary
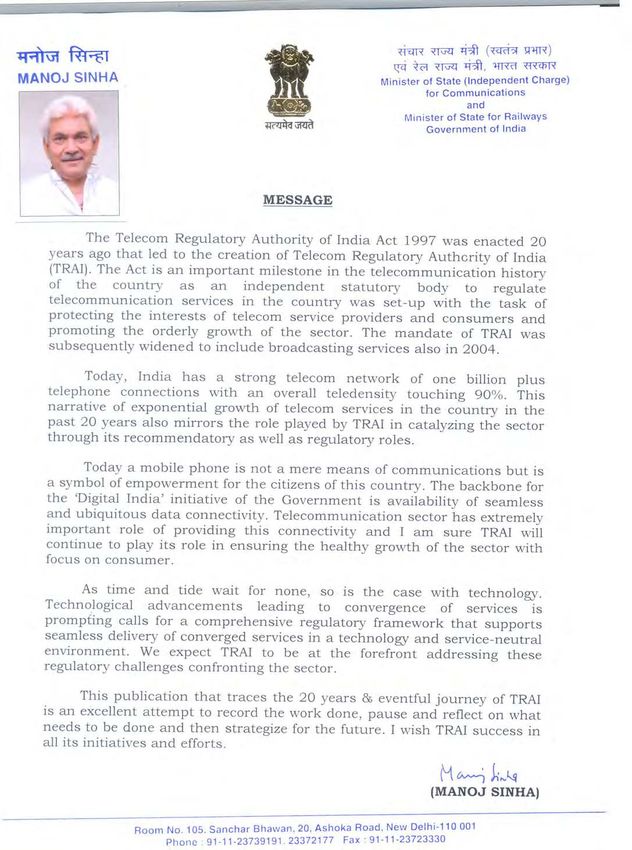
This year, the Telecom Regulatory Authority of India (TRAI) fuel the user demand for more and better services.
completes twenty years of its existence. Much has changed in
the last two decades since TRAI irst came into being as the While the above igures attest to the phenomenal growth in
independent statutory body, tasked with protecting the interests these sectors, the other story worth telling is that of how these
of telecom service providers and consumers and promoting the services, through enabling connectivity, employment and
orderly growth of entertainment have impacted lives, productivity, and indeed,
the sector. the economy as a whole. In this report we make an attempt to
track the contribution of developments in telecom, Internet
Starting from a nascent market that had a little over 14.5 access and broadcasting sectors on various other sectors of the
million phone connections in 1997 and “telephone on economy.
demand” was an early policy goal, we have grown to become
the second largest telecom market in the world, boasting The deinition of “telecommunication services”, given under
of over 1.15 billion subscribers today. Along with better the TRAI Act, covers a range of sectors, including basic and
connectivity, the Quality of Services (QoS) and afordability cellular telecom services, provision of Internet access and
of telecom services has also grown by leaps and bounds. The broadcasting services. Over the years, the boundaries between
dawn of the Internet-age ushered in a new wave of changes, these sectors have been gradually blurring on account of the
creating immense opportunities for both service providers as rapid convergence of technologies. The need for the policy and
well as users of Internet services. At the end of 2016, India regulatory framework to evolve along with this convergence
had over 391 million Internet users, of whom 236 million were has already become one of the key challenges for regulators
making use of broadband Internet services. These numbers are across the globe. Yet, even as convergence is undeniable, there
only growing day by day. Yet, much still needs to be done in continue to be many signiicant diferences between these
terms of bridging the digital divide and ensuring better access sectors, in terms of their genesis, market structures and the
to high-speed Internet connectivity across diverse demographic regulatory frameworks governing them. Accordingly, we ind
proiles and geographical areas. This is a challenge, as well as it useful to highlight the developments in each of these areas
an opportunity, and one that is bound to shape policy debates through dedicated sections in the report.
in this coming decade.
In each of the sectors, TRAI had exercised its recommendatory
The broadcasting and cable services sector, which came under functions to ignite and support several key decisions and
TRAI's purview in 2004, has also witnessed a fascinating processes of the Government. These recommendations
growth story. At the end of December 2016, we had a total have ranged from issues relating to: licensing conditions for
of 899 private satellite TV channels, in addition to the many service providers, allocation and availability of spectrum, and
channels ofered by Doordarshan (DD) - a giant leap from increasing competition and eiciency in the sectors.
the public monopoly that we saw a few years back. These
channels are provided to viewers by a range of distribution On the regulatory side, ixing and regulating tarifs for telecom
service providers, comprising of approximately 60,000 Local and broadcasting services is one of TRAI’s core mandates.
Cable Operators (LCOs), approximately 1200 Multi System Recognising the value of allowing competitive forces to
Operators (MSOs), 6 Direct-to-Home (DTH) operators shape the demand and supply of telecom services, within a
and 2 Head-end-In-The-Sky (HITS) operators. In addition regulated environment, TRAI has maintained a policy of
to this, many Internet Protocol Television (IPTV) service tarif forbearance in the telecom sector. This has contributed
providers and mobile distribution networks are also vying for to healthy price competition in the sector, yielding some of the
the attention of the Indian television consumer. On the radio lowest tarifs in the world, with a direct impact on the uptake
communications front, we currently have over 273 private of telecom services. At the same time, TRAI has continued to
Frequency Modulation (FM) radio stations. This is in addition ensure regulatory oversight so that service providers ofer their
to more than 400 stations of All India Radio (AIR) and about tarifs in a transparent, competitive and non-discriminatory
200 operational community radio channels. manner. It has also laid equal emphasis on the protection
These growth stories have been fuelled by a mix of several of consumers and maintaining the QoS being ofered to
important factors, which include the emergence of new growth them. Initiatives such as mobile number portability (MNP),
opportunities; healthy investments in the sectors and rapid prohibition of unsolicited communications, transparency
development of technology. The resulting vibrant competition norms and redress by service providers are some examples of
among players has led to afordable prices for users. At the measures that have gone a long way in empowering consumers
same time, increasing awareness about the availability and of telecommunication services in India.
beneits of telecom and broadcasting services has continued to
11TRAI has also taken the lead in regulating some of the more By doing so, the Authority ofers all stakeholders, including
complex policy questions confronting regulators globally, members of the general public, an equal opportunity to
its support of net-neutrality through its prohibition of contribute fruitfully to the process of policy formulation and
discriminatory tarifs being a recent case in point. The policy implementation.
debate around this issue was hotly contested, and various
stakeholders and experts, both in India and internationally,
contributed their views to the Authority in a vibrant
consultation process. This was typical of TRAI’s general
openness to a diversity of opinions in its policy making process.
TRAI has strived hard to maintain a high level of transparency
and openness in the exercise of all its functions. This includes
transparency through a well-deined consultative process for
making recommendations, regulations or any other statutory
instruments.
2Chapter 1: An introduction to TRAI
Background to TRAI
The NTP, 1994 brought with it the inevitable need for an
The regulation of telecom services in India inds its genesis independent regulatory framework that would separate the
in the Indian Telegraph Act, 1885, which grants the Central Government's regulatory functions from its service-providing
Government exclusive privilege to establish telegraph services. functions, in line with global best practices. This led to
The Government also has the power to grant licenses to other the creation of the TRAI, with efect from 20th February
operators to carry on those services. Until the mid-nineties, the 1997, pursuant to the provisions of the Telecom Regulatory
Government exercised a monopoly over this sector, with the Authority of India Act, 1997 (TRAI Act). TRAI was given
Department of Telecommunications (DoT) being responsible the responsibility of regulating telecom services, including
for administering telecom services throughout the country.1 ixation and revision of tarifs, determining QoS standards and
International telecom services were ofered by Videsh Sanchar ixing the terms and conditions for interconnectivity between
Nigam Ltd. (VSNL), a Government-owned company.2 providers.
The National Telecom Policy, announced by the Government Over the years, TRAI's mission has been to create and nurture
in 1994 (NTP, 1994), sought to change this position by allowing conditions for growth of telecom in the country in a manner
for the participation of private entities. This led to the opening and at a pace which will enable India to play a leading role in
up of basic telecom services in addition to Value Added the emerging global information society. Its objectives, as noted
Services (VAS) such as cellular services and radio paging that in Box 1.1, have evolved with its changing responsibilities,
had already been thrown open to private participation in 1992. particularly the inclusion of broadcasting services within
TRAI's regulatory mandate in 2004.
BOX 1.1: TRAI’S OBJECTIVES
The goals and objectives of TRAI are focused towards providing a regulatory regime that facilitates achievement of the objectives of the New
Telecom Policy that was adopted in 1999 (NTP, 1999). These are as follows:
1. Increasing tele-density and access to telecom in the country at affordable prices.
2. Making available telecommunication services which in terms of range, price and quality are comparable to the best in the world.
3. Providing a fair and transparent policy environment which promotes a level playing field and facilitates fair competition.
4. Establishing an interconnection regime that allows fair, transparent, prompt and equitable interconnection.
5. Re-balancing tariffs so that the objectives of affordability and operator viability are met in a consistent manner.
6. Protecting the interest of consumers and addressing general consumer concerns relating to availability, pricing and QoS and other matters.
7. Monitoring the QoS provided by the various operators.
8. Providing a mechanism for funding of net cost areas/ public telephones so that Universal Service Obligations (USO) are discharged by
telecom operators for spread of telecom facilities in remote and rural areas.
9. Preparing the grounds for smooth transition to an era of convergence of services and technologies.
10. Promoting the growth of coverage of radio in India through commercial and non-commercial channels. (Added in 2003-04)
11. Increasing consumer choice in reception of TV channels and choosing the operator who would provide television and other related
services. (Added in 2003-04)
12. Migration to digital addressable systems in broadcasting. (Added in 2010-11)
In pursuance of its objectives, TRAI has, from time to time, issued a number of regulations, orders and directives to provide the
required direction for the market’s evolution from a Government-owned monopoly to a multi-operator, multi-service, open and
competitive market.
1) The country was divided into 20 telecommunication circles and 4 metro districts. DoT provided basic telecommunication services in all these 2) Indian Papers/ Submissions in WTO - Negotiating Group on Basic Telecommunications Services, 26 October 1995, Ministry of Commerce,
circles and metro districts except 2 metro districts, Bombay and Delhi, where MTNL provided the service. Government of India.
3Amendments to the TRAI Act Government or in the telecommunication industry within a
period of two years from the date on which they cease to hold
In the twenty years of its existence, the TRAI Act has gone oice with TRAI.
through some key amendments. The law, as originally
enacted, conferred TRAI with the quasi-judicial function to Over the years, the Authority has been chaired by an excellent
adjudicate upon telecom disputes. This position was modiied set of dynamic leaders all of whom have contributed in diverse
by the TRAI (Amendment) Act, 2000, which divided the ways to the shaping of the Indian telecom regulatory landscape
functions of the original TRAI between TRAI and the newly (See igure 1.1)
created Telecom Disputes Settlement and Appellate Tribunal
(TDSAT). Following this amendment, TRAI was vested with
recommendatory and regulatory functions, while dispute FIGURE 1.1 : CHAIRPERSONS IN THE LAST TWENTY YEARS
settlement functions were handed over to TDSAT.
The 2000 Amendment classiied TRAI’s functions into the
1997 - 2000
following broad categories: Justice (Retd.) S.S. Sodhi
Making recommendations on various issues;
General regulatory and administrative functions;
Fixing tarifs and rates for telecom services; and 2000 - 2003
Any other functions entrusted by the Central Government. Shri M.S. Verma
Under the amended Act, a clear distinction has been made
between TRAI's recommendatory functions and its regulatory
ones, as provided under Section 11(1) of the TRAI Act. It also 2003 - 2006
mandated the Government to seek the recommendations of Shri Pradip Baijal
TRAI in respect of certain speciied matters, namely the need
and timing for introduction of new service providers and the
terms and conditions of licences issued to a service provider.
2006 - 2009
Shri Nripendra Misra
BOX 1.2: TRAI’S BROADCASTING MANDATE
2009 - 2012
The TRAI (Amendment) Act, 2000 revised the definition of Dr. J.S. Sarma
“telecommunication service” to add that the Central Government
may notify other service to be telecommunication service, including
broadcasting services.
In exercise of this power, the Government, vide a Notification dated 2012 - 2015
9th January, 2004, added broadcasting and cable services within Dr. Rahul Khullar
the definition of telecommunication service in terms of Section 2(k)
of the TRAI Act.
2015 - present
Shri R.S. Sharma
Leadership and structure
Another major change brought about by the 2000 amendment
was relating to the composition of the Authority. The 1997 Act
provided that the Authority would consist of a Chairperson,
and between two to six members, to be appointed by the
Central Government. This was changed to provide for a
Chairperson, two whole-time members and two part-time
members, appointed by the Central Government.
The TRAI (Amendment) Act, 2014 made another change to
the terms of appointment of the Chairperson and members.
It was clariied that they would require the prior permission
of the Government in order to accept any position with the
44The Authority functions with a Secretariat headed by a
Secretary and assisted by seven divisions which are as follows:
FIGURE 1.2 : TRAI'S ORGANISATIONAL STRUCTURE
Administration
Responsible for all administrative and personnel-related
functions, which include planning and control of human
resource development within TRAI. This division also
handles the responsibilities of communications, availability of
information in respect of all divisions and Right to Information
CHAIRPERSON
(RTI) related matters. In addition, it also handles international
relations, which includes coordination with all organisations
such as the International Telecommunication Union (ITU),
World Bank, Asian Development Bank and regulatory bodies
in other countries. Over the years, TRAI has been engaging
MEMBER MEMBER MEMBER MEMBER
with a number of these organisations to carry out development
and research work relating to telecom and broadcasting sectors.
Broadcasting & Cable Services (B&CS)
Responsible for advising the Authority, for laying down the
overall regulatory framework for the broadcasting, cable TV
and FM radio sectors. This includes interconnection, QoS and
tarif aspects, as well as compliance of license conditions by SECRETARY
service providers. The B&CS division is also responsible for
examining issues relating to the modernisation and digitisation
of the sectors, protecting the interests of stakeholders and
proposing recommendations relating to this sector.
ADMINISTRATION PRINCIPAL
Consumer Afairs and Quality of Service (CA&QoS) ADVISOR
Responsible for development of consumer advocacy in the
telecommunication sector and creating general awareness
BROADCASTING & CABLE SERVICES
amongst consumers about measures taken by TRAI to protect PRINCIPAL
ADVISOR
their interests. The division facilitates registration of consumer
organisations and interactions with them. In addition, it is
also responsible for laying down the standards of QoS to be CONSUMER AFFAIRS AND QUALITY OF SERVICE PRINCIPAL
ADVISOR
provided; and conduct periodical surveys of such services.
Another responsibility of this division is to maintain the
register of interconnect agreements. FINANCIAL & ECONOMIC ANALYSIS PRINCIPAL
ADVISOR
Financial & Economic Analysis (F&EA)
Responsible for providing advice on all aspects relating to cost
NETWORKS, SPECTRUM AND LICENSING (NSL) PRINCIPAL
methodologies and costing of telecom services, accounting ADVISOR
separation and analysis of inancial statements of service
providers. The division also advises the Authority on framing
of appropriate tarif policies and ixation of tarifs for services LEGAL PRINCIPAL
that are under tarif regulation. In addition, the division ADVISOR
advises the Authority on matters relating to ixation of cost
based interconnection charges and on measures to promote TECHNOLOGICAL DEVELOPMENT (TD) PRINCIPAL
competition in various segments of telecommunication ADVISOR
services. This division is also responsible for compiling the
quarterly “Indian Telecom Services Performance Indicators
Report”. It is the internal inancial advisor to TRAI, rendering
for monitoring of compliance of license conditions of service
advice on all inancial and accounting matters.
providers and overseeing issues related to eicient management
of spectrum, introduction of new wireless technologies
Networks, Spectrum and Licensing (NSL)
and related regulatory issues. The division also handles
Responsible for ixing the terms and conditions of
recommendations on all related aspects and compliance with
interconnection and their regular review; ensuring efective
USO. In addition, the division also regulates MNP and porting
interconnection between service providers; and handling
charges.
interconnection-related issues. The division is also responsible
5Legal within the organisation.
Legal division is responsible for rendering legal advice to the
Authority on all regulatory issues. The division manages all Over the years, TRAI oicers have been deputed to attend
litigation matters in which TRAI is a party. international training programmes conducted by various
institutions, including the ITU. The oicers have received
Technological Development (TD) valuable inputs through these trainings and the inputs have
This division seeks to build up capacity for technical research enriched their skills in their respective area of regulatory work.
in telecom with the aim of understanding and identifying In the recent times several oicers of TRAI were also deputed
technology trends to assist the Authority in making more for various domestic training programmes, which included
informed decisions. It handles issues related to next generation the training seminar on regulatory governance at the National
networks, manufacturing for telecom sector, environmental Institute of Public Finance and Policy (NIPFP), “Regulatory
issues, infrastructure management, electromagnetic radiation Impact Assessment” conducted through Consumer Unity
and public safety and convergence in various forms. The & Trust Society (CUTS) International, Jaipur, “Utility
division is also responsible for managing TRAI's IT resources Regulations & Strategy for the Regulatory Bodies of India”
including local and remote servers and publication of the through OP Jindal Global University, Sonipat and online
Technology Digest, which focuses on one technology in course on “Advance professional Course in Competition Law
every issue. & Market Regulation” through Indian Institute of Corporate
Afairs (IICA), Manesar.
Staing of oicials
TRAI oicials were initially drafted on deputation from various Regional oices
Government Departments. These deputationists with relevant The Head Oice of TRAI is in New Delhi. In 2012, the
experience in the ields of telecommunication, economics, Authority approved the opening up of 11 (eleven) Regional
inance, administration, etc., were initially appointed for a Oices at various locations across the country. However,
period of two years and thereafter, if required, requests were after reviewing the working of the Regional Oices during
sent to concerned Government Departments / organisations 2014-15, the Authority approved the closure of 5 Regional
for extending their deputations. Seeking extension of Oices located at Chandigarh, Patna, Mumbai, Guwahati
deputations in respect of trained and experienced existing and Lucknow. The 5 regional oices that continue to remain
employees has often proved to be diicult. The Authority, in existence are located at Hyderabad, Kolkata, Bengaluru,
therefore, constituted a cadre of oicers and staf with Bhopal and Jaipur. These Regional Oices of TRAI are
specialised expertise and skills with the option of permanent operating on pilot project basis under plan fund as part of the
absorption of deputationists into TRAI. Thus, today the capacity building project of TRAI.
Authority has a mix of permanent cadre of TRAI oicers and
oicers on deputation. While the scope, scale and complexity Funding and expenditure over the years
of Authority’s functions continue to grow at a fast pace,
the Authority is facing the problem of losing trained and TRAI is an autonomous body which is wholly funded by grants
experienced personnel on deputation due to their repatriation received from the Consolidated Fund of India. Other sources
to their parent departments on completion of their deputation. of income include proit on assets sold, export incentives
realised as well as fees and penalties from telemarketers. TRAI’s
Capacity-building expenditure accounts mainly for establishment expenses
TRAI accords utmost importance to human resource initiatives (payments made to staf), as well as administrative expenses
to develop expertise for its staf in the ields of telecom and and subsidies/grants paid out to other organisations. The
broadcasting especially related to tarifs and quality of services expenditure incurred by TRAI had been increasing gradually
standards, new and emerging technologies, conduct of surveys over the years to account for its changing responsibilities and
on QoS and other consumer related matters. This has proved functions and the increase in the size of the markets that it
to be useful for its oicers and staf to participate efectively in regulates. This igure has risen from Rs. 86 million in 2001 to
the consultative processes of the Authority, both through the Rs. 545.1 million in the year 2015-16. This also includes the
preparation of consultation papers and analysing feedback expenditure incurred under diferent training and consultancy
and responses received and also during open house discussions. programmes.
This has also helped in developing the policy framework to
address various issues which arise in regulating the telecom
sector. In selecting and designing training programmes and
workshops, TRAI’s endeavour is to impart diverse skills for
macro level policy and handling of techno-economic operating
details relevant for implementation and monitoring of policies.
Special programmes need to be identiied or designed and run
to meet the speciic needs of TRAI, the Authority sponsors
its oicers for international training under the ‘Institutional
Capacity Building Project’ for further developing their expertise
6Chapter 2 - State of the sector
Introduction stood at over 1.15 billion by December, 2016. This has been
an extraordinary journey for the Indian telecom sector and
The deinition of “telecommunication services”, given under its users, as we gained widespread connectivity and access to
the TRAI Act, covers a range of sectors, including basic and communication services at reasonable prices. In this process,
cellular telecom services, provision of Internet access and the phone device has been transformed from a “luxury” to a
broadcasting services. Over the years, the boundaries between necessary good for social and economic mobility.
these sectors have been gradually diminishing on account of
the rapid convergence between technologies. The need for The telecom growth story is best understood in the context
the policy and regulatory framework to evolve along with of policy developments that have contributed to the
this convergence has already become one of the key focus competitiveness of the sector. The New Industrial Policy of
areas for regulators across the globe. However, in the current 1991 initiated the process of liberalisation in India, starting
environment there continue to be many signiicant variations with the de-licensing of telecom equipment manufacturing.
between these sectors, in terms of their genesis, market This was followed by the pro-competition stance of the NTP,
structures and the regulatory frameworks governing them. This 1994, which led to the opening up of basic telecom services to
chapter provides an overview, and tracks the evolution of the the private sector, now widely recognised as a trigger point for
telecom, Internet access and broadcasting sector. telecom growth in India. This process was, however, brought to
fruition only after adoption of the NTP, 1999.
Trends in telecom services
Post NTP, 1999, the sector moved from the ixed license fee
Genesis of the sector model to a revenue share model, and lower tarifs ensued. The
result was that the period from 1999-2003 saw an addition of
Starting from a subscriber base of 14.88 million users in March approximately 12 million new mobile subscribers as compared
1997, the total number of telephone subscribers in India to less than 1 million in the preceding period of 1995-1999.
TOTAL PHONE 1151.78 NATIONAL
SUBSCRIBERS MILLION TELEDENSITY
89.90
All values in million Number of telephone connections(fixed and wireless) per 100 people
WIRELESS WIRELINE WIRELESS WIRELINE
1127.37 24.40 88.0 1.90
FIGURE 2.1: TELECOM SECTOR TODAY (AS OF DEC 31ST 2016)
URBAN PHONE SUBSCRIBERS URBAN TELEDENSITY
TOTAL TOTAL
WIRELESS 683.14 WIRELINE WIRELESS
170.15 WIRELINE
662.60 MILLION 20.55 165.04 5.12
RURAL PHONE SUBSCRIBERS RURAL TELEDENSITY
TOTAL TOTAL
WIRELESS 468.64 WIRELINE WIRELESS
53.27 WIRELINE
464.78 MILLION 3.86 52.84 0.44
Source: As per TRAI records
7This was followed by the issuance of the Government's developments as a result of certain pragmatic decisions made
guidelines on licence for basic services on 25th January, 2001, by the Government and the regulator. These included, the
in line with the recommendations made by TRAI. These introduction of the Calling Party Pays (CPP) regime, the
guidelines provided for the opening up of the basic telephone uniied access licensing regime, and lowering of Access Deicit
services without any restriction on the number of operators. Charges (ADC). By the year 2007, India's total telecom
subscriber base, ixed and mobile, had made it the second
The period from 2003 onwards saw further positive largest wireless network in the world, after China.
BOX 2.1: THE RISE AND FALL OF PCOS
In the early years of the telecom sector, PCOs or Public Call Offices became ubiquitous in India’s rural and urban areas. Till 2008 they
witnessed steady growth, from about 1 million in 2002 to more than 6 million in 2008. Subsequently, however, with the simultaneous
spread of mobile services, the number of PCOs has been on a decline. The figures from March, 2016 peg the number of PCOs at 0.59
million, which is very close to what the sector began with in 1999.
8
6.2
6
NUMBER OF PCOs (MILLIONS)
4
2
0.5 0.6
0
9
00
01
02
03
04
05
06
07
08
09
10
11
12
13
14
15
16
199
20
20
20
20
20
20
20
20
20
20
20
20
20
20
20
20
20
YEAR Source : As per TRAI records
In line with the spread of voice telephony, the time has now come for adopting a similar model for the making broadband Internet
services accessible to each and every person at an affordable cost. In its recent recommendations to the Government on “Proliferation
of Broadband through Public Wi-Fi Networks”, the Authority has suggested a light-touch framework for encouraging the development
of a market for Public Data Offices (PDOs). The idea is to create a new category of small players who will be able to contribute in a big
way for making broadband available to the masses through Wi-Fi access points; much like the PCOs did for voice telephony until a few
years back.
Users of telecom services In 2000, mobile subscriptions accounted for around 10 percent
of total subscriptions but this ratio has undergone a dramatic
In the early years, telecom connectivity was almost synonymous turnaround in the ensuing years. During the year 2004-05, the
with ixed landline phones. This segment saw a growth from number of mobile subscribers exceeded the number of ixed
approximately 150,000 exchange lines in 1947 to about 18 subscribers for the irst time and this gap has only widened over
million in 1997. However, with increased accessibility and the years. The changing trend is depicted in igures 2.2 and 2.3.
afordability of mobile services, the focus of growth has In the last decade itself, mobile subscribers have grown at high
rapidly shifted to the mobile/wireless segment. Fixed wireline Compounded Annual Growth Rate (CAGR) of 27.62 percent.
subscriptions have been reporting a steady decline for well over Of the 1.15 billion telecom subscribers in the country at the
a decade. end of 2016, the wireline segment accounted for a paltry share
of just 2.1 percent.
8FIGURE 2.2 : MOBILE AND FIXED LINE SUBSCRIPTIONS
FIXED SUBSCRIBERS MOBILE SUBSCRIBERS
1200 25.2
1033.6
1000 27.62%
CAGR over the last
decade (2006-2016) in
mobile subscribers
800
SUBSCRIBERS (MILLIONS)
600
400
200 17.8
0.8
0
1998 1999 2000 2001 2002 2003 2004 2005 2006 2007 2008 2009 2010 2011 2012 2013 2014 2015 2016
YEAR Source: As per TRAI records
FIGURE 2.3 : PROPORTION OF FIXED VERSUS MOBILE SUBSCRIBERS
100.0%
FIXED MOBILE
75.0%
PERCENTAGE
50.0%
25.0%
0.0%
1998 2000 2002 2004 2006 2008 2010 2012 2014 2016
YEAR
Source: As per TRAI records
9A recent ITU report found that the diferences between usage Teledensity, which is deined as the number of subscribers
and ownership of mobile are large (14 percentage points or per hundred persons of the population is seen to be a useful
more), indicating that many people access mobile-cellular indicator of the state of penetration of telecom services in
services by sharing a device and/or Subscriber Identiication urban and rural areas. Data from 1997 indicates that the
Module (SIM) card. Diferences between mobile-phone overall teledensity in the country was a mere 2 percent, well
ownership and usage were found to be particularly large in below the global average of 13. It is a signiicant testament
India, where around half of the mobile-cellular users do so to the growth of telecom services that this igure increased to
using someone else’s SIM card or device.3 89.90 by the end of 2016. In 2008, the Authority evaluated a
decade of the sector's progress and found that the teledensity
Mobile phone ownership and usage also varies along was at 26.22, much ahead of the target of 15 by the year
demographic parameters like gender and age. Connected 2010 set under NTP, 1999. Rural teledensity at the end of
Women 20154, a report by GSMA (Groupe Speciale Mobile March, 2008 was 9.20 as compared to 0.40 in 1998, which
Association), found that of the total 612 million female too was much ahead of the NTP, 1999 target of 4 by the year
population in India, only 28 percent own a mobile phone as 2010. The map in igure 2.4 gives us a picture of the status
against 43 percent in the male population. The gender gap of teledensity in all telecom circles in the country. Circles like
of mobile ownership is therefore 114 million. Factors such as Bihar, Assam, Madhya Pradesh, Uttar Pradesh and Odisha are
limited resources and social norms explain why men in the seen to be behind the overall country teledensity, indicating that
household are often the irst to get a mobile phone, whereas more work needs to be done in these circles to improve these
women often share or borrow mobile phones for use. numbers.
FIGURE 2.4: TELEDENSITY IN INDIA - CIRCLE/STATE WISE (HEAT MAP)
89.90 91.08
TELEDENSITY: Number of telephone
All India Teledensity connections (fixed and wireless) per 100
Hig Low
248.19 140.79
119.9
87.36
88.24
88.97 71.53
64.34
59.4
108.63
64.35 88.85
77.38
105.69
93.66
110.39
124.76
111.41
Source : As per TRAI records
3) ITU, Measuring the information society report, 2016.
4) GSMA, Connected Women, Bridging the gender gap: Mobile access and usage in low and middle-income countries, 2015.
10Despite these largely positive developments, the fact that the remains three times that of rural teledensity, even though the
subscriber base has remained skewed in favour of urban areas share of urban and rural subscribers at the end of 2016 was at
is a sobering reminder that there is still a long way to go. While 59.31 percent and 40.69 percent, respectively. The teledensity
the urban teledensity increased from 10 to 154 from the period numbers have grown steadily over the years, barring the small
between 2001 to 2016, the rural teledensity remained at much dip in 2013 that could be attributed to the guidelines issued by
lower levels, increasing from 0.9 to 51.4. The urban teledensity TRAI on ‘de-activation of inactive SIMs’
FIGURE 2.5: RURAL AND URBAN TELEDENSITY SINCE 2001
TELEDENSITY: Number of telephone connections (fixed and wireless) per 100 people URBAN TELEDENSITY RURAL TELEDENSITY TOTAL TELEDENSITY
200
RURAL 51.37
180
URBAN 154.01
TOTAL 83.36
160
140
120
PERCENTAGE
100
80
60
RURAL 0.93
URBAN 10.37
TOTAL 3.52
40
20
0
2001 2002 2003 2004 2005 2006 2007 2008 2009 2010 2011 2012 2013 2014 2015 2016
YEAR (As on March 31st)
Source : As per TRAI records
Tarrif trends
Declining tarifs over the years have been a key enabler for the rapid and widespread adoption of voice services. Local call tarifs
for mobile services, which were roughly around Rs.8 per minute in 2000 are now around Rs.0.50. A one minute Subscriber Trunk
Dialling (STD) call between Delhi and Mumbai, which was at the rate of Rs. 37 is now available to users at the rate of a local call,
and an International Subscriber Dialling (ISD) call to the American continent costs less than Rs. 7, down from about Rs. 75 in the
year 2000.
11FIGURE 2.6: AVERAGE SUBSCRIBER OUTGOING TARIFF - GSM BLENDED (POSTPAID AND PREPAID)
10 OUTGOING TARIFF / MINUTE
9
8.55 Forbearance of tariff -
2002
8 mobile services
7
IUC regulations and
2004
RUPEES / MINUTE
introduction of CPP regime
6
5 Introduction of Unified
2005
Access Licensing regime
4
Introduction of
2006
3 2.89 lifetime schemes
2
1 0.92
0.49 0.48
0
2000 2001 2002 2003 2004 2005 2006 2007 2008 2009 2010 2011 2012 2013 2014 2015 2016
YEAR Source: As per TRAI records
A number of signiicant events have contributed to the period, falling from 493 for Global System for Mobile (GSM)
declining tarif over the years. Some of the key developments communications users and 364 for Code Division Multiple
include forbearance from regulating tarifs for cellular mobile Access (CDMA) users in 2008; to 360 and 255, respectively
services that was announced in 2002; Interconnection Usage by the end of 2016. Similarly, the Average Revenue Per User
Charge (IUC) regulations and introduction of the CPP regime (ARPU) has also seen a decline - by 61.5percent for CDMA
during 2004; introduction of Uniied Access Licensing regime users and 68.1 percent for GSM users. Some explain this
in 2005; and introduction of lifetime schemes in 2006. These decline in minutes of usage per connection to multi-SIM
have been explained in more detail in the chapter on ‘Evolution usage patterns, which can be attributed to some extent to the
of policy framework’. tarif wars between providers. In fact, an ITU report from
2013 found that telecom tarifs in India are of the lowest in
During the period from 2007-2012, tarifs have steadily the world, with subscribers paying less than users in the US,
declined in the face of ierce competition. The minutes of Australia, Pakistan and China.5
usage per connection also saw a decline during and after this
TABLE 2.1 - INTERNATIONAL MOBILE USAGE STATISTICS - 2014 (SELECTED ECONOMIES)
Country Monthly minutes Country Monthly SMS
Pakistan 228 France 251
China 190 Pakistan 190
France 188 United Kingdom 116
India 169 China 58
United Kingdom 146 India 23
Germany 126 Germany 19
Thailand 81 South Africa 15
South Africa 80 Thailand 14
Source: ITU, Measuring the information society report, 2016.
5) ITU, Measuring the information society report, 2016.
12Competitiveness and growth March 2016 relecting a 6.26 percent increase over the previous
year. The developments in the recent months have only added
In 2005 the telecom sector had achieved an annual growth further to the burgeoning subscription igures. As of December,
rate of 1.91 percent in teledensity, which was equal to the total 2016, the total number of subscribers was 1152 million,
growth seen in the 50 years before that. This healthy growth relecting an 8.8 percent increase from March 2016.
trend has continued since then with the total subscriptions in
Figure 2.7: Profile of telecom operators
PUBLIC TOTAL PRIVATE
117.7 million | 10.2 % 1151.8 million 1034.1 million | 89.8 %
Wireline Wireless
PUBLIC PRIVATE PUBLIC PRIVATE
17.2 million | 70.5 % 7.2 million | 29.5 % 100.4 million | 8.9 % 1026.9 million | 91.1 %
24.4 million 1127.4 million
TOTAL TOTAL
Source: As per TRAI records
After the announcement of the NTP, 1994, the DoT issued Reliance Infocom Ltd. (21 circles), M/s Tata Teleservices
guidelines for private sector entry into basic telecom service. In Ltd. (20 circles), M/s Bharti Airtel Ltd. (17 circles), M/s
early 1995, bids were called for basic service and were received ShyamTelelink Ltd. (Rajasthan circle) and M/s HFCL Infotel
in August, 1995. By March, 1996, the successful bidders were Ltd. (Punjab circle). All the ive private operators had migrated
short-listed for providing basic services and in 1997, license to the Uniied Access Service (UAS) regime during 2003-04.
agreements with private Basic Service Operators (BSOs) were Vodafone entered the basic services market in 2011-12 and
signed for six circles. However, unlike other services, the basic since then, there have been six private operators apart from the
service did not take of in the manner expected soon after the two public operators, Mahanagar Telephone Nigam Limited
licenses were awarded. (MTNL) and Bharat Sanchar Nigam Limited (BSNL).
Subsequent to the announcement of the NTP, 1999, TRAI’s Private participation in the cellular mobile market, on the
recommendations were sought for grant of fresh licenses for other hand, has been comparatively more successful. In 1994,
basic telecom service in the 15 vacant telecom circles and for eight cellular licenses, two in each of the metros were awarded.
additional licenses in 6 circles where licenses had already been Subsequently, a bidding process resulted in the award of
issued. TRAI gave its recommendations to the Government on licenses in 18 circles. For two circles, Jammu and Kashmir, and
31st August 2000. In line with the TRAI’s recommendations, Andaman and Nicobar Islands, no bids were received, while for
the Government issued the Guidelines for issue of Licence West Bengal and Assam, only one bid each was made.
for Basic Service on 25th January, 2001. These guidelines
provided for opening the basic telephone services without any The number of private cellular operators steadily increased,
restriction on the number of operators. By the end of March with there being around ifteen-sixteen operators present across
2009, licenses were awarded to 5 private BSOs namely, M/s diferent circles at one point of time. By any measure, this is a
13highly competitive telecom market, especially relative to most The Task Force presented its ‘IT Action Plan’ to the
of its global counterparts. A 2014 report from Merrill Lynch Government in July, 1998, recommending several initiatives
Global Research compares the Herindahl-Hirschman Index aimed at the creation of a liberalised policy and procedural
(HHI) for various countries and India had the lowest market environment. These included the ending of VSNL’s monopoly
concentration at 0.22.6 An E&Y report from 2014 noted Indian on international gateway for Internet access; access to Internet
telecom to be “congested” sector with many operators having through Cable TV; Internet access nodes to be opened by
less than 10 percent subscriber market share.7 In December DoT and authorised ISPs in all district headquarters; and up
2013, an empowered Group of Ministers (EGOM) approved gradation of STD/ISD booths into full-service 'information
a previous recommendation from the Telecom Commission, kiosks' ofering e-mail, voice mail and Internet.
which allowed two or more service providers to merge as long
as their post-deal market share did not exceed 50 percent Following these developments, in November, 1998, the
(previously 35 percent) of the country’s subscribers. Since Government announced its decision to end its monopoly over
these new M&A guidelines, the sector has seen a trend towards the provision of Internet services through the implementation
consolidation with several exits and mergers being announced. of the New Internet Service Provision Policy. The main
Videocon stopped operations in 2016, and both Reliance features of the policy included:
Communications/Aircel (2016) and Vodafone/Idea (2017)
have announced their intention to merge, pending regulatory No restriction on number of service providers. The providers
approvals. were, however, not permitted to ofer Internet telephony.
Three types of license - national circle-wise and district-basis.
Competitive intensity in the market has allowed for innovative No prior experience in IT and telecom required to obtain a
business models to emerge with tarifs and services that suit license. Period of license was for ifteen years, extendable by
varying budgets. This, combined with the advent of low cost ive years. No license fee for irst ive years.
handsets, has reduced the entry barriers for new Service providers given the option of building or leasing
telecom subscribers. capacity from infrastructure owners (BSOs, railways, energy
utilities, etc.).
Trends in Internet services Foreign equity participation capped at 49 per cent.
Freedom to ix tarif, subject to TRAI’s ability to review and ix
The Internet services landscape in India has witnessed tarif at any time during the license.
tremendous changes since 15th August 1995 when Internet Service providers allowed to set up international gateways after
services were irst launched in the country. In 1995, VSNL obtaining security clearance.
became the irst commercial Internet Service Provider (ISP)
ofering public Internet services in India. Within two years, The opening up of the sector led to the issuance of licenses to
VSNL/DoT had 75,000 Internet subscribers on the network private operators -- 94 ISP licenses were issued in the irst year,
and had reached double that igure in 1998.8 It was in of which, 16 were Category A licenses (whole country), 31 were
November, 1998 that the Government decided to open up the Category B licenses (20 telecom circles and 4 metro towns)
sector to private participants, ending the monopoly that was and the remaining 47 were Category C covering secondary
enjoyed by the DoT, along with VSNL and MTNL, till that switching areas. These providers collectively served a subscriber
point of time. This marked the tipping point for subsequent base of around 270 thousand with another 400 thousand users
changes in terms of increased number of service providers, being catered to by the public sector. In a drastic shift from that
burgeoning subscriber base and other positive developments position, we now have 391.5 million Internet subscribers, as per
in terms of speeds, quality and rates for Internet services, that the numbers reported by 149 ISPs.
have come about in the last several years.
The initial launch of Internet in 1995 was through dial-up
In its very irst annual report for the year 1998-99, TRAI access with speeds of up to 9.6 Kilobits per second (Kbps).
acknowledged the role of the Internet as a “versatile and Integrated Services Digital Network (ISDN) access was
powerful tool to access and exchange information worldwide”. introduced in 1997. With the availability of upgraded modems
It also laid down its mission to endeavour towards facilitating and access technologies, we gradually began seeing faster access
a reduction in the cost of inputs, wherever possible, to make speeds. The rolling out of networks using Third Generation
Internet services most afordable and strive towards improving (3G) and Broadband Wireless Access (BWA) spectrum,
the quality of Internet services being ofered to consumers. It which started in the year 2011-2012, proved to be a pivotal
was also around that time that the Government decided to set moment in the proliferation of wireless Internet connectivity.
up of the National Task Force on Information Technology and Today, wireless services far exceed the number of ixed line
Software Development, whose terms of reference included connections.
suggesting measures for achieving a massive expansion in
the use of the Internet by all sections of society, especially in
business and education, and development of Indian content on
the Internet.9
6) Ravi, Shamika and Darrell M. West, Spectrum policy in India, August 2015. 9) Notification on appointment of a National Task Force on Information Technology and Software Development, Prime Minister’s Office, 22 May,
7) EY, Inside Telecommunications in India, 2014. 1998.
8) Wolcott, Peter, The provision of Internet services in India, 2005. 14TABLE 2.2: MODE OF WIRED INTERNET ACCESS* TABLE 2.3: MODE OF MOBILE WIRELESS INTERNET ACCESS* TABLE 2.4: MODE OF FIXED WIRELESS INTERNET ACCESS*
Total wired Internet subscribers: 21,510 Mobile wireless Internet subscribers: 369,400 Fixed wireless Internet subscribers: 611
DSL -13,330 GPRS/EDGE – 152,000 Wi-Fi - 546
Dial-up - 3,210 HSPA/WCDMA -127,980 Radio - 35
Ethernet/LAN - 3,050 LTE – 86,750 FW/LTE - 16
Cable modem - 1,490 EVDO/CDMA – 1,560 Wi-Max - 9
Fiber - 350 HSIA -1080 V-Sat - 5
Leased line - 80 CDMA 1X- 30
*
Figures in thousands
Until about 2011 the provision of Internet and broadband included in the revised deinition of broadband services, as
services in the country continued to be predominantly through notiied by the Government.
Digital Subscriber Line (DSL) technologies over copper wires,
which were limited in number and geographical spread. Other The decision on how to deine broadband services has not been
access technologies have seen some growth since then but without its share of controversy- given that India lags behind
the wired access market still continues to be dominated by many of its global counterparts on this count. The NTP, 2012
DSL. As of December 31st, 2016 there were 13.33 million speciically mentioned revising minimum download speeds to
DSL subscribers in India as compared to only 0.35 million 2 Megabits per second (Mbps) by the year 2015 and making
subscribers accessing the Internet through iber technology. available high speeds of at least 100 Mbps on demand. In
While iber infrastructure is expensive to set up, the speeds September, 2014 the Authority recognised these benchmarks
ofered by it are unmatched by any of the other mediums. to be appropriate for India, however, the 512 Kbps continues
With this in mind, the Government has taken strong initiatives to be in use. Anything below this benchmark is classiied as
towards building optic iber infrastructure in remote areas of narrowband. Elsewhere in the world, broadband is being
the country through the BharatNet project, which is talked deined at much higher speeds- in 2015 the US for example
about in more detail in subsequent sections of the report. changed its benchmark speeds from 4Mbps to 25Mbps for
downloading.
The availability of faster Internet speeds also led to a
rethinking of the deinition of “broadband” services. Initially, As per the revised deinition of broadband services that was
Internet speeds of more than 256 Kbps were classiied as adopted in 2013, the total broadband subscriber base of the
broadband services. This igure was revised in the inancial year country at that point of time was 60.87 million vis-a-vis 15.05
2013-14 when the minimum download speed for broadband million in the previous year (based on the pre-revised deinition
services was increased to 512 Kbps. It was in the same year of 256 Kbps). We now have 391.50 million internet subscribers
that information relating to wireless data services started being in the country as reported by 149 ISPs as on December, 2016.
FIGURE 2.8: TOTAL INTERNET SUBSCRIBERS
BROADBAND NARROWBAND TOTAL (MILLION)
236.1 155.4
391.5
BROADBAND : 217.4
NARROWBAND : 152
TOTAL : 369.4 MILLION
BROADBAND : 18.1
NARROWBAND : 3.4
TOTAL : 21.5 MILLION
BROADBAND : 0.6
NARROWBAND : 0.02
TOTAL : 0.6 MILLION
WIRED SUBSCRIBERS MOBILE DEVICES SUBSCRIBERS FIXED WIRELESS SUBSCRIBERS
(PHONES AND DONGLES) (WI-FI, WI-MAX, POINT-TO POINT RADIO & VSAT)
Source : As per TRAI records
15Internet data usage has also been on the rise since 2013. This mainly on account of the entry of a new player - the average
has corresponded with the decline in data tarif and the inverse usage increased from 239MB per month in September, 2016
relationship between the two is explained in the graph below. (igure 2.9) to 884 MB per month in the next quarter. The cost
For GSM service, while the data tarif has gone down from strategy of the new entrant has led the competitors to revisit
Rs. 0.29 per MB to Rs. 0.16 per MB from December 2013 to the drawing boards and introduce newer cheaper plans in
2016, the monthly data usage per subscriber during the same order to compete with it. These new strategies are likely to lead
period has increased from 50MB a month to 884MB a month. to a greater reduction in tarif and increase in data usage for
The huge jump in data usage from June 2016 onwards was the subsequent quarters.
FIGURE 2.9: DATA TARIFF AND USAGE TRENDS: FOR GSM SERVICE
MONTHLY DATA TARIFF (Rs/MB) MONTHLY DATA USAGE (MBs)
235.91
0.35 240
MONTHLY DATA USAGE (MBs)
0.3 0.29 180
MONTHLY DATA TARIFF (Rs/MB)
0.25 120
0.2 60
50.7
0.18
0.15 0
DEC 2013 JUN 2014 DEC 2014 JUN 2015 DEC 2015 JUN 2016
MAR 2014 SEP 2014 MAR 2015 SEP 2015 MAR 2016 SEPT 2016
YEAR & QUARTER
Source : As per TRAI records
Despite the many leaps that have been made in terms of million were based in urban areas while 115.06 were in rural
providing greater and better quality Internet connectivity areas. The diference is even more stark if we take into account
to users in the country, there still remains a large part of the rural-urban divide among the subscribers of broadband
the population that is unconnected to the online ecosystem, Internet, which had 189.44 million urban subscribers as
particularly in rural areas. Out of a total Internet subscriber compared to only 46.65 million rural ones.
base of 391.5 million at the end of December, 2016, 276.44
16TABLE 2.5: BREAK UP OF RURAL-URBAN INTERNET SUBSCRIBER BASE [IN MILLIONS]
Telecom Service Area Narrowband Broadband Total (Dec 2016) Total (Sep 2016)
Rural Urban Rural Urban Rural Urban Rural Urban
Andhra Pradesh 4.99 6.64 4.67 13.85 9.66 20.49 9.68 17.78
Assam 2.34 0.85 1.19 3.07 3.53 3.92 3.82 3.43
Bihar 6.99 5.77 2.63 7.40 9.61 13.17 9.46 11.67
Delhi 0.32 6.45 0.38 17.90 0.70 24.35 0.67 21.59
Gujarat 3.57 5.25 3.05 12.53 6.62 17.78 6.94 16.23
Haryana 1.42 1.61 1.78 3.77 3.20 5.39 3.40 4.90
Himachal Pradesh 0.91 0.63 0.75 1.13 1.67 1.76 1.86 1.42
Jammu & Kashmir 0.59 0.59 0.44 1.39 1.03 1.99 0.68 1.10
Karnataka 3.05 5.10 2.27 15.06 5.32 20.16 5.68 18.29
Kerala 2.08 2.61 3.78 7.68 5.86 10.29 6.54 9.73
Kolkata 0.16 3.46 0.33 7.08 0.48 10.53 0.49 9.63
Madhya Pradesh 4.98 5.14 2.06 11.31 7.03 16.46 6.84 15.40
Maharashtra 5.48 7.07 4.77 15.29 10.25 22.35 10.30 20.33
Mumbai 0.16 5.13 0.17 13.04 0.33 18.17 0.32 16.25
North East 1.20 0.76 0.84 1.67 2.04 2.43 2.18 2.15
Orissa 2.67 1.73 0.78 4.37 3.45 6.10 3.88 5.17
Punjab 2.47 3.37 1.67 7.85 4.14 11.22 4.64 10.08
Rajasthan 4.77 4.86 2.30 7.61 7.07 12.47 7.52 10.83
Tamil Nadu 3.26 7.68 4.02 15.76 7.28 23.44 6.97 22.21
UP (East) 8.26 5.90 3.32 8.25 11.59 14.15 12.32 12.18
UP (West) 4.74 4.67 1.88 6.95 6.62 11.62 6.75 10.21
West Bengal 4.02 1.76 3.57 6.47 7.59 8.22 8.83 7.12
68.40 87.01 46.65 189.44 115.06 276.44 119.79 247.69
Total 155.41 236.09 391.50 367.48
Competitiveness and growth
The liberalisation of the ISP regime in 1998, with no license fee, entry fee and liberal roll out obligations and no cap on the
number of ISPs in a license area, encouraged private participation. More than 700 licenses were issued within the irst three years
of opening the sector. As of December, 2016, the top ten service providers together hold 98.09 percent of total Internet subscriber
base.10
Both the public as well as the private sector have made signiicant contributions to the growth of the Internet services sector. The
key diference however has been that the growth of the private sector has been concentrated in the wireless segment, while public
provider BSNL still holds 61.13 per cent of the wireline market share with 13.15 million wireline Internet subscribers.
10) As per reports received from 149 operators.
17TABLE 2.6: INTERNET SUBSCRIBER BASE AND MARKET SHARE OF TOP 10 SERVICE PROVIDERS (AS OF DEC'16)
ISP No. of subscribers (in millions) Share (%)
Bharti Airtel Limited 84.83 21.67
Reliance Jio 72.15 18.43
Vodafone 65.05 16.62
Idea Cellular 48.60 12.41
BSNL 32.89 8.40
Reliance Communications 32.08 8.20
Aircel Ltd 18.16 4.64
Tata Teleservices 14.77 3.77
Telenor 13.46 3.44
MTNL 1.99 0.51
Total of Top 10 ISPs 384.02 98.09
Others 7.48 1.91
Grand Total 391.50 100
As per TRAI records
Trends in broadcasting and cable services
Genesis of the sector
Broadcasting refers to a mass communication medium used for the distribution of audio and video signals to a dispersed set of
users. Radio broadcasting commenced in India in the 1920s, with the setting up of amateur radio clubs. This was followed by
the incorporation of the Indian Broadcasting Company in 1927, which later went on to become AIR. The sector was taken over
by the Government in 1936 and remained a public monopoly till 2000, when FM broadcasting sector was opened up for private
participation. AIR today has a network of 143 medium wave (MW), 48 short wave (SW), 421 FM transmitters and about 30 digital
transmitters. As on date, apart from AIR, 273 private FM channels are operating in the country in 84 cities by 33 private FM radio
broadcasters. Also about 201 Community Radio Stations (CRSs) are being operated by community based organisations including
universities. CRSs serve as an important instrument for local empowerment and development, helping focus on the day to day
concerns of its audience and their speciic information needs.
FIGURE 2.10
BROADCASTING &
CABLE SERVICES Television
899 PRIVATE SATELLITE TV CHANNELS
281 PAY TV CHANNELS
30 DOORDARSHAN CHANNELS
Radio
273 PRIVATE FM STATIONS
201 COMMUNITY RADIO STATIONS
418 ALL INDIA RADIO STATIONS
Source: As per TRAI records
18You can also read