PANAMA - International Monetary Fund
←
→
Page content transcription
If your browser does not render page correctly, please read the page content below

IMF Country Report No. 20/125

             PANAMA
             SELECTED ISSUES
April 2020
             This paper on Panama was prepared by a staff team of the International Monetary Fund
             as background documentation for the periodic consultation with the member country. It
             is based on the information available at the time it was completed on March 9, 2020.

                              Copies of this report are available to the public from

                               International Monetary Fund • Publication Services
                                     PO Box 92780 • Washington, D.C. 20090
                                Telephone: (202) 623-7430 • Fax: (202) 623-7201
                             E-mail: publications@imf.org Web: http://www.imf.org
                                          Price: $18.00 per printed copy

                                     International Monetary Fund
                                           Washington, D.C.

             © 2020 International Monetary Fund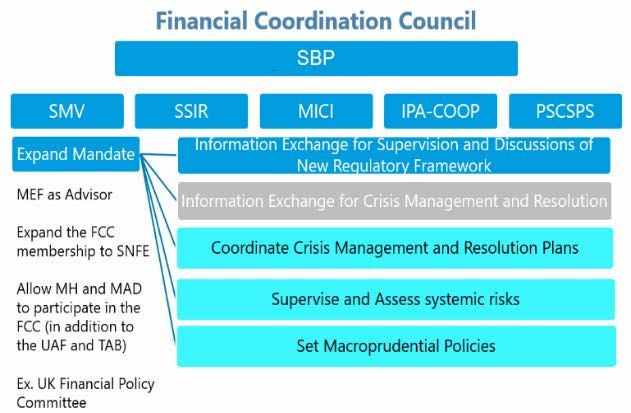
PANAMA
                SELECTED ISSUES
March 9, 2020

                Approved By                   Prepared By Paola Aliperti F. Domingues, Olga Bespalova,
                Western Hemisphere            Julian Chow, Julia Faltermeier, and Marina Rousset (all
                Department                    WHD)

                CONTENTS
                FISCAL POLICY IN PANAMA: BACKGROUND, CHALLENGES AND POLICY OPTIONS_ 5
                A. Background ____________________________________________________________________________ 5
                B. Revenue Measures _____________________________________________________________________ 7
                C. Expenditure Measures ________________________________________________________________ 10
                D. Strengthening of the Fiscal Framework _______________________________________________ 12
                E. Concluding Remarks __________________________________________________________________ 14

                FIGURES
                1. Higher Deficit Increased Public Debt ___________________________________________________ 5
                2. Composition of Tax Revenue and Expenditure _________________________________________ 7
                3. Efficiency of Education Spending is Low Compared to the Region ____________________ 11

                TABLES
                1. Tax Expenditure ________________________________________________________________________ 8
                2. Central Government Fiscal Operations, 2015–19 ______________________________________ 16
                3. Non-financial Public Sector Fiscal Operations, 2015–19 _______________________________ 17

                References _______________________________________________________________________________ 18

                AML/CFT ISSUES IN PANAMA: BACKGROUND AND POLICIES ______________________ 19
                A. Background ___________________________________________________________________________ 19
                B. Recent Developments _________________________________________________________________ 20
                C. Policy Priorities________________________________________________________________________ 23
                D. Conclusions ___________________________________________________________________________ 25
PANAMA
FIGURE
1. Reporting of Suspicious Activity and FATF Compliance _______________________________ 21
References _______________________________________________________________________________ 26
TOWARDS A MORE RESILIENT FINANCIAL SECTOR __________________________________27
A. Overview of the Financial System and Recent Trends _________________________________ 27
B. Improve Financial Stability Oversight and Prudential Framework _____________________ 29
C. Develop Financial Sector Safety Nets and Improve Bank Resolution __________________ 36
D. Enhance Regulatory Framework and Coordination ___________________________________ 38
E. Conclusions: Key Recommendations __________________________________________________ 41
FIGURE
1. Monitoring of the Housing Prices and Construction Activity __________________________ 31
TABLES
1. Capital Adequacy Ratios in Percent of Risk-Weighted Assets (RWA) __________________ 32
2. Implementation of the Main Elements of the Basel III Package in Panama ____________ 33
ANNEX
1. Recent Developments _________________________________________________________________ 42
References _______________________________________________________________________________ 44
MACROPRUDENTIAL POLICY IN PANAMA: IMPLICATIONS FOR THE REAL ESTATE
MARKET ________________________________________________________________________________46
A. Introduction __________________________________________________________________________ 46
B. How Have Property Prices, Mortgage Lending, and Household Debt Evolved
Recently? ________________________________________________________________________________ 47
C. Are Residential Real Estate Prices Showing Signs of "Overheating"? __________________ 49
D. Have There Been Changes in Bank Mortgage Lending Policies? _______________________ 51
E. What Are the Macroprudential Measures to Mitigate Housing Risks? _________________ 53
F. Conclusion and Policy Implications ____________________________________________________ 57
BOXES
1. Sectoral Capital Requirements with Effect from July 1, 2016 __________________________ 53
2. Macroprudential Instruments to Mitigate Risks in the Household Sector and
Indicators to Identify When to Tighten __________________________________________________ 54
2 INTERNATIONAL MONETARY FUNDPANAMA
FIGURES
1. Household Mortgage Debt Indicators_________________________________________________ 47
2. Real Estate Indicators _________________________________________________________________ 48
3. Economic Growth and Commercial Banks’ Lending Rates _____________________________ 50
4. Contribution of Explanatory Variables and Commercial Banks’s Mortgage
Lending Rates_____________________________________________________________________________ 52
5. Limits on LTV and DSTI Ratios and Number of Countries at Each Range, 2014 ________ 55
6. Transmission Mechanism of Three Sectoral Macroprudential Instruments ____________ 56
ANNEXES
I. When Do Real Estate Prices Depart from "Fundamentals"? ____________________________ 59
II. Model: Residential Real Estate Price-to-Income _______________________________________ 60
III. Model: Growth in Residential Mortgage Lending _____________________________________ 63
References _______________________________________________________________________________ 65
STRUCTURAL POLICIES IN PANAMA: BACKGROUND AND POLICY
RECOMMENDATIONS __________________________________________________________________66
A. Drivers of Growth: High Investment, but Slowing Productivity ________________________ 66
B. Growing Capital with a Favorable Business Environment ______________________________ 68
C. Increasing Human Capital and the Availability of Skilled Labor _______________________ 71
D. Boost Productivity with Higher Innovative Capacity___________________________________ 72
E. Upgrading Infrastructure ______________________________________________________________ 72
F. Concluding Remarks __________________________________________________________________ 76
FIGURES
1. Growth Accounting ___________________________________________________________________ 66
2. Labor Allocation Across Sectors _______________________________________________________ 67
3. Competitiveness Indicators Show Some Room for Improvement _____________________ 68
4. Global Competitiveness Index _________________________________________________________ 69
References _______________________________________________________________________________ 77
SOCIAL ISSUES IN PANAMA: BACKGROUND AND POLICIES_________________________78
A. Background ___________________________________________________________________________ 78
B. Policy Priorities ________________________________________________________________________ 79
C. Poverty in the Comarcas ______________________________________________________________ 81
D. Social Support Programs _____________________________________________________________ 82
E. Gender Equality _______________________________________________________________________ 82
F. Climate Change _______________________________________________________________________ 84
G. Conclusions ___________________________________________________________________________ 86
INTERNATIONAL MONETARY FUND 3PANAMA
BOX
1. President Cortizo’s Commitments to Advance Social Policies _________________________ 79
FIGURES
1. A High-Income Economy that Lags Regional Peers in Human Development __________ 78
2. Education Spending and Outcomes in Panama are Low Compared to Peers __________ 80
3. Poverty Reduction in Indigenous Territories Is Well Behind the Rest of the Country __ 81
4. Economic and Social Opportunities for Women are Limited Compared to Peers ______ 83
5. Fresh Water Is Becoming Scarce Despite Generous Endowment ______________________ 86
References _______________________________________________________________________________ 87
4 INTERNATIONAL MONETARY FUNDPANAMA
FISCAL POLICY IN PANAMA: BACKGROUND,
CHALLENGES AND POLICY OPTIONS1
A. Background
1. Fiscal policy remains the main instrument for economic management in Panama. As a
fully dollarized economy with an open capital account, no central bank, no independent monetary
policy and little use of macroprudential tools, fiscal policy is de facto the only macroeconomic
stabilization tool available. At the same time, fiscal policy is restricted by a fiscal rule, the Social
Fiscal Responsibility Law (SFRL), anchored at an indicative target of net debt to GDP ratio of 40
percent which is operationalized through a limit on the deficit of the non-financial public sector
(NFPS). While the rule introduced in 2009 has supported fiscal discipline and reduced debt, it can be
prone to unintended pro-cyclicality of fiscal policy.
2. The 2019 shortfall in fiscal revenue poses challenges to a government which collects
already little revenue relative to other emerging economies. Tax revenue amounted to
9½ percent of GDP on average between 2014 and 2018, significantly lower than the average for
Central America and Latin America peers, at 15 percent and 17½ percent, respectively. In 2019, tax
revenue plummeted to 8.2 percent of GDP following the economic slowdown, but also for structural
reasons as some of the most dynamic sectors face lower tax burdens. Although non–tax revenue
makes up for some of the low tax efforts (Table 3), it also declined. Only the canal contributions (toll
fees and dividends) continued to grow, reaching 2.6 percent of GDP, and this is due to the
expansion of the Panama Canal in 2016.
Figure 1. Panama: Higher Deficit Increased Public Debt
Fiscal Impulse 1/ Public Debt
(In percent of GDP) (In percent of GDP)
2.0 70
Fiscal impulse Output gap External
1.5 60
Internal
50 Public debt (NFPS)
1.0
40
0.5
30
0.0
20
-0.5 10
-1.0 0
2012 2013 2014 2015 2016 2017 2018 2019 2005 2007 2009 2011 2013 2015 2017 2019
Source: National authorities, IMF staff calculations.
1/Fiscal impulse is calculated as the change in the cyclically-adjusted primary balance of the NFPS; positive means fiscal loosening.
1
Prepared by Julia Faltermeier (WHD).
INTERNATIONAL MONETARY FUND 5PANAMA
3. Despite the unexpected deterioration of the fiscal position in 2019, the authorities
stabilized the deficit at 3.1 percent of GDP
in 2019. To avoid an abrupt tightening, the Comparison of Tax Rates 1/
authorities amended the SFRL in October CIT PIT VAT
2019 establishing new ceilings for the deficit Central America 30 30 13
of the NFPS. 2 Although the revision would Latin America 25 33 16
have permitted a deficit of up to 3.5 percent OECD 24 40 19
of GDP, the authorities managed to stay Panama 25 25 7
below the ceiling. The law foresees a gradual Singapore 17 20 7
tightening starting from a deficit of 2.75 Hong Kong 17 15 0
percent of GDP in 2020, 2.5 percent in 2021 Source: Global KPMG Tax Rates Database (GKTR)
1/ Average for CA, LAC and OECD comparators; latest available (mostly 2015).
and 2.0 percent from 2022 onwards.
4. The fiscal framework has been key to entrenching fiscal discipline and maintaining
debt sustainability. The overall deficit of the non-financial public sector (NPFS) averaged
2½ percent of GDP during the last 5 years. At times, the rule led the authorities to prioritize fiscal
prudence over economic stabilization, leading to unintended pro–cyclicality of fiscal policy. For
example, the fiscal stance in 2019 ended broadly neutral despite a significant negative output gap
and the modification of the deficit ceiling. But fiscal prudence has also helped to keep debt levels at
historical lows. Since the introduction of the rule in 2009 until 2018, gross debt of the NFPS
remained well below 40 percent of GDP. To prevent losing the fiscal track record built over the last
decade in light of the frequent revisions to the rule and the latest increase of gross debt to 40.8
percent of GDP in 2019, the fiscal framework needs to be strengthened further.
5. Despite recent fiscal deficits, Panama continues to enjoy access to international
capitals markets at record-low spreads. Since attaining investment grade status in 2010, Panama
has tapped international capital markets at relatively low costs. Sovereign spreads (EMBIG of
114 basis points in December 2019) are among the lowest in Latin America, supported by strong
economic fundamentals and the solid fiscal framework. In April 2019, the authorities issued
US$1.0 billion Treasury Notes under Panamanian law linked to Euroclear giving access to
international buyers which achieved a spread of 140 basis points at a 7-year maturity. Most recently
(end-November 2019), the authorities issued US$1.3 billion in Global Bonds at historically low rates,
a 2030 bond and a 2053 bond at spreads of only 105 and 135 basis points relative to the respective
U.S. instruments. However, a revision to negative outlook in February 2020 by Fitch Ratings citing
downside risks amid rising public debt highlights the importance of fiscal prudence.
2 The previous administration modified and simplified the SFRL in October 2018, simplified the rule and set the NFPS
deficit at 2 percent of GDP in 2018-19, 1¾ percent in 2020-21, and 1½ percent of GDP after 2021, with the target
over the medium-term broadly in line with the limit under the previous law. Congress also approved an adjustment
of the accrual rules for the accumulation of savings into Panama’s Sovereign Wealth Fund (FAP), specifically to saving
half of the excess Canal contribution (over the threshold of 2½ percent of GDP) to the budget.
6 INTERNATIONAL MONETARY FUNDPANAMA
Figure 2. Panama: Composition of Tax Revenue and Expenditure
Expenditure 1/ Revenue 2/
(In percent of GDP) (In percent of GDP)
30 Current primary spending Accrued spending 20
Direct tax revenue Indirect tax revenue
25 Capital spending Interest Non-tax revenue Canal transfers
16
20
12
15
8
10
4
5
0 0
2013 2014 2015 2016 2017 2018 2019 2013 2014 2015 2016 2017 2018 2019
Sources: National Authorities and IMF staff calculations.
1/ Covers the Non-financial Public Sector following the national definition, accrued spending is staff’s adjustment to account for accrual of
previously unrecorded expenditure.
2/ Data refer to the Central Government.
B. Revenue Measures
6. Low tax revenue limits space for financing development. Panama reached high-income
status in 2018 (according to the World Bank) but economic development also requires that other
socio-economic indicators improve. Public finances play a central role in ensuring the availability of
sufficient financial flows to invest in continued development – such as infrastructure, health and
education - and to foster social inclusion. To permit the state to provide public services appropriate
for Panama’s income level, revenue levels will have to increase. As levels of non-tax revenue, mainly
from the canal, grow at a slower rate than national GDP, the bulk of the additional revenue will need
to come from taxes. 3
7. Low tax revenue reflects weaknesses in tax policy and administration. The tax system
plays an important role in determining the relative attractiveness of Panama for investors. The
authorities want to explore tax and customs administration as a first avenue to increase tax revenue
due to serious structural weaknesses in this area. Main areas of concern include governance, internal
controls (and vulnerabilities to corruption), IT infrastructure, information and risk management,
auditing capacity, and the tax compliance program. Some measures, like the electronic invoicing,
which is currently being tested in a pilot, are promising, but wider reforms will be needed. These
could include a strengthening of the management of large taxpayers, improving customs controls
and enforcing tax arrears collection instead of relying on frequent tax amnesties.
8. Tax policy reform should be considered at some point. If the cyclical recovery together
with tax administration reform does not yield sufficient revenue, a comprehensive reform of the tax
system should be an option. The last reform was done in 2009–14. A previous IMF study found that
the efforts improved the progressivity of the tax system, but nonetheless fell short of their
3
The Canal transfers to the central government are expected to decline as a percent of GDP as the Panamanian
economy is projected to grow at a faster rate than world trade.
INTERNATIONAL MONETARY FUND 7PANAMA
objectives. 4 Future reforms should rely on a mix of curbed tax exemptions (especially VAT, CIT),
increased compliance with tax obligations (especially for VAT, CIT, PIT) and possibly some increases
in tax rates (including VAT and environmental taxes).
Table 1. Panama: Tax Expenditure
Tax Expenditure as a share of GDP
Income taxes Tax expenditure
Country Year Total VAT
CIT PIT C+P Others % of tax revenue
Bolivia 2015 1.5 1.2 0.1 0.0 0.1 0.2 6.9
Argentina 2019 2.3 1.2 0.3 0.1 0.4 0.7 10.2
Peru 2017 2.2 1.7 0.2 0.1 0.3 0.2 15.6
Paraguay 2014 1.9 1.4 0.2 0.1 0.4 0.2 14.8
El Salvador 2014 2.8 1.6 … … 1.2 0.0 17.4
Brazil 2016 4.2 0.4 0.7 0.2 0.9 2.9 17.6
Mexico 2017 3.2 1.4 0.5 1.0 1.5 0.3 21.3
Guatemala 2016 2.3 1.4 … … 0.0 0.9 21.7
Chile 2016 4.2 0.6 … … 3.5 0.0 22.2
Uruguay 2017 6.3 3.0 1.4 0.5 1.9 1.4 33.2
Honduras 2016 6.2 3.3 2.0 0.4 2.4 0.5 33.5
Panama 2016 3.6 2.3 1.3 … 1.3 0.0 34.3
Costa Rica 2016 5.3 2.9 … … 0.0 2.5 33.6
Ecuador 2017 4.7 2.3 1.3 0.7 2.0 0.4 34.5
Nicaragua 2014 5.6 4.5 0.8 … 0.8 0.3 32.9
Dominican Rep. 2017 6.4 3.0 0.7 0.1 0.8 2.6 46.7
Average 3.9 2.0 0.8 0.3 1.1 0.8 24.8
Source: Country tax administrations and Ministries of Finance.
9. Tax expenditure is relatively high compared to the region. In 2016, tax expenditure
accounted for around 3.6 percent of GDP or about ⅓ of total tax revenue collection. The share of
revenue is above the regional average of ¼. VAT accounted for most of the tax expenditure.
Reviewing and streamlining the system of tax exemptions will help tax administration by simplifying
collection, curb tax expenditures that are inadequately targeted and help to reverse the downward
trend in revenue even without raising tax rates.
10. Revenue from VAT is one of the lowest in Latin America and the Caribbean (LAC).
Panama raised on average 2.5 percent of GDP through VAT receipts in the past five years while the
averages for LAC and OECD economies are 6.3 and 6.7 percent of GDP respectively. The low revenue
stems from a combination of low rates, many exemptions and evasion. The OECD estimates that
Panama only collects 62 percent of the VAT’s potential revenue. 5 Staff estimates that measures to
limit VAT tax expenditure and the inclusion of services provided from abroad in the tax base could
increase revenue by about ½ percent of GDP.
4
Vtyurina (2013), “Panama: Taking Stock of a Decade of Tax Reforms”, IMF, Selected Issues Paper 2013,
5 Potential VAT revenue is estimated by applying the generalized VAT tax rate on final consumption.
8 INTERNATIONAL MONETARY FUNDPANAMA
11. Corporate tax rates are on par with LAC and advanced economy counterparts but are
among the lowest in Central America. The tax system is based on a territorial principle, rates are
relatively low, and exemptions and incentives are widespread (granted under a variety of schemes).
Compared to Singapore with a similar business model, however, CIT tax rates in Panama are higher.
Nevertheless, Singapore reached tax revenues of 14.1 percent of GDP in 2017, well above Panama’s
9.4 percent of GDP. A cost-benefit analysis can reveal if tax incentives achieve the desired outcomes.
Moreover, regular checks need to ensure that firms comply with the conditions of exemptions.
12. Reviewing environmental tax rates can yield additional revenue while helping Panama
to reach its climate commitments. For example, the selling price of gasoline and diesel in Panama
is lower than the region. A gradual increase in taxes on the consumption of petrol would give
households and firms time to adapt and incentivize the investment in energy-efficient machinery
and vehicles. Moreover, environmental taxes should be combined with social spending that limits
the negative impact on the consumption of petrol for poorer households.
Policy Options
• Upgrade governance, institutional capacity and human capital of the tax and customs
administration to increase revenue collection
• Strengthen compliance with tax obligations
• Re-establish a Large Taxpayer Unit to better manage large taxpayers
• Improve provision of public services, transparency and accountability to strengthen citizens’
willingness to pay taxes.
• Undertake a cost-benefit analysis of tax exemptions and incentives.
• Review tax rates, especially for VAT and environmental taxes.
13. The fiscal contribution of the new copper mine will be small. The government granted
the concessions to Minera Panama through a special legislation, Law No. 9 of 1997, which was
declared unconstitutional by the supreme court in late 2018. The uncertainty relating to the legality
of the large copper mine’s contract is still unresolved, but production has started as planned in mid-
2019. However, given that copper production will become a significant contributor to the economy,
it will be important to eliminate the uncertainty by reaching an agreement on this issue. 6 A survey
documented in Mitchell (2009) suggests that tax considerations are key to attracting and retaining
6 Under the special contract with the government, Minera Panama must pay 2 percent royalty on the “Negotiable
Gross Production”, defined as the gross amount received from the sale (of concentrates) after deduction of all
smelting costs, penalties, transportation costs, insurances and other costs incurred in their transfer from the mine to
the smelter. Also applied are a land rental tax of US$3.00 per hectare per year for the total concession area (less than
US$41 thousand a year), and a corporate income tax of 25 percent on taxable earnings, with exemption for the
period during which the Company has outstanding debt relating to the construction and development of the project
(see NI 43-101 Technical Report 2019).
INTERNATIONAL MONETARY FUND 9PANAMA
investors. At the same time, tax rates in Selected Mineral Taxation Features of Leading Copper Producers
Panama are low by international standards. CIT (%) Royalty (%) Special allowances/contracts
An estimate based on the IMF’s framework US 35-47 various Yes
for Fiscal Analysis of Resource Industries Brazil 34 2 Yes
DRC 30-40 2 Yes
(FARI) suggests that the Average Effective Australia 30 2.5-5 Yes
Tax Rate (AETR) is 26 percent and falls to Mexico 30 7.5 Yes
2 percent once tax credits and tax holidays Peru 28 various Yes
South Africa 28 0.5-7 No
are considered. 7 With this, Panama’s fiscal
China 25 various Yes
regime for copper mining is relatively Indonesia 25 4 Yes
generous among other copper-producing Panama 25 2 Yes
Chile 24 5-14 No
countries.
Russia 15.5-20 8 No
Source: PWC "Compare mining taxes data tool".
Policy Options
• Take action to remove the uncertainty created by the nullified Law No. 9.
• Develop technical and administrative capacity to understand the complexity of the mining sector
and be able to supervise, monitor and tax the sector.
C. Expenditure Measures
14. Despite fiscal consolidation, the government needs to maintain resources for public
investment and social spending. In 2018, current primary spending (driven by wages and transfers
and subsidies), accounted for 66 percent of total expenditure of the central government, up
10 percentage points from 5 years ago, as the share of capital spending went down to 34 from
44 percent, due to the deceleration of public infrastructure projects. 8 Roughly 2/3 of the higher
wage bill is explained by higher public sector wages, including the increase in teacher salaries
agreed in 2014. 9 The share of interest expense has been roughly stable. As low levels of revenue
combined with the deficit ceiling limit expenditure growth, expenditure should be rebalanced to
give sufficient space in the budget for public investment and social spending.
15. Strengthening the public financial management system can help to reduce current
expenditure. The uncovering of unrecorded arrears linked to unrecorded spending as well as delays
in the payment of subsidies highlight the need to improve budget and expenditure controls.
Moreover, timely payments to suppliers can reduce procurement costs.
7 The Average Effective Tax Rate (AETR) or “government take” is defined as the ratio of cumulative government
revenue to the project’s pre-tax net cumulative cash flows.
8
Capital expenditure by the central government does not include investments of the Panama Canal Authority for the
canal expansion in 2016.
9
The agreement foresaw an increase in monthly teachers’ salaries by US$900 in three rounds. The first two increases
doubled teacher salaries in six years. The third increase of US$300 was announced in December 2019 and will be
applied in 2020. With a median monthly salary of around US$1,200, schoolteacher is one of the highest paid
occupations in 2019, well above the median salary of US$700.
10 INTERNATIONAL MONETARY FUNDPANAMA
Figure 3. Panama: Efficiency of Education Spending is Low Compared to the Region
Teachers and Outcome, Primary 1/
Teachers and Outcome, Secondary 1/
(Latest value available)
110 (Latest value available)
Net Enrollment - Secondary ( in percent)
Net Enrollment - Primary (in percent)
105
100 100
95
80
90
85 60
80 LAC Panama LAC Panama
75 40
70
EMEs OECD 20 EMEs OECD
65
60 0
0 5 10 15 0 5 10 15
Teacher student ratio, primary, per 100 students Teacher student ratio, secondary, per 100 students
Sources: IMF Expenditure Assessment Tool (EAT)
1/ Dash lines are the average of LAC. Latest available data for Panama corresponds to 2017
16. The effectiveness of social and
Composition of Central Government Spending
investment spending needs to be
100%
improved. Even without significant 90%
80%
increases in spending, greater 70%
effectiveness can improve outcomes. To 60%
50%
achieve this, project selection for 40%
30%
investment spending and effective 20%
execution need to be strengthened. 10%
0%
Social spending is often not sufficiently 2004 2007 2010 2013 2016 2019
targeted at the most vulnerable Wages and salaries Pensions and transfers Goods and services
Interest payments Capital
population. For example, in 2019 the
Sources: National Authorities and IMF staff calculations.
government spent around US$218
million (0.3 percent of GDP) on the electricity subsidy introduced in 2009 to prevent price increases
for 99 percent of consumers instead of targeting the measures to more vulnerable members of
society.
17. A new law for private-public partnerships (PPP) was introduced in 2019. The new
administration hopes to leverage additional financing for public infrastructure projects from the
private sector. While some ideas have been collected, no concrete projects have been discussed so
far. PPPs can be useful to access private sector expertise and efficiency, but they also come with
risks. The selection process needs to be transparent, with clear rules on the accounting for risks as
well as the monitoring of the execution of the projects.
INTERNATIONAL MONETARY FUND 11PANAMA
Energy Subsidies by Product 1/
(In percent of GDP, latest value available)
16
14 Petroleum Coal Natural Gas
12 Electricity Latin America EMEs
10 OECD
8
6
4
2
0
Mexico
Suriname
Belize
El Salvador
Argentina
Brazil
Colombia
Chile
Uruguay
Venezuela
Aruba
Guyana
Panama
Guatemala
Bolivia
Costa Rica
Peru
Paraguay
Honduras
Ecuador
Nicaragua
Sources: IMF FAD Expenditure Assessment Tool (EAT), IMF Energy Subsidy estimates.
1/ Daslines are the median for countries in the region. Latest available for Panama corresponds to 2017.
Policy Options
• Undertake an expenditure review (e.g. PIMA for infrastructure governance).
• Strengthen budget and expenditure control.
• Provide rationale for transfers and subsidies and ensure adequate targeting and effectiveness
• Slow down wage growth to create room for social spending and strengthen link between pay
and productivity.
D. Strengthening of the Fiscal Framework
18. The accumulation of fiscal buffers Fiscal Buffers
(In percent of potential GDP)
could help to reduce unintended pro- 0
cyclicality of the fiscal policy under the -0.2
SFRL. Over the medium term, as the debt to -0.4
-0.6
GDP ratio falls and taking advantage of the -0.8
expected sustained period of low global -1
interest rates, this will gradually lower the -1.2
Fiscal buffer
average interest rate of the public debt -1.4
-1.6 Primary balance with buffer
portfolio, interest payments as a percent of
-1.8
Cyclically-adjusted primary balance
GDP are expected to decrease. Instead of -2
widening the primary balance, the 2015 2016 2017 2018 2019 2020 2021 2022 2023 2024 2025
government could save this additional space
Sources: IMF staff calculations
as fiscal buffers under a self-imposed “shadow fiscal rule”. This space could be used for fiscal
stimulus in cyclical downturns while always keeping the deficit within the ceiling. In practice, this
would mean a fiscal policy that maintains the
12 INTERNATIONAL MONETARY FUNDPANAMA
primary balance of the NFPS at -0.15 percent of GDP after 2022. By 2025, under the baseline
scenario the fiscal buffer could reach a ¼ percent of GDP and will continue to grow. However, since
the shadow fiscal rule would not override the SFRL, its successful implementation requires political
commitment and effective communication of the rule to the public.
19. Early appointment of the members of the fiscal council can enhance transparency and
credibility of fiscal policy. The recent amendments to simplify the fiscal framework and make it
more transparent and the approval of the law creating an independent Fiscal Council (FC) are
encouraging. The FC will comprise three independent professionals, with experience in public
finance, or macroeconomics. Members will be appointed by the government on a 7–year term.
Supported by a technical secretariat in the Ministry of Economy and Finance, the FC will evaluate
macro-fiscal policy, and issue a non-binding opinion, according to the areas of its mandate. 10 Its
assessment should include fiscal plans and performance, the evaluation of macroeconomic and
budgetary forecasts and the FC should ensure that the medium-term fiscal framework facilitates
compliance with the SFRL. The FC is expected to promote public awareness and stimulate debate on
macro-fiscal issues. Moreover, as part of its assessment, the FC could estimate the cyclically adjusted
deficit to facilitate decision-making on the accumulation or use of fiscal buffers.
Policy Options
• Appoint the members of the Fiscal Council and provide adequate resources.
• Avoid further changes to the SFRL to protect the credibility of the fiscal framework.
• Fortify the accountability framework and enforcement mechanisms for the SFRL.
• Reduce fiscal policy pro–cyclicality, for example by accumulating buffers under a shadow fiscal
rule.
20. Fiscal reporting and transparency continue to be hampered by the use of turnkey
projects and the limited coverage of the national NFPS definition. While there is room to
improve the quality and timeliness of fiscal accounts, the use of turnkey contracts, which is unusual
given Panama’s income and also in comparison with the rest of the region, complicates fiscal
statistical reporting. Under this model, contractors are responsible for obtaining project financing
and expenditures are recognized in the fiscal accounts only when payment is made upon
completion of work. In effect, it permits the separation of the timing of construction, the recognition
of the corresponding liability, and the recording of expenditure in the public accounts. The deferred
recognition of capital expenditure undermines the transparency of fiscal commitments and accurate
assessment of fiscal policy. Moreover, it is not clear why the model continues to be used given the
government’s ample market access at favorable conditions. Another issue is the institutional
10 If the government does not adopt the FC’s advice it has to issue an explanation for not doing so.
INTERNATIONAL MONETARY FUND 13PANAMA coverage of the non–financial public sector, which is limited in scope 11, and as such assessing the true fiscal position is a challenge 12. While the public enterprises outside the definition of NFPS have strong fundamentals and strong credit ratings, the authorities could be assessing the fiscal risks. Efforts are ongoing by CAPTAC to assist with some of these issues. Policy Options • Adopt best practices on accounting methods. • Review and phase out the use of turnkey contracts. • Prepare consolidated accounts of the NFPS according to international standards (GFSM 2014). 21. Analysis and management of fiscal risks. Better analysis of fiscal risks to which Panama is exposed can help ensure a solid fiscal position. Sources of fiscal risks in Panama include unfunded pension liabilities, turnkey projects, contingent liabilities of public companies, extreme weather events (El Nino) and the sizable financial sector. An actuarial assessment of the public pension system suggests that, without parametric reforms, the system is projected to deplete its reserves by 2035 (See IMF Country Report No. 16/337). 13 A comprehensive assessment of all contingent liabilities of the consolidated public sector is therefore needed to ensure adequate support for fiscal policy’s exclusive stabilization role in the absence of monetary and macroprudential policies. Policy Options • Enhance capacity to analyze and mitigate fiscal risks. • Prepare and regularly publish a fiscal risks report. • Reforms the public pension system. E. Concluding Remarks 22. Panama stands at a crossroad between taking the leap to become an advanced economy or getting stuck in the middle-income trap. While Panama crossed the World Bank’s high-income threshold in terms of GDP in 2018 following its exceptional growth in the last decades, socio-economic indicators that set apart advanced economies have not kept up with the economic 11 According to national definition, three public enterprises are not part of the NFPS. They include the Tocumen International Airport, ETESA (an electricity distribution company), and ENA (the National Highway company). The accounts of the Panama Canal are also not consolidated with the government accounts. 12The authorities are mandated by law to report deferred payment schemes (e.g. turnkey projects) in the budget, which has been a challenge in practice. 13This estimate treats the reserves of the two publicly managed defined benefit subsystems in a consolidated manner. The old system (System Exclusivamente Beneficio Definido) has dwindling contributions. Its reserves are estimated to deplete by 2027 and subsequently start generating fiscal pressures. 14 INTERNATIONAL MONETARY FUND
PANAMA

pace. Fiscal policy is at the heart of the needed improvement in the delivery of public services and
investment. Overcoming the challenges posed by low revenue and demands for higher standards of
public services in an environment of slowing growth will be crucial in determining Panama’s path in
the next decade.

23.       The beginning of a new administration provides a window of opportunity to initiate
and implement ambitious reforms. This note takes stock of fiscal issues in Panama and proposes
policy options. The new administration’s fiscal agenda should feature a comprehensive reform of tax
and customs administrations, a review of tax incentives and exemptions and consider steps towards
a broader tax policy reform. A review of the existing framework for mineral taxation should be done
to ensure adequate tax revenue in future projects, while encouraging investment and maintaining
international competitiveness. Important progress in administration reform will be critical to creating
fiscal space to finance productive investment and social spending. Efforts to further strengthen the
fiscal framework with the appointment of the members of the Fiscal Council should continue going
forward. Panama should adopt best practice fiscal accounting and reporting methods. A
comprehensive assessment and management of fiscal risks is necessary to create buffers and
safeguard public finances given fiscal policy’s exclusive stabilization role.

                                                                 INTERNATIONAL MONETARY FUND       15
PANAMA
Table 2. Panama: Central Government Fiscal Operations, 2015–19
(In percent of GDP)
Est.
2015 2016 2017 2018 2019
Revenues and grants 13.4 13.3 13.9 13.8 12.5
Current revenue 13.2 13.3 13.9 13.8 12.5
Taxes 9.3 9.7 9.2 9.2 8.2
Direct taxes 4.8 5.1 4.9 5.1 4.4
Income tax 4.3 4.6 4.4 4.6 4.0
Tax on wealth 0.5 0.5 0.5 0.5 0.4
Indirect taxes 4.5 4.6 4.3 4.1 3.8
Import tax 0.7 0.6 0.6 0.5 0.5
ITBMS 2.4 2.6 2.5 2.3 2.2
Petroleum products 0.4 0.5 0.4 0.4 0.4
Other tax on domestic transactions 0.9 0.9 0.8 0.8 0.8
Nontax revenue 3.9 3.6 4.7 4.6 4.3
Dividends 1.6 1.5 2.3 2.3 2.2
Of which : Panama Canal Authority 1.1 1.2 1.9 1.8 1.8
Panama Canal Authority: fees per ton 1/ 0.7 0.7 0.7 0.8 0.8
Transfers from decentralized agencies 0.5 0.5 0.5 0.5 0.4
Other 1.1 0.9 1.2 1.0 0.9
Capital revenue 0.1 0.1 0.1 0.0 0.0
Grants 0.0 0.0 0.0 0.0 0.0
Total expenditure 17.4 17.5 17.5 17.5 16.7
Current 11.1 10.7 10.9 10.9 11.5
Wages and salaries 4.0 4.3 4.6 4.7 4.8
Goods and services 1.4 1.3 1.3 1.2 1.2
Current expenditure of CSS 0.7 0.5 0.6 0.6 0.7
Transfers to public and private entities 3.2 2.8 2.7 2.7 3.0
Interest 1.7 1.7 1.7 1.8 1.9
Domestic 0.3 0.3 0.4 0.3 0.4
External 1.4 1.4 1.4 1.4 1.5
Capital 6.0 6.5 6.1 5.7 5.2
Accrued spending 2/ 0.3 0.3 0.4 0.8 0.0
Savings 3/ 2.2 2.6 3.0 2.9 1.0
Overall balance 4/ -4.1 -4.1 -3.6 -3.6 -4.1
Sources: Comptroller General; Ministry of Economy and Finance; and IMF staff calculations.
1/ Includes public service fees.
2/ Staff adjustment to account for the accrual of previously unrecorded expenditure for 2015-18.
3/ Current revenues and grants less current expenditure.
4/ For 2015 - 2017, includes spending allowed under Article 34 of Law 38 of 2012.
16 INTERNATIONAL MONETARY FUNDPANAMA
Table 3. Panama: Non-financial Public Sector Fiscal Operations, 2015–19
Est.
2015 2016 2017 2018 2019
Revenues 19.7 20.1 20.0 19.7 18.3
Current revenue 19.6 20.1 20.0 19.7 18.3
Tax revenue 9.3 9.7 9.2 9.2 8.2
Nontax revenue 3.7 3.4 4.5 4.4 4.1
o/w: Panama Canal fees and dividends 1.8 1.8 2.6 2.6 2.6
Social security agency 5.6 5.8 5.7 5.6 5.5
Public enterprises' operating balance 0.2 0.1 0.0 0.0 0.0
Other 2/ 0.7 1.0 0.5 0.5 0.4
Capital revenue 0.1 0.0 0.0 0.0 0.0
Grants 0.0 0.0 0.0 0.0 0.0
Expenditure 22.1 22.1 22.2 22.9 21.4
Current primary expenditure 13.6 13.5 13.6 13.7 14.2
Central government 3/ 8.1 7.9 8.0 8.0 8.3
Rest of the general government 5.5 5.6 5.6 5.6 5.9
Social security agency 5.0 5.1 5.2 5.2 5.4
Decentralized agencies 0.4 0.4 0.4 0.4 0.4
Interest 1.7 1.7 1.7 1.8 1.9
Capital 6.6 6.7 6.5 6.3 5.3
Accrued spending 4/ 0.2 0.2 0.3 1.2 0.0
Overall balance 5/ -2.4 -2.0 -2.2 -3.2 -3.1
Sources: Comptroller General; Ministry of Economy and Finance; and IMF staff calculations.
1/ Official presentation excludes the operations of the ACP as it is not part of the NFPS.
2/ Includes the balances of the nonconsolidated public sector and revenue of the decentralized agencies.
3/ Different from Table 3 as it excludes the transfers to other agencies.
4/ Staff adjustment to account for the accrual of previously unrecorded expenditure for 2015-18.
5/ For 2015 - 2017, includes spending allowed under Article 34 of Law 38 of 2012.
INTERNATIONAL MONETARY FUND 17PANAMA
References
IMF Country Report No. 16/337.
IMF FAD Expenditure Assessment Tool (EAT) – Updated 10/2019.
IMF Framework for Fiscal Analysis of Resource Industries (FARI).
Mitchell, P. (2009): Taxation and Investment Issues in Mining, in Advancing the EITI in the Mining
Sector, A consultation with stakeholders edited by Edited by Christopher Eads, Paul Mitchell and
Francisco Paris.
NI 43-101 Technical Report (2019), Cobre Panamá Project, First Quantum Minerals Ltd.
OECD (2019), Multi-dimensional Review of Panama: Volume 3: From Analysis to Action, OECD
Development Pathways, OECD Publishing, Paris
PWC “Compare mining taxes data tool”.
Vtyurina, S. (2013): “Panama: Taking Stock of a Decade of Tax Reforms”, in Panama Selected Issues,
IMF Country Report No. 13/89, March 2013.
18 INTERNATIONAL MONETARY FUNDPANAMA
AML/CFT ISSUES IN PANAMA: BACKGROUND AND
POLICIES1
The Panamanian authorities made a high-level political commitment to work with the
FATF and GAFILAT to address the shortcomings identified in their evaluation reports and
enhance financial integrity by improving the country’s AML/CFT regime. While significant
progress towards greater compliance with FATF recommendations has been achieved, the
FATF identified important deficiencies in Panama’s AML/CFT regime that remain to be
addressed. Due to these deficiencies, the FATF placed Panama on their grey list
(International Cooperation Review Group, ICRG, monitoring) of jurisdictions with strategic
deficiencies to combat money laundering and terrorist financing following their June
2019 plenary.
A. Background
1. Panama is vulnerable to money laundering (ML) from a number of sources including
drug trafficking and other predicate crimes committed abroad such as fraud, financial and tax
crimes. It is a country with an open, dollarized economy which, as a regional and international
financial and corporate services center, offers a wide range of offshore financial and commercial
services. The Panamanian financial platform has been under scrutiny for some time, with the
criticism intensified following the inclusion of Panama in the grey list of the FATF in June 2014 2, and
the document leak related to the Mossack-Fonseca scandal in April 2016.
2. The authorities made a high-level commitment to enhance Panama’s financial
integrity and strengthen its AML/CFT regime. Panama conducted a national ML/TF risk
assessment in 2016 to identify potential threats, vulnerabilities, and consequences. The results of the
risk assessment were used to prepare the 2017 national AML/CFT strategy, supported by IMF
technical assistance, the National Strategy to Combat Money Laundering, Terrorism Financing and
Weapons of Mass Destruction Proliferation. The authorities closely cooperate with the Financial
Action Task Force of Latin America (GAFILAT) and other relevant international supervisory bodies. 3
3. While no specific cases of terrorist financing (FT) have been identified to date, the
FATF assesses Panama as vulnerable to FT risks. The country is a key transit hub which attracts a
fair share of migratory flows. 4 Panama’s proximity to Colombia heightens FT concerns amid the
1 Prepared by Marina Rousset (WHD) in close collaboration with Francisco Figueroa (LEG).
2 Panama was removed from the grey list in February 2016.
3 Panama served as vice-president of GAFILAT in 2017 and assumed the GAFILAT presidency in 2018. Panama's
financial intelligence unit, Financial Analysis Unit Panama (UAF), is a member of the Egmont Group, which is a united
body of 164 Financial Intelligence Units providing a platform for the secure exchange of expertise and financial
intelligence to combat money laundering and terrorist financing (ML/TF) in accordance with global AML/CFT
standards.
4 According to the UN Refugee Agency, in 2017 more than 8,000 migrants entered Panama illegally.
INTERNATIONAL MONETARY FUND 19PANAMA
recent reactivation of FARC and resurgence of armed conflict in that area. To this end, Panama’s
2017 national strategy recognizes its vulnerability to terrorism financing without the proper
safeguards. For example, the Colon Free Trade Zone (FTZ) is the second largest in the world and
may be exposed to the passage of weapons or dual-use goods in the absence of appropriate
regulations and surveillance mechanisms. The preliminary conclusions of the risk assessment update,
which is currently underway jointly with the World Bank, show FT risks shifting from “low” to
“medium” in Panama, especially in the corporate sector, as transactions of medium and small
companies operating in the FTZ lack adequate onsite supervision.
B. Recent Developments
4. Panama was placed on the FATF’s grey list for monitoring by the ICRG after the June
2019 plenary 5. Due to lack of compliance on 9 out of the 11 immediate outcomes on effectiveness
(details discussed below), the FATF designated Panama as a “jurisdiction with strategic deficiencies”,
placing it under ICRG monitoring until major deficiencies are resolved and reassessed. In response,
the Panamanian authorities adopted an action plan that made commitments to:
• Strengthen their understanding of the national and sectoral ML/TF risks and improve national
policies to mitigate these risks;
• Proactively take action to identify unlicensed money remitters, and ensure effective,
proportionate, and dissuasive sanctions again AML/CFT violations;
• Ensure adequate verification and update of beneficial ownership information, establish an
effective mechanism to monitor the activities of offshore entities, assess existing risks of misuse
of legal arrangements to define and implement specific measures to prevent the misuse of
nominee shareholders and directors, and ensure timely access to adequate and accurate
beneficial ownership information;
• Ensure effective use of its Financial Intelligence Unit (FIU) for ML investigations, demonstrating
their ability to investigate and prosecute ML involving foreign tax crimes and to provide
constructive and timely international cooperation with such offences.
5. Exiting the FATF grey list is macro-critical for Panama. In the absence of policy action,
corresponding bank relationships risk being severed, which in turn would dry up foreign credit and
limit domestic lending, squeezing bank margins and increasing credit risk. This would inevitably
dampen economic activity, with potentially long-lasting negative effects. In addition, the
reputational damage that the new administration may sustain if exiting the grey list protracts
beyond the targeted dates (after the February or June 2021 FATF plenary, as communicated in the
press) can undermine its capacity for reform and weaken its political influence.
5
The FATF grey list includes 18 jurisdictions. Besides Panama, grey-listed countries are Albania, the Bahamas,
Barbados, Botswana, Cambodia, Ghana, Iceland, Jamaica, Mauritius, Mongolia, Myanmar, Nicaragua, Pakistan, Syria,
Uganda, Yemen and Zimbabwe. Two countries – Democratic People’s Republic of Korea and Iran – are classified as
“high-risk jurisdictions” and appear on the FATF’s “blacklist.”
20 INTERNATIONAL MONETARY FUNDPANAMA
6. Panama continues to make progress on technical compliance with the FATF
recommendations. 6 GAFILAT’s latest mutual evaluation report (MER) 7 noted Panama’s progress to
improve its technical compliance by: (i) addressing the deficiencies of technical compliance
identified in 2017; and (ii) implementing new requirements where the FATF recommendations have
changed. The MER recognized the authorities’ continued progress in addressing outstanding
AML/CFT deficiencies and concluded that four FATF recommendations can be rerated from “Partially
Compliant” to “Compliant”, and seven more recommendations demonstrated “improvement of the
technical compliance” albeit without rerating.
Figure 1. Panama: Reporting of Suspicious Activity and FATF Compliance
Reporting of Suspicious Transactions Technical Compliance with the 40 FATF Recommendations
4000
Non-Compliant 2014
3500
(NC) 2018
3000
Partially Compliant
2500
(PC)
2000
Largely Compliant
1500
(LC)
1000
Compliant
500
(C)
0
2012 2013 2014 2015 2016 2017 2018 0 5 10 15 20 25
Sources: Panama’s Financial Intelligence Unit, and the Financial Action Task Force of Latin America (GAFILAT).
7. Committed to exit the FATF grey list by 2021, Panama made significant steps to
improve its legal framework in 2019 and 2020. In chronological order, these include:
• Enacting Law 70 criminalizing tax evasion and the laundering of tax evasion proceeds by
adding it to the Criminal Code and modifying the Tax Code (on January 31, 2019). This implies
that when the tax office has information that in a calendar year an amount of US$300,000 or
above has been evaded, the Tributary Administrative Court can be notified with the appropriate
evidence to file a criminal case through the prosecutor's office. Tax evasion is punishable with a
prison sentence of between two and five years, as well as a financial penalty of between two and
ten times the amount evaded.
• Passing resolution 002-2019 imposing greater controls on financial transactions by
strengthening due diligence to detect fiscal crimes (on April 11, 2019). The document, issued by
the Superintendence of Banks of Panama, regulates rules on customer profiles, resident agent
profiles, and suspicious operations for banks and other fiduciaries.
6For granular stocktaking of Panama’s progress towards FATF compliance since 2013, see SIP on Financial Integrity in
Panama (IMF Country Report No. 19/12), published in November 2018.
7 GAFILAT placed Panama under enhanced follow-up based on the findings of its mutual evaluation report (MER)
published in December 2017. Findings cited here are based on the Enhanced Follow-up Report of Panama, published
in January 2019 (http://www.fatf-gafi.org/media/fatf/documents/reports/fur/GAFILAT-1st-FUR-Panama.pdf).
INTERNATIONAL MONETARY FUND 21PANAMA
• Launching a new anonymous platform to report incidents of money laundering (on May
16, 2019). Panama’s Financial Analysis Unit (UAF), jointly with Crime Stoppers (a community-
based crime-reporting program), created an online platform designed to anonymously report
information about who, when, how and where citizens suspect of laundering money. The
platform gained traction with the public, generating 43 reports of suspicious activity to date.
• Passing an amendment to the tax evasion legislature (Law 87 of October 2019 modifying
article 288-J of the Criminal Code) which introduces criminal punishment for repeat tax
offenders. The amendment is aimed at corporations and other legal entities and grants
exemptions from jail time only if the defrauded amount is returned during the investigation
phase and if it does not exceed US$300,000.
• Signing a statement of intent with France, creating a working group to cooperate on fiscal
and financial transparency and AML/CFT measures (on November 28, 2019). Specifically, the
agreement focuses on the adoption of more efficient mechanisms for the exchange of fiscal
information between the two countries. 8
• Introducing criminal penalties for unlicensed money remitters (Law 123 passed on
December 31, 2019), including imprisonment from 5 to 8 years.
• Creating the Superintendence of Non-Financial Entities (Law 124 passed on January 7, 2020).
The law elevates the previous intendance to superintendence status. It was created to strengthen
the supervision of non-financial businesses and professions (most notably, FTZs, lawyers,
construction and real estate companies). This autonomous agency also conducts training and
onsite inspections of relevant entities in the nonfinancial sector.
• Suspending delinquent corporations from public registry (via Executive Decree 905 of
September 20, 2019). In January 2020, 381,000 legal entities were reportedly suspended from
the public registry of Panama (out of a total of 776,000 registered companies) for failing to pay
their fees for three consecutive years or not having a resident agent and will be permanently
dissolved if their status is not33 regularized within 90 days.
• Approving the creation of a s3ingle registry for beneficial owners (Law 169 passed on
February 20, 2020) to enhance the transparency and traceability of the ultimate beneficiary
ownership data for legal entities established in Panama.
• Proposing a law requiring resident agents to obtain and maintain financial statements of
companies established in Panama but operating abroad, and to submit these accounting
records to the fiscal authorities upon request (more precisely, modifying Law 52 of 2016). The
Ministry of Economy and Finance acknowledged in a statement on January 8, 2020 that
although agreements have been signed to exchange such financial information in the past, in
practice no such data are provided. The amendment aims to enforce record-sharing and
enhance tax transparency.
8 Despite the intensified policy dialogue, France communicated its decision to keep Panama on its list of 13 "tax
havens" in January 2020.
22 INTERNATIONAL MONETARY FUNDPANAMA
• Establishing an AML unit within the customs administration (forthcoming in 2020) staffed
with compliance officers trained to perform due diligence on suspicious transactions. To further
reduce ML risk, the customs administration plans to move away from cash payments to digital
transactions for enhanced traceability.
• Adopting blockchain technology to enhance transaction reporting for goods passing
through the Colon FTZ (forthcoming in 2020) thus reducing FT risk. This effort is spearheaded
by the customs administration.
C. Policy Priorities
8. To address the strategic deficiencies underscored by the FATF’s June decision, the
authorities need to work coordinately to quickly and effectively tackle the four pillars of their
action plan. On the strategic front, designing and implementing a formal communication strategy
should be a key priority for the authorities in order to: (i) ensure that the authorities’ commitment to
expediently address the FATF’s areas of concern is widely acknowledged, (ii) continuously update
GAFILAT and all relevant parties of changes to the AML/CFT national strategy or the legal framework
in a timely manner, and (iii) appraise the domestic agents of any applicable changes. Since GAFILAT
is the relevant regional authority which makes country-level assessments and subsequently informs
the FATF—the international standard setter on AML/CFT—efficiently liaising with GAFILAT is of
utmost importance going forward. On the technical front, creating a taskforce and a roadmap for
the undertaking of necessary reforms is urgent, with necessary assistance available to the authorities
from experts in the field, including at the IMF.
9. While Panama’s AML/CFT regime has demonstrated much improvement in technical
compliance with FATF recommendations over the years, GAFILAT’s assessment of its
effectiveness remains relatively low. GAFILAT assessed Panama’s effectiveness, particularly in
preventing the misuse of foreign and domestic legal entities incorporated in Panama, to be lacking.
According to GAFILAT’s MER published in January 2018, the FTZ, real estate and banking are the
most vulnerable to money laundering as sizable financial inflows are channeled to Panama through
these sectors. The 2018 assessment shows that Panama’s AML/CFT framework is only effective (or
“substantial”) in two areas (preventive measures and financial sanctions related to terrorism
financing and proliferation financing). In all other areas, GAFILAT deemed Panama’s effectiveness to
be insufficient (“moderate” or “low”). This covers Panama’s understanding of risk, international
compliance, supervision, preventive measures, transparency of legal persons and legal
arrangements, financial intelligence, money laundering investigations and prosecution, confiscation,
and terrorism financing investigations and prosecution.
10. Some of the deficiencies in Panama’s AML/CFT regime will take time to address,
although efforts to do so are underway. Urgent policy action in these areas needs to be
undertaken in order to exit the grey list by 2021, as announced by the authorities, as well as to
comply with the international standard, following FATF’s recommendations. Specifically, priorities
include:
INTERNATIONAL MONETARY FUND 23You can also read