Understanding the tipping point of urban conflict: the case of Patna, India - Understanding the tipping point of urban conflict: violence, cities ...
←
→
Page content transcription
If your browser does not render page correctly, please read the page content below
Understanding the tipping point of urban conflict:
violence, cities and poverty reduction in the developing world

Working Paper #5
May 2012

Understanding the tipping point of
urban conflict: the case of Patna,
India

Dennis Rodgers and Shivani Satija
Understanding the tipping point of urban conflict:
 violence, cities and poverty reduction in the developing world

  Dennis Rodgers is the Co-Investigator of the Urban Tipping Point
project and Senior Researcher at the Brooks World Poverty Institute,
                     University of Manchester.

 Shivani Satija is a Research Associate at the Institute for Human
                        development, India.

     The Urban Tipping Point project is funded by an award from the
  ESRC/DFID Joint Scheme for Research on International Development
   (Poverty Alleviation). The Principal Investigator is Professor Caroline
  Moser, Director of the Global Urban Research Centre (GURC). The Co-
   Investigator is Dr Dennis Rodgers, Senior Researcher, Brooks World
     Poverty Institute (BWPI), both at the University of Manchester.

                   © Urban Tipping Point (UTP)
                   The University of Manchester
                Humanities Bridgeford Street Building
                            Manchester
                              M13 9PL
                                UK

                      www.urbantippingpoint.org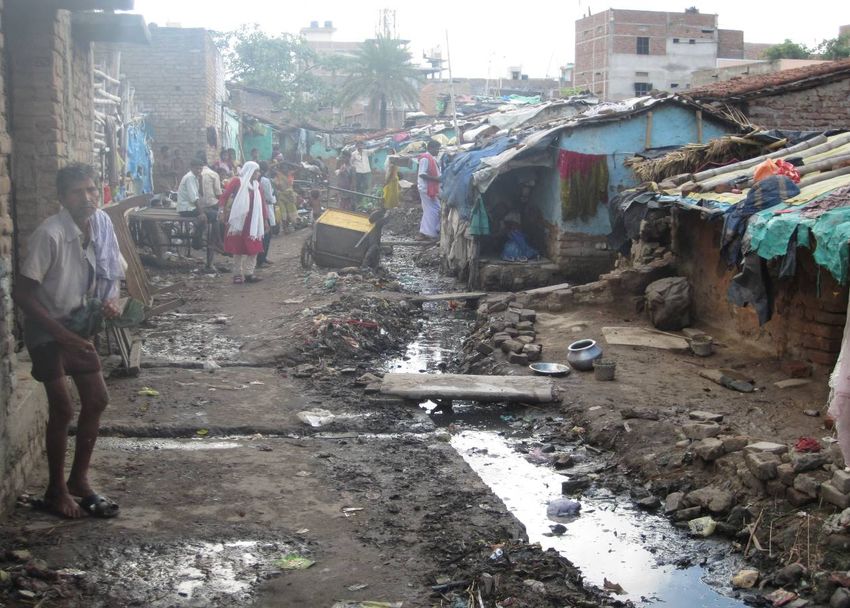
Table of Contents
1.0    Introduction                                                        1

2.0    Conceptual Framework                                                3
2.1    Patna as a case study                                               5

3.0    Patna City Profile                                                  7
3.1    History                                                             7
3.2    Geography                                                           8
3.3    Demography                                                          13
3.4    Economy                                                             14
3.5    Infrastructure                                                      18
3.6    Governance                                                          24
3.7    Politics                                                            25
3.8    Violence                                                            30

4.0    Patna Sub-City Study                                                34
4.1    Methodological approach                                             34
4.2    General socio-economic characteristics of the slums studied         38
4.3    Conflict and violence trends                                        40

5.0    Conclusion                                                          52

6.0    References                                                          55

7.0    Annex A: Caste in Bihar                                             57
8.0    Annex B: The Patna Municipal Corporation (PMC)                      58
9.0    Annex C: Patna Ward Maps                                            59
10.0   Annex D: Bihar Crime Trends (1992-2009)                             61
11.0   Annex E: Patna Crime Trends (1992-2009)                             62
12.0   Annex F: Comparative Crime Trends – Tier I and II cities in India   63
13.0   Annex G: Disaggregated Patna Police Crime Data (2003 & 2009)        66
14.0   Annex H: Slum Socio-economic Profiles                               67
Acronyms

BJP        - Bharatiya Janata Party
FC         - Forward Castes
DFID       - UK Department for International Development
ESRC       - UK Economic and Social Research Council
IAY        - Indira Awas Yojna (Housing scheme)
INR        - Indian National Rupee
IPL        - Indian Penal Code
SLL        - Special and Local Laws
JNNURM     - Jawaharlal Nehru National Urban Renewal Mission
JD         - Janata Dal
JD(U)      - Janata Dal (United)
NIUA       - National Institute of Urban Affairs`
NCRB       - National Crime Records Bureau
OBC        - Other Backward Classes
NSD        - National Slum Development
PRDA       - Patna Regional Development Area
PUAA       - Patna Urban Agglomeration Area
PMC        - Patna Municipal Corporation
RJD        - Rashtriya Janata Dal
SC         - Scheduled Caste
SDP        - State Domestic Product
SJSRY      - Swarna Jayanti Sahari Rozgar Yojna (Urban development scheme)
WPR        - Work Participation Rate
Tipping Points are a reaffirmation of
the potential for change and the
power of intelligent action. Look at
the world around you. It may seem
like an immovable, implacable place.
It is not. With the slightest push – in
just the right place – it can be
tipped.

      - Malcom Gladwell (2000: 259).

Any change, even a change for the
better, is always accompanied by
drawbacks...

       - Arnold Bennett (1867-1931)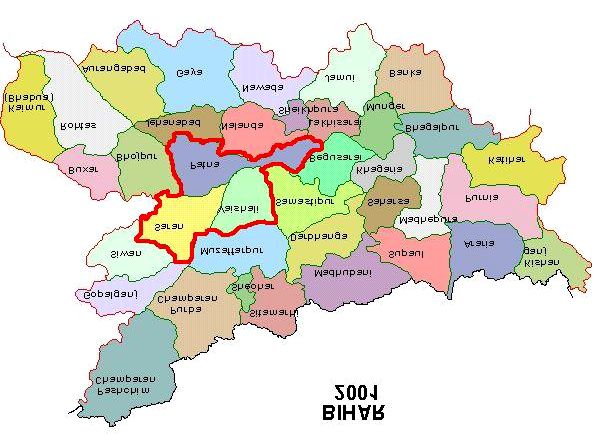
1.0 Introduction

This report synthesizes the results of research into the dynamics of urban
violence in Patna, the capital of the Indian state of Bihar. It contributes to a
broader comparative research project on “Understanding the Tipping Point of
Urban Conflict: Violence, Cities, and Poverty Reduction in the Developing World”,
funded by a grant from the ESRC/DFID Joint Scheme for Research on
International Development, and based at the University of Manchester, UK. The
“Urban Tipping Point” (UTP) project is made up of four city case studies across
Africa, Asia, and Latin America: Nairobi in Kenya, Dili in Timor Leste, Patna in
India, and Santiago in Chile. These cities were chosen partly because the broader
existing literature on urban violence suggests that it is a phenomenon that can be
linked to the presence of certain specific factors in cities. In particular, high levels
of persistent urban poverty, youth bulges, political exclusion, and gender-based
insecurity have all been widely put forward as such factors in recent years, and
the four cities chosen for the UTP study are each paradigmatically associated with
one of these factors – Nairobi with political exclusion, Dili with youth bulges,
Patna with poverty, and Santiago with gender-based insecurity. At the same time,
the four cities were also chosen because their levels of violence vary significantly,
with Nairobi and Dili displaying high levels of violence, Santiago reporting high
levels of violence against women within the context of generally low levels of
violence, while Patna is reputed to have witnessed a significant decline in violence.
This mix of fully and partially positive and negative cases was deemed ideal to
explore the multiple ways in which a given factor might or might not lead to
violence.

In order to draw comparative insights from the study of these four disparate
contexts, the UTP project approaches them on basis of a common theoretical
framework. In particular, the different case studies all take as their starting point
the notion that cities are inherently conflictual spaces, in that they concentrate
large numbers of diverse people with incongruent interests within contained
spaces. This conflict is more often than not managed and/or resolved in a
generally peaceful manner through diverse social, cultural and political
mechanisms, but sometimes – for example, in the presence of high levels of
political exclusion, poverty, gender-based insecurity or youth bulges – these
mechanisms cannot cope, and a range of different forms of violence can come to
the fore. Violence from this perspective is therefore the actualisation of conflict
through the forcible imposition by an individual or group of their own interests to
the disfavour or exclusion of other individuals or groups’ interests. Understanding
the causal mechanisms through which the conflict inherent to everyday urban
living can become violent is the key issue that is at the heart of the UTP project,
with this potential transition from conflict to violence conceptualised across the
four case studies in terms of the notion of a “tipping point”. Of particular concern
to the research is the potential interrelation between different forms of violence,
and whether these connect together to constitute “violence chains”.

This report comprises four sections. The first provides a brief overview of the
general UTP conceptual framework, establishing the basic research premises and
explaining how Patna fits as a case study within the broader project. The second
section is a “city profile” offering basic background information concerning Patna’s
historical, spatial, demographic, social, economic, and political dynamics. It also
offers an overview of the city’s violence trends, focusing specifically on crime, and
drawing on media reports as well as official government and Patna Police
statistics. The third section details the results of local-level mixed qualitative and
quantitative primary research carried out in four different slums in Patna between
April and July 2011. It begins by laying out the logic of case study selection within
the city, as well as the general methodological approach adopted. Background

                                          1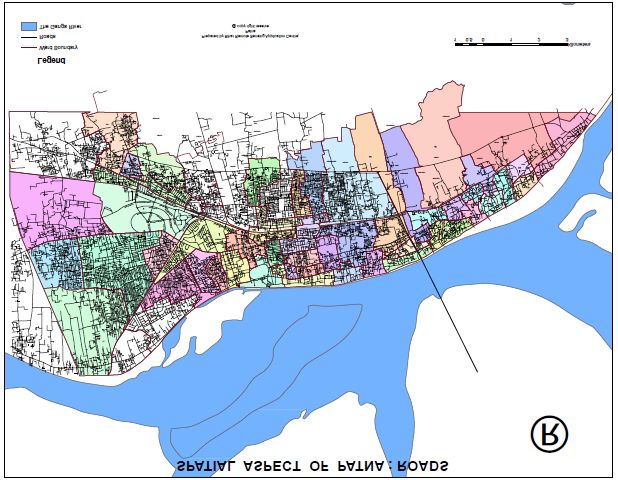
information on the four research sites selected is then provided, followed by a
general consideration of key trends concerning the dynamics of conflict and
violence in Patna. The research was conducted by a joint University of
Manchester-Institute for Human Development team made up of Dennis Rodgers,
Shivani Satija, Balendushekhar Mangalmurty, Sagarika Chowdhary, and Alakh
Sharma. A final section offers some general conclusions.

                                      2
2.0 Conceptual Framework
Cities are inherently conflictual spaces, in that they concentrate large numbers of
diverse people with incongruent interests within contained spaces (Wirth, 1938).
This conflict is more often than not managed and/or resolved in a generally
peaceful manner through a range of social, cultural and political mechanisms, but
can sometimes lead to a range of different forms of violence when such
mechanisms cannot cope. In the context of the UTP project, “conflict” therefore
refers to situations where individuals and groups have incongruent interests that
are contradictory and potentially mutually exclusive but contained, while
“violence” refers to the actualisation of conflict through the forcible imposition by
an individual or group of their own interests to the disfavour or exclusion of other
individuals or groups’ interests. Although not necessarily approaching the issue
through this dichotomous lens, the broader literature on urban violence suggests
that it is a phenomenon that can be linked to the presence of certain specific
factors, or combination of factors in cities. In particular, rapid urban growth, high
levels of persistent poverty and inequality in cities, youth bulges, political
exclusion, and gender-based insecurity have all been widely discussed as such
potential factors in recent years (see Beall and Fox, 2009).
Although there have been (varyingly successful) attempts to statistically correlate
these factors with urban violence, little work has been done in terms of trying to
understand the causal mechanisms through which they cause the conflict inherent
to everyday urban living to become violence. The UTP project proposes that this
potential transition from conflict to violence is best conceptualised in terms of a
“tipping point”. The origins of this idea go back to the 1950s; at its most basic, it
posits that certain types of social phenomena can move from being relatively rare
occurrences to very common ones in a rapid and exponential manner. The classic
example is Morton Grodzins’ (1958) sociological study of the “white flight” from
American suburban neighbourhoods due to non-whites moving in, which has been
shown to only occur after the non-white proportion of the neighbourhood
population crosses a certain threshold (see also Schelling, 1972). Grodzins’ ideas
rapidly became very influential beyond sociology, and the concept of the tipping
point was taken up within epidemiology, for example, where it is used to refer to
the phenomenon of “cumulative adversity” (Hatch, 2005), which occurs when
certain social facts – e.g. disease, risk factors – add up until the weight of their
combined impact causes an endemic reaction.
Grodzins and the epidemiological approach to tipping points exemplify a
quantitative conception of the phenomenon, whereby it is viewed very much in
terms of reaching a critical mass. Other disciplines have adopted a more
qualitative approach. Within climatology, for example, the notion of a “tipping
point” is used to describe sudden systemic changes within weather systems,
which can come about as a result of specific combination of factors – e.g. a
concurrent drop in temperature, humidity, and pressure – occurring together in a
way that fundamentally alters a given situation (Lenton et al., 2008). Urban
scholar Janet Abu-Lughod (1999: 196) has also discussed how tipping points can
be precipitated by “paradigmatic events” that change the rules of the game in
what may be likened to a Kuhnian shift. For example, she contends that the 1943
Harlem race riots fundamentally changed the nature of race rioting in urban
America, fostering their transformation “from the communal to the commodity
type of riot”, a situation that reached its apogee with the nationally-oriented
Watts, Newark, and Detroit race riots of the late 1960s.
Most recently, Malcolm Gladwell (2000), uses the notion of the tipping point to
explain the spread of specific fashion trends or the popularity of certain TV shows,
among others things. He defines a tipping point as the moment a given social
3process becomes generalised rather than specific, but in a rapid rather than
gradual manner – “the possibility of sudden change is at the center of the idea of
the Tipping Point” (Gladwell, 2000: 12). Gladwell suggests that there are three
key qualitative factors that determine whether a tipping point is reached or not.
The first is the type of social actor involved, arguing that there are three different
particular types of influential social actors that determine whether a tipping point
is reached:
(1) Connectors – individuals who are socially positioned in a
way that connects them with lots of other social actors;
(2) Mavens – experts/knowledge brokers whose opinion is
considered relevant;
(3) Salesmen – charismatic leader types who are listened to.
Essentially, salesmen relay the opinion of mavens to connectors who then
disseminate it. Gladwell also suggests that the “stickiness” of an idea or act – its
unique qualities that determine the extent to which it has a long-term influence
on individuals and communities – is also important. If a phenomenon is ethereal
or temporary, it is unlikely to lead to a tipping point. Finally, he contends that the
issue of context is critical to whether or not the particular act or idea “fits” within
the broader social, cultural, and historical trajectory of a society. Although new
ideas are constantly being generated, they have to be able to connect to
dominant understandings within society to be adopted.
Building on these different understandings of tipping points, the UTP project
seeks to understanding the individual, contextual, and process-linked factors that
lead to certain forms of conflicts in cities reaching “tipping points” and spilling
over into urban violence. While recognising the importance of the general
quantitative accumulation of a particular factor – e.g. levels of poverty –
conventionally associated with explaining how a tipping point is reached, it also
aims to consider more qualitative factors such as general systemic
transformations (including especially those that lead to changing distributional
trends of particular factors), the occurrence of paradigmatic events, the evolution
of perceptions (for example due to particular media reporting), as well as the
existence of particular networks of social agents as possible causal factors that
can all lead to a tipping point being reached. At the same time, the UTP project is
also particularly concerned with the temporal dimension of the notion of a tipping
point, recognising that it is not a static concept, but an inherently dynamic one,
and can apply to both increases as well as reductions in violence. It aims to
holistically apprehend whether specific forms of conflict are more or less likely to
lead to violence, what types of violence emerge as a result of the presence of
particular conflicts, and under what conditions this occurs, both locally and more
structurally.
One way that the UTP project aims to achieve the latter insight is by exploring
how different forms of violence that are generated by tipping points processes
interact with each other and can form “violence chains”, or in other words have a
knock-on effect. The notion of a “violence chain” is inspired by the concept of a
commodity chain (see Gereffi and Korzeniewicz, 1994), and is used to highlight
the way that violence operates systemically, and involves a range of
interconnected processes, that may not necessarily be immediately obvious. A
violence chain involves three levels of analysis: the components of the chain
(different types of violence), the way these articulate together (processes), and
the way they are embedded within a broader institutional setting (context).
Articulated together with a “tipping point” perspective, it is expected that the idea
of “violence chains” will generated new and original insights into the dynamics of
4urban conflict and violence, from which a range of innovative policy
recommendations may be generated.
2.1 Patna as a case study
Patna was chosen as a case study city for the UTP project due to its dual
association with poverty and urban violence. The city has long ranked amongst
the poorest Tier II urban settlements (i.e. between 1-5 million inhabitants) in
India, and is located within a state that has historically systematically displayed
the lowest per capital income levels in India (Government of Bihar, 2011). Bihar
is furthermore well known for its high levels of violence – which take on a variety
of forms, from Maoist (Naxalite) insurgency to dacoity (banditry) to communal
and caste violence, to the extent that Bihar is currently reported to be the second
most violent state in India in terms of murders 1 – and Patna is widely
acknowledged to have a notorious reputation for being a violent city (Nambisan,
2000). At the same time, Patna’s reputation as an insecure city only goes back to
the beginning of the 1990s. The accession to power of the populist politician Laloo
Prasad Yadav in 1990 is widely perceived as having led to a breakdown of law
and order in the city, due to the implementation of goonda (strongman) politics,
the fostering of caste polarisation, as well as economic mismanagement including
generalised corruption. Certainly, by the mid-1990s, Patna was frequently
referred to as the “crime capital” of India, notorious for its high rates of murder
and kidnapping. Laloo’s ousting by the reformer politician Nitish Kumar in 2005 is
universally seen as having constituted a critical turning point, however, setting in
motion what is sometimes referred to as the “Bihar miracle”, whereby the conflict
and violence have been significantly reduced, and the state has engaged on a
well-managed developmental route associated with economic growth, prosperity,
and infrastructural improvement. Particularly symbolic of this transformation is
the fact that Patna is now generally considered a peaceful and secure city, in
sharp contrast to previously. 2
To this extent, within the broader context of the UTP project, and its general
objective of explore the factors and processes that lead to everyday forms of
conflict in cities tipping into overt, chronic, and generalised violence, Patna
constitutes something of a “counterfactual” case study. Contrarily to the three
other city case studies, where there are clearly identifiable episodes of conflict
1
See http://archive.oneworld.net/article/view/91983.
2
For the purposes of this case study, “violence” is primarily being equated with crime,
which in India is generally treated as a technical and measurable category. The Indian
Criminal Procedure Code distinguishes between two categories of crime: “cognizable” and
“non-cognizable”. The former implies that immediate police action can be taken without
permission from a magistrate or legal warrant, and is a category that is further divided
into crimes falling under the “Indian Penal Code” (IPL) and “Special and Local Laws” (SLL).
IPL crimes tend to include crimes against persons (e.g. murder, attempted murder,
kidnapping, rape, caste discrimination), and while SLL tend to be crimes against property,
public order, possession of arms and explosives, as well as crimes relating to narcotics,
gambling, etc. Non-cognizable crimes are those that need a warrant and permission from a
magistrate in order to be pursued. At the same time, however, it should be noted that
while attempts to categorise violence – not just into “crimes” but also more generally into
economic, political, social, structural, direct, symbolic or cultural violence, for example –
are frequent, as Bourgois (2004) has pointed out, it may be more useful to look at these
forms of violence as operating along a “continuum”. Not only is violence often talked about
generically in practice, but perceptions of violence also differ significantly according to
one’s standpoint, as Tilly (2003) has pointed out with regard to the issue of legitimacy. It
is also often in the linkages between different forms of violence that a proper appreciation
of the phenomenon’s general underlying causes can be attained. To this extent, this case
study does not seek to precisely categorise the different forms of violence that it reports
on.
5spilling into violence, its dynamics reveal what might be denominated a “reversal”
of a tipping point from conflict to violence. This obviously has significant
normative import. In particular, understanding how a situation of extraordinary,
chronic, or generalised urban violence can return to one of generally contained
and managed conflict is clearly of critical importance from a policy perspective,
and the Patna case study seeks to understand both the factors that lead to
current conflicts becoming violent as well as the factors and processes that
caused urban violence to decline in the city. As such, it aims to provide an
alternative perspective on the central UTP project research premise concerning
the linkages between conflict and violence in cities. Certainly, as Richard Lebow
(2010: 5) has pointed out, counterfactuals are useful to demonstrate “the
contingency of assumptions that underpin particular theoretical constructs”, and
facilitate “imaginative leaps in theory and hypothesis formation”.
63.0 Patna City Profile
This section provides basic background information concerning Patna’s historical,
spatial, demographic, social, economic, and political dynamics. It also offers an
overview of the city’s violence trends, drawing on media reports as well as official
government and Patna Police statistics concerning crime in the city.
3.1 History
The history of Patna goes back well over two millennia. The city was the seat of
government for a series of successive kingdoms that dominated North-eastern
India – and sometimes beyond – between the 6th century BC and the 4th century
AD, and remained a regionally important centre subsequently. Patna was
originally known as “Pataliputra”, and its renown was such that it is mentioned by
the Greek historian Megasthenes in his writings during the 4th century BC (Gupta,
1998). The city was built due to its location presenting certain key strategic
advantages. It is a riverine settlement, surrounded by the Ganges to the North,
the Punpun to the south, and the Son to the east, with a fourth river, the
Gandak, just a little to the North of the city. This particular geography gave
Pataliputra an undeniable edge over rival cities, both in terms of being an easily
defensible site, but also by virtue of being able to control trade, which at the time
mainly operated along river waterways.
Pataliputra grew rapidly during the next few centuries, and rapidly became a
centre for scholarship and religion. The world’s first university was founded in
nearby Nalanda, while the Buddha achieved enlightenment in Bodhgaya, also not
far away. The rulers of Pataliputra – including the famous Emperor Ashoka –
actively extended their patronage to Buddhism, as well as to Jainism, another
major world religion which also emerged locally around the same time. Indeed,
the city’s association with religion has persisted through the ages. Guru Gobind
Singh, the 10th Guru of the Sikhs, was born in Patna in 1666 AD, and the city was
also the founding place of an important Sufi sect, the Firdausi. Indeed, Patna
today remains the gateway to major international religious centres, and is a stop
on numerous pilgrimages.
Although Pataliputra lost its capital status during the reign of the Guptas in the 4th
century AD, the city nevertheless remained as an important cultural and
economic centre. During the early medieval period, however, Pataliputra began to
lose its pre-eminence as economic and political power moved to the Northwest of
the subcontinent with the invasion of the Turks and the Mughals from the 11th
century onwards. Because of its strategic location, Delhi became the new political
centre of India, but Pataliputra remained an important provincial capital. The
name Pataliputra was changed to Patna by a 16th century governor called Sher
Shah Suri, although later, during the governorship of Azimusshan, the son of the
Mughal emperor Aurangzeb, the name of Patna was changed to Azimabad.
Following the decline of the Mughals, the city passed into the control of the
Nawabs of Bengal, and became known as Patna once again.
During the 17th century, Patna became an important trade centre. The Portuguese,
Dutch, French, English, and the Danes all came to Patna due to the city’s position
along major river waterways, and it became a major depot centre for calicos
(cotton cloths), dye and food grains, as well as saltpetre, something which
became increasingly important due to its importance for the manufacture of
gunpowder. The British trader Peter Mundy, writing in 1632, called Patna “the
greatest mart of the Eastern region”. 3 Patna fell into the hands of the East India
3
See http://www.brandbihar.com.
7Company following the battle of Buxar in 1765, which marks the beginning of the
British colonial period in Bihar. Patna remained an important regional trading
centre, as well as a gateway to Calcutta – present day Kolkata – from the
Northwest, and became the capital of Bihar Province following the division of
Bengal Province in 1911.
Patna played a major role in the Indian independence struggle, and was notably
associated with Mahatma Gandhi’s non-violent Champaran movement and the
1942 Quit India Movement. Many noted freedom fighters also originated from
Patna, including the first President of the Constituent Assembly of India, Dr.
Sachidanand Sinha, Swami Sahajanand Saraswati, Jai Prakash Narayan,
Yogendra Shukla, Bihar Bibuti Anugrah Narayan Sinha, and Sri Krishna Singh,
among others. Since India’s independence in 1947, Patna has served as the state
capital of Bihar. It remains the most important city in the state, whether
politically or economically, although a number of medium-sized urban settlements
have also emerged over the past three decades, including especially regional
intermediate market towns. At the same time, however, it should be noted that
Bihar remains an overwhelmingly agricultural state, even if there has been some
modest industrial and service sector development in recent years (Government of
Bihar, 2011). 4
3.2 Geography
The state of Bihar is situated in North-eastern India (see figure 1). It is 94,163
square kilometres in size, and borders Nepal to the North, the Indian state of
Uttar Pradesh to the West, West Bengal to the East, and Jharkhand to the South.
Figure 1: Bihar
Source: http://a7ki.net/wp-admin/bihar-map-india&page=6.
4
Historically Bihar also had a significant mining sector, but this was mainly located in the
South of the state, which was constituted as the separate indigenous state of Jharkhand in
2000.
8Most of Bihar’s territory is alluvial floodplain, with some pre-Himalayan foothills to
the North, and the beginnings of highlands to the South. Bihar is one of the most
rural states in India; just 10.5 percent of its population lived in urban areas in
2001 (India Urban Poverty Report, 2009: 96). Patna, the capital of Bihar, is
located 53 metres above sea level, latitude 25º35’40” North, longitude 85º08’38”
East (see figure 2). The city is situated in a high risk earthquake zone, as well as
a flood risk zone, particularly with regard to the Punpun and Ganges rivers.
Embankments have been built along the former to control flooding, but during the
monsoon, spill over from the Ganges frequently floods large parts of the city.
Figure 2: Patna and Bihar
Source: http://www.devinfo.org/news_content/news_001_29.html.
There exist several different administrative units relating to the city, including the
Patna Regional Development Authority (PRDA), Patna District, the Patna Urban
Agglomeration Area (PUAA), and the Patna Municipal Corporation (PMC). The
PRDA is approximately 235 square kilometres in area and comprises three
districts of Bihar: Patna, Saran, and Vaishali (see figure 3).
Figure 3: The PRDA
Source: Government of Bihar (2006: 6)
9Patna District includes the PUAA, and Fatwah Nagar and Maner Nagar areas, both
of which are agricultural. The PUAA comprises of the PMC area, and its
outgrowths of Patliputra Housing Colony, Digha-Mainpura, Sabazpura, Khalilpura
and Badalpura, Phulwarisharif, Danapur Nizamut, Danpur Cantonment Area,
Khagaul, and Saidpura. The PUAA covers some 136 square kilometres of land, of
which the PMC corresponds to 99 square kilometres (see Figure 4). For the
purposes of this City Profile, Patna will be considered the area of the PUAA, and
wherever possible, statistics will correspond to this area. 5
Figure 4: The PUAA and PMC
Source: Government of Bihar (2006: 9)
Patna is surrounded on all sides by rivers, which has clearly constrained its
growth. It is a linear city which has grown on either sides of the main road
(Ashok Raj Path) running east to west on a ridge, almost parallel to the bank of
the Ganges river. The length of the city is 24 kilometres. Prior to the new Bypass
road being built, the city was 2.5 kilometres in breadth on average. Patna’s urban
development was more or less unplanned until the beginning of the 20th century.
During British colonial rule, monumental edifices such as the Patna Museum or
the High Court were built to the West of the old historic city, in an area known as
the New Capital Area. This was further developed following Patna’s devastation by
an earthquake in 1934 (Gupta, 1998: 9-18). Patna is thus divided into three
areas – an eastern old city (Patna City), a central area extending from Mahendru
to Patnagaya Road, and the western New Capital Area (see Figure 5).
5
Due to the inevitably patchy nature of the available data, occasionally some of the
statistics used in this report will refer to Patna District or the PMC. These will be noted as
such, however.
10Figure 5: City Map of Patna
Source: http://www.mapsofindia.com/maps/bihar/patna-city-map.htm.
Although following India’s independence legislation was enacted in the form of
the Bihar Town Planning and Improvement Trust Act in 1951, and a Master Plan
was drawn up to guide Patna’s urban development, this was little more than a
broad brush land use exercise, and the city’s urban growth continued in an
organic fashion. By the late 1970s, “the city and its suburbs were facing urgent
problems related to traffic and transportation, housing, drainage, water supply
etc. due to population growth, putting pressures on all walks of life.”
(Government of Bihar, 2006: 11).
The Patna Regional Development Authority was set up in 1975, and the Bihar
Regional Development Authorities Act was enacted in 1982, which provided for
the preparation of a new Master Plan. This was prepared in 1986, and “was only
partially successful… due to both financial and legal constraints. The rapid
population growth, inadequate infrastructure for controlling development and
paucity of funds led to unplanned organic growth, the zoning and sub division
regulations were rarely applied and growth seemed to emerge despite the plan”
(Government of Bihar, 2006: 11). A new “Master Plan 2021” is currently being
prepared, which will concentrate on the “augmentation of Patna's infrastructure in
terms of Sewerage, Drainage, Water Supply and Solid Waste Disposal”
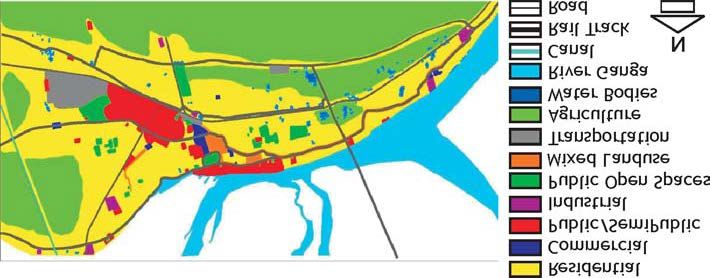
(Government of Bihar, 2006: 11). Patna’s pattern of land use is however quite
skewed as a result of this somewhat chaotic and ineffective planning process (see
table 1). Land used for both transportation and recreation is low compared to
provisions of the 1986 Master Plan.
11Table 1: Patna land use patterns (2001)
Land Use Area (in ha) Percentage
1 Residential 8,230 60.88%
2 Commercial 298 2.20%
3 Public/semi-Public 651 4.82%
(administrative,
educational,
religious, medical,
etc.)
4 Recreational 212 1.56%
(parks, etc.)
5 Industrial 238 1.76%
6 Transportation 1,050 7.77%
7 Water bodies 164 1.14%
8 Agriculture 2,591 18.88%
9 Vacant land 145 0.99%
Total 13,579 100%
Source: Adapted from Government of Bihar (2006: 12-13).
Industrial land use is also low, although this is also partly due to the broader
economic structure of Bihar, which is predominantly agricultural. Most commercial
land use is unplanned and occurs organically along the major roadways of the city
(see figure 6).
Figure 6: Patna’s land use (2001)
Source: Mandal and Dutta (2009: 8)
The predominant type of land use is residential. The most densely populated
areas of Patna are mainly along the banks of the Ganges river, with densities
varying from 301 to 900 persons per ha. Wards to the South and West of the city
vary from 100 to 300 persons per ha in density. The overall average population
density of Patna was 137 persons per ha in 2001. Over 90 percent of residential
areas are unplanned, with 64 percent of the population of Patna living in areas
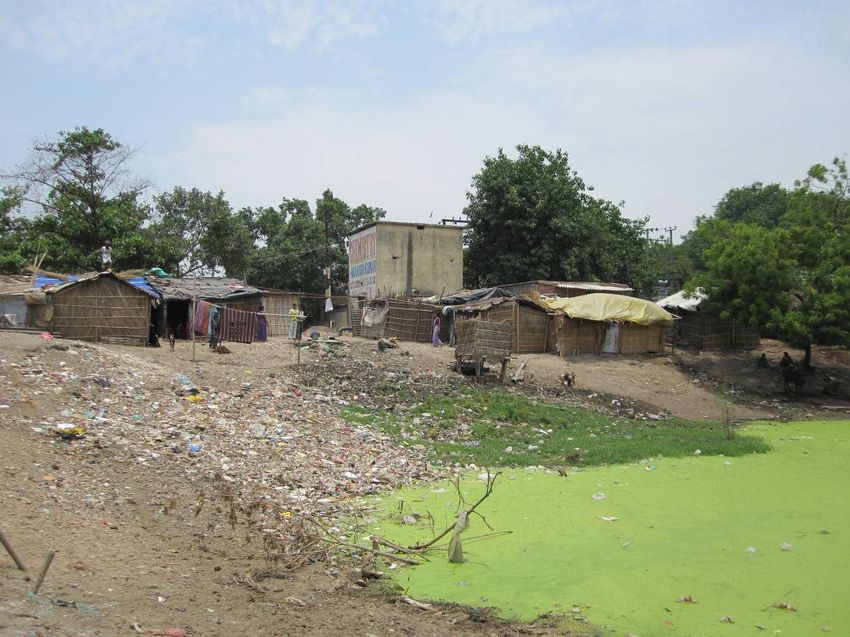
identified as slums (Government of Bihar, 2006: 32). 6 These slums are fairly
6
The Government of Bihar considers “slums” to be areas characterised by “infirm housing
structures, poor ventilation, acute over‐crowding, faulty alignment of streets, inadequate
12evenly scattered around the city (see figure 7). 46 percent occupy government
land, and 54 percent are on private land.
Figure 7: Slums of Patna
Source: Government of Bihar (2006: 33)
3.3 Demography
Patna’s population grew significantly between 1991 and 2001, from 1.15 million
to over 1.7 million, an increase of about five percent a year (Census of India,
2001). Preliminary 2011 Census data suggests that the city has grown further, to
almost two million inhabitants. Part of the reason for this growth trend is the
wider population growth of Bihar, which advance data from the 2011 Census
reports to now have a population of 103 million, an increase of over 25 percent
from the 80 million recorded in the 2001 Census. This makes Bihar one of the
fastest growing states in India, demographically-speaking, significantly above the
national average of 15 percent (Census of India, 2001 and 2011). At the same
time, the “floating” population commuting into Patna on a daily basis from
outlying towns and villages is also projected to increase significantly, from
200,000 to 300,000 by 2021 (Government of Bihar, 2006: 19). Patna’s sex ratio
was 840 females per 1000 males in 2001. This figure is significantly lower than
Bihar’s state-level sex ratio of 919 females per 1000 males (Government of Bihar,
2011), which supports the supposition that there are high levels of male worker
immigration into the city. This is also reflected in Patna’s age structure, as a
majority of the city’s population falls between 15-44 years (see table 2).
lighting, paucity of safe drinking water, water logging during rains, absence of toilet
facilities and non‐availability of basic physical and social services” (see:
http://urban.bih.nic.in/Docs/Draft-of-Bihar-State-Slum-Policy.pdf).
13Table 2: Patna’s age structure (2001)
Age Percentage of population
0-4 7%
5-9 7%
10-14 9%
15-44 56%
45-59 15%
60-64 2%
65+ 4%
Source: Government of Bihar (2006: 21)
The vast majority of Patna’s population is Hindu (83 percent), but there is a large
Muslim minority (16 percent), with the rest Buddhist, Jain, Sikh, or Christian. 7
The main languages spoken in Patna include Hindi, Magahi, and Bhojpuri. The
population of Bihar, as is the case of most of India, is characterised by caste.
Caste is a fundamental organising principal of Indian society, one of the bases
upon which it is divided into a social hierarchy. 8 This is particularly pronounced in
Bihar. There are four principal caste categories, namely the upper castes
(sometimes known formally as the “general” category), the “other backward
castes I” (OBCI), the “other backward castes II” (OBC II), and the scheduled
castes (SC). Politically speaking, the most important castes in Bihar are the
Brahmins, Bhumihars, Kayasthas and Rajput upper castes on the one hand, and
the Kurmis, Keoris and Yadavs “other backward castes II”. 9 Scheduled castes
include the Bhumji, Chamars, Dhobi, Dhom, Dusadh, Musahar, Nat and Pasi. A
list of the principle castes in Bihar can be found in Annex A.
3.4 Economy
Patna is an important commercial centre due to its riverine position, and it is a
focal point for the import and export of vegetables and food grains, and an
important warehousing location for a variety of goods that travel down the
Ganges in particular. The concentration of industrial activities in Patna is
otherwise low, however. Few industries exist beyond some steel casting, a few
cotton mills, some electronics, and cottage industries including leather and
footwear fabrication, pottery, carpentry, blacksmiths, and coppersmiths, as well
as brick-making for local use. The informal sector in Patna is significant. It
involves mostly low-level service occupations, although there is also some petty
commodity production, rag picking, scavenging, and recycling. According to
official figures, it comprises more than 30 percent of the workforce, but real
levels of informality are likely much higher, around 70 percent at least. Despite
the generally stagnant and unproductive nature of the urban economy, the per
7
See http://allaboutbihar.com/.
8
The caste system – originally known as the “Varna system” – was first mentioned in the
Rig Veda, a text written in approximately 1,500 BC, during the period known as the Vedic
period. There are four varnas, namely: Brahmins (priestly class), Kshatriyas (warrior class),
Vaishayas (merchants and business class) and Shudras (the working class). Caste groups
are further divided into sub-castes. For example, the Chamars (people who traditionally
work with leather), Mehtars and Musahars (people who traditionally work in the cleaning
sector like sweeping and drain cleaning), or Dhoms (groups traditionally working in
cremation grounds), are all part of the fourth caste group, the Shudras. This ancient
system of occupational stratification gradually more formalized and rigid over time, and is
nowadays a form of social stratification that often prevents social mobility. Certainly, many
discriminatory practices are associated with the caste system, including for example
“untouchability”.
9
See http://ncbc.nic.in/backward-classes/bihar.pdf.
14capita gross district domestic product of Patna is nevertheless significantly higher
than Bihar’s per capital gross state-level product. Overall, Patna is responsible for
over 20 percent of Bihar’s economic production (see table 3). This, however, is
more an indication of Bihar’s poverty rather than of Patna’s dynamism.
Table 3: Patna and Bihar GDP
Bihar (At Constant 1999-2000
Patna
Prices)
Per
Gross DDP Capita Gross SDP Per Capita SDP
Year
(INR Millions) DDP (In INR Millions) (INR)
(INR)
1999-
103,552 22,918 501,999 6,304
2000
2000-
114,884 24,696 582,604 7,116
2001
2001-
117,619 24,498 554,474 6,571
2002
2002-
135,520 27,799 619,761 7,243
2003
2003-
137,213 27,605 593,856 6,816
2004
2004-
159,239 31,441 659,086 7,434
2005
Source: Government of Bihar Directorate of Statistics and Evaluation
According to the 2001 Census of India, the total working population of Patna was
25.2 percent of the city’s total population. 41.4 percent of males worked,
compared to just 5.8 percent of female population of the city (Census of India,
2001). This is significantly lower than in Bihar more generally, where the state-
level work participation rate (WPR) was 32.9 percent in 2001. The gender gap is
similarly different, insofar as at state level, the WPR for males was 46.3 percent
and for females, 18.4 percent (Government of Bihar, 2011: 243). This suggests
that urban labour markets are more constrained and/or saturated than rural ones.
Patna nevertheless experiences significant labour immigration. This tends to be
seasonal in nature, but overall migration rates increased from 28 percent to 49
percent over a 17 year period from 1985-2002. Most of this increase has involved
Muslims, OBCs and SCs, suggesting that the reasons for migration stemmed not
only from economic reasons but also for social and political reasons, including
caste oppression and discrimination. The World Bank’s 1998 Bihar Living
Standards Survey recorded that 95 percent of migration was male (see
Deshingkar et al., 2009). The India Urban Poverty Report (2009) suggests that
most migration in Bihar is from rural areas to medium sized towns, rather than to
Patna.
3.4.1 Urban Poverty
The incidence of poverty is extremely high in Bihar compared to the national
average. This is particularly true in rural areas, where poverty levels were
estimated to be 55.7 percent in 2004-05, compared to an all-India average of
41.8 percent. Urban poverty in Bihar is generally estimated to be lower than rural
poverty, reaching some 43.7 percent in 2004-05, but it should be noted that this
figure was significantly higher than the national average of 25.7 percent
(Government of Bihar, 2011: 242). Not surprisingly, perhaps, Bihar regularly
emerges as one of the states in India with the highest levels of urban poverty.
15There is significant controversy regarding poverty figures for Patna. As the City
Development Plan (Government of Bihar, 2006: 32) describes, “in 2001, it was
estimated that out of [1,698,000] persons living in the PUAA, nearly [1,050,00]
(63.50 percent) were within pockets identified for slum upgrading, reconstruction
or resettlement. A majority of these pockets were in the PMC area and where
nearly [980,000] (72.00 percent) of the PMC population of [1,366,000] lived…
However, accordingly to [the] PMC those below the poverty line (BPL) within
these identified pockets were only [286,000] in the PUA area (17.50 percent of
the total population) and only [250,000] in the PMC area (19.00 percent of the
total)”. Part of the problem here lies in the notion of being “below the poverty
line” (BPL), which is a controversial categorisation based on criteria that are
frequently modified and vary from state to state, and to this extent, the fact of
living in a slum is probably a better indicator of impoverishment than being
considered “below the poverty line”. 10
In this regard, according to a qualitative study cited in the City Development Plan
(Government of Bihar, 2006: 32-35), 60 percent of the slum population in Patna
District is illiterate and almost a third 30 percent unemployed. Nearly 25 percent
of children enrolled in schools drop out, and half of school-going children
simultaneously work for a living, mostly as rag pickers. Overall, approximately
ten percent of slum dwellers are considered fully literate, just over ten percent
have finished their primary education, less than seven percent have undergone
secondary education, less than five percent have attained their matriculation, less
than one percent graduate, and 0.13 percent go on to postgraduate studies.
Living conditions in the slums are generally deplorable, a condition that has been
exacerbated due to lack of planning, and proper sanitation and drainage, which
increases the likelihood of diseases. Similarly, the lack of a solid waste disposal
system means that waste is generally dumped on roads and open spaces. 52
percent of slum dwellers use open ground for defecation. The authors of the City
Development Plan (Government of Bihar, 2006: 120-122) furthermore conducted
their own consultation process, both with NGOs and in some poor slum areas of
Patna. They report that two issues in particular were highlighted as especially
problematic by slum dwellers:
(1) The most crucial problem was felt to be the poor sanitation facilities
and lack of solid waste management by the PMC. Drainage was also
highlighted as a major linked issue, including in particular choked drains,
underground seepage from drainage channels, and contamination with
sewerage.
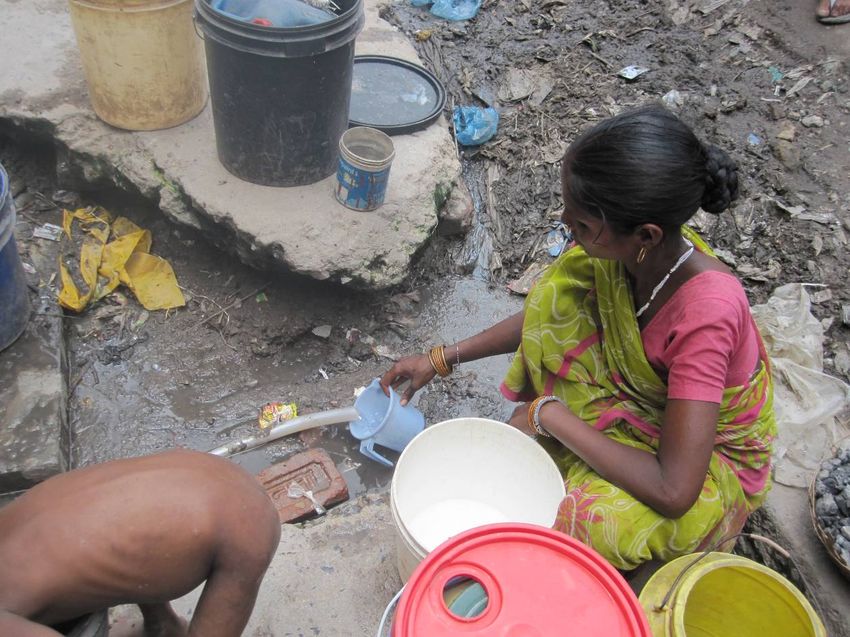
(2) There was also “extreme resentment” concerning access to water
supply in some slums areas. In particular, the frequency of water supply
was reported to be erratic, ranging from once every two days to once a
week. To supplement this inadequate water supply buying water from
private water suppliers “at a monthly rate of INR 100-150 per 1,000 litres
per households, or through private tube wells”, was common.
10
Part of the problem is that poverty is measured in terms of a set of basic criteria
including social origins, for example. Moreover, to be classified as “poor” an individuals had
to fulfil a certain minimum “score”, which changed from state to state. Another major
source of contention is the fact that the number of poor was “capped”, generally rather
arbitrarily according to decisions made by the Supreme Court of India as to how many
poor people there were to be in different Indian states. As a result, many who would have
been classified as poor according to any sensible measure are excluded. There is also
significant manipulation of the category of being “below the poverty line”. Individuals
classified as BPL are given BPL cards entitling them to certain government social protection
schemes, which makes BPL cards extremely valuable (see
http://www.downtoearth.org.in/content/bpls-dividing-line).
163.4.2 Poverty alleviation schemes 11
A major centrally-sponsored poverty alleviation scheme is the SJSRY (Swarna
Jayanti Shahari Rojgar Yojana), which entails promoting gainful employment
through self employment or ventures, through training in skills for the urban poor,
particularly with regard to services provision or small-scale manufacturing.
Another new all-India scheme is the RSBY (Rashtriya Swasthya Bima Yojna)
which provides subsidised health insurance to those below the poverty line. This
began in Patna District in December 2010, and has a total enrolment rate of
165,000 out of 427,546 eligible individuals. 12 Other local poverty alleviation
schemes that are operational – at least theoretically – include:
• A subsidy for girls’ school uniform: A state government scheme
which provides INR 700 to girls every year in order to pay for
uniforms up until class 9, while those attending higher secondary
school receive INR 1,000.
• Janani Suraksha Yojna: A central Government of India scheme that
began in 2005 and aims to bring the maternal mortality ratio to
below 100 by the year 2012, in keeping with Millennium
Development Goal targets. Expecting mothers receive INR 700 in
order to deliver in a health facility rather than at home.
• Girls’ Cycle Scheme: A state government scheme whereby every
girl who completes her education up until the end of class nine gets
a bicycle.
• Mukhyamantri Balika Protsahan Yojana: A state government
scheme to promote the education of girls beyond their
matriculation examination (10th class exams). Those obtaining a 1st
(60 percent plus) receive INR 10,000 in order to enable them to
continue their studies.
• Mukhya Mantra Kanya Suraksha Yojna: A state government
scheme launched jointly with the UTI Asset Management Company
in 2008, and which involves investing up to INR 1.4 billion in order
to empower poor girls. The state government guarantees to invest
INR 2,000 for the first two girls born on or after 22 November 2007
to any Below Poverty Level (BPL) family, in the UTI-Children’s
Career Balanced Plan-Growth Option. After 18 years, the girl will
receive the amount equal to the maturity value of the investment,
estimated to be INR 18000.
• Mahila Samriddhi Yojana: A state government scheme whereby
women may be loaned up to INR 30,000 at an annual interest rate
of four percent, and a repayment period of three years, in order to
fund projects that facilitate their participation in the labour market.
11
For more details on SJSRY, see: http://mhupa.gov.in/w_new/SJSRYAdmnMechanism-
OperationalGuidelines-2009-2010.pdf.
12
See: http://www.rsby.gov.in/statewise.aspx?state=4#.
173.5 Infrastructure
3.5.1 Roads and Transportation
Patna is not well connected to India’s national expressways network, being over
100 km away from both the National East-West Expressway and the Agra-Kolkata
Expressway. Its road network is self-contained and principally serves local traffic.
It has approximately 1,300 kilometres of roads, only 346 kilometres of which are
surfaced. The surface density of roads is 13 kilometres per square kilometres and
the average width of the roads is 5.5 meters (see figure 8). There are no
pedestrian bridges or underpasses in the city, and traffic lights are scarce,
although there are colonial-era roundabouts. Due to unplanned residential areas
and irregular markets, the main roads are chronically congested while feeder
roads are very narrow, regularly encroached on by shops and business, and also
often water logged in areas prone to flooding.
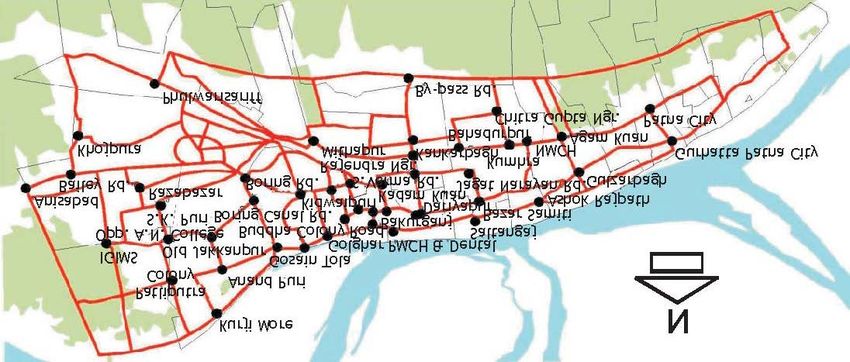
Figure 8: The city of Patna’s road network (density)
Source: Bihar Remote Sensing Application Centre
Perhaps not surprisingly, Patna’s road network system is widely considered
inadequate (Government of Bihar, 2006: 60). It is furthermore under strain due
to the massive growth in the number of vehicles in the city. This rose from 4,384
registered vehicles in 1981 to 294,164 in 2001, an increase of over 6,500 percent.
Almost 80 percent of vehicles are private, and 67 percent are two-wheelers
(Government of Bihar, 2006: 60). In addition, in 2001 there were approximately
125,000 registered motorcycles and 35,000 registered cycle rickshaws in the city,
although it should be noted that in both cases there are also many unregistered
vehicles – in the case of cycles rickshaws, it is estimated that these may number
anything between 150,000-200,000. The increase in the number of private
vehicles is partly due to the serious lack of effective public transportation. Only
1812 percent of all vehicular transportation in Patna is public transport (Government
of Bihar, 2006: 60). This mainly consists of auto-rickshaws, jeeps, minibuses.
According to Singh and Misra (2001: 2), the number of road accidents in Patna is
extremely high. The number of fatalities per 100 accidents rose from 28 in 1996
to 45 in 2000, a 60 percent increase. A disproportionately high number of victims
are pedestrians, and more than 80 percent are between 18 and 60 years old. The
bypass road NH-38 was recorded as most accident prone in the same year. Street
lighting is not sufficient which not only adds to inconvenience but insecurity as
well. According to the Patna Master Plan, the spacing between street lights is
recommended to be 30 meters, but in actual fact, where street lighting exists
(and works), it is generally more than 150 meters. According to City
Development Plan (Government of Bihar, 2006: 63), there were 9,290
streetlights in Patna in 2006. In terms of other transportation links, Patna is on
the main railway trunk line from New Delhi to Howrah, but it is still not yet fully
on the Broad Gauge double track electrified system of India. Furthermore, the
North-West railway link across the Ganges occurs via Barauni over 100 km to its
east. Patna’s Jai Prakash Narayan International Airport is increasingly emerging,
along with Gwuhati and Bhubaneswar, as a major secondary hub to Kolkata, but
it requires a longer runway and better infrastructure for the rapid clearance and
movement of goods and people in order to attain its full potential. Finally, Patna
is on National Waterway no.1, which stretches 1,354 kilometres from Allahabad
to Haldia. In particular, the 356 kilometres stretch between Varanasi and Patna
has draughts of between 1.5 and 2.0 meters and is therefore navigable for most
of the year, as is the stretch from Patna to Farrakka (411 kilometres) has a
minimum draught of 2.00 meters. The volume of traffic is however not as high as
it could be (Government of Bihar, 2006: 135).
3.5.2 Housing
Patna is a saturated urban settlement, and suffers from significant housing
problems (Government of Bihar, 2006: 40). The city’s density is highest in the
eastern part of the city along the Ganges river bank, and also near the Patna
Railway junction. Due to the problem of water logging, however, urban expansion
in these areas is limited. Significant urban expansion is now taking place in the
western region of the city, along the Ganges and on either side of the Delhi
Howrah trunk rail line. With denser connectivity, other surrounding areas of the
wider Patna district such as Hajipur and Sonepur will likely become absorbed
within the Patna metropolitan agglomeration. Housing in Patna is divided as
Residential (organic/unplanned), Residential (Planned/Plotted), Residential
(planned-Apartments) and Identified Slums. Most of the city’s residential area is
constituted by unplanned/organic settlements; it is estimated that just over ten
percent of residential areas are actually planned, whether in the form of plotted
land or apartments. The Bihar Housing Board has purposefully developed ten
housing colonies over the past few years, and there have also been several
private housing developments in the western part of the city (Government of
Bihar, 2006: 41). According to the 2001 Census data, there were 269,619
households in Patna, for an average household size of 6.3 persons. 82 percent of
these households were located in the PMC, where the average household size was
6.2 persons.
It is estimated that by 2021 the number of households will increase faster than
population growth and that the average household size will decrease to six
persons (Government of Bihar, 2006: 20-21). Within the PMC area,
approximately 132,000 houses are owner occupied, while some 710,000 are
rented. According to the City Development Plan, “about half the houses had two
room or less and nearly half the areas had covered drains but which were hardly
19maintained. Nearly [175,000] houses had in house bathroom facilities and
[131,000] houses had in house piped water supply. The rest relied on hand
pumps and tube wells. Around 78% of the houses had septic tanks and only 18%
were sewered. 85% of the households used gas for cooking and 96% had access
to electricity. […] 50% of dwellings are single storied, 35% are two-storied, 8%
are four or even more storied and 7% are huts. 30 percent of the dwellings had
floor area between 251 to 500 sq.ft. and 20 percent had floor area between 500
to 750 sq.ft. In a rapid survey of people’s perception …the residents of Patna in
their first requirement indicated the following problems in order of priority: poor
drinking water supply; poor drainage and sanitation; excessive water logging;
lack of employment opportunities; excessive traffic congestion. There were [also]
complaints on quality and access to housing and also on access to transportation,
health and education” (Government of Bihar, 2006: 41).
3.5.3 Electricity
Electricity coverage in urban Bihar has improved markedly during the past decade,
and there are now 266,375 individual domestic electricity connections in Patna
District. 13 This represents almost ten percent of all such electricity connections in
Bihar. It is unclear how much of the population of Patna this covers, and how
supply is distributed, although it is widely reported that illegal connections
proliferate in slums and poorer neighbourhoods (Government of Bihar, 2006). The
PMC levies a tax on all electricity connections, but the collection rate is very low.
Power surges and cuts are furthermore very frequent, although these affect
different areas of the city differently, with richer areas and the new business
centre of Patna to the West of the city around Boring Road in particular generally
benefitting from better supply than the poorer Eastern side of the city.
3.5.4 Water
The major source of water in Patna is ground water. 14 There are 89 tube wells in
the city producing 324 million litres per day against an estimated requirement of
225 million litres. At the same time, however, there is a 40 percent transmission
and distribution loss due to the antiquated nature of the distribution network,
which means that many inhabitants lack in adequate supply, due both to leakage
but also contamination from sewerage and other (Government of Bihar, 2006:
50). According to a study conducted by National Institute of Urban Affairs (NIUA),
although 75 percent of population in the PMC has piped water connections, due to
low water pressure and poor supply system, only about 40 percent of the city’s
population can count on obtaining water in this way, a proportion that is
significantly lower than the national average of 65 percent (Government of Bihar,
2006: 51-52). In practice, this 40 percent has to obtain their water from a
combination of both house connection and public stand post, while 20 percent of
the city’s population gets water from public stand posts alone, and the remaining
40 percent depend on private tube wells. There are 1,500 public stand posts in
the city, and the number of users per public stand posts is over 300 (Government
of Bihar, 2006: 58). The city is furthermore projected to become deficient over
the next 30 years (see table 4).
13
See: http://bseb.bih.nic.in/Notices/Final-ARR-2011-12.pdf.
14
Although there are sources of surface water such as rivers, the cost of filtering these is
very high. However, the Urban Development Secretary has recently approved a water
scheme that allows exploitation of surface water sources (Meeting with the Principal
Secretary, Urban Development and Housing Department, 11 May 2011).
20You can also read