How to Catch a Unicorn - An exploration of the universe of tech companies with high market capitalisation - Europa EU
←
→
Page content transcription
If your browser does not render page correctly, please read the page content below

How to Catch a Unicorn
                   An exploration of the
                   universe of tech
                   companies with high
                   market capitalisation

                   Author: Jean Paul Simon
                   Editor: Marc Bogdanowicz

                   2016

                                              EUR 27822 EN
How to Catch a Unicorn
An exploration of the universe of tech companies with
              high market capitalisation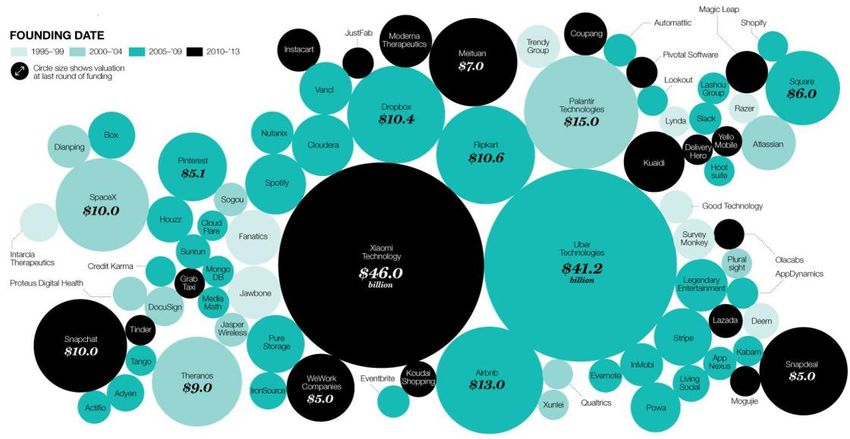
This publication is a Technical report by the Joint Research Centre, the European Commission’s in-house science
service. It aims to provide evidence-based scientific support to the European policy-making process. The scientific
output expressed does not imply a policy position of the European Commission. Neither the European
Commission nor any person acting on behalf of the Commission is responsible for the use which might be made
of this publication.

JRC Science Hub
https://ec.europa.eu/jrc

JRC100719

EUR 27822 EN

ISBN 978-92-79-57601-0 (PDF)

ISSN 1831-9424 (online)

doi:10.2791/893975 (online)

© European Union, 2016

Reproduction is authorised provided the source is acknowledged.

All images © European Union 2016

How to cite:
Jean Paul Simon (2016) ‘How to catch a unicorn. An exploration of the universe of tech companies with
high market capitalisation’. Institute for Prospective Technological Studies. JRC Technical Report. EUR 27822 EN.
doi:10.2791/893975
Table of Contents

Preface .............................................................................................................. 2
Abstract ............................................................................................................. 3

Executive Summary ........................................................................................... 4

   PART I - An exploration of the universe of tech companies
                with high market capitalisation
  1.    The age of unicorns ................................................................................ 6
    1.1   The sample ...........................................................................................9

  2.    Analytica: main observations ............................................................... 18
    2.1    Growth models: organic v. inorganic (M&A) ............................................. 18
      2.1.1 A dominant organic and two-steps growth model .....................................19
      2.1.2 A marginal but relevant M&A growth model .............................................21
    2.2. The role of the business environment ..................................................... 23
      2.2.1 A strong access to finance.....................................................................23
      2.2.2 A dense ecosystem of founding fathers (and mothers?) ............................35
    2.3    An R&D-intensive environnement ........................................................... 39

  3.    De Interpretatione: what can explain the unicorn phenomenon? ......... 41
    3.1    The technological trend: Unicorns are surfing on the internet mobile wave .. 41
      3.1.1 The deployment of mobile Internet, the role of smartphones. ....................43
      3.1.2 The rise of the apps economy ................................................................45
      3.1.3 Are all unicorns born mobile? ................................................................48
    3.2    The economic trends ............................................................................ 50
      3.2.1 Unicorns go global to make the best out of leapfrogging ...........................50
      3.2.2 Unicorns and the "transformation of everything else"? ..............................52
    3.3    Conclusions ......................................................................................... 54

  4.    Conclusion: a role for policies? ............................................................. 55
    4.1   Did Europe miss the mobile turn? ........................................................... 55
    4.2   Direct or indirect policies? ..................................................................... 58
    4.3   Regulating disruptions? ......................................................................... 59
    4.4   Promoting competition and innovation? ................................................... 61

References ...................................................................................................... 63

List of figures .................................................................................................. 71
List of tables .................................................................................................... 71
List of boxes .................................................................................................... 71

Appendix 1: List of investors ........................................................................... 72
Appendix 2: A side question ............................................................................ 76

                                PART II – Case Studies
                         is available as a separate document

                                                           1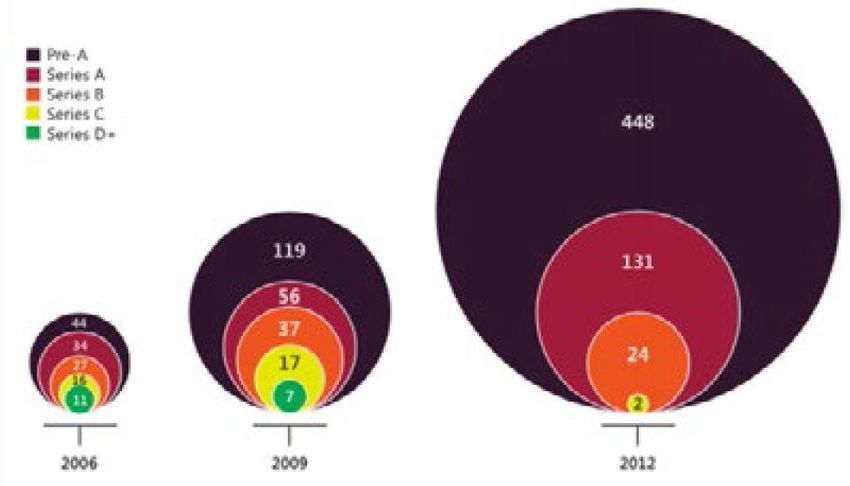
Preface
This report was prepared in the context of the three-year research project on European
Innovation Policies for the Digital Shift (EURIPIDIS), jointly launched in 2013 by JRC-
IPTS and DG CONNECT of the European Commission. EURIPIDIS aims to improve
understanding of innovation in the ICT sector and of ICT-enabled innovation in the rest of
the economy.
The project's objective is to provide evidence-based support to the policies, instruments
and measurement needs of DG CONNECT for enhancing ICT Innovation in Europe, in the
context of the Digital Single Market for Europe and of the ICT priority of Horizon 2020. It
focuses on the improvement of the transfer of best research ideas to the market.
EURIPIDIS aims to:
       1. better understand how ICT innovation works, at the level of actors such as
          firms, and also of the ICT "innovation system" in the EU;
       2. assess the EU's current ICT innovation performance, by attempting to
          measure ICT innovation in Europe and by measuring the impact of existing
          policies and instruments (such as FP7 and Horizon 2020); and
       3. explore and suggest how policy makers could make ICT innovation in the EU
          work better.

The report is available as two separate documents – Part I contains an analysis of
innovative tech companies with high market capitalisation, which is based on
investigation of a qualitative sample of 30 case studies, see Part II.

                                            2
Abstract
Technology companies with high market capitalisation (often called unicorns) have been
receiving a lot of attention and media coverage recently.

In general, unicorns are IT-centric (software mostly, but also hardware). They are often
rather young global companies that match unsatisfied demand with supply through the
production (which can easily be scaled up) of innovative and usually affordable services
and products. These are usually part of the mobile internet wave, and rely on
connectivity (high speed networks, mobile and fixed), new devices (smartphones,
tablets, phablets…) and the opportunities these bring. They are grounded in network
effects, and demand-side economies of scale and scope. They depend on a strong
favourable business environment, developing organically and building on fast expanding
markets (emerging economies, middle classes). They are Venture Capital-dependent and
the competition for funding can generate impressive (i.e. inflated) valuations. These
companies can be disruptive for other sectors and firms.

This report aims to document the phenomenon by investigating a qualitative sample of
30 companies that have recently been valued above the one billion dollar threshold. It
identifies some of their characteristics and the lessons to be learnt. The report has two
parts: Part I contains the overall findings of the investigation and some suggestions for
policy makers. Part II contains a detailed account of the case studies on which the
investigation is based. They are published as separate documents.

                                           3
Executive Summary
Technology companies with high market capitalisation (often called unicorns) have been
receiving a lot of attention and media coverage recently. The current hype does not fully
reflect reality and is often a simplification. To start with, unicorns are heterogeneous:
they are strongly defined by their financial aspects, and though these may have some
common traits, they are generally very diverse in terms of developments across sectors,
business models, organisational and growth models, etc.

This report aims to document the phenomenon by investigating a qualitative sample of
30 companies1 that have recently been valued above the billion dollar threshold. This is a
simple exploratory exercise that cannot capture all aspects of unicorns. It does, however,
identify some of their characteristics, offer speculative interpretations and discuss lessons
learned.

The report is based on a review of dedicated literature 2 , technical journals and trade
press articles, and on the analysis of annual reports of publicly-traded companies. The
publicly available information is scarce and highly heterogeneous. However, what has
been gathered allows us to make some observations about these companies:
1. Most of the companies in the sample grew organically, while only a few grew by
   acquiring new businesses in mergers, acquisitions or take-overs.
2. Unicorns all rely to some extent on venture capital for their initial funding, their
   developments, and their exits. The extent to which they need VC funds varies
   according to the strategy they adopt. For instance, an organic growth strategy
   requires less money than an inorganic model.
3. The founders are often “serial entrepreneurs” who have created other companies
   before. Most of them are seasoned business people with strong academic
   backgrounds.
4. Many unicorns have a significant level of R&D expenditure. 11 out 23 of the
   companies sampled are among the top global 2,500 R&D investors (in 2014).

Overall, these observations and the information found in each case study (Part II of this
report contains the case studies) point to two hypotheses as regards the conditions in
which the unicorn phenomenon developed:
-   Fully-fledged and fast evolving mobile internet networks had emerged, supported by
    the mobile internet wave, and increased device capabilities. These factors, combined
    with faster, higher bandwidth and more intelligent networks, paved the way to the
    wide adoption of advanced multimedia applications. As handsets become cheaper,
    and data connections more affordable, this phenomenon has gained pace. It allows
    access to a wide range of new apps, building on changes in patterns of consumption.
    It is moving from legacy push models to pull models, and is consumer driven and
    data centric.
-   Currently, the economy is undergoing a transformation, which the report calls the
    third phase of convergence. This means “the transformation of everything else”, that
    is the digital transformation of what makes up most of the economy. This is likely to
    include the sectors less affected up until now by this transformation. Peer-to-peer
    services, such as Uber, bridge the digital and the physical worlds in novel ways. The
    companies in our sample are extending the realm of products and services offered.

These hypotheses, illustrated by the heterogeneous universe of unicorns, allow us to
discuss some potential implications for innovation policies:

1
    23 unicorns and 7 “gems”.
2
    Atomico (2014, and 2015), Bloomberg/FT (2014), Ezratty (2014), Fortune (2015), A.Lee (2013,
    2015), Gilles and Marchandise (2013), Wall Street Journal (2015).

                                               4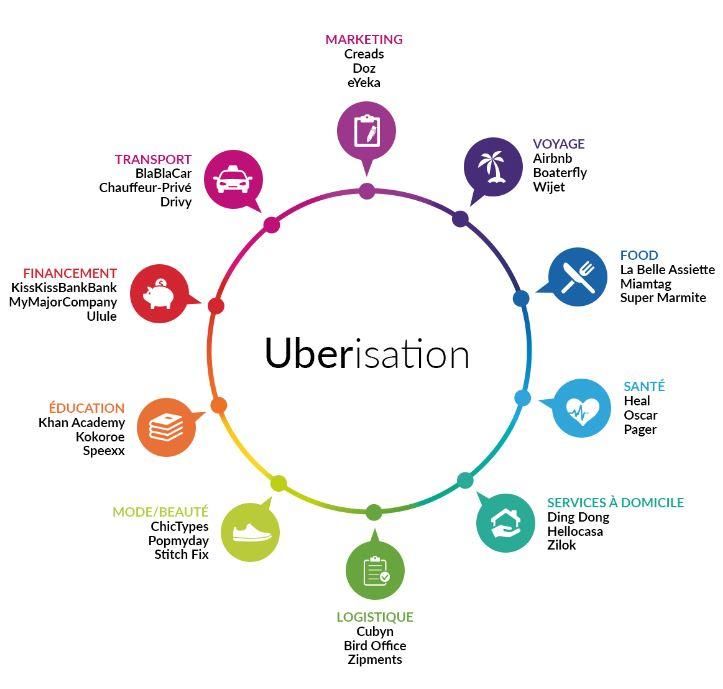
1. The development of unicorns is clearly market-led and does not appear to be the
   result of specific policies, at least directly. Indirect support, however, seems highly
   important. These companies benefited from existing measures like tax shelter, special
   support for SMEs in the EU and in the US, support to infrastructures, etc. Support for
   the business environment seems to have been crucial: for example, access to capital
   and also to the expertise needed from universities and research centres (some of the
   unicorns were spin-offs from labs).
2. The mobile wave has also been market-led. Most of the policies in the EU and the US
   were designed for the fixed telecommunications markets, to liberalize the sector or to
   regulate it. However, the outcomes have been different on each side of the Atlantic.
   One can then ask the question: did the EU miss the mobile turn? Was this because
   too much focus had been put on the deployment of new networks such as ultrahigh
   broadband? The question is relevant not only from the point of view of policy but also
   manufacturing.
3. As regards competition and regulations, the newcomers often operate in grey areas.
   Legacy players claim they are facing unfair competition from players that do not
   abide by the same rules and that the newcomers benefit from these asymmetries of
   regulation. All the companies in the sample claim they provide new services that were
   not possible or even blocked by incumbents which acted as gate-keepers. They claim
   that the incumbents are simply trying to bar new rivals and new business models.
4. Inevitably, change brings a wide range of business disruptions, and some of the
   sample - e.g. Airbnb, Amazon, or Uber - are perceived as disruptors. The question is
   whether digitization means positive disruption (“creative destruction”) or negative
   disruption (job losses). It is unclear whether the disrupters bring harm and whether
   incumbent outputs have been diminished. The economic debate is, by and large,
   dominated by sheer rhetoric, not evidence. Protecting incumbent businesses is likely
   to be a short-term strategy. At the same time, striking a balance between
   technological innovation and the protection of existing rights is a challenging task for
   policy makers.

Part II of this report provides company-level information, in so far as it is available, for
each of the case studies. To facilitate information gathering and allow comparisons,
information on each of the case studies is presented under the following standard
headings: Corporate History, Corporate Structure, Business Model, Financial Data,
Leadership, and References.

Chapter 1 introduces the sample.

Chapter 2 puts forward the lessons that can be learned from the sample and provides a
synthesis of some features. It introduces the models of growth identified in the study of
company documents. It then looks at the companies from a wider angle and investigates
their business environment (access to finance, background of founders). Finally, it
summarises what is known about their R&D expenditures.

Chapter 3 puts the unicorns into a broader perspective so as to better explain the
phenomenon. First it focuses on the way these companies have, in one way or another,
built on the latest technological wave - the mobile wave. Then it explores the way the
companies in the sample are having an impact on the various sectors of the economy.

Chapter 4 reviews the policy implications.

                                             5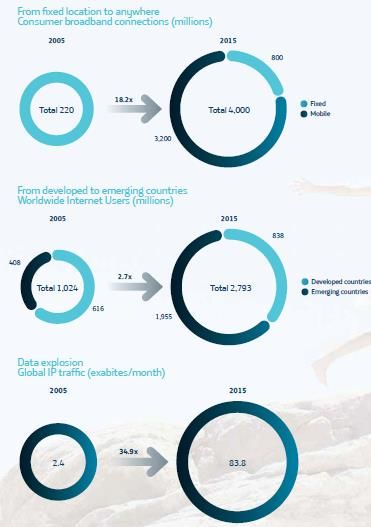
PART 1: An exploration of the universe of tech companies
                 with high market capitalisation

1.       The age of unicorns
This report looks at technology companies with high market capitalisation, focusing on
two types: young companies and more established companies. Young companies are less
than 10 years old. All of these companies have had their market capitalization valued, at
some stage in their life-cycle, at one billion dollars.
Venture capital practitioners have identified these criteria on the basis of experience and
experimentation. In 2013, Aileen Lee wrote a post in Tech Crunch about companies born
after 2003 that have been valued, at some stage in their life-cycles at a very high
threshold of market capitalization. She called them Unicorns.
Since then, a number of other publications have looked at young and high market
capitalisation companies. These publications include Atomico (2014, and 2015),
Bloomberg/FT (2014), Ezratty (2014), Fortune (2015), A. Lee (2013, 2015), Gilles and
Marchandise (2013), Wall Street Journal 3 (2015). They have chosen a USD 1 billion
market cap threshold, offer justifications for doing so. However, it is worth sounding an
initial note of caution: although the 1 billion market cap is an attractive way to track
companies, the market valuation per se may not be the best way to assess the economic
value of a company. Market valuation is another tale of inventive metrics (see Box 1 on
market cap and Box 3 on financial bubbles).
Box 1: Market capitalization and enterprise value: a tale of inventive metrics

Market capitalization (market cap) is the (theoretical) total market value a buyer would
have to pay for the whole company, the total market value of the shares of a publicly-
traded company. It is equal to the share price times the number of shares. Most of the
documents quoted in this report refer to market cap. Valuation of the firm is often used
and relates rather to market cap, although it may not be precise enough. As the value
varies according to the changes in share prices on the Stock Exchanges where companies
are listed, it is highly volatile. It should be added that stock prices are about
expectations, not performance.
The market cap criterion receives a lot of media coverage as it provides a simple and
often impressive indicator. For example, Apple has a market cap of USD 758.85 billion
(YahooFinance, 2015). But market caps fluctuate by nature according to the whim of the
financial markets, and may be affected by all kinds of “irrational exuberance”. This is why
investment gurus like Warren Buffet explicitly advise not to go for a valuation of this
kind, nor to invest in unheard of start-ups. Instead, he advises investing in solid well-
known brands that may or may not be undervalued and underrated.
Another value is the “enterprise value”: the theoretical takeover price. It is more
comprehensive than market cap, which only includes common equity. Enterprise value is
calculated as the market cap plus debt, minority interest and preferred shares, minus
total cash and cash equivalents. To give an example, as of April 2015, Twitter’s market
cap was valued at USD 33.26 billion and its enterprise value was USD 30.96 billion.
From a micro-economics or business management viewpoint, other criteria like revenues,
EBITDA (a measure of operating profit and net income), and, of course, profit provide
sound figures. Whenever these data are available, they have been fed into the case
studies accompanying this report (Part II).
Furthermore, while market cap in theory represents the value of future revenue streams
or dividends, it does not necessarily reflect the current situation. For instance, Uber with

3
     The report co-produced with Dow Jones, “The Billion Dollar Start-up Club”, is an interactive
     dataset.

                                                6
a revenue of just $1.2 billion was once valued at $18 billion, about 16 times its earning.
“Uber's valuation alone trumps the Gross Domestic Product (GDP) of countries like
Iceland, Zimbabwe and Haiti combined.”            Mangalindan (2015). However, leaked
numbers, published earlier this year by Bloomberg, showed that the Uber company had
losses of $470 million on sales of $415 million (DeAmicis, 2015).
The discrepancy between actual revenues and capitalisation can be dumbfounding:
without any “sizable revenues” (Chavez, 2014), Cyanogen was valued at nearly
USD 1 billion. Its CEO even claimed optimistically but rather oddly: "We are losing money
more efficiently than our nearest competitor (Hortonworks)." Similarly, Twitter had
impressive losses of nearly 42% of the year’s revenue.
"Silicon Valley is fuelled by fomo: the fear of missing out." (Bradshaw, 2015).
However, standard metrics such as profit after tax (PAT), EBITDA, and cash flow may not
be easily applicable to firms that are generating often impressive losses. Therefore,
investors came up with a vague valuation metric called annualized gross merchandising
value (GMV), or cost of goods sold (Verma and Dalal, 2015, see some data in the Alibaba
case study, Part II of this report). In the case of games, investors can use even more
“creative” metrics like the number of active users and/or paying users (daily, monthly,
see the case study of Zynga, Part II of this report).
Real revenues come from commissions that e-commerce companies get from sellers or
listing fees that they charge to list products on their site. This stream of revenues may
vary considerably. As noted with the case of Amazon, e-commerce companies often
operate with very tight margins (Distinguin, 2014, Simon, 2015). Amazon wins in a
volume-based game of aggregating lots of revenues on thin margins, through economies
of scale.
                                                                 Source: compiled by author
                www.gurusfocus.com, and http://finance.yahoo.com/q/ks?s=twtr+Key+Statistics

Lee (2013) in her original post identified 39 companies born in the US between 2003 and
2013 that reached the one billion dollar mark. These companies can be seen in Figure 1.

                            Figure 1: The original 2013 unicorn club

       Source: Lee (2013)

                                               7
Lee (2013) states that:
"The NVCA4 says over 21,000 internet-related companies have been funded since
2005; Mattermark5 says 24,000; and the CVR6 says 20,000 companies are angel
funded per year. So we assumed a ballpark 60,000 software and Internet
companies have been funded in the past decade.”
This contrasts sharply with the fact that she identified only 39 US-based software
companies as unicorns in 2013 (see Figure 1, the original 2013 unicorn club.). “About
.07% of venture-backed consumer and enterprise software start-ups become unicorns”
(Lee, 2013), 0.14% for the 182 unicorns identified worldwide in 2015. This is why she
adds: “it’s really hard, and highly unlikely, to build or invest in a billion dollar company”;
hence her using the term “unicorn” to describe "something extremely rare, and magical”.
Other publications have attempted to go further with these observations, but instead of
focusing like Lee on the US, they opened their investigations globally. The Atomico list is
the most comprehensive and consistent among the various sources investigated for this
study. Atomico provides a database of companies on which a sample can be built:
Atomico 7 (2015) identifies 182 such companies worldwide (see Box 2). The Atomico
report also focuses on young companies (less than 10 years old).
Box 2: The Atomico report
Atomico is an international venture capital firm that invests in technology companies
around the world. It claims to help the world’s most “disruptive technology companies” to
scale up and reach their full potential globally. Atomico was co-founded in 2006 by
Kazaa and Skype co-founder, Niklas Zennström.
In 2014, Atomico released an analysis of the 146 companies globally that have reached
the billion-dollar mark over the past decade. In May 2015, the updated report documents
182 unicorns. The report is an interactive dataset, which has been updated on a regular
basis (quarterly since January 2015).
The dataset gathered by the report contains information on 182 software companies, i.e.
“Companies where the primary business value is derived from software- and/or Internet-
driven products or services” founded since 2003 that have broken the billion-dollar
valuation barrier at one point in time. The dataset results from a very broad range of
publicly available sources, relying heavily on historical news stories and company press
releases to identify the dates and details of billion-dollar valuation events.
The report acknowledges a series of judgments the authors of the Atomico report made
about what should and should not be included:
- “First, in order to give us a 10-year horizon on data and trends, we include
companies that were founded in 2003 or later.
- Second, we include companies where the primary business value is derived from
software- and/or Internet-driven products or services. This includes both
consumer and enterprise focused companies and e-commerce businesses.
- Third, we include companies that have at one point in time reached a total
valuation of USD 1 billion or higher through any of the following events:
o Private market valuation, so long as it has been publicly disclosed. We do not
include companies where there has been no public confirmation of the
company having achieved a billion-dollar valuation through a private market
4
US National Capital Venture Association: http://www.nvca.org/
5
Data-driven marketing deal making: http://mattermark.com/
6
Center Venture Research publishes angel market analysis reports:
https://paulcollege.unh.edu/research/center-venture-research
7
We used several editions of the interactive report and observed some discrepancies between
numbers
8placement. This means that we’re missing some familiar names that you
might expect to see, such as LINE, Outbrain or Privalia8.
o M&A.
o Public market valuation - i.e. via IPO”.
As the report concentrates on software companies, it does not include hardware-driven
businesses linked to software such as handset manufacturers. For instance it explicitly
excludes Xiaomi “since hardware is central to the company.” The report recognizes that a
“grey area exists for companies which produce hardware but whose overall value
proposition is heavily dependent on software”.
The 182 companies are distributed across the following 15 sectors defined by Atomico:
Adtech (4 companies), Classified Directories (10 companies), Content (12), Content
consumer app (6), E-commerce/retail (40), Education (1), Enterprise app (36),
Enterprise data and infrastructure (10), Financial services (14), Food & drink (4), Gaming
(16), Healthcare (4), Security (9), Social (20), Travel & transportation (11).
The report reveals that the E-commerce sector leads with 40 companies, followed by
enterprise app sector with 36 companies, then social with 19, and gaming with 15.
Education lags behind, as does the food & drink sector. Healthcare is also an
underpenetrated sector. In terms of type of business; 68% (123) of the companies are
consumer-focused businesses, but with significant regional variations: for instance, 95%
of the 39 companies from China are consumer-focused.
It also reveals that globally China, with 39 companies, ranks n°2 behind the US, and
takes the lead for e-commerce (11 companies out of 32). A similar position is achieved
with the gaming activity (5 companies out of 15), but half the game companies come
from Asia.
Source: http://www.atomico.com/ https://www.crunchbase.com/organization/atomico#/entity
This report uses the one billion dollar and 10 year thresholds only as a starting point. It
also includes other high market capitalisation companies. It investigates older
companies 9 to see how longevity affects high market capitalisation. It also includes
"gems" or young companies that have not quite reached the market capitalisation
threshold in order to observe the growth path of (potential) high market capitalisation
companies.
This chapter first explains how the company sample was constructed. Then it describes
some of the features observed within these companies.
1.1 The sample
Criteria
The sample in this report was not intended to be statistically representative. Its aim was
to provide enough diversity (but not comprehensive) to explore some of the main
features of the high market cap phenomenon. Case studies have also been included in
this report (Part II) in order to bring qualitative elements to the analysis.
8
Rovio, however, the Finnish creator of the game “Angry Birds”, although founded in 2003, is an
example of a company that is not included in the Atomico list with no clear explanation as to
why. The company went public in 2012 and has a market cap hovering around USD 4.2 billion
(WSJ, 2014, but no precise data available). At the time of its IPO, Rovio was estimated to be
worth USD 6 - 8 billion by analysts in 2012.
9
GAFA companies as suggested by the IPTS.
9Tables 1 and 2 provide the full sample of companies. Our sample was built around 4
criteria: sector, age, geographic location, and financial. To make this work
comparable to previous work, it follows similar criteria.10
The sector categories follow the previous literature on high market capitalization.
Specifically, Lee (2013, 2015) categorizes companies according to their business model.
She distinguishes between (1) consumer companies, where the primary customer is a
consumer and (2) enterprise companies. Each category is further divided into two:
consumer companies are divided into e-commerce companies and audience business
models; and enterprise companies are divided into “Software as a Service” (SaaS)
companies and enterprise business. She defines the 4 resulting business model
categories as follows:
1. Consumer companies:
- E-commerce: companies where a consumer pays for a good or service through
the internet or mobile: e.g. Uber and Airbnb;
- Audience: free for consumers, monetization through ads or leads (the
freemium model is important for apps such as games): e.g. Twitter.
2. Enterprise business companies:
- SaaS: users pay (often via a “freemium” model) for cloud-based software,
Akamai is the leading provider of cloud;
- Enterprise: companies pay for larger scale software: e.g. Criteo.
Atomico (see Box 2) uses different sector categories: e-commerce, enterprise app, social,
gaming, etc. For completeness, we have tried to include companies from all business
model categories and sectors (Atomico & Lee).
The age category has been set above/below 10 year old in order to follow the
literature. The sample attempts to draw a global sample: companies from every
region. Finally, the financial criterion revolves around the USD 1 billion valuation.
This criterion has obvious drawbacks that are discussed in more details in Box 1.
Sample
The 23 unicorns in our initial sample can be regrouped in two set of companies: (1)
companies 10 years old or younger with a USD 1 billion market valuation; (2) older
companies with high market valuation over USD 1 billion. The following paragraphs
explain in more detail how these companies were selected.
The first set of companies proposed by A. Lee (see Figure 1: The original 2013 unicorn
club) concentrated on US-based software companies. The Atomico report (2014, 2015)
recognises the global spread of these software companies but takes into consideration a
ten year period only.
1. Our first set of 13 "young" companies was selected out of the Atomico 2015
report: Airbnb, Cloudera, Criteo, Flipkart, Garena, KakaoTalk, King.com11, Rocket
Internet, Spotify, Twitter, Uber, Xiaomi, Zynga. These companies were chosen
because they were young tech companies with high capitalisation, from a large
variety of sectors.
The companies were selected globally, with a bias towards EU companies: Criteo,
King, Rocket Internet, Spotify. In addition, the European fast growing e-
commerce company, Allegro (1999),12 was identified during the investigation and
included in the sample.
10
For more details explaining these criteria, we refer the reader to the work of Lee (2013, 2015)
and Atomico (2014, 2015).
11
Early bird, King is like a generational outlier in this category
12
Even if its market cap was lower than the threshold.
102. A second set of 10 "old" companies included Google (1998), Apple (1976),
Facebook (2004) 13 , and Amazon (1994). These four companies are often
referred to as GAFA14. Some would not have qualified as unicorns within the first
10 years of their existence. However as Table 1 reveals, they are now leading
companies in terms of market cap, and provide a useful benchmark.
In addition to the above four companies, we included the Chinese generational
equivalent of the GAFA group to balance the sample geographically. These were
the BAT 15companies (Alibaba (1999), Baidu (2000) and Tencent (1998)).
Since Allegro (Poland) 16 , and Tencent (China, see below) were included in our
sample and both are subsidiaries of Naspers (South Africa), the third largest
global player in e-commerce, this company (1915) was also included. Shazam
(1999) was also included as an example of an "old" European software company.
Finally, to cover all business models as described by Lee, we also included Akamai
(1998), a US-based “Software as a Service” company. Table 1 presents these 23
companies, categorized by business model (as per Lee (2013, 2015)) and ordered
by region and market capitalization.
Table 1: Distribution of the sample of 23 selected unicorns
By business model and region, ranked by market cap (2014)
Company Year Market cap, billion Revenues Profit Number of
creat USD unless otherwise (-/+) employees
ed indicated
(201417)18
Consumer
companies:
e-commerce
US
Apple 1976 USD 737.54 / USD 183 billion ++ 92600 +
231. 8
Google 1998 USD 362.56/ USD 66 billion ++ 40000
131
Facebook 2004 USD 226.37/ USD 12.46 billion + 6337
17.89
Amazon 1994 USD198.28/ USD 88.98 billion -/+ 117300
54.5
Uber 2009 USD 41 USD 415 million -- 1000/
5000
Airbnb 2008 USD 10 USD 45 million - 600 +
Asia
Alibaba19 1999 USD 204 USD 8.4 billion + 22072
Tencent 1998 USD 200 EUR 12 billion ++ 27 690
Baidu 2010 USD 71.58 USD 7.9 billion ++ 40500
Xiaomi 2010 USD 46 RMB 74.3 billion + 8000
(around EUR 11
billion)
Flipkart 2007 USD 3 in 2014 Rs 28.46 billion - 20 000
USD 15 expected end (around EUR 413
of 2015 million)
13
Latecomer, Facebook is a generational outlier in this category
14
Google, Amazon, Facebook, Apple.
15
Baidu, Alibaba, Tencent.
16
40 million users, 100 e-commerce-related websites.
17
If year differs it appears in the table.
18
2015, for GAFA companies, the second figure (in bold) gives the total assets.
19
We have included Alibaba under the “consumer companies” category as an e-commerce
company which seems logical as the company claims to be the largest online and mobile
commerce company. However, at the same time, the Chinese global leader makes it clear to be
a B2B and not a consumer oriented company.
11Europe
Rocket 2007 EUR 2.6 billion EUR 137.9 million - 1 282
Internet
(Germany)
RoW
Naspers 1915 EUR 64 billion EUR 105 billion + 2800020
(South Africa)
Consumer
companies:
audience
US 2006
Twitter 2007 USD 33.25 USD 1.4 billion -- 3. 638
Zynga 2007 USD 2.27 USD 690 million - 2000+/-
Asia 2006
KakaoTalk 2009 USD 5 USD 203 million + 700 +
(South Korea)
Garena 2009 USD 2.5 USD 200 million NA + 2000+
(Singapore) likely
EU 2006
Spotify 2003 USD 8.4 USD 747 million - NA
(Sweden) (2013)
King.com 1999 USD 5.28 USD 2.6 billion + 600+
(Sweden/UK)
Shazam (UK) 1999 EUR 1 billion GBP 9 million - 200
Enterprise 2008
companies:
SaaS
US
Akamai 2005 USD 13.42 USD 1.96 billion + 5105
Enterprise
companies:
Enterprise
US
Cloudera 2008 USD 1.2 USD 100 million - 701
EU
Criteo (e) 2005 USD 1.8 EUR 612 million + 1300
(2013)
Source: compiled by the author from references listed in the case studies, companies’ websites, as
well as from Atomico (2014, 2015), Crunchbase, CBInsights.
3. Our third set of companies complements the set of unicorns. It is composed of
"young" companies (10 years old or younger) with market valuations estimated
just below the one billion dollar threshold. We identified 7 "close-to-becoming"
unicorns and called them “Gems” (see Table 2). We did not include these 7
companies in Table 1 as most of the data in the columns would be missing. These
companies are private companies that do not disclose their annual reports. Two
out of the 7 companies, Cyanogen and Storm8, are thought to be the closest to
the billion market cap (see case studies, in Part II).
20
Excluding associates and joint ventures.
12Table 2: 7 Gems
Company Year of Market Revenues Business Number of
foundation Cap model employees
US
Flurry (US)21 2005 NA NA Enterprise NA
Cyanogen (US) 2009 USD 1 NA Enterprise NA
billion
Storm8 (US) 2009 USD 1 400-500 (estimated Consumer NA
billion for 2011)
AppAnnie (US) 2010 NA NA Enterprise 300+
Meerkat (US) 2015 NA NA Consumer NA
Asia
Yodo1 (China) 2011 NA NA Consumer NA
EU
Buongiono 1999 NA EUR 239 million Consumer 600 (2015)
(Italy/Japan) (2011)22
Source: compiled by the author from references listed in the case studies, companies’ websites,
and Crunchbase.
In total, 30 companies were included in the sample:
US: 10 unicorns and 5 gems
Asia: 7 unicorns (India, Singapore, South Korea and 4 for China) and 1 gem (China)
EU: 5 unicorns for the EU (France, Germany, UK and 2 for Sweden) and 1 gem
(Italy/Japan).
Africa: 1 unicorn.
Table 3 categorizes our 23 unicorns according to Lee’s (2013) business model categories.
Table 3: The distribution of the 23 unicorns of the sample according to the main business
models classification of Lee
Business Model Companies Companies Companies Companies
(US) (10) (Asia) (7) (EU) (5) (ROW) (1)
Consumer Airbnb, Amazon, Alibaba, Baidu, Rocket Internet, Naspers
companies Apple, Facebook, Flipkart, Tencent, Group
E-commerce Google, Uber, Xiaomi.
King, Shazam,
Audience Twitter, Zynga Kakao Talk, Garena Spotify
Enterprise
business
companies
SaaS Akamai
Enterprise Cloudera Criteo
Source: author's assessment
Table 4 shows all 30 companies according to the sectoral distribution used by Atomico
(2015). Table 4 incorporates the gems.
21
Flurry was acquired by Yahoo in 2014.
22
Buongiorno went public in 2003 but for an undisclosed account. The company was acquired,
later in 2012, by the Japanese telecom operator NTT Docomo, for an amount estimated
between EUR 200 and 300 million. The annual report does not break down the revenues of the
subsidiaries.
13Table 4: The distribution of the full sample of 30 companies23 according to the sector
classification of Atomico
Companies in Number of Number of Companies listed per
this report companies from companies in sector in the Atomico
Sector categorised this report the Atomico report (2014)
per sector report
(Gems
included)
Adtech Criteo EU: 1 US: 2 AppNexus (US), Criteo
EU: 1 (France), InMobi (India),
Asia: 1 Rocket Fuel (US)
Content Buongiorno EU: 3 US: 2 91 Wireless (China),
Shazam Asia: 6 Baofeng (China), iQiyi
Spotify EU: 2 (China) LeTV (China),
Magic Leap (China),
Shutterstock (US),
Soundcloud (Germany),
Spotify (Sweden),
YouTube (US), Youku
(China)
E-commerce/ Alibaba US: 3 US: 11 55tuan (China), Autohome
Amazon China: 3 EU: 5 (China), Beibei.com
retail
Apple India: 1 Asia: 16 (China), Coupang (South
Baidu EU: 1 Korea), Etsy (US), Fab
Flipkart Africa:1 (US), Fanli (China),
Google Farfetch (UK), Flipkart
Naspers (India), Gilt (US),
Rocket Internet Groupon (US), Home 24
Tencent (Germany), Houzz (US),
Instacart (US), JD.com
(China), JustFab (US),
Koudai (China), Lemabang
(China), Lashou.com
(China), Lazada
(Malyasia), LivingSocial
(US), Meituan (China),
Mogujie (China), Powa
Technologies (US),
RetailMeNot (UK), Rocket
Internet (Germany),
Snapdeal (India), VANCL
(China), VIPshop (China)
Warby Parker (US),
Zalando (Germany), Zulily
(US)
Enterprise Akamai 5 (US ) US: 11 Cloudera (US), Docker
data AppAnnie (US), Fusion 10 (US),
Cloudera HortonWorks (US), Mongo
and
Cyanogen DB (US), Nicera (US),
infrastructure
Flurry Nimble Storage (US),
Nutanix (US), Pure
Storage (US), Soft Layer
(US),
23
Xiaomi is not included as it escapes the Atomico categorization designed for software
companies.
14Gaming Garena US: 2 US: 4 Changyou (China), Colopl
King Asia: 2 EU: 3 (Japan), Garena
Storm8 EU:1 Asia: 8 (Singapore), Gree
Yodo1 (Japan), Kabam (US),
Zynga King.com (Sweden),
Machine Zone (US),
Mojang (Sweden), Oculus
VR (US), Ourpalm (China),
Perfect World (China),
Supercell (Finland), Youzu
Interactive (China),
ZQGames (China), Zynga
(US)
Social Facebook US: 3 US: 13 Facebook (US),
Kakao Asia: 1 EU: 1 Instagram (US), Kakao
Meerkat Asia: 4 (South Korea), LinkedIn
Twitter RoW: 2 (US), Mobli (Israel), Momo
(China), Nextdoor (US),
Pinterest (US), Sina Weibo
(China), Skype (Sweden),
Slack (US), Snapchat
(US), Tango (US), Tumblr
(US), Twitter (US),
Vkontakte (Russia),
WhatsApp (US), YY
(China), Yammer (US)
Travel & Airbnb US: 2 US: 3 AirBnB (US), BlaBlaCar
transportation Uber EU: 1 (France), Didi Dache
Asia: 4 (China), HomeAway (US),
RoW: 1 Kayak (US), Kuadi Dache
(China), Olacabs (India),
Qunar (China), Uber (US),
Waze (Israel).
Source: author's assessment and Atomico report (2014).
15Box 3: Skyrocketing fund-raising: the unicorn bubble?
The revenue gap? Looking for “sizable revenues”
The phenomenon of skyrocketing fund-raising and valuations has been described by O.
Ezratty (2014) as “Uberisation” 24 . This phenomenon cannot but remind us of what
happened with the “dot.com bubble”, the “irrational exuberance 25 ” to quote the then
Federal Reserve Board Chairman, Alan Greenspan, and more recently with the financial
crisis (the subprimes bubble). This raises a question about the sustainability of the
unicorn phenomena. Similarities are being noted, and numerous analysts are stressing
the risk of another financial bubble. They highlight these huge valuations, pointing out
that the valuations commanded by these companies still need to match up with the
revenues they are bringing in now, or will bring in, in the future (Saxena, 2015).
The Chinese VC market also seems also to be bullish, as indicated - not without caution -
by CEOs of leading Chinese companies (Custer 2015a, b 26). In April 2015, Baidu’s CEO,
Li, told China’s Securities Regulatory Commission: “Everybody knows that right now the
start-up scene is very hot. All kinds of VCs are camped out in the coffee shops around
Baidu HQ, talking with our employees and trying to get them to leave and do start-ups.
What do they think a golden start-up team is? It’s a Baidu tech guy, a Tencent product
guy, and an Alibaba operations guy. For these kinds of people, getting start-up funding is
very easy” (Custer, 2015a)27. Hubris?
However, VC KPCB claims that, in 2013, technology IPOs and venture funding were far
below the peak level of 1999-2000 (around 70% lower: KPCB, 2014 report: 22-23). The
IPO data from Jay Ritter’s website (University of Florida)28 confirms this assessment.
Fluctuating valuations
While 1 billion can seem as arbitrary as any round number, it can seem even more
capricious when we look at it more closely. High market valuations can be poor
predictors. “Uber’s valuation does not guarantee it will be the next long-term superstar.”
(Ramadan et al, 2014). Furthermore, private valuations can disagree with public
valuations and when unicorns go public, they can experience a pullback as happened
with Facebook.
This also happened to King. After the huge success of its hit mobile game Candy Crush
Saga, King Digital Entertainment went public in 2014. However, its IPO failed to attract
the expected amount, and shares fell (Entis, 2014). Finally, the company raised a sound
USD 500 million in March 2014 (Bischoff, 2015). Interestingly, the same thing happened
with another mobile game company, Zynga (the maker of FarmVille) which had a
successful floatation, when it was valued at around USD 7 billion. Then, however, shares
prices fell by 80% until 2012 (see Annual Report, 2012: 28, 2013: 38, and case study,
Part II of this report).
There are other examples: Hortonworks (an open-source software company) initially
valued at USD 1 billion by private investors only reached a market cap of USD 666
million when it went public in December 2014 (Griffith and Primac, 2015). To give
24
Schlafman (2015) speaks of “Uberification” of the US economy.
25
In a speech given at the American Enterprise Institute during the Dot-com bubble of the 1990s.
The phrase was interpreted as a warning that the market might be somewhat overvalued.
26
JD.com CEO.
27
Custer (2015c) reports another anecdote about China’s red-hot start-up scene: “One of the
latest (and most unusual) start-ups to get funding is a mobile app aimed at China’s dancing
grannies – the old ladies you see group dancing in supermarket parking lots and parks. Laugh if
you want, but the app just pulled in “millions” in RMB (hundreds of thousands of US dollars, at
least) from” a VC arm of the Wuhan Economic Development Group and a Shenzhen-based VC
called The Dreamchaser Fund”.
28
https://site.warrington.ufl.edu/ritter/ipo-data/
16another example outside the sample, companies can have a “down round”, as happened
with LivingSocial29. The company’s assessed value fell from USD 5.7 billion to nearly a
quarter of that in 2013 (Shontell, 2013, Tantry, 2015).
At the same time, a trio of San Francisco-based experts30 at Play Bigger Advisors, have
identified two trends that may account for the bold size and increase of valuations. The
first is the decrease in “time to market cap” (Figures 2 and 3): for VC-backed technology
start-ups created since 2009, “the rate at which their values have risen is three times
faster today compared to just a decade ago”. On average, 14 companies have reached a
billion-dollar valuation each year in the past decade according to Atomico (2014). Their
average time to reach this valuation has been six years from founding. It should be
noted that 2007 was a vintage founding year, with the most billion-dollar companies (25
companies). Ramadan et al (2014) state that, for the moment, “Uber has become the
time to market cap champ”. The trend may be observable, but it does not mean it may
not signal some kind of bubbling up.
The second trend is that there is a “winner takes all dimension” in new tech markets,
which are being dominated by one company. Ramadan et al label the “companies that
define, develop and dominate new markets” as ‘category kings’. According to VC investor
Salomon (2015) “Valuation tends to accrue in non-linear fashion, favouring the leader”.
He gives the example of Salesforce.com which is worth over USD 40 billion, whereas its
once worthy, but slightly smaller, adversary UpShot sold to Oracle for under USD 100
million.
Armageddon and cockroaches
The 40% drop experienced in August 2015 on the Shanghai exchange (China’s ‘Black
Monday’) brought a touch of pessimism. A financial pundit noted “In the event of nuclear
economic Armageddon, unicorns might just return to being an endangered species once
more, and the only things left will be cockroaches and early-stage start-ups”(Hall 31 ,
2015).
In a deteriorated economic environment, exits are likely to become more difficult,
especially at these mushrooming amounts. Outsized valuations, especially if those
valuations cannot be reasonably tied to revenues as noted earlier, may be far more
difficult to sustain. As tweeted by another famous investor, B. Gurley32 (quoted by Hall):
”we may be nearing the end of a cycle where growth is valued more than profitability”.
An open question.
29
Founded in 2007: an app for Android smartphones to check for daily special deals and offers in
a city. The CEO resigned and the company was bailed out by Amazon, an initial investor in the
company.
30
Al Ramadan, Christopher Lochhead and Dave Peterson are partners at Play Bigger Advisors, a
San Francisco-based firm that coaches technology executives to build market-leading
companies.
31
From the VC Golden Gate Ventures.
32
Bill Gurley from Benchmark, considered as one of ‘technology’s top dealmakers’ invested in
Uber, see appendix, list of investors.
172. Analytica: main observations
This chapter brings together the main observations on the case studies (See Part II). The
first section introduces models of growth mentioned in the documents available for each
company. The following section looks at the companies from a wider angle and
investigates the business environment of the “unicorns” (access to finance, background
of founders). The last section gathers information on their R&D expenditures.
2.1 Growth models: organic v. inorganic (M&A)
If one looks at the growth models adopted, the companies in the sample can be split into
two groups: those with organic growth (OG) and those with inorganic growth (mergers
and acquisitions (M&A)).
The companies which adopted the first model (OG) achieved growth by increasing output
and enhancing sales. Most of the companies we looked at are growing with the high-tech
markets in which they operate: their business expands with the market. Companies in
the second group grow through the acquisition of new businesses by way of mergers,
acquisitions and take-overs.
Table 5 indicates the main approach taken by the 23 unicorns, ranked by region and
market caps. It should be noted that companies often blend the two approaches, either
historically (starting to acquire companies after a period based on organic growth:
Google, Facebook, Apple) or synchronically. Hence, we have classified each company
according to what appears to be its “dominant” model. For instance, the GAFA companies
Apple and Amazon appear to have grown mostly organically. Google and Facebook,
however, have grown mostly through investments and acquisitions.
When a company blends the two models, it is often difficult to assess whether a targeted
company was bought mainly so that the buyer could acquire a technology (rather than
develop the technology in-house), or so that it could grow by acquiring markets shares
from the company bought. For instance, in 2012, Akamai bought its rival Cotendo33 and
acquired, that same year, Blaze Software, a company that owns a technology which can
help to accelerate the speed of websites34. Some companies, however, have stuck to a
single model: for example, Xiaomi or Zynga have consistently opted for organic growth,
whereas Flipkart and Rocket Internet have chosen to grow through mergers and
acquisitions.
A number of companies have blended organic growth and mergers and acquisitions,
either in the same period or after a certain amount of time, as illustrated by Tencent
investing in South Asian companies. Both Alibaba and Xiaomi are inking partnerships to
enter the Indian market. Xiaomi announced its intention to become an “Indian company”
by establishing a start-up, with local R&D and manufacturing in India (Waring, 2015a). In
April 2015, Indian investor and industry leader Tata invested in Xiaomi. Xiaomi continues
to grow organically, but at the same time it is investing in more and more start-ups,
especially in the burgeoning business of smart homes.
Most Asian companies opt for the organic model, which seems to be close to a “standard”
model for industrial growth. Often starting in their home country, these companies are
betting on the expansion of demand-driven markets, driven by:
- growth of the mobile market,35
- emerging economies,
- emerging middle-classes36,
- and young customers.
33
A smaller Israeli rival.
34
And optimizes load times while cutting bandwidth costs.
35
With the exception of Indian Flipkart.
36
China’s middle class reached 109 million in 2015, and overtook the US’s for the first time ever,
according to a Credit Suisse report released 13 October (quoted by Huang, 2015).
18Table 5: Models of growth of unicorns, ranked by region and market caps (2014)
Organic Mergers and
Company Growth model Acquisition Profit
(OG) model (M&A) (+/-)
US
Apple (1976) OG ++
Google (1978) MA ++
Amazon (1994) OG -/+
Akamai (1998) OG +
Facebook (2004) MA +
Twitter (2006) OG --
Zynga (2007) OG -
Airbnb (2008) OG -
Cloudera (2008) OG -
Uber (2009) OG --
Asia
Tencent (1998) OG ++
Alibaba (1999) OG ++
Baidu (2000) OG ++
Kakao Talk (2006) OG +
Flipkart (2007) MA --
Garena (2009) OG n.a.
Xiaomi (2010) OG +
EU
Shazam (1999) OG -
King.com (2003) OG +
Criteo (2005) OG +
Spotify (2006) OG -
Rocket Internet (2007) MA --
RoW
Naspers (1915) MA ++
Source: Crunchbase, compiled by the author.
2.1.1 A dominant organic and two-steps growth model
Companies that opt for organic growth are often technology-centric companies like
Xiaomi, Tencent, and other games companies like King. 18 companies in our sample
have adopted this model, but even among these companies there are many differences.
We identified two main approaches: which approach these companies took depended on
which market they first entered.
First, some companies opted to enter the global market from the outset. For example,
Criteo built on its original tailored technology (the Criteo Engine: multiple machine
learning algorithms) and had a global reach from its inception. Akamai and Cloudera
19clearly aimed at the global market from the start. Games companies Kind and Zynga,
also had global strategies, and rode the mobile wave to distribute their games worldwide.
Second, some companies elected to grow organically by first introducing their product in
their home market and then expanding globally. We refer to this approach as the two-
step approach, often called a lead market strategy (Beise, 2004, see Box 4).
One reason for taking a two-step approach may be the size of the domestic market in
which companies launch their first products: the Chinese market and the US market offer
large opportunities for an initial development.
Box 4: Lead markets
The two-step approach: a lead market strategy
Lead Market is a term used in innovation theory and denotes a country or region, which
pioneers the successful adoption of an innovative design. It sends a signal to other
markets which are lagging behind, which helps to trigger a process of global diffusion.
Marian Beise, one of the foremost propounders of this theory states: "Innovations that
have been successful with local users in lead markets have a higher potential of
becoming adopted world-wide than any other design preferred in other countries"
Source: Beise, (2004)
Chinese firms have been able to capture a significant portion of the global smartphone
market and Internet services by simply capitalizing on their massive domestic market.
These companies are highly profitable as illustrated by Table 6.
For instance, KakaoTalk has most of its user base in its home country Korea. It is a good
example of a company which has tried to benefit from first-mover-advantage by building
a strong enough customer base at home before entering other markets, as it is doing
now in South-Asia. Similarly, Xiaomi is now addressing foreign markets after growing in
its home market.37 The way to achieve international expansion may differ over time and
space, but the target remains the same. It is probably significant that the founder of
Singapore’s 38 games company, Garena, named his company using a play on words:
“global arena”.
The only example of a country-by-country market strategy is Spotify. This is probably
due to the constraints of copyright negotiations, and the fact that rights holders
negotiate rights on a geographical basis, market by market, claiming that demand is
territorial.39
Their global ambitions form a striking aspect of these high market capitalization
companies.
In our sample, the US and Asian companies have generally opted for a two-step strategy,
supported by their large domestic markets.
The EU companies in our sample have all opted for a one-step strategy. Surprisingly,
these companies did not specifically target the EU internal market even though it is made
up of 500 million people, and offers substantial opportunities for the sale of digital
products and services. Table 6 attempts to allocate our unicorns to the “one step” group
or the “two steps” group and also gives some indication (proxies) of the size of their
market.
37
Its new Chinese competitor, One Plus, went global in 2013.
38
A small market (population: around 5.5 million) for sure, but a significant international IT hub.
The company has 28 million monthly active users.
39
Similarly, CEO Reed Hastings announced early in 2016 the launch of Netflix’s streaming services
in 130 more countries. This demonstrates the global ambitions of these companies, even
though they are obliged by copyright laws to solve the issues one country at a time.
20Table 6: Market strategy of unicorns40
Companies 1 step 2 steps Size of market41
US
Airbnb x 25 million guests, in 34 000 cities, 190 countries
Akamai x Serves top 30 media and entertainment companies.
170 000 servers in more than 1 300 networks and
over 100 countries.
Amazon x 10 online marketplaces, 2 in North America, 5 in
Europe, 3 in Asia.
Apple x 460 retail stores in 17 countries and an online store
available in 39 countries.
Cloudera x 20 countries, 1 400 partners
Facebook x 1.248 billion active users
Google x More than 100 languages and in more than 50
countries
Twitter x 288 million active users
Uber x 56 countries, 200 cities
Zynga x 100 million monthly users
ASIA
Alibaba x 255 million active buyers worldwide
Baidu x 642 million users
Flipkart x 26 million registered users
Garena x 17 million monthly active users on PC, 11 on mobile
Kakao x 140 million users
Tencent x QQ 848 million active users
WeChat 549 million active users
N°1 worldwide for video games
Xiaomi x 61.12 million phones sold in 2015
EU
Criteo (FR) x 37 countries, 4000 e-commerce companies
King (UK) x 356 million average monthly unique users
Rocket Internet x 110 countries (Not US, China)
(D)
Shazam (UK) x 100 million active users
Spotify (SW) x 58 markets, 60 million active users
RoW
Naspers x More than 130 countries
Source: compiled by author.
2.1.2 A marginal but relevant M&A growth model
We have only five companies which have opted to adopt an M&A growth model 42
(Google, Facebook, Flipkart, Naspers, and Rocket Internet) within diverse global reach
40
As Spotify is aiming at the global market but was constrained by commercial negotiations for its
deployment, for simplicity, it is included in the one step category.
41
As explained in Box 1, metrics vary. The table gives what looks like the relevant metrics for the
market where the company is operated.
42
M&A strategy can be divided into three strategies: (1) vertical M&A; (2) horizontal M&A; and (3)
diversification M&A. Vertical M&A refers to the acquisition of companies within the value chain
and horizontal to the acquisition of competitors. Diversification M&A refers to the attempt to
enter new markets. The author thanks Garry Gabison (IPTS) for this clarification.
21You can also read