DEVELOPMENT AND ACCESS TO INFORMATION 2019 - QUALITY EDUCATION DECENT WORK AND ECONOMIC GROWTH REDUCED INEQUALITIES CLIMATE ACTION PEACE ...
←
→
Page content transcription
If your browser does not render page correctly, please read the page content below
DA2I

DEVELOPMENT AND ACCESS
TO INFORMATION 2019
QUALITY EDUCATION • DECENT WORK AND ECONOMIC GROWTH • REDUCED
INEQUALITIES • CLIMATE ACTION • PEACE, JUSTICE AND STRONG INSTITUTIONS

                                                                               DA2I.ifla.org
                                                       DEVELOPMENT AND ACCESS TO INFORMATION 2019   A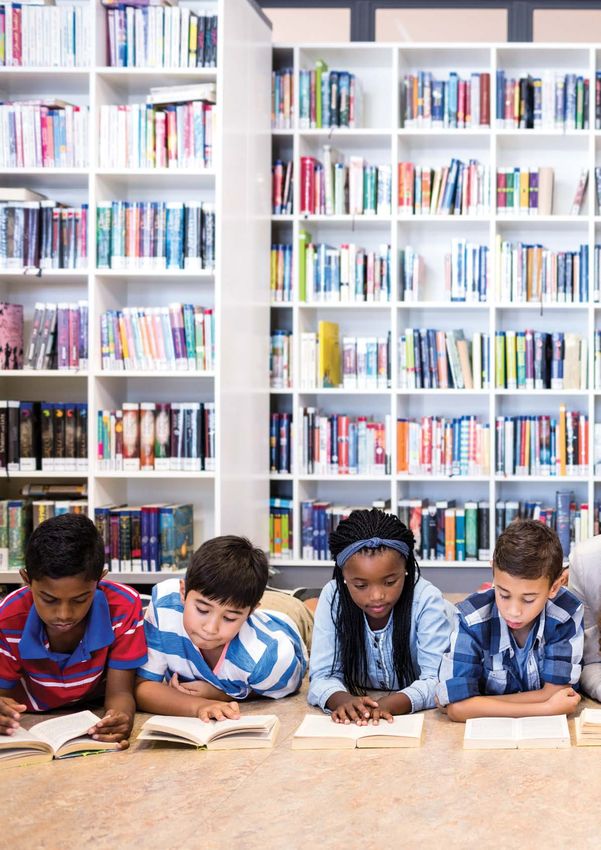
Foreword

The International Federation of Library Associations and Institutions
(IFLA) is the leading international body representing the interests of                 The role of information in our societies has never                           GLÒRIA PÉREZ-SALMERÓN
library and information services and their users. It works to promote a                                                                                             President, International Federation of Library
strong and globally united library field as a driver of literate, informed and         been greater. It is an enabler, a raw material, a                            Associations and Institutions
participatory societies, and places the importance of access to information
at the heart of its values. With members in almost 150 countries, it is both           source of innovation and creativity. To give everyone
the global voice of the library and information profession, and the primary
hub for developing standards, sharing good practices, and empowering                   access to it is to ensure that everyone has the
and building connections between libraries and library associations
globally.                                                                              opportunity to learn, grow, and take better decisions
The Technology & Social Change Group (TASCHA) at the University of                     for themselves and for those around them.
Washington Information School explores the role of digital technologies
in building more open, inclusive, and equitable societies. TASCHA is a
nexus for multidisciplinary research whose work has helped international           In an information age, this is a necessity. Those who lack access are left
organizations, governments, civil society organizations, and public                behind, deprived of a key means of improving their own situation, cut off
libraries in the United States and more than 50 other countries.                   from cultural, economic, social and civic life.

We would like to acknowledge the contributions of our guest authors, as            This is why I am so convinced of the power of libraries as motors of
well as of the teams at IFLA and TASCHA whose work made this report                change. They are guarantors of this access, not only through the physical
possible, in particular Maria Violeta Bertolini and May Oostrom-Kwok               possibility to find a book or get online, but by providing the space and
(IFLA), and Chris Jowaisis, Chris Coward and Doug Parry (TASCHA)                   support to ensure that everyone can realise the potential of information.

The original report was created thanks to the inputs of many people who            I believe strongly that even as more and more of our lives take place
helped develop the concept and select the indicators used. Their names             online, libraries have become more vital – as physical meeting points, as
are highlighted in the 2017 report, and their contribution is still felt in this   places to ask for advice, as institutions with a clear vocation to help their
edition.                                                                           communities.

We wish to offer particular thanks to the Bill & Melinda Gates Foundation,         Through their work, we can ensure that information becomes a force for
whose generous support has made this report possible.                              equality, and an accelerator of development both around the world and
                                                                                   across different policy areas.

                                                                                   I therefore very much welcome this second edition of the Development
                                                                                   and Access to Information report. I am grateful to all of our authors – in
                                                                                   particular our guest authors – for their contributions. I hope that their work
                                                                                   will contribute to greater recognition of, and support for, the access to
                                                                                   information for all that can make for better lives.

                                                                                                                                                                    DEVELOPMENT AND ACCESS TO INFORMATION 2019       i
Introduction

                                                       Access to information is essential for the empowerment of individuals, the
GERALD LEITNER                                         effectiveness of policies, and the accountability of governments. When                A failure to guarantee meaningful access to
Secretary General, International Federation of         everyone can enjoy it, it is a driver of sustainable development across all
Library Associations and Institutions                  of its dimensions. When it is absent, insufficient or unequal, opportunities          information hurts the individual, first and foremost.
                                                       are missed, decisions are poorer, and progress is stifled. Libraries are vital
                                                       in ensuring that everyone can benefit from access to information, making              They miss out on information that can help them
                                                       stronger, fairer societies a reality for all.
                                                                                                                                             make better decisions, or on opportunities to learn
                                                       This report – the second in the series following the first edition in 20171
                                                       – provides further evidence, examples and analysis of this contribution,              and communicate.
                                                       and of the role of libraries in achieving it. It is explicitly focused on the
                                                       United Nations 2030 Agenda and its Sustainable Development Goals
                                                       (SDG), which provide both an affirmation of the importance of access to           pillars are explained in more detail in Chapter 1, but in short illustrate
                                                       information for development, and a framework for thinking about how to            the conditions that need to be met to allow for the potential of access to
                                                       realise its potential.                                                            information to be realised.

                                                       The goal of this report is to provide an exploration of access to                 In a situation where all the pieces are in place, anyone can get online,
                                                       information as a driver of development. In doing so, it seeks to inform           without undue practical, financial or cultural barriers. They can find a
                                                       decision-making about the implementation of the SDGs. It is designed to           full range of undistorted information, and have the ability to take this,
                                                       be applicable at all levels about how best to build stronger, fairer, more        evaluate it, and apply it in order to improve their own life or the lives of
                                                       sustainable societies, from the discussions taking place at the UN High           those around them.
                                                       Level Political Forum to those at the national and local level. It is therefore
                                                       intended for policymakers and advisers, as well as anyone who is seeking          Where even one element is missing, this cannot be the case. Without an
                                                       more effective ways to support development, and the librarians and                internet connection, there is less opportunity to learn, to communicate,
                                                       library workers who can help deliver it.                                          and to create. Without favourable social and cultural conditions, whole
                                                                                                                                         groups can be excluded – in particular women, but also those affected by
                                                       This introduction therefore offers a refresher on the understanding of            poverty or who have a lower legal status (such as refugees). Without the
                                                       access to information applied in this report, a discussion of key issues          right laws, the content available online is skewed, and people are unable
                                                       emerging since the last edition, and an overview of the chapters that             to create their own materials or share their opinions. And without skills,
                                                       follow.                                                                           information cannot be found or applied effectively.

                                                                                                                                         A failure to guarantee meaningful access to information hurts the
                                                       Meaningful access to information and the role of libraries                        individual, first and foremost. They miss out on information that can
                                                                                                                                         help them make better decisions, or on opportunities to learn and
                                                       When referring to access to information, this report takes a deliberately         communicate.
                                                       broad approach, underlining the importance of “meaningful” access.
                                                       This reflects an understanding that the physical and legal availability of        However, it also brings costs in terms of reduced policy effectiveness. If a
                                                       information – the supply side – cannot make a difference when people do           population is not informed about development schemes and programmes,
                                                       not have the skills, confidence and social and cultural conditions to apply       cannot understand or engage with public health information, or cannot
                                                       it – the demand side.                                                             engage with online public services, government is less able to reach
                                                                                                                                         its goals. Those who govern also rely on good access to information to
                                                       In other words, a physical internet connection, or laws that ensure               guide their own policy-making, while their accountability to people and
                                                       transparency of public data or open access to publicly funded research,           parliaments requires access in order to work.
                                                       can only have their full effect if everyone is able to use this information
                                                       fully.                                                                            The inability to find, understand, use and create information can therefore
                                                                                                                                         lead to a variety of negative outcomes. In contrast, those individuals
                                                       This is an approach that finds its roots in the United Nations 2030 Agenda.       and societies that can access and make use of information are in a much
                                                       The Agenda makes reference to access to information, more or less                 stronger position to succeed now and into the future. In order to avoid
                                                       explicitly, in 20 targets, including commitments to develop infrastructure,       different levels of meaningful access to information leading to sustained
                                                       promote skills, tackle inequalities and promote freedoms.                         or widening development divides, there is a need for intervention.

                                                       A key part of this report is therefore based on a basket of indicators that       In policy terms, governments can act to improve their scores on each
                                                       explore these four facets, or “pillars,” of access to information: physical       of the indicators identified in this report, through reforms favouring
                                                       internet connectivity, skills, social and cultural context, and laws. These       connectivity, equality, education and fundamental freedoms.

ii        DEVELOPMENT AND ACCESS TO INFORMATION 2019                                                                                                                                                                    DEVELOPMENT AND ACCESS TO INFORMATION 2019   iii
As part of this, supporting effective library systems can be a uniquely        makes this a more feasible prospect than might have been the case in
                                                  powerful step. Connected libraries can provide a stepping stone toward,        the past.
                                                  and complement to, widespread home internet connections. They can
                                                  work alongside schools as providers of skills, from basic literacy to          As such, we have seen calls – including sometimes from major platforms
                                                  higher critical thinking, and represent a gateway to lifelong learning         themselves – for regulation. Beyond the risk of simply consolidating
                                                  opportunities. They are open to all, and so provide a place where social       the position of major players as the only actors who can apply new
                                                  and cultural barriers can be overcome, and where individuals can start to      rules, disproportionate regulations pose a threat to the free expression
                                                  engage in civic life.                                                          and access to information that have made the internet such a driver of
                                                                                                                                 change.

                                                  Developments since 2017
                                                                                                                                 The second edition
                                                  It is worth reflecting on the changes we have seen in the information
                                                  landscape since the first report in July 2017. Clearly, two years is a         As the second edition of the Development and Access to Information
                                                  relatively short period of time. However, three changes seem particularly      report, this publication provides further evidence of the contribution of
                                                  relevant in the context of a report focusing on access to information.         access to development. It places a particular emphasis on the place of
                                                                                                                                 libraries in achieving this.
                                                  A first issue concerns the rate of progress in connecting people to
                                                  the internet. While there is general consensus that over 50 percent of         For the first time, however, it provides some insights over time, based
                                                  internet connectivity was achieved in 2018,2 this still leaves much to         on the basket of indicators of access to information identified above.
                                                  do. Moreover, the rate of increase of connections appears to be falling,       Chapter 1 explores these evolutions, highlighting concern that growth
                                                  meaning that it risks being many decades before everyone who wants to          in the number of individuals using the internet is too often not being
                                                  access information through the internet can do so.                             matched by progress in education, gender equality and freedoms.

                                                  This is a major worry, given that even if internet connectivity is not         Chapter 2 takes the library perspective, drawing on a range of new
                                                  a sufficient condition for meaningful access to information, it is a           examples of where libraries are making the difference. It underlines
                                                  necessary one. Connections are also essential for libraries to deliver         in particular the multiple benefits of many library activities, which can
                                                  many of the services through which they contribute to development.             lead to positive results in a variety of fields. Frequently, these examples
                                                  New approaches, and full use of existing infrastructures, are essential.       show what can be achieved when an internet connection is paired with
                                                                                                                                 additional initiatives.
                                                  A second question relates to the emergence of deliberate misinformation
                                                  as a political issue. This has had significant implications for confidence     Chapters 3 to 7 focus, in turn, on five of the Sustainable Development
                                                  in information found on the internet, and has led to calls for greater         Goals that are in focus in 2019 – SDG 4 (education), SDG 8 (decent work
                                                  government intervention.                                                       and economic growth), SDG 10 (reducing inequalities), SDG 13 (climate
                                                                                                                                 action) and SDG 16 (peace, justice and strong institutions). Each explores
                                                  More positively, this phenomenon has also underlined the need to               the information-related aspects of a Goal and its associated targets,
                                                  develop greater skills in using the internet. These can help people not        setting out how these contribute both to the effectiveness of policies
                                                  only understand and evaluate the information they find, but also apply,        and the achievement of results. In each case, the ways in which libraries
                                                  share and create it. There is, arguably, a greater understanding of the        can help are explained. A conclusion then brings together some of the
                                                  need to build the knowledge, capabilities and attitudes to be effective        lessons learned from the different chapters.
                                                  internet users than ever before.
                                                                                                                                 Together, these perspectives offer a clear message. Meaningful access to
                                                  Linked to the second question is that of content regulation in general.        information is a powerful development accelerator, and in providing this,
                                                  The power of the internet as a means of sharing and accessing                  libraries are essential partners for development. We call on governments
                                                  information has encouraged efforts to control it, for political, security or   and all those involved in sustainable development policy-making to help
                                                  social ends. The emergence of new tools such as filtering technologies         them realise their potential.

                                                                                                                                 1.   Garrido, M and Wyber, S. (Eds.). (2017). Development and Access to Information Report, da2i.ifla.org
                                                                                                                                 2.   See for example: https://news.itu.int/itu-statistics-leaving-no-one-offline/

iv   DEVELOPMENT AND ACCESS TO INFORMATION 2019                                                                                                                                                                                       DEVELOPMENT AND ACCESS TO INFORMATION 2019   v
DA2I

                                                         Contents

                                                         Foreword                                                              i

                                                         Introduction                                                          ii

                                                         Chapter 1                                                             3
                                                         Progress toward meaningful A2I, and emerging threats

                                                         Chapter 2                                                             17
                                                         Making it meaningful, making it equitable: the role of libraries in
                                                         delivering development

                                                         Chapter 3                                                             23
                                                         Quality education and lifelong learning for all – A focus on people

                                                         Chapter 4                                                             29
                                                         A2I for decent work and economic growth

                                                         Chapter 5                                                             37
                                                         Inequalities: libraries and knowledge sharing

                                                         Chapter 6                                                             45
                                                         A2I and climate change

                                                         Chapter 7                                                             51
                                                         Goal 16: Peace, justice and strong institutions depend on A2I

                                                         Conclusion                                                            57

                                                         Contributors                                                          60

                                                         Bibliography                                                          64

       vi   DEVELOPMENT AND ACCESS TO INFORMATION 2019
DA2I

                                                        Chapter 1
                                                        Progress toward meaningful A2I,
                                                        and emerging threats

                                                        This chapter provides an overview of the progress various countries have
                                                        made toward achieving meaningful access to information between 2015             MARIA GARRIDO, MICHELLE
                                                        and 2018, in the context of the United Nations (UN) 2030 Agenda and the         FELLOWS, & BREE NORLANDER
                                                        Sustainable Development Goals (SDGs). The baseline year, 2015, was              Technology & Social Change Group,
                                                        chosen to correspond with the year the SDGs were established by the UN          University of Washington
                                                        General Assembly.1

                                                        Throughout this report, meaningful access to information is defined as
                                                        “the rights and capabilities to use, create, and share information in ways
                                                        that are meaningful to each individual, community, or organisation.”2
                                                        This rights-based approach recognises how a combination of structural
                                                        factors at the social, political, and economic levels manifest in local
                                                        and global contexts to advance (or impede) the ability of meaningful
                                                        access to information to contribute to more equitable and sustainable
                                                        development.3

                                                        Why we measure progress on meaningful access
                                                        to information
                                                        The UN 2030 Agenda “is a plan of action for people, planet and
                                                        prosperity” with the pledge that “no one will be left behind.”4 Meaningful
                                                        access to information can advance the types of progress envisioned
                                                        across the 17 Goals included in the Agenda.

                                                        The rise of the internet and the social web have profoundly expanded
                                                        the range of possible interactions between individuals, communities,
                                                        organisations, and governments, providing growing opportunities to
                                                        collaborate to combat poverty and inequality, produce and consume civic
                                                        information, and participate in social and political action.5

                                                        Yet there is no guarantee that access to information and communication
                                                        technologies (ICTs), or the opportunities they enable, will lead to equitable
                                                        or inclusive social change. This is particularly true when considering
                                                        the enabling conditions required for information access to address
                                                        key societal challenges meaningfully – as outlined in the Development
                                                        and Access to Information Framework:6 (1) the availability of physical
                                                        connectivity infrastructure, (2) the capabilities to use ICTs, (3) the social
                                                        context of information, and (4) the legal and political environment. Indeed,
                                                        given the barriers many of the world’s most vulnerable and isolated
                                                        populations continue to face in these areas, it is very possible that an
                                                        inequitable distribution of information access will contribute to types of
                                                        marginalisation that hinder development efforts.

                                                        Here are some of the reasons we measure progress:

                                                        Meaningful access to information enables bottom-up change that supports
                                                        a broad range of the sustainable development goals as enshrined in the
                                                        UN 2030 Agenda.

                                                        There is extensive evidence7 on how information and communication
                                                        technologies, and the social dynamics they engender, have been
                                                        leveraged to promote sustainable development in highly diverse contexts
                                                        and across a wide variety of domains, such as workforce development,
                                                        gender equality, social justice, and economic growth. In 2019, the High-

       2   DEVELOPMENT AND ACCESS TO INFORMATION 2019                                                                                   DEVELOPMENT AND ACCESS TO INFORMATION 2019   3
Level Political Forum on Sustainable Development (HLPF) will focus its • Section 1 – Connectivity Infrastructure and Use – shows the strides
annual thematic reviews on SDGs related to education, employment, the world has made toward establishing more inclusive connectivity
inequality, and good governance, so these domains are of particular interest infrastructure, as evidenced by expanded mobile broadband network
in this chapter. coverage and a growing proportion of internet users.
• Section 2 – The Social Context of Adoption and Use – shows how
Meaningful access to information must be made more equitable and educational attainment for youth has changed in recent years, including
inclusive. an upward trend in completion of upper secondary education and an
ongoing decrease in the gender gap between men and women across
In a world increasingly driven by interconnectedness and ubiquitous four educational levels.
communication, meaningful access to information is a necessity and a right. • Section 3 – The Legal and Policy Environment – shows how online and
In the past two decades, we have made great strides toward increasing offline freedoms are declining in many countries.
connectivity and digital literacy for billions of people. Yet for many
communities around the world, progress has been thwarted by foundational
social and economic inequalities that remain in place.8 We are still far from 1. Connectivity infrastructure and use
achieving a truly inclusive and equitable information society. In the context of the SDGs, physical connectivity infrastructure (specifically
for mobile and landline internet) plays a substantial role in supporting
Technological advances will increasingly affect the progress of the SDGs, economic inclusion and providing a route to a more equitable distribution
not only in terms of how people access and use information, but also the of knowledge and resources. For this dimension, we include indicators
social, cultural, and political ramifications of related issues that emerge. in two connectivity areas: 1) Availability and reach of the technical
infrastructure; and 2) Use of that infrastructure. The indicators used (and
In today’s evolving complex information ecosystem, achieving equitable, their sources) include:
meaningful access to information is more important than ever. Emerging
challenges such as disinformation, online security and data privacy, the 1. Population covered by at least a 3G mobile network (ITU)
monopolisation of information access and curation, and new restrictions 2. Percentage of households with internet access (ITU)
on freedom of information further exacerbate deeply rooted social and 3. Active mobile broadband subscriptions per 100 inhabitants (ITU)
economic inequalities, which impede progress across multiple fronts. 4. Fixed broadband subscriptions per 100 inhabitants (ITU)
5. Percentage of individuals using the internet (ITU)
How we measure progress on meaningful access to information Looking at the changes in connectivity from 2015 to 2016, we see a clear
To monitor the progress countries make toward meaningful access to pattern of improved connectivity across all regions, and on nearly every
information, we selected 17 indicators across the four dimensions of the indicator, continuing a trend of sustained growth. Lower-middle-income and
Development and Access to Information Framework.9 This framework was low-income countries achieved some of the most significant progress.
developed by the authors in 2017 and reflects a general consensus among
researchers, development practitioners, and informed policymakers that 1.1 Coverage of 3G wireless networks reached 82% of the world’s
physical access to information technology on its own is not sufficient to population
build a more equitable and participatory society. The social, political, and Between 2015 and 2016, the coverage of 3G wireless networks expanded
cultural context of information creation and use is critical for unlocking the to reach almost 82% of the population in the world, or more than 6 billion
transformational nature of information resources and improving the well- people. At a regional level,14 Southeastern Asia, Northern Africa, the
being of people and their communities. Caucasus and Central Asia, Southern Asia, and Sub-Saharan Africa showed
the greatest progress in terms of coverage. Although low-income countries
Measuring the contribution of meaningful access to information to reached nearly 50% 3G coverage (by population) in 2016, they still lagged
sustainable development is a complex endeavour, determined in part by the far behind the world average. At a country level, connectivity infrastructure
availability of data across countries from year to year.10 Summarising the in Bolivia, Ukraine, Greenland, Sierra Leone, Algeria, and Nepal showed the
data also presents challenges; for instance, we group countries by region or highest percentage increase of 3G network coverage in 2016 compared with
income level to highlight trends, yet doing so can mask differences between 2015.
countries within a region. Regional classifications reflect those used in
the Sustainable Development Goals Report 2016.11 Under this system, 1.2 Almost half of households worldwide have access to the internet
countries are divided into 10 distinct regions – nine geographic regions and The number of households with internet access at home through fixed
one economic region, which is a group of 55 “developed” countries (out or mobile networks increased from 45% (2015) to 48% (2016) worldwide.
of 228 countries total). Income classifications apply four income categories Despite this modest improvement, there are very significant differences
established by the World Bank: low, lower-middle, upper-middle, and high.12 across the regions. While in Latin America and the Caribbean 46% of the
population had home internet access, in Sub-Saharan Africa and Oceania
For a more comprehensive view of the progress toward meaningful access only 16% and 14%, respectively, had this connectivity resource in place.
to information at a country level, we encourage readers to utilise other According to the ITU (2018), the increase in households with internet
tools related to the DA2I initiative, including the DA2I Dashboards13 and access may be partly driven by an increase in the use of mobile devices
IFLA’s Library Map of the World and its SDG Stories (a monitoring tool that for accessing the internet at home rather than by any change in fixed
provides case studies of how libraries are advancing the SDGs with their broadband connections.15 While indicators on home internet access, mobile-
work). broadband subscriptions, and 3G coverage increased from 2015 to 2016,
fixed broadband showed a negligible drop (0.3 percentage point) in the
number of subscriptions. A possible explanation for the larger increase in
Looking ahead mobile broadband than fixed broadband subscriptions may be that fixed
This chapter is divided into three sections, with each corresponding to a broadband continues to be relatively expensive in low-income countries,
dimension of the aforementioned Development and Access to Information where, as the Broadband Commission has found, fixed broadband costs
Framework. more than twice as much as mobile broadband on average.16
4 DEVELOPMENT AND ACCESS TO INFORMATION 2019 DEVELOPMENT AND ACCESS TO INFORMATION 2019 5
1.3 More than half of the population in the world is using the internet According to the ITU (2016), the proportion of men using the internet
Compared with other indicators on connectivity infrastructure, internet continues to be higher than the proportion of women in two-thirds of
use showed the most dramatic change, going from 47.1% (2015) to 51.6% countries where data is available, yet it is unclear to what extent the
(2016) of the population, a 9.6% increase. Between 2015 and 2016, the situation has improved in recent years. ITU estimates indicate a growing
highest percentage increase of internet users was in low-income (24.9%) divide over a one-year period, with the internet gender gap increasing
and lower-middle-income (11.2%) countries. At a regional level, Oceania, from 11% in 2015 to 12% in 2016 (ITU, 2016). At a regional level, ITU
Southeastern Asia, and Southern Asia experienced the highest percentage estimates showed that the gender gap was largest in Africa (23%), and
increase of internet users compared to 2015. Although many of the the Arab States (18%) and smallest in the Americas (2%) for the reporting
countries in these regions are still below the world average, they continue countries.21
to make positive strides toward universal physical access to information in
some of the most economically challenged areas worldwide. (See Figure Affordability is an important determinant of people’s access to
1: Regional progress in connectivity infrastructure and use from 2015- information
2016). Analysis by the Alliance for Affordable Internet (A4AI) suggests
considerable progress in the past 10 years on issues related to internet
At a country level, nine out of the 10 countries that experienced the affordability, especially with price reductions for mobile services.22 Yet
largest growth in the internet-using population are in Sub-Saharan Africa. the inability of people to afford a basic internet connection remains one
Of these nine countries, Sierra Leone, Tanzania, Guinea, Gabon, and of the biggest barriers to access.23 A4AI defines affordability as 1GB of
Mozambique saw the largest increase in individuals using the internet mobile data costing 2% or less of the average person’s monthly income,
compared with the previous year. Gabon, for example, increased the calculated based on GNI per capita.24 A4AI’s latest report shows that in
share of its population using the internet from 7% in 2010 to almost 50% 2017 more than 2 billion people around the world still lived in countries
in 2016. According to the World Bank (2018), through a combination where mobile data was unaffordable. A4AI found considerable price
of investments in broadband infrastructure and the design of a digital differences across regions. For instance, mobile data was the most
strategy that established a regulatory environment more conducive to affordable in Asia (1.54% of income) versus, for example, Latin America
investment and competition in the country, the cost of internet access in and the Caribbean (3.58% of income) and Africa (8.76% of income).
Gabon has fallen from an average of US$18 to US$2.80 per month.17 Only four African countries met the affordability target (Tunisia, Nigeria,
Mauritius, and Egypt).25
Figure 1: Regional progress in connectivity infrastructure and use from 2015 to 2016
(percent of the population) 2. The social context of adoption and use: educational
opportunities for youth
100
Whereas physical connectivity infrastructure provides communities with
90
the technological foundations for information access, the social context of
80
adoption and use shapes how individuals engage with this infrastructure.
70
A multiplicity of factors – including social dynamics around poverty, race,
60
ethnicity, gender inequality, and a variety of social and cultural norms –
50
influence people’s ability to access and use information meaningfully in
40
their everyday lives.
30
20
In many countries in the world, young people experience higher levels of
10
poverty, unemployment, underemployment, and overall marginalisation
0
Caucaus Eastern Latin Northen Oceania South Southern Sub Western Developed World
than older adults,26 justifying the UN 2030 Agenda’s targetting of youth
and Central Asia America & Africa Eastern Asia Saharan Asia regions in SDGs 4 (education for all) and 8 (decent employment). The following
Asia Caribbean Asia Africa
analysis focuses on youth to illustrate how the social context affects
3G Network coverage in 2015 Internet user population in 2015 2016 meaningful access to information. Specifically, we consider educational
attainment and its effect on opportunities for youth.
Source: ITU Technology & Social Change Group, University of Washington
Education is key to improving the livelihood of individuals, families,
and communities, and it is a critical vehicle through which children and
1.4 The percentage of internet users has steadily increased, but youth can feasibly aspire to improve their livelihoods. Yet education
challenges related to gender disparities and internet affordability still can manifest the inequities that exist in many countries, hampering the
remain prospects of young people.
The gender internet gap increased from 11% in 2015 to 12% in 2016
When aiming for truly inclusive and equitable participation, it is important Meaningful access to information is closely intertwined with education.
to look at connectivity in relation to different populations, especially Clearly the possibility to connect to the internet can open up exciting
historically excluded groups such as women and girls. Research has new possibilities to access materials and tools for learning. However –
shown women and girls frequently face particularly difficult challenges crucially – the relationship also runs in the other direction, with a range
related to social and cultural norms that make them less likely than of skills, from basic literacy to higher order critical information literacy
men and boys to access, use, own, and create digital technology and necessary in order to make optimal use of access to information.
further develop their digital skills.18 For example, a recently published
comprehensive study on the state of gender equality in ICT access, skills, In this way, we see that some youth – those with the skills to use
and leadership challenged the commonly held assumption that high levels technology and information in a meaningful way – may find resources
of mobile phone adoption had shrunk the digital gender gap. It showed, and opportunities online to supplement their livelihoods or job prospects,
rather, that the gap persists across all three domains in several countries,19 while others miss out. Physical connectivity alone cannot overcome the
and this situation is further exacerbated for women living in rural areas.20 barriers imposed to meaningful access to information is if opportunities
6 DEVELOPMENT AND ACCESS TO INFORMATION 2019 DEVELOPMENT AND ACCESS TO INFORMATION 2019 7
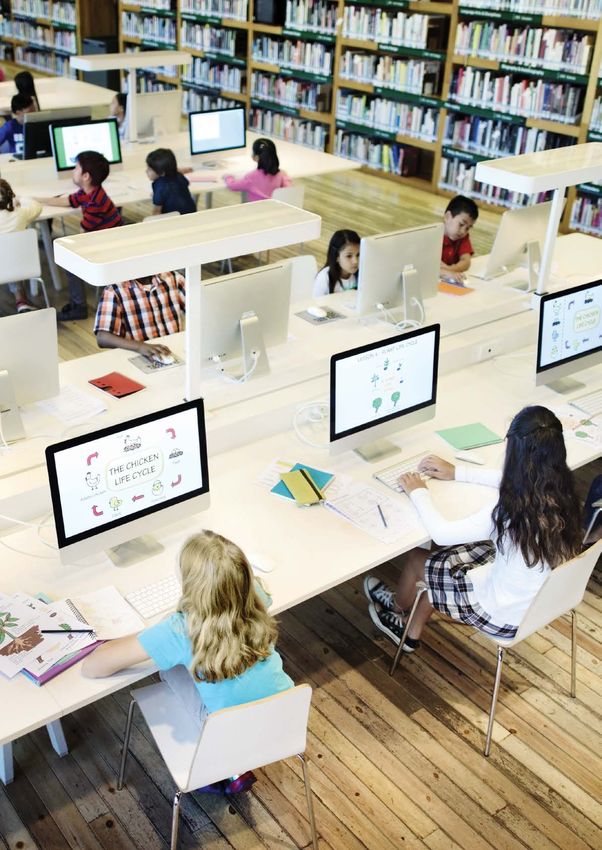
for education and training, do not exist or are only available to the few. Figure 3: Trends in educational attainment by gender, 2010-2015
(percent of the population)
For this report, our analysis draws on data from one indicator:
Female Male
90 90
1. Educational attainment, i.e., the highest level of education obtained by
individuals aged 25 years and above – secondary school and college 80 80
(UNESCO) 70 70
Overall, looking at the changes in the social context from 2006 to 2015,27 60 60
we see an upward trend in completion of upper secondary education 50 50
for the reporting countries, and are closer to achieving gender parity
40 40
in primary and lower secondary education, with the share of women
obtaining a bachelor’s degree actually surpassing that of men. 30 30
2.1 Completion of upper secondary education for individuals 25 years 20 20
and above increased to 34% worldwide 10 10
Measures of educational attainment – the highest level of education an
0 0
individual has completed – provide a picture of the opportunities children 2010 2011 2012 2013 2014 2015 2010 2011 2012 2013 2014 2015
and youth have to progress along the education pathway. Our analysis Primary Lower Secondary Upper Secondary Bachelors
shows an increased upward trend in attainment of upper secondary
education at a world level. Between 2006 and 2015 (the latest year with Source: UNESCO
available data), the educational attainment rates for upper secondary Note: Number of reporting countries varies year by year
education as the highest level obtained increased from 25.5% to 34.4%. Technology & Social Change Group, University of Washington
Meanwhile, levels of attainment of lower secondary education as the
highest level obtained slightly fluctuated from 15.6% to 16.9%. Attainment
of a bachelor’s degree as the highest level obtained, however, decreased
from 17.8% in 2011 to 14.2% in 2015. (See Figure 2: Trends in educational Studies show that national income levels are directly correlated with
attainment by level of education, 2010-2015.) the level of educational attainment29 and recent trends show positive
progress, particularly in low-middle-income countries. From 2014 to
2015, the highest level of educational attainment for low-middle-income
Figure 2: Trends in educational attainment by level of education, 2010-2015 countries increased both when it came to the upper secondary level (from
(percent of the population) 22% to 36%) and at the bachelor’s level (from 9% to 14%).
40
At a regional level, countries in Sub-Saharan Africa made the most
35
significant progress in increasing educational attainment rates at the
upper secondary level between 2014 and 2015 (from 12% to 26%). The
30
share of people obtaining a bachelor’s degree as the highest level of
educational attainment in the region dropped from 5% to 3% over the
25 same period. Bachelor’s degree attainment also decreased from 17% to
11% in Western Asia but grew slightly from 2014 to 2015 in the Caucasus
20 and Central Asia, “developed” regions, Eastern Asia, Latin America and
the Caribbean, and Southeastern Asia. However, looking at “developed”
15 countries over a two-year period shows a downward trend in bachelor’s
degree attainment from 20% in 2013 to 15% in 2015.
10
5
3. The legal and policy environment: political rights, civil
rights, and freedom on the net
0
2010 2011 2012 2013 2014 2015 The legal and policy environment pillar of the DA2I Framework relates to
Primary Lower Secondary Upper Secondary Bachelors
the extent to which countries have implemented the kinds of rights-based
goals and equitable and participatory practices that support meaningful
Source: UNESCO access to information. This includes guaranteeing the rights of people to
Note: Number of reporting countries varies year by year freedom of expression, association, political participation, civic action, and
Technology & Social Change Group, University of Washington online privacy and safety.
The relationship between freedoms and information access is enshrined
An important trend observed in the past 10 years in the reporting in the Universal Declaration of Human Rights and Goal 16 of the SDGs,
countries is that gender parity for educational attainment rates has and particularly Target 16.10, which seeks to “ensure public access to
been achieved at the primary and lower secondary educational levels.28 information and protect fundamental freedoms, in accordance with
There remains a gap at the upper secondary level, but women have national legislation and international agreements.”30
surpassed men in the proportion completing bachelor’s degrees (as the
highest degree obtained) since 2006. (See Figure 3: Trends in educational When these freedoms are restricted, people are unable to make full use
attainment by gender, 2010-2015.) of access to information, not only to participate in civic life, but also to
8 DEVELOPMENT AND ACCESS TO INFORMATION 2019 DEVELOPMENT AND ACCESS TO INFORMATION 2019 9
communicate and create relevant content for the benefit of others. Such Figure 4: Countries with biggest gains and declines in overall freedom score, 2017-2018.
strict controls can have a chilling effect on journalism, research, and
Gabon
readiness to seek personal information. Tunisia
Turkey
Tanzania
This section presents the state of the world as it relates to political rights, Maldives
civil liberties, and online freedoms. It relies on indices from Freedom Poland
Malta
House, whose comprehensive data collection efforts evaluate the state of Libya
the world (and trends over time) on a range of issues, including the right Hungary
to information.31 Uganda
Sudan
Somalia
The two indices used are: Jamaica
Haiti
Guatemala
1. Freedom in the World Angola
Afghanistan
2. Freedom on the Net. Nepal
Ecuador
3.1 Freedom in the world continues to decline Uzbekistan
Timor Leste
Freedom House’s Freedom in the World index is composed of two Iraq
separate ratings on political rights and civil liberties. -10 -8 -6 -4 -2 0 2 4
Change in score from 2017
Free Partially Free Not Free
• Political Rights Rating: Assesses people’s ability to participate in the
electoral process, ensure political pluralism, and hold government
accountable. Source: Freedom House
• Civil Liberties Rating: Assesses the extent to which people can exercise Note: Score reflects improvements or deterioration of political rights and civil liberties.
freedom of expression and belief, whether they can freely associate Technology & Social Change Group, University of Washington.
and assemble, and whether there exists an equitable rule of law that
protects social and economic freedoms.
3.2 Freedom in the world: political rights and civil liberties
The combined Freedom in the World index paints a bleak picture of the Looking at the different components that make up the Freedom House
state of the world regarding the right to information for all people, with political rights and civil liberties sub-indexes, we see that in Western
glaring implications for the future of democracy. According to Freedom Asia and the Caucasus and Central Asia, authoritarian regimes further
House,32 2018 marks the 12th consecutive year with falling ratings in limited the ability of people to have fair and free elections.36 (See Figure
political rights and civil liberties around the world. Today, almost 40% 5: Regional declines and gains in civil liberties and political rights, 2017-
of people in the world live in countries that are rated as not free and a 2018). In 2018, compared with the previous year and relative to other
quarter live in countries that are rated only partially free.33 regions, Northern Africa experienced the largest declines in multiple
areas, including: rights of association and organisation; guarantees
Our analysis shows that between 2010 and 2018, freedom declined of people’s autonomy and individual rights; political pluralism and a
across most regions in the world and almost all country income levels. proper functioning of government by implementing safeguards against
Between 2017 and 2018, high-income and upper-middle-income countries corruption and cronyism; and openness and transparency in govenrment.
experienced the greatest declines in their combined freedom score –
including mature democracies where many might expect freedoms Although the root cause of this decrease in freedoms varies by region
would not falter. At a regional level, of the 10 UN subregions, only three and country, some emerging trends have affected countries across
(Eastern Asia, the Caucasus and Central Asia, and Oceania) experienced different levels of social, economic, and political development. Perhaps
an increase in freedom in the past two years, and yet even these slight the most worrisome trend is the rise of authoritarianism and populist
regional increases were driven by just a handful of countries, and almost governments in many countries in the world, including in states with
all of the countries within these regions remain partially free or not free.34 a long and established democratic tradition.37 Fuelled by increasing
social and economic inequality, people’s overall distrust of a political
Countries experiencing improvements in political rights and civil liberties system they deem corrupt and inefficient, along with the current wave of
often saw only minor improvements in their scores, although several disinformation and manipulation of information in social media, is setting
countries – such as in Angola, Ethiopia, and Ecuador35 – had significantly the ground for authoritarian forces to gain political power at the expense
improved scores due to major developments that resulted in expansions of our political rights and civil liberties.38
of freedoms. (See Figure 4 for the countries that experienced the biggest
gains and losses in freedom in 2018.)
10 DEVELOPMENT AND ACCESS TO INFORMATION 2019 DEVELOPMENT AND ACCESS TO INFORMATION 2019 11Figure 5: Regional declines and gains in civil liberties and political rights,
2017-2018, expressed as a percentage change
Caucasus and Central Asia Developed Regions Sub-Saharan Africa Western Asia
Political 6.90 1.27 Political 2.05 0.00
Pluralism Pluralism
Functioning 0.00 0.83 Functioning 7.69
of Government of Government 2.96
Electoral 9.52 0.37 Electoral 2.65 42.00
Process Process
Rule of Law 0.00 0.32 Rule of Law 2.32 2.63
Personal Personal
Autonomy & 4.08 0.29 Autonomy & 0.00 1.82
Individual Rights Individual Rights
Freedom of Freedom of
Expression 5.26 1.13 Expression 2.78 1.59
& Belief & Belief
Associational & Associational &
Organizational 4.55 0.55 Organizational 0.74 0.00
Rights Rights
Political Rights Civil Liberties
Eastern Asia Latin America and the Caribbean
Political
Pluralism
3.33 0.48 Source: Freedom House
Technology & Social Change Group, University of Washington.
Functioning 5.26
of Government 1.56
Electoral 0.00 1.54
Process
3.3 Freedom on the net
Rule of Law 0.00 0.66
The Freedom on the Net rating tracks obstacles to internet access, limits
on internet content and violations of user rights in 65 countries. According
Personal
Autonomy & 0.00 0.54 to the latest Freedom House Freedom on the Net report (2018), 34% of
Individual Rights
Freedom of
the world’s population lived in countries rated as “not free” and 33% in
Expression
& Belief
3.33 0.67 countries rated as “partly free.” Only 20% of people lived in countries
Associational & where their rights online were guaranteed.39
Organizational 0.00 1.35
Rights
Our freedoms online had already been declining for seven consecutive
Northern Africa Oceania years, and in 2018, this trend continued for an eighth year. According to
the latest Freedom on the Net report:
Political 12.12 0.60
Pluralism
Of the 65 countries assessed, 26 have been on an overall decline since
Functioning 3.13
of Government 11.76
June 2017, compared with 19 that registered net improvements. [Overall],
Electoral
17 governments approved or proposed laws restricting online media
12.50 0.79
Process
in the name of fighting “fake news” and online manipulation, and 18
Rule of Law 9.09 0.69
countries increased surveillance, often eschewing independent oversight
and weakening encryption to gain unfettered access to data. (Freedom
Personal
Autonomy & 8.57 0.00 House, FON 2018)
Individual Rights
Freedom of
Expression
& Belief
2.78 0.00 Our analysis suggests that low-income countries suffered the biggest
Associational & losses in online freedoms from 2015 to 2016, followed by upper-middle-
Organizational 11.54 0.84
Rights income countries. Countries in Northern Africa and the Caucasus/Central
Asia experienced the greatest decrease in online freedoms in 2016. The
South-Eastern Asia Southern Asia Philippines, Turkey, and Saudi Arabia were among 30 countries where
governments attempted to manipulate political and civic dialogue and
Political
Pluralism
0.00 0.00 spread disinformation by employing armies of “opinion shapers” to
promote certain political agendas and curtail opposition on social media.40
Functioning 2.13 2.00
of Government China, Iran, Syria, Ethiopia, Saudi Arabia, Bahrain, Pakistan, Cuba,
Electoral 1.96 3.08
Uzbekistan, and Vietnam were the 10 countries with the most restrictions
Process
on online freedoms in the world in 2016.
Rule of Law 2.04 2.08
Personal
Autonomy & 0.00 0.00
Individual Rights
Freedom of
Expression 1.12 0.00
& Belief
Associational &
Organizational 4.08 0.00
Rights
12 DEVELOPMENT AND ACCESS TO INFORMATION 2019 DEVELOPMENT AND ACCESS TO INFORMATION 2019 13The road ahead Scarcity of data on key indicators remains an obstacle to our efforts.
As we look at the progress regions and countries made toward Our efforts to track the progress of countries and regions toward
achieving meaningful access to and use of information between 2015 achieving meaningful access to and use of information are severely
and 2018, we see mixed results. Gains in connectivity and education hampered by the lack of availability of relevant data. During the period
are offset by losses in individual freedom. Rather than making serious between 2015 and 2018, data for many of the 17 indicators included in the
inroads toward achieving meaningful access to information for DA2I framework was not updated or made publicly available. In a world
everyone, our indicators show that, for the most part, we are running that is supposedly overflowing with data, the reality is that there exist
on the spot. Seemingly for every step forward, the world has taken a significant data gaps in key social and economic indicators. The scarcity
step backward. For example: of data not only limits our ability to assess the progress of countries but,
perhaps most importantly, significantly constrains the design of evidence-
There was significant progress in building connectivity infrastructure, based policies that truly address the needs of different communities in
particularly in low-income and low-middle-income countries, but this each country.
infrastructure remains underutilised.
The existence of physical connectivity infrastructure is fundamental
to guaranteeing the right to meaningful access to information.
1. This chapter is the second installment, following the DA2I report released in 2017. See: Garrido, M. & Wyber, S. Eds. (2017)
However, people’s actual ability to access and use that infrastructure
2. See: Garrido & Fellows, 2017: 11
is determined by many social factors, including poverty, access to
3. For a more thorough discussion on the importance of the rights-based approach in relationship with the UN 2030 Agenda, see for example:
equitable educational opportunities and decent jobs for both women Nussbaum, (2001) Esterhuysen, A., (2016) and Souter, D., (2016)
and men, and the presence of a legal and policy framework that 4. https://sustainabledevelopment.un.org/post2015/transformingourworld
protects the rights of all people. Despite significant strides in the 5. There is an extensive and well-established body of research committed to studying the contributions of access to information for the purpose
availability of information and communications technologies, there of advancing social and economic goals. Numerous studies in the fields of communication, particularly development communication
has been negligible progress toward solving the significant gender (for example, Castells, 1996; Melkote, 2000; Wilkins, 2000; Castells, Fernandez, & Sey, 2009; Toyama, 2011 Heeks, 2010; Sey et al., 2015;
Donner, 2016) and information sciences (for example, Burnett & Jaeger, 2011), and more recently in the field of human-centered design and
gap that persists in their use. And while connectivity, particularly engineering (for example, Starbird, 2018) have shed light on different ways in which communities, civil society organizations, governments,
through mobile connections, has become cheaper in most countries, and international bodies used a variety of information and communication resources to advance social change.
price remains a barrier that many people around the world cannot 6. See Garrido & Fellows, (2017)
overcome. 7. See footnote 5
8. See Pew Internet Research (2016); ITU, (2016 ,2017, 2018); Garrido & Fellows (2017); and EQUALS Research Group, (2019); among others.
On a positive note, educational attainment continues to increase 9. See: Appendix 3 (Glossary of DA2I indicators) here: https://da2i.ifla.org/
across all regions of the world. 10. For information on our methodology and a discussion of the challenges faced, see Appendix 1 (Research Process) and Appendix 2 (Data
Curation, Processing, and Analysis Strategy) here: https://da2i.ifla.org/node/50
11. A list of countries and their regional classification is available in Appendix 2 (Data Curation, Processing, and Analysis Strategy) here: https://
Education is key to improving the livelihoods of individuals, families da2i.ifla.org/node/51
and communities, and it is a critical vehicle through which children 12. Information on the World Bank’s income group classification can be found here: https://datahelpdesk.worldbank.org/knowledgebase/
and youth can feasibly aspire to decent employment. Yet educational articles/378834-how-does-the-world-bank-classify-countries
performance can reflect the inequities that exist in many countries, 13. The DA2i dashboards will be released in July 2019. Please see our website for updates: http://tascha.uw.edu/
hampering the prospects of young people. In this way, we see that 14. Regional averages are weighted by country population.
some youth – those with the physical access, financial means and 15. See: ITU (2018)
digital skills to use technology and information in a meaningful way – 16. See: Broadband Commission (2018)
may find resources and opportunities online to support their livelihoods 17. For information on the World Bank’s Central African Backbone Communications Project see: http://projects.worldbank.org/P108368/central-
african-backbone-apl1a?lang=en
or job prospects. However, when opportunities for education, training
18. See for example: EQUALS Research Group (2019) and ITU (2016, 2017, and 2018)
and employment are not equitably distributed, youth face obstacles
19. For a comprehensive analysis on the state of the ICT gender gap please see: EQUALS Research Group (2019)
that access to information alone cannot overcome.
20. See: Web Foundation (2016)
21. See: ITU (2016)
Meanwhile, a widespread decline in freedoms spells trouble for the
22. See: Affordability Report (2018)
future of democracy around the world.
23. Ibid
24. More information on this definition of affordability, as well as a list of mobile broadband costs by country, is available at https://a4ai.org/
Excessive limits on freedoms have glaring consequences for democracy mobile-broadband-pricing-data/.
as societies lose the power of people’s voices to decide the political 25. Ibid
direction of their countries. Freedom of expression is the cornerstone of 26. See for example: ILO (2017, 2018); UNESCO (2017, 2018); and UNDP (2016)
political participation and civil rights and embodies a set of democratic 27. Data for 2016 was not included in the analysis due to the small number of countries reporting data for this indicator on that year (n=2)
values that affect every aspect of meaningful access to information. 28. UNESCO (2016 & 2017)
A rights-based approach to access to information recognises that the 29. See for example: ILO (2017, 2018), UNDP (2016)
right to information impacts all other rights as well. These rights are 30. See Garrido, Fellows & Koepke (2017)
interdependent and indivisible. 31. See Freedom House’s Methodology: https://freedomhouse.org/report/methodology-freedom-world-2019
32. Freedom House (2018)
As the lives of people become even more intertwined with our 33. Ibid
interactions online, guaranteeing the rights of people to freely and 34. Ibid
safely participate in different online spaces is more critical than ever. 35. Ibid
The notion of the internet as a liberation technology is dwindling 36. Freedom House (2018)
as governments around the world are increasingly surveilling their 37. Mozilla Foundation (2018)
citizens, using social media to spread disinformation and manipulate 38. See: Freedom House (2017 & 2018)
their constituents for political gains, and failing to protect their people 39. Freedom House (2018b)
against violations of privacy. 40. Ibid
14 DEVELOPMENT AND ACCESS TO INFORMATION 2019 DEVELOPMENT AND ACCESS TO INFORMATION 2019 15DA2I
Chapter 2
Making it meaningful, making it
equitable: the role of libraries in
delivering development
The provision of access to information is the core mission of libraries. By
acquiring, preserving and organising information and allowing users to STEPHEN WYBER
read and apply it, libraries have long been at the heart of the our cultural Manager, Policy and Advocacy,
and research infrastructure. They are guardians of much of the world’s International Federation of Library Associations
documentary heritage, as well as the source of the raw materials for and Institutions
innovation.
They also have an important social mission. In the 19th century, the building
of libraries formed part of the effort to educate and enable those who were
not among the elite. Complementing the move to develop labour rights and
universal education, they formed a part of a new offering of services – and
opportunities – to everyone.
While the world has changed, the core mission of libraries remains relevant,
and arguably more so than ever. As it becomes clearer and clearer what can
be achieved with information, it becomes more and more imperative that
everyone has the possibility to benefit.
The costs of non-access are clear. As detailed in the previous chapter, those
who lack meaningful access to information miss out on opportunities for
employment or entrepreneurship, cannot engage in research and innovation
or in civic life, and are prevented from communicating with friends, family
and those who share their interests.
Moreover, a lack of access can cut people off from their cultures and, at the
most basic level, from the information they need to make the right decisions
for themselves and their communities.
Not having the ability to find, access, apply and create information can too
often reinforce social and economic disadvantage, which in turn can raise
further barriers to accessing information. This, in effect, creates a bottleneck
to equitable development, making it harder to achieve the objectives of the
UN 2030 Agenda. As this chapter looks to show, libraries can provide an
effective way out of this situation.
As IFLA’s Library Map of the World shows, there are at least 2.3 million
libraries worldwide. While many serve specific communities (such as school,
academic and special libraries – e.g., institutional or parliamentary libraries),
this includes more than 357 000 public libraries, with a mission to help all of
their users. This represents a huge potential resource.
Yet libraries do not exist in a vacuum. They depend on a number of
conditions to exist, and to be able to fulfil their missions. Clearly funding is
crucial, not only for an adequate building and staff, but also for collections
and other infrastructure.
Libraries have a two-way relationship with the different elements of the
Development and Access to Information (DA2I) Framework. They benefit from
good performance in each of the four pillars of the Framework, but, crucially,
also support them. Indeed, there is strong potential for a virtuous circle.
This chapter will explore these issues and illustrate the contribution that
properly enabled libraries can make. Finally, it will relate the examples
discussed to the Sustainable Development Goals.
16 DEVELOPMENT AND ACCESS TO INFORMATION 2019 DEVELOPMENT AND ACCESS TO INFORMATION 2019 17You can also read