Utah Health Innovation Plan - December 30, 2013
←
→
Page content transcription
If your browser does not render page correctly, please read the page content below
Utah Health Innovation Plan
         December 30, 2013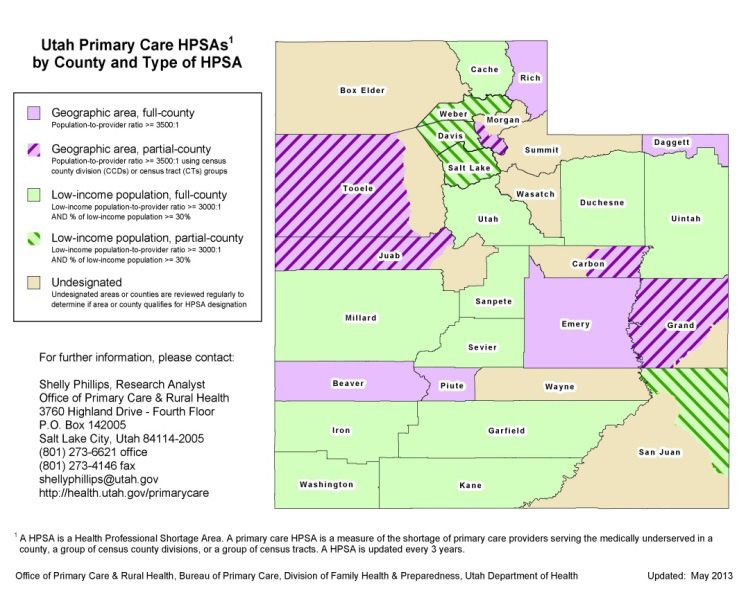
Table of Contents                                                                                                                                          Table of Contents

I.      Executive Summary – Utah’s Health System Transformation Process ......................2                                                            I.      Executive Summary – Utah’s Health System Transformation Process ......................2
II      Utah Health Innovation Vision Mission and Aims ....................................................6                                               II      Utah Health Innovation Vision Mission and Aims ....................................................6
III.    Utah’s Current Health Care Environment – An Overview                                                                                               III.    Utah’s Current Health Care Environment – An Overview
        A. Population Demographics ......................................................................................8                                         A. Population Demographics ......................................................................................8
        B. Health Status, Issues and Barriers ........................................................................11                                           B. Health Status, Issues and Barriers ........................................................................11
        C. Health Information Initiatives – Meaningful Use ................................................23                                                      C. Health Information Initiatives – Meaningful Use ................................................23
        D. Health Care Cost Performance Trends in Utah .....................................................25                                                     D. Health Care Cost Performance Trends in Utah .....................................................25
        E. Quality Performance..............................................................................................28                                     E. Quality Performance ..............................................................................................28
        F. Special Populations ................................................................................................32                                  F. Special Populations ................................................................................................32
        G. State and Federal Partnership Initiatives...............................................................40                                              G. State and Federal Partnership Initiatives ...............................................................40
IV.     Design Process and Deliberations..............................................................................44                                   IV.     Design Process and Deliberations ..............................................................................44
V.      Utah’s Road Map to Health System Transformation                                                                                                    V.      Utah’s Road Map to Health System Transformation
        A. Value Based Purchasing (VBP)                                                                                                                            A. Value Based Purchasing (VBP)
                1. Description of Current Health Payment Systems ......................................45                                                                  1. Description of Current Health Payment Systems ......................................45
                2. Transforming to Value-Based Purchasing ..................................................48                                                             2. Transforming to Value-Based Purchasing ..................................................48
        B. End of Life Systems and Integration of Behavioral Health                                                                                                B. End of Life Systems and Integration of Behavioral Health
                1. Description of Current Health Delivery Systems ......................................51                                                                 1. Description of Current Health Delivery Systems ......................................51
                2. Transforming Current Systems to Integrate End of Life Systems and                                                                                       2. Transforming Current Systems to Integrate End of Life Systems and
                   Behavioral Health and Primary Care .........................................................51                                                             Behavioral Health and Primary Care .........................................................51
        C. Workforce Development and Community Health                                                                                                              C. Workforce Development and Community Health
                1. Current Workforce System Performance ..................................................56                                                               1. Current Workforce System Performance ..................................................56
                2. Community Health-Description of Current System Performance ............61                                                                               2. Community Health-Description of Current System Performance ............61
                3. Transforming Current Systems to Include Community ............................63                                                                        3. Transforming Current Systems to Include Community ............................63
        D. Aims and Interventions Narrative .........................................................................67                                            D. Aims and Interventions Narrative .........................................................................67
        E. Implementation .....................................................................................................91                                  E. Implementation .....................................................................................................91
        F. Transformation Timeline Narrative.......................................................................109                                             F. Transformation Timeline Narrative.......................................................................109
        G. Evaluation of the Utah Health Innovation Plan ....................................................111                                                   G. Evaluation of the Utah Health Innovation Plan ....................................................111
        H. Projecting Financial Impacts ................................................................................112                                        H. Projecting Financial Impacts ................................................................................112
VI.     Appendices                                                                                                                                         VI.     Appendices
        Appendix A: Stakeholder Engagement Plan………………………………………..116                                                                                                Appendix A: Stakeholder Engagement Plan………………………………………..116
        Appendix B: Aims and Interventions.........................................................................126                                             Appendix B: Aims and Interventions.........................................................................126
        Appendix C: Transformation Timeline ......................................................................128                                              Appendix C: Transformation Timeline ......................................................................128
        Appendix D: Evaluation Matrix.................................................................................130                                          Appendix D: Evaluation Matrix.................................................................................130
VII.    Glossary .....................................................................................................................132                  VII.    Glossary .....................................................................................................................132
VIII.   Bibliography ..............................................................................................................135                     VIII.   Bibliography ..............................................................................................................135
IX.     Figures and Tables .....................................................................................................138                        IX.     Figures and Tables .....................................................................................................138
X.      Mapping to SIM Terms and Conditions (in process) .................................................140                                              X.      Mapping to SIM Terms and Conditions (in process) .................................................140
XI.     Acknowledgments......................................................................................................142                           XI.     Acknowledgments......................................................................................................142

                                                                                                                    Utah Health Innovation Plan 2013   1                                                                                                                       Utah Health Innovation Plan 2013   1
I. EXECUTIVE SUMMARY                                                                                                   Utah Health Innovation Plan
                                                                                                                       The Plan is a statewide roadmap to achieve health systems transformation. It requires changes in the behavior
                                                                                                                       of providers, purchasers and consumers. It has taken nearly three years, countless hours of work and dedicated
Utah’s Health System Transformation Process                                                                            community input to develop key components as outlined in the plan. In order to achieve the vision of improved
Utah began the health system transformation process in 2011, with a clarion call from Governor Gary Herbert.           health care value (better health, better healthcare, and lower cost) the Plan sets out four critical aims:
He directed the Utah Department of Health (UDOH), to create a plan that would reduce Utah’s health costs,                     AIM 1: To adapt to and perform well in a value-based purchasing environment (value = quality out-
provide a trained health workforce (new and existing) to meet the cost reduction challenge and develop measur-                comes/ cost)
able innovations that would lead to more patient inclusion in assuring the quality of their own health care.
                                                                                                                              AIM 2: To facilitate end-of-life preferences for Utah citizens so they receive care with dignity, respect
                                                                                                                              and efficiency
The first phase in meeting the governor’s directive began with the 2011 Governor’s Health Summit. Community                    AIM 3: To increase access to primary care and behavioral health
leaders met in policy sessions to discuss possible actions the state could take in five key areas: health informa-
tion, health workforce, prevention and wellness, payment reform and quality/patient safety (tort reform). A                   AIM 4: To create community-clinical linkages and healthful environments
second health summit in 2012 reviewed additional work needed in response to federal health reform efforts.

                                                                                                                       Within each of these aims, the Plan provides additional detail on what can be done to accomplish the aim and
In early 2013, Utah was awarded a State Innovation Models (SIM) Grant from the Center for Medicare and                 how to measure the results. Each aim’s subaims, interventions, expected outcomes, and outcome measures
Medicaid Innovation to begin the process of putting the previous policy discussions into action. To guide this         provide additional detail to the Plan’s overall roadmap.
innovation effort, a governing body of key community leaders from business, health care delivery, health work
force education, mental health systems and government was established. The body, known as the Executive                The Plan will be implemented through a series of interventions that are outlined in the Aims and Intervention
Policy Group (EPG), was led by then Lt. Governor Greg Bell. The EPG collaborated with over 100 other com-              diagram in Appendix B. The diagram details steps that can be taken over the next three to five years to accel-
munity leaders to continue the work that began at the 2011 Summit and led the effort to develop the Utah Health        erate the transformation towards a Value-based purchasing environment. A timeline for these interventions is
Innovation Plan (the Plan).                                                                                            outlined in Appendix C. Critical interventions begin as early as spring 2014.

Under the direction of the EPG, five work groups were established to develop the topics from the first Summit.           Value-Based Purchasing (VBP)
The first step for these work groups was to identify goals or “aims” needed to implement interventions or solu-         Aim 1 details how Utah will adapt and perform in a VBP environment through improved utilization of health
tions targeted at moving Utah’s “fee-for-service” health models to a “value-based” purchasing system. Keeping          information technology tools and the development of value- based metrics which will inform providers’ and
the vision of the Plan for “better health, better health care and lower costs for all Utahns,” at the forefront, the   payers’ purchasing decisions.
work groups spent eight months identifying aims and interventions or recommended activities that would need
to be conducted to test and implement effective solutions. The aims were outlined in a progress report and pre-
sented at the 2013 Governor’s Health Summit.
                                                                                                                       A fundamental element of developing VBP systems is the ability of those systems to follow patients across time
                                                                                                                       and sectors. Subaims 1.1 and 1.2 will increase stakeholder use of a state-wide master person index (sMPI),
                                                                                                                       improve the use of electronic medical records (particularly in rural areas), provide a more secure clinical health
Once the work groups had developed their aims and interventions, the next step was to identify the synergies           information exchange, and increase the accessibility and usefulness of the All Payer Claims Database (APCD).
between the efforts of five work groups and combine them into one cohesive plan. The critical aims with their
accompanying interventions, are the basis for the state’s health innovation plan.

                                                                                                                       Subaim 1.3 and its accompanying intervention form the basis for a value-based transformation process. The
                                                                                                                       intent of the subaim is: To have 80 percent of Utah’s covered lives involved in a VBP plan.

2      Utah Health Innovation Plan 2013                                                                                                                                                                 Utah Health Innovation Plan 2013   3
The intervention associated with this subaim is to convene a group of community leaders (payers and providers)              • State Medicaid and Children’s Health Insurance Program (CHIP) information
that will formulate a set of outcome metrics that can be used to determine value in health care. It is anticipated
that this intervention will be completed near the end of 2014 and will produce a set of relevant metrics that can           • Beneficiary experience surveys
be used to measure quality in light of cost. A second intervention will then establish a test comparing the use             • Site visits with practices
of the VBP metrics by at least three groups of payers and/or providers. The selected groups would utilize the
metrics with their VBP efforts to determine if the combination will enhance their ability to increase quality and           • Focus groups with beneficiaries and their families and caregivers, practice staff, direct support
or decrease costs.                                                                                                          workers, and others (e.g. payers), for program evaluation.

                                                                                                                     In addition, a financial analysis will be done to determine the return on investment on these interventions. A
Subaims 1.4 and 1.5 concentrate on training providers to practice in a value-based environment. Current              preliminary forecast was performed for the state as part of the Plan design process. The Plan’s financial analysis
training programs will be aligned with VBP metrics in order to better prepare future practitioners to perform in     forecasts a level of spending for each enrollment group (Medicare, Medicaid, private payers, CHIP and
VBP settings. Additionally, existing providers will simultaneously receive training in critical value-based skills   dual-eligible), and then compares it to to projected spending under an intervention. The forecast estimates that
in order to transform the practicing environment.                                                                    by transforming the health care economy towards a VBP system, Aim 1, Subaim 1 will provide an average of
                                                                                                                     $332 per member savings over a 3-year period. Table 1 shows the savings estimates in a three and five year
                                                                                                                     period.
End-of-Life Care

Aim 2 focuses on helping patients designate their own life sustaining treatments. Subaims under Aim 2 look to                                 Table 1. Estimated Savings by State-wide Adoption of VBP
make sure that physician ordered life sustaining treatments (POLSTs) and patient advanced directives are elec-
tronically available to ensure that patient wishes regarding end-of-life care are honored. Additionally,
providers will be taught how to have crucial conversations with patients regarding end of live care and how to
assist patients in the development and institutionalization of POLSTs and advanced directives.

Primary Care and Behavioral Health

Aim 3 seeks to improve health care value by increasing access to primary and behavioral health. The goal is to
provide these critical services to more Utahns through increased behavioral health screenings, training and use
of interdisciplinary teams, and use of telehealth services.

Community Health

Aim 4 will create community-clinical linkages through increasing the use of community health workers within
                                                                                                                     Plan Overview
health systems and plans. The Plan envisions training programs for community health workers which will teach
them to incorporate general healthy behaviors in patient interactions with emphasis on tobacco cessation, diabe-     Additional details regarding the Plan can be found in the following sections:
tes control and management and overall weight and nutrition training.
                                                                                                                     Section II. Utah Health Innovation Vision, Mission and Aims
Plan Evaluation                                                                                                      This section outlines the vision and mission of the Plan, the policy mechanism for their development and the
In order to determine whether the proposed aims and interventions are having the intended impact, the results        resulting aims and interventions.
from the interventions will be evaluated against the expected outcomes from the Plan. Data will need to be col-
lected from various sources, including:
       • Provider surveys

       • Medicare administrative claims                                                                              Section III. Utah’s Current Health Care Environment- An Overview

                                                                                                                     A detailed description of current population and disease factors are included in this section. The section also

4      Utah Health Innovation Plan 2013                                                                                                                                                               Utah Health Innovation Plan 2013   5
includes current state and federal health reform and grant initiatives as well as health care cost performance     Utah Health Innovation Executive Policy Group
trends.                                                                                                            Under the direction of Governor Gary Herbert, then Lt. Governor Greg Bell chaired the EPG. Members include:
                                                                                                                          Lt. Governor Greg Bell, Chair (April-Nov)
                                                                                                                          Lt. Governor Spencer Cox, Chair (Nov-Dec)
Section IV. Design Process and Deliberations                                                                              W. David Patton, PhD. Executive Director, Utah Department of Health
                                                                                                                          Palmer DePaulis, Executive Director Utah, Department of Human Services (April-Nov)
This section summarizes the process used to develop the Plan and describes stakeholder involvement.                       Ann Williamson, Executive Director, Utah Department of Human Services (Nov-Dec)
                                                                                                                          Todd Kiser, Commissioner, Utah Insurance Department
Section V. Utah’s Road Map to Health System Transformation                                                                Representative Jim Dunnigan, Utah State House of Representatives
                                                                                                                          Senator Evan Vickers, Utah State Senate
This section outlines the development of the aims and interventions that will transform the current fee-for-ser-
                                                                                                                          John Oaks, Vice President, Government and Payer Relations, IASIS Health Care
vice environment to a quality-based purchasing system. The rationale and implementation plan including cost
                                                                                                                          Vivian Lee, M.D., MBA, PhD, Senior Vice President for Health Science, University of Utah Health
for each intervention are included.
                                                                                                                          Science Center:
                                                                                                                          Brian C. Hales, MD, President, Utah Medical Association
                                                                                                                          David Entwhistle, Board Chair, Utah Hospital Association
       Sections A, B, and C detail Utah’s implementation of the aims and interventions in the Plan and will ac-           John Ward, CFO, Harmons Grocery Stores
       celerate the value-based transformation in Utah. The expected outcomes of that transformation and the              Gregory J. Jones, Pharmacy Director, Harmons Grocery Stores
       subsequent cost savings expected as a result of their implementation are also detailed.                            Ben McAdams, Salt Lake County Mayor
                                                                                                                          Charles Sorensen, President and CEO, Intermountain Healthcare
                                                                                                                          John Hanshaw, President, Mt. Star Healthcare
       Section D details aims and interventions                                                                           George Meyers, Senior Vice President, and Director of Human Resources, Zions Bank

                                                                                                                   At the November 2013 EPG meeting, a mission statement was adopted that represents the final aims and in-
                                                                                                                   terventions included in the Plan and were adopted with some revisions by the EPG. The mission statement is
       Sections E and F outline the milestones that can be expected during the Plan’s implementation and list      meant to propel the Plan process forward into the implementation phase.
       the transformation timeline in spreadsheet format
                                                                                                                   Utah Health Innovation Plan Mission Statement
                                                                                                                   “The Plan seeks to improve the health of all Utahns through the implementation of a VBP health care
       Section G provides an explanation of how the Plan will be evaluated in meeting the outlined milestones,     environment. This transformative environment will lower costs through improved quality and access. To
       and the documentation or process for analyzing financial savings and cost impacts.                           achieve transformation the Plan aims to:

II. Utah Health Innovation Vision Mission and Aims                                                                                1) improve performance in a VBP environment;
The Vision of the Plan seeks to improve Utah’s overall health system performance leading to:                                      2) facilitate end-of-life preferences;
       • Better health
                                                                                                                                  3) increase access to primary and behavioral care; and
                                                                                                                                  4) create community- clinical linkages and healthful environments.”
       • Better healthcare
                                                                                                                   The Plan implements this mission statement using the guiding principal set out by Governor Herbert that a
       • Lower costs                                                                                               healthy population and an efficient delivery system are critical to the economic growth and well-being of Utah’s
                                                                                                                   citizens.
This vision statement reflects the leadership of Utah Governor Gary Herbert who first challenged the UDOH
in 2011 to create a health plan for the state that would reduce Utah’s health costs, provide an adequate health
                                                                                                                   The Plan outlines Utah’s current health care environment with demographics and descriptions of current
workforce trained to meet the cost reduction challenge and develop measurable innovations that would lead to
                                                                                                                   delivery systems. It further outlines the aims of the Plan:
more patient inclusion in assuring the quality of their own health care. The Plan is the result of work by many
dedicated citizens proving that “states are the true innovators.” The Plan’s vision statement was adopted in
April at the first meeting of the EPG.

6      Utah Health Innovation Plan 2013                                                                                                                                                           Utah Health Innovation Plan 2013   7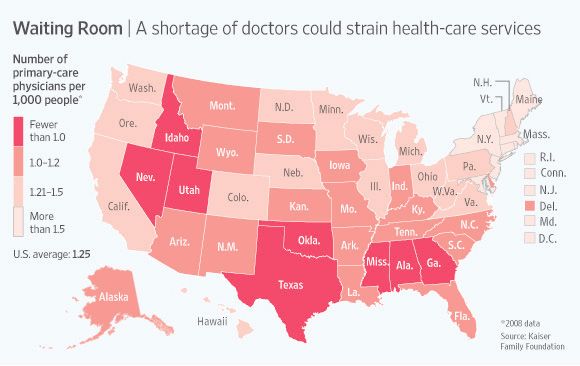
• how the transformation to a value-based system will be implemented based on those aims                               sult, Utahns of other cultures often experience barriers to receiving culturally sensitive and appropriate
                                                                                                                              health care. This will need to improve in order to eliminate disparities in health care access and health
       • how that process will be evaluated to assure that the aims are being met,                                            outcomes. Some racial groups have a genetic predisposition for certain kinds of diseases. As our racial
       • the costs to implement the Plan and
                                                                                                                              distribution changes, we can expect to see changing trends in those diseases.

       • potential cost savings of the Plan to the health system.                                                      Health Insurance Coverage Estimates in Utah:
                                                                                                                       Health insurance coverage in Utah is typically estimated using a set of state-added health insurance and access
                                                                                                                       questions that are included annually on the Utah Behavioral Risk Factor Surveillance System (BRFSS) survey
III. UTAH’S CURRENT HEALTH CARE ENVIRONMENT – AN OVERVIEW                                                              questionnaire. The Utah BRFSS estimates differ slightly from other common sources of information about the
                                                                                                                       uninsured in Utah including the US Census Bureau’s Current Population Survey (CPS) and the ACS. Accord-
A. Population Demographics                                                                                             ing to the 2012 Utah BRFSS, 13.2% of Utah residents (approximately 376,700) did not have health insurance
The characteristics of Utah’s population affect population health in important ways. We refer to these measures        coverage. Approximate percentages of residents with specific types of coverage are summarized below. The
as the demographic context of Utah’s population, or in more recent terminology, the social determinants of             estimates are similar to those provided by the Utah Department of Insurance Report that is cited later in this
health. Some of these measures were reported in the Utah Statewide Health Status Report (Utah Department of            document.
Health Office of Public Health Assessment, 2013) and are summarized below.
                                                                                                                       Percentage and numbers of Utah residents covered by the major insurers in the state (2012 BRFSS/Enhanced
       • The Utah population is the youngest in the nation. (Median age 29.6 years versus 37.3 according to            Health Insurance and Access Questions*):
       the 2011 American Community Survey (ACS)). Having a large percentage of the population made up of                      • 64.3% (1,835,700) Private through employer
       young children emphasizes the importance of making available key preventive health measures (e.g. im-
       munizations) and age-appropriate screenings to identify developmental delays at a time when treatment                  • 17.2% (488,800) Purchased directly
       is most effective.
                                                                                                                              • 12.0% (342,000) Medicare.
       • Utah has the highest birth rate in the nation, indicating that Utah has a greater relative need for precon-
       ception, prenatal, neonatal and postpartum care.                                                                       • 10.5% (300,300) Medicaid
       • Utah residents have a longer life expectancy at birth which indicates an increased need for resources
       and support for older residents, especially for those living with the types of chronic illnesses that are              • 1.9% (53,400) CHIP
       known to be more common in the elderly.
       • Utah has a higher percentage of households made up of married adults with children and a lower per-                  • 4.6% (131,400) Military
       centage of households with children headed by a single female than the US. These characteristics likely                • 0.8% (22,700) Student Health Plan
       benefit Utah residents as adults and children in single parent households are at higher risk for adverse
       health outcomes and unhealthy behaviors.                                                                               • 13.2% (376,700) Uninsured
       • Utah also has a higher high school graduation rate than the US as a whole. Although the exact reasons
       are unknown, higher education attainment is associated with improved health outcomes. Education level           * Respondents can select all that apply and therefore may choose more than one type of coverage. This means
       is strongly related to health status. People with a higher level of education are more likely to understand     that the sum of the percentages above will total to 100%.
       the consequences of life choices, are more capable to make good life choices, and are more able to deal
       with stress and other environmental factors that influence health. In addition, education strongly cor-          Profiles of Major Payers in Utah
       relates with income and work benefits.                                                                           Utah’s residents receive their health insurance coverage through health plans sponsored by the government, em-
       • Health status is strongly linked to income. Poverty is associated with negative health effects, especial-     ployers, and commercial health insurers. The Utah Insurance Department has attempted to estimate how much
       ly for children where it can have a serious impact on healthy development. And though Utah’s adult and          of the state is insured by each source of health insurance. The estimate is for comprehensive health insurance
       child poverty rates have historically been lower than the U.S., in recent years they have been increasing       coverage only (also known as major medical).
       and are approaching U.S. rates. Utah has a slightly higher median household income than the U.S. but                    • Approximately 54 percent of Utah’s commercial health insurance market is comprehensive health
       per capita income is lower due to Utah’s larger families.                                                               insurance (also known as major medical). The comprehensive health insurance industry serves approxi-
       • The White, non-Hispanic population continues to be the largest in Utah, but minority Black, Asian, Pa-                mately 30 percent of Utah residents.
       cific Islander and Hispanic populations are growing at a faster rate than the state population as a whole.
                                                                                                                              • In 2010, 350 commercial insurers reported commercial health insurance business in Utah. Utah’s com-
       Compared to the U.S., a larger percentage of Utah’s population is America Indian/Alaska Native (1.2%
                                                                                                                              mercial health insurance market is highly concentrated among nine domestic commercial health insurers,
       versus 0.8%) and Native Hawaiian/Pacific Islander (0.9% versus 0.2%). Our current health system was
                                                                                                                              which account for nearly 70% of the commercial market.
       developed based on the needs and perspectives of the White/Anglo-American Utah culture. As a re-

8      Utah Health Innovation Plan 2013                                                                                                                                                                 Utah Health Innovation Plan 2013   9
Figure 1. Estimate of Health Insurance Coverage for 2010          • The top three policy types by market share were comprehensive health insurance (54%), Medicare
                                                                                              Advantage products (18%) and the Federal Employee Health Benefit Plan (8%).

                                                                                              • A very small number of Utah residents are enrolled in Utah’s Comprehensive Health Insurance Pool
                                                                                              (HIPUtah). HIPUtah was established in 1991 to specifically address the problem of people with serious
                                                                                              medical conditions, such as cancer, diabetes, heart disease and other chronic illnesses that made them
                                                                                              unable to obtain health insurance at any price.

                                                                                              • Interestingly, group policies report higher premiums per member per month than individual policies.
                                                                                              For small employer groups (2-50), policies are based on the health of the group so even the health status
                                                                                              of one individual can affect the rating.

                                                                                              • Comprehensive health insurance plans are classified into four major plan types: Fee for Service (FFS),
                                                                                              Preferred Provider Organization (PPO), Health Maintenance Organization (HMO), and Health Mainte-
                                                                                              nance Organization with Point of Service features (HMO with POS).

                                                                                                                   Table 3. Total Comprehensive Market by Plan Type
                                                                                                           Plan type                         Member Count Market
                                                                                                                                                              Share
                                                                                                           Fee for Service                   28,097           7.44%
                                                                                                           Preferred Provider Organization   269,521          28.79%
                                                                                                           Health Maintenance Organization 170,008            21.98%
                                                                                                           HMO with Point of Service fea-    362,904          41.79%
                                                                                                           tures
                                                                                                           Total                             830,530          100.00%
                                                                                                                      Data Source: Utah Accident & Health Survey
                            Table 2. Detailed Estimate of Health Insurance Coverage
                                                                                       B. Health Status, Issues and Barriers
                                                                                       Utah has a relatively young and healthy population, though there are areas and sub-populations of concern
                                                                                       within the state. Many important measures of the health of Utah residents are reported and routinely updated on
                                                                                       Utah’s Indicator-Based Information System for Public Health (IBIS-PH). Most recently, a selection of IBIS-PH
                                                                                       Indicators were used to develop the Utah Statewide Health Status Report1. Much of the information summarized
                                                                                       below is from that report. The report included Healthy People 2020 Objectives where available, and addressed
                                                                                       at risk populations within the state. Information was arranged in topic areas as outlined below:

                                                                                       Healthy Beginnings: A healthy pregnancy and birth are vital to the well-being of women and infants partic-
                                                                                       ularly, but also families and communities. Early intervention for at-risk children and families can promote
                                                                                       optimal physical and mental development for all children.

                                                                                          • Prenatal Care: The percentage of women in Utah entering prenatal care in the first trimester of pregnancy
                                                                                          has increased from 71.6% in 2009 to 73.1% in 2010, but the Healthy People Target is 77.9%. In 2010, Utah
                                                                                          had a lower percentage of pregnant women who received prenatal care in the first trimester than in the U.S.
                                                                                          overall. Lack of early prenatal care is strongly linked with poverty and a lack of insurance coverage. At
                                                                                          risk populations include:

                                                                                          •   American Indians/AK Natives
                                                                                          •   Asians
                                                                                          •   Blacks/African Americans

10   Utah Health Innovation Plan 2013                                                                                                                                  Utah Health Innovation Plan 2013   11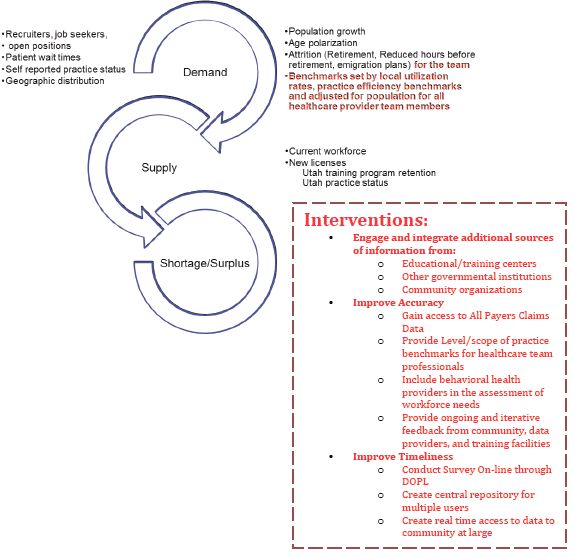
•   Native HI/Pacific Islanders                                                                                      • Breastfeeding: Utah rates are higher than the U.S. rates for ever breastfeeding during 2000–2008. The
     •   Hispanics/Latinos                                                                                               percentage of infants who were ever breastfed declined between 2006 (90.7%) and 2008 (84.5%), the lowest
     •   Women under 25 or over 40 years of age                                                                          rate since 2002. 2010 data indicate significant differences in the percentage of infants breastfed at discharge
     •   Women with a high school education or less                                                                      between birth facilities in Utah. At risk populations include:
     •   Unmarried women
                                                                                                                                 o   American Indians/AK Natives
     • Infant Mortality: During 2010, 251 Utah infants died during their first year of life. While Utah’s overall
                                                                                                                                 o   Women under 20 or over 44 years of age
     rate is lower than in the U.S. as a whole, there are disparities by racial groups. For Utah’s Asian and Pacific
     Islander populations, the rate of infant mortality is nearly twice that of Whites. Among Black women, the                   o   Women with lower educational attainment
     rate is more than double that of Whites.
                                                                                                                                 o   Unmarried women
     • Maternal Mortality: Utah’s maternal mortality has decreased from 36 deaths per year in 1940 to a range
     of 2–11 deaths per year between 1999 and 2009. However, Utah’s rate of maternal mortality has now nearly            • Immunizations 4:3:1:3:3:1: Utah’s coverage levels decreased from 76.6% of 2-year-old children fully
     doubled from what it was in 2004. Utah’s maternal mortality rate is higher than the U.S. rate. At risk popula-      immunized in 2008 to having 70.3% of 2-year-old children fully immunized in 2009. In 2010 70.6% of 2
     tions include:                                                                                                      year old Utah children were fully immunized. This means that in 2010, 29.4% of 2-year-olds were unpro-
                                                                                                                         tected against at least some types of preventable serious childhood illnesses. At risk populations include:
             o    Mothers under 18 years of age
                                                                                                                                 o   Children whose mothers are under 20 years of age
             o    Mothers over 40 years of age
                                                                                                                                 o   Third or subsequent children
             o    Mothers who did not receive adequate prenatal care
                                                                                                                      Healthy Behaviors and Risk Factors: Many health outcomes are directly linked to certain health behaviors
             o    African American/Black women                                                                        and risk factors. Practicing healthy behaviors, like exercising, or refraining from unhealthy behaviors, like
                                                                                                                      smoking, can markedly reduce an individual’s risk for many chronic conditions and adverse health outcomes.
     • Low Birth Weight: Utah’s low birth weight percentage increased from 6.0% in 1991 to 7.0% in 2010.
                                                                                                                              • Smoking Among Adults: In 2010, an estimated 8.8% of Utah adults smoked cigarettes every day or
     While this is below the HP2020 Objective target (7.8%) and is lower than the US rate, the increasing trend               some days. However, in 2011, using the new BRFSS methodology that includes cell phones, an esti-
     in Utah is of concern. At risk populations include:                                                                      mated 11.8% of Utah adults smoked (crude rate). And even though Utah has the lowest adult smoking
             o    Asians                                                                                                      rate of US states and has met the HP2020 target, there is still room for improvement. At risk populations
                                                                                                                              include:
             o    Blacks/African Americans
                                                                                                                             o   Individuals with lower levels of formal education
             o    Hispanics/Latinos
                                                                                                                             o   Individuals with lower household income
             o    Mothers under 25 or over 39 years of age
                                                                                                                             o   American Indians/AK Natives
             o    Women with lower educational attainment
                                                                                                                             o   Blacks/African Americans
             o    Women with lower income
                                                                                                                             o   Hispanics/Latinos
             o    Unmarried women
                                                                                                                             • Adult Smoking Cessation Attempt: In 2010, 65.2% of current smokers in Utah tried to quit smoking
     • Adolescent Births: Utah’s adolescent birth rate was 27.6 births per 1,000 females aged 15–19 in 2010.                 during the past 12 months. In 2011, using the new BRFSS technology, the estimate was 63.5%. The
     Utah’s adolescent birth rate has declined steadily since 2007 and continues to be below the U.S. rate. At risk          HP2020 target for this measure is 80%, so Utah needs to make some progress in order to meet this tar-
     populations include:                                                                                                    get. Quitting smoking has major and immediate health benefits including lower a person’s risk of many
                                                                                                                             chronic diseases.
             o    American Indians/AK Natives
                                                                                                                             • Smoking Among Adolescents: The rate of cigarette smoking among Utah high school students was
             o    Native HI/Pacific Islanders                                                                                 5.9% in 2011, which is lower than the US and meets the HP2020 target. Adolescent cigarette smoking
             o    Hispanics/Latinos                                                                                          has declined by 50% since 1999 when 11.9% of high school students reported that they had smoked
                                                                                                                             cigarettes in the past 30 days.

12       Utah Health Innovation Plan 2013                                                                                                                                                             Utah Health Innovation Plan 2013   13
• Adults Alcohol Consumption: Binge Drinking: 11.2% of Utah adults reported binge drinking in the                   o   Native HIs/Pacific Islanders
     past 30 days in 2011 (age-adjusted rate).The percentage of adults who reported binge drinking was sub-
     stantially lower in Utah than in the U.S and meets the HP2020 target. At risk populations include:                  o   Hispanic/Latinos

     o   Males                                                                                                           • Obesity Among Children and Adolescents: The percentage of obese elementary school students in
                                                                                                                         Utah has increased dramatically over the past 16 years. Overall, 9.7% of elementary school students
     o   Younger adults                                                                                                  were obese and 20.4% were at an unhealthy weight in 2010. Data from a 2011 high school survey show
                                                                                                                         that approximately 8.6% of Utah high school students are obese and 20.1% are at an unhealthy weight.
     o   Individuals experiencing poor mental health                                                                     The high school obesity rate rose from 5.4% in 1999. A total of 13.0% of American public high school
     o   American Indians/AK Natives                                                                                     students were obese (2011 national data) compared to 8.6% of Utah public high school students (2011
                                                                                                                         Utah data).
     o   Hispanics/Latinos
                                                                                                                         • Sun Safety Measures: In 2010, 64.9% of Utahns aged 18 years and older reported practicing sun
     • Substance Abuse in Adolescents: Alcohol: 15.1% of Utah high school students reported having had                   safety. The current rate of sun safety practice in Utah is below both the state and national Healthy Peo-
     at least one drink of alcohol in the past 30 days in 2011. The state as a whole is well below the national          ple 2020 goals. At risk population:
     average; however, there is great variation in drinking rates between local health districts.
                                                                                                                         o   Younger adults
     • Substance Abuse in Adolescents: Marijuana Use: 9.6% of Utah high school students reported
     having used marijuana at least once in the past 30 days in 2011. The state as a whole is well below the             • Seat Belts: Safety Restraint Use: In 2011, 89.2% of Utah drivers and front seat passengers were
     national average; however, marijuana use among high school students in Utah has increased since 2005.               observed wearing a seat belt or safety restraint. Individuals who live in small-population counties are
                                                                                                                         less likely to be observed wearing a seat belt than drivers and front seat passengers in large-population
     • Physical Activity: Recommended Levels Among Adults: In 2011, 56.1% of Utahns reported getting                     counties. Utah is below the HP2020 target of 92.4% for this measure. At risk populations include:
     the recommended amount of physical activity, meeting the HP2020 target of 47.9%. Compared to the
     nation, more Utahns are physically active. Nationally, the rate was 51.4%. At risk populations:                     o   Males

     o   Individuals with lower levels of formal education                                                               o   Individuals with lower levels of formal education

     o   Individuals with lower household income                                                                         o   Individuals who live in rural counties

     o   Hispanics/Latinos                                                                                        Chronic Disease and Conditions: Chronic diseases cause limitations in daily living for millions of Americans.
                                                                                                                  However, as costly and common as many chronic diseases are, they are also some of the most preventable
     • Physical Activity Among Adolescents: In 2011, 48.3% of student’s grades 9–12 reported getting              health problems in the U.S.
     the recommended amount of physical activity. In 2011, 40.7% of girls and 55.7% of boys in Utah high          Utah Chronic Disease Prevention and Health Promotion State Plan2
     schools reported getting at least 60 minutes of physical activity at least five days per week, which is one   UDOH’s Bureau of Health Promotion’s “Utah Chronic Disease Prevention and Health Promotion State Plan ~
     measure of an adequate amount of physical activity for this age group. Utah high school students report-     Partnering for a Healthy State.” This plan guides the work of public health and its partners in chronic disease
     ed similar rates of recommended physical activity in 2011 (48.3%) as the U.S. (49.5%).                       prevention, management and health promotion across all sectors of the community. It was created with input
                                                                                                                  from a variety of partners representing government, community-based organization, faith-based organization,
     • Obesity Among Adults: In 2010, nearly one in four Utah adults were obese (24.0%) and about two-            business/industry, health care organizations, and private organizations. The Utah Chronic Disease and Health
     thirds (59.7%) were at an unhealthy weight. These rates increased from 10.5% and 39.3%, respectively,        Promotion State Plan, in part, focuses on two key areas that are relevant to the Plan: health care systems (ac-
     in 1989. In 2011, using the new BRFSS methodology that includes cell phones, an estimated 24.4%              tivities within the health care system at large and with individual physicians) and community-clinical linkages
     (crude rate) of Utah adults were obese. The obesity prevalence for U.S. adults in 2011 was 27.3%. Utah       (activities that link the health care system and individual physicians with resources in the community).
     has actually met the US HP2020 target of 30.6% for this measure. The Utah target is 24.0%. At risk           Asthma Prevalence: 8.7% of Utahns reported (or had a parent report for them) having asthma in 2011 (crude
     populations include:                                                                                         rate). Utah’s adult asthma prevalence has risen since 2001 and passed the national average in 2010 (9.0% com-
                                                                                                                  pared to 8.7%). At risk populations include:
     o   Individuals without less formal education
                                                                                                                           o American Indians/AK Natives
     o   Individuals with lower household income
                                                                                                                         o   Non-Hispanic Whites
     o   American Indians/AK Natives
                                                                                                                         • Air Quality - Ozone: Several of the most urban counties in Utah have days that exceed the new ozone
     o   Blacks/African Americans                                                                                        standard of 0.075 ppm.

14   Utah Health Innovation Plan 2013                                                                                                                                                              Utah Health Innovation Plan 2013   15
• Air Quality - PM2.5: Several of the most urban counties in Utah have days that exceed the PM2.5                  • Lung Cancer Deaths: In 2010, 453 people in Utah died of lung cancer (a crude rate of 15.9 per
     standard. This may, in part, be due to Utah’s unique geography and seasonal conditions. PM2.5 levels               100,000 population).Utah’s age-adjusted lung cancer mortality rate has been significantly lower than the
     increase seasonally in the winter and are often due to inversions.                                                 U.S. for all years shown in the trend graph. Utah’s age-adjusted lung cancer mortality rate significantly
                                                                                                                        decreased from 23.4 per 100,000 population in 2005 to 20.85 per 100,000 population in 2010 which is
     • Diabetes Prevalence: Adults: The prevalence of diabetes continues to increase, both nationally and               significantly below the US HP2020 target. At risk populations include:
     in Utah. In 2010, approximately 6.5% of Utah adults aged 18 years and older had been diagnosed with
     diabetes, more than double the 1989 prevalence (3.1%) and compared to 9.8% nationally. This means                  o   Older individuals
     roughly 128,000 Utah adults had been diagnosed at some time in their lives, while studies show that an
     additional 45,000 Utah adults may have diabetes but don’t yet know it. At risk populations include:                o   Black/African Americans

     o   Older Individuals                                                                                              • Melanoma of the Skin Deaths: From 2003–2007, Utah had faster growing incidence and mortality
                                                                                                                        rates for melanoma when compared to the U.S. In 2010, 84 Utah residents died from melanoma, for a
     o   American Indians/AK Natives                                                                                    crude death rate of 2.4 per 100,000. In 2008, the age-adjusted death rate from melanoma in 2007 was
                                                                                                                        3.0 per 100,000 in Utah vs. 2.7 per 100,000 in the U.S. This rate in Utah exceeds the HP2020 target. At
     o   Blacks/African Americans                                                                                       risk population:
     • Coronary Heart Disease Deaths: Utah’s crude death rate due to coronary heart disease was 49.4                    o   Males
     deaths per 100,000 people in 2010, which is below the HP2020 target. Utah’s age-adjusted death rate
     from coronary heart disease of 83.8/100,000 was lower than the U.S. rate of 126.0/100,000 in 2007, the             • Prostate Cancer Deaths: In 2010, 222 Utah men died from prostate cancer (a crude death rate of 15.5
     most recent year with comparable data. At risk populations include:                                                per 100,000 Utah males). The age-adjusted prostate cancer mortality rate has been decreasing, at 24.9
                                                                                                                        per 100,000 males in Utah and 23.5 per 100,000 males in the U.S. in 2007. At risk population:
     o   Older Individuals
                                                                                                                        o   Non-Hispanic Whites
     o   Non-Hispanic Whites
                                                                                                                        • Health Status: Mental Health in Past 30 Days: In 2010, approximately 15% (crude rate) of Utah
     • Stroke (Cerebrovascular Disease) Death Rate: In 2010 there were 35.2 stroke deaths per 100,000                   adults reported seven or more days when their mental health was not good in the past 30 days.
     population, which is just slightly above the HP2020 target and similar to the US rate. The stroke death
     rate has declined in the last 30 years for both the U.S. and Utah. At risk population:                         Looking at age-adjusted rates for 2010, significantly fewer Utah adults (14.5%) reported seven or more days
                                                                                                                    when their mental health was not good in the past 30 days when compared to adults in the U.S. as a whole
     o   Older adults                                                                                               (15.8%). At risk populations include:
     • Alzheimer’s Disease Death Rate: In Utah there was 18.7 deaths per 100,000 population from Alz-                   o       Younger individuals
     heimer’s disease in 2010 which is lower than the US rate. However, Utah has the second highest growth
     rate of Alzheimer’s disease prevalence in the country.                                                             o       Individuals with less formal education

     • Breast Cancer Deaths: In 2010, 255 Utah women died from breast cancer, for a crude death rate of                 o       Individuals with lower household income
     17.8 per 100,000 Utah women. On average, Utah has consistently had a lower age-adjusted breast cancer
     mortality rate than the U.S. (19.9 per 100,000 versus 22.8 per 100,000 in 2007, the most recent year with          o       Females
     comparable data), and is slightly below the HP2020 target. At risk populations include:                            o       Whites
     o   Older women                                                                                                    o       American Indians/AK Natives
     o   Native Hawaiian/Pacific Islanders                                                                               o       Native Hawaiians/Pacific Islanders
     o   Non-Hispanic Whites
                                                                                                                 Injury: One person dies every three minutes from injury in the U.S. In 2009, more than 1,500 Utahns - or 30
     • Colorectal Cancer Deaths: In 2010, 250 Utahns died from colon cancer (a crude death rate of 8.8
                                                                                                                 people every week - died from injuries. Each year, treating injuries costs Utahns an average of $486 million in
     deaths per 100,000 population). Since 1980, Utah’s age-adjusted colorectal cancer mortality rate has
                                                                                                                 hospitalization and emergency department charges. Injuries are the leading cause of death for Americans and
     been consistently lower than the U.S. rate (12.1 per 100,000 versus 16.7 per 100,000 in 2007), and has
                                                                                                                 Utahns ages 1–44, with poisonings, firearms, and motor vehicle crashes the leading methods.
     met the HP2020 target. At risk population:

     o   Older adults

16   Utah Health Innovation Plan 2013                                                                                                                                                            Utah Health Innovation Plan 2013   17
• Fall Injury Hospitalizations and Deaths: Between 2008–2010 there were 496 fall-related deaths and • Immunizations: Pneumonia, Adults: In 2011 70.4% of Utahns aged 65 years and older reported hav-
14,520 hospitalizations in Utah. A significant majority of fall hospitalizations and deaths occur in the ing received a pneumococcal vaccination at any point in their lifetime (new BRFSS methodology). The
85+ age group. The rate of fall hospitalizations is higher for women; however men have a higher fall rate of pneumococcal vaccination among Utahns aged 65 years and older has remained relatively steady
death rate. At risk populations include: over the past decade and is comparable to the US rate. The Utah rate of pneumococcal vaccination for
adults aged 65 years and older is below the Healthy People 2020 national goal of 90%. At risk popula-
o Older Individuals tion:
o Urban county residents o Hispanics/Latinos
• Motor Vehicle Traffic Crash Deaths: Motor vehicle crash deaths are the second leading cause of • Measles Infections: The recent low rates of measles infection in Utah can be attributed both to im-
unintentional injury death in Utah. There has been a significant decrease in the motor vehicle crash death proved immunization rates, and the natural cycle of the disease. From 2005 through 2010, Utah has had
rate in Utah over the past 20 years. The state rate of 9.0 deaths per 100,000 was below the HP2020 US lower measles rates than the U.S., with only one confirmed case being reported during that period of
target of 12.4 deaths per 100,000 population and is lower than the US rate. At risk populations include: time. In the spring and early summer of 2011, Utah experienced an outbreak of measles with 15 con-
o Males firmed cases reported. There have been other measles outbreaks reported in the U.S. in 2011 as well.
• Pertussis Cases: In 2010 there were 12.3 reported cases per 100,000 population of pertussis in Utah
o Rural area residents
compared to 9.1 cases per 100,000 in the US. Pertussis rates have been increasing in Utah since 2008.
o Individuals over 65 years of age The majority of pertussis cases occurred in people aged 15 years and older, however incidence of the
disease was highest in children younger than age one. These children are also at the highest risk for seri-
o American Indians/AK natives ous complications from pertussis.
• Drug Overdose and Poisoning Incidents: From 2001 to 2007, Utah saw a 97.4% increase in age-ad- • Chlamydia Cases: In Utah there were 234.9 reported cases per 100,000 population of chlamydia in
justed poisoning death rates. In proper use of prescription pain medications is the underlying cause for 2010. The rate of chlamydia in Utah has consistently been below the national rate; however, both rates
many Utah poisoning deaths. In 2007, the latest year with comparable data, Utah’s age-adjusted poi- are on the rise. Chlamydia is the most frequently reported notifiable disease in Utah.
soning death rate of 21.4 per 100,000 population exceeded the U.S. poisoning death rate of 13.2 per
100,000. • Gonorrhea Cases: In Utah there were 10.9 reported cases per 100,000 population of gonorrhea in
2010. The rate of gonorrhea in Utah has consistently been below the national rate. Gonorrhea may be
• Suicides: The 2010 Utah age-adjusted suicide rate was 17.0 per 100,000 population. Utah’s suicide reported more frequently in men than women because most infections in men produce symptoms that
rate has been consistently higher than the national rate. From 2004 to 2008, according to the National cause them to seek testing and treatment, while infections in women may not produce significant symp-
Center for Health Statistics, Utah’s rate was 15.2 per 100,000 population compared to the U.S. rate of toms until complications develop (e.g. PID). At risk populations include:
11.2 per 100,000 population. Utah’s rate exceeds the US HP2020 target of 10.2 deaths/100,000. At risk
populations include: o Males
o Males o Young adults
o Non-Hispanic Whites o Blacks/African Americans
o American Indians/AK Natives o Hispanics/Latinos
Communicable Disease: Though previously the leading cause of death, huge public health advancements in • Syphilis Cases: Primary and Secondary: In Utah there were 2.3 reported cases per 100,000 popula-
the control of communicable diseases have reduced the burden of many of these diseases. However, many com- tion of syphilis in 2010, an increase from 2009 (1.2 cases per 100,000). The rate of syphilis in Utah has
municable diseases remain a threat to public health, however, and continued efforts are necessary to continue to consistently been below the national rate; however the Utah rate has been on the rise since 2007. At risk
control, and possibly further decrease, disease rates. population:
• Immunizations: Influenza, Adults: In 2011, 56.9% of Utah adults aged 65+ years reported having
o Males
received an influenza vaccination in the past 12 months (New BRFSS methodology, crude rate) com- • HIV and AIDS: As of October 2011, a total of 2,569 individuals diagnosed with HIV (regardless of
pared to the US rate of 60.6%. Over the past five years in Utah, the percentage of adults aged 65+ years, AIDS diagnosis) were currently known to be living in Utah. There has been an increase in the number
who report having had an influenza vaccination in the past 12 months has declined slightly. At risk of people living with HIV disease in Utah because AIDS-related deaths have been decreasing. The
population: majority of people living with HIV in Utah are male and aged 40–59 years.
o Hispanics/Latinos
18 Utah Health Innovation Plan 2013 Utah Health Innovation Plan 2013 19Access to and Utilization of Care: Access to health care is an issue for many Utah residents, whether it is due • Routine Dental Visits: In 2010, 72.7% of Utahns aged 18 years and older reported a dental visit in
to financial barriers (poverty and/or lack of insurance), geographic barriers (distance to needed services), cultur- the past year (68.7% using new BRFSS methodology). In state surveys, Utahns have reported problems
al barriers (including language/translation issues), or when needed services are not available. with access to dental care. The cost of dental care is the most commonly cited reason for problems with
access. Utah adults with dental insurance were more likely to report a dental visit in the past year than
• Cost as a Barrier to Health Care: In 2010, the crude percentage of Utah adults who reported being those without dental insurance.
unable to see a doctor in the past 12 months due to cost was 14.2%. This is the highest the measure has
been since tracking started in 2003. This percentage was the highest for adults aged 18–24 (20.5%) and • Asthma-related Emergency Department Visits: Tracking rates of emergency department visits
lowest for Utah adults aged 65 and older (3.8%). Utah adults with low incomes had a higher rate of re- for asthma can aid in identifying populations or areas with inadequate access to routine medical care.
porting cost as a barrier to health care than those with higher incomes. When comparing Utah to the U.S. Utah’s rate of ED visits for asthma is well below the Health People 2020 objectives for ages 0–4 and
as a whole, the age-adjusted percentage of adults who reported they were unable to get needed health 5–64. However, the ED visit rate in Utah for adults aged 65+ (17.2 per 10,000) exceeds the HP2020
care in the past year due to cost has been similar over the years. In 2011, this percentage was 17.3% in objective. At risk populations include:
the U.S. compared to 16.3% in Utah, not a statistically significant difference. At risk populations in- o Male children
clude:
o Adolescents
o Individuals with lower household income
o People 65+
o Individuals with lower levels of formal education
o Adult females
o Young adults
• Diabetes Hemoglobin A1C Tests: From 2009–2011 an average of 66.0% of Utah adults with diabetes
o Uninsured Individuals reported having had at least two hemoglobin A1C tests in the past year (age-adjusted rate). This rate is
• Health Insurance Coverage: An estimated 13.3% of all Utah residents did not have health insurance below the US HP2020 target of 71.1%. Tight control of A1C levels (i.e., maintaining a level of less than
coverage in 2011. The estimate may actually be as high as 15.3%, or 421,900 Utah residents, according 7%) has been shown to be associated with substantial reductions in kidney disease and blindness among
to a Census Bureau survey that is mailed and includes follow-up phone calls and face-to-face interviews people with diabetes.
when needed. The US rate, according to the national survey, is comparable to Utah’s rate. By either • Diabetes Eye Exam: In 2012, 65.1% of Utah adults with diabetes reported receiving a dilated eye
measure, the uninsured rate in Utah has increased in recent years. At risk populations include: exam within the previous year and 78.3% reported an annual foot exam. This was less than the median
o Individuals with lower household income of 72.3% reported for all 33 states that asked this question, but higher than the HP2020 target of 58.7%.
At risk population:
o Young adult males
o Individuals with a high school education versus those with post-secondary education
o Unemployed individuals
• Diabetes Foot Exam: In 2012, 78.3% of Utah adults with diabetes reported an annual foot exam.
o American Indians/AK Natives This was slightly higher than the median of 77.8% for all 33 states that asked this question and above the
HP2020 target of 74.8%. At risk population:
o Asians
o Individuals with a high school education versus those with post-secondary education
o Blacks/African Americans
• Doctor-diagnosed High Cholesterol: The crude percentage of Utah adults who were ever told they
o Hispanics/Latinos had high cholesterol was 23.5% in 2009. Both the U.S. and Utah have seen an increase in the age-ad-
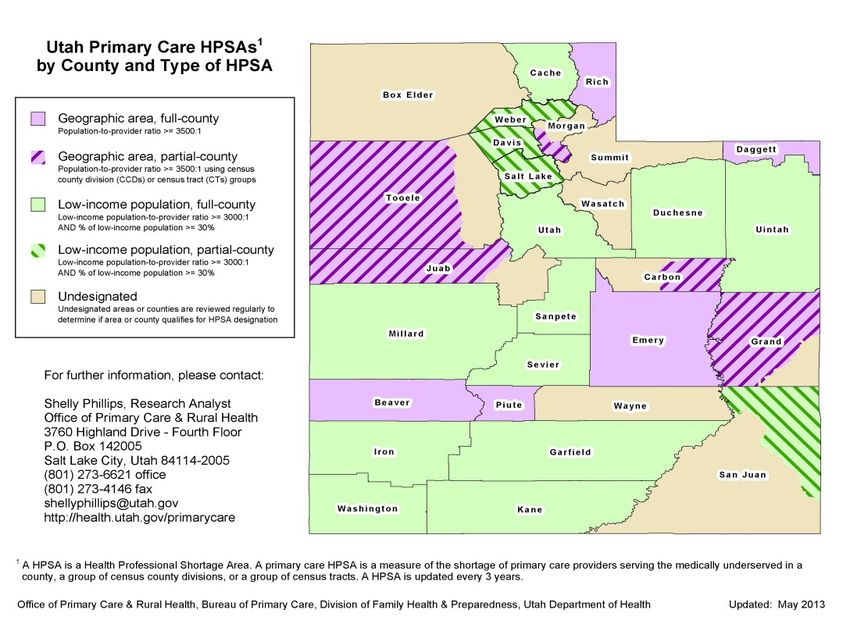
• Physicians per 10,000 Civilian Population: The physician supply in Utah has kept up with popula-
justed percentage since 1991 when it was 19.6% in the U.S. and 16.4% in Utah. At risk populations
tion growth but is lower than in the U.S. as a whole, with the gap widening over time. From 1997 to include:
2008, there were between 19.6 and 21.2 active physicians per 10,000 civilian population, with 20.8 in o Older individuals
2008 compared to 27.7 per 10,000 civilian population in the U.S.
o Asians
• Routine Medical Care Visits: In 2010 the percentage of individuals who reported having a routine
check-up in the past year in Utah was below the national average, 59.9% compared to 66.9% (age-ad- o Whites
justed rate). Among Utah adults, women had a higher rate (62.0%) of having a routine check-up in the
past year than men (55.2%). At risk population: • Doctor-diagnosed Hypertension: The crude percentage of Utah adults who reported ever being told
o Uninsured adults
20 Utah Health Innovation Plan 2013 Utah Health Innovation Plan 2013 21You can also read