2019 GLOBAL HUNGER INDEX - THE CHALLENGE OF HUNGER AND CLIMATE CHANGE - ReliefWeb
←
→
Page content transcription
If your browser does not render page correctly, please read the page content below
2019
GLOBAL HUNGER INDEX
THE CHALLENGE OF HUNGER AND CLIMATE CHANGE
2019
GLOBAL HUNGER INDEX
THE CHALLENGE OF HUNGER AND CLIMATE CHANGE

Klaus von Grebmer, Jill Bernstein, Fraser Patterson, Miriam Wiemers, Réiseal Ní Chéilleachair, Connell Foley,
Seth Gitter, Kierstin Ekstrom, and Heidi Fritschel

Guest Author
Rupa Mukerji, Helvetas

Dublin / Bonn
October 2019

A Peer-Reviewed Publication
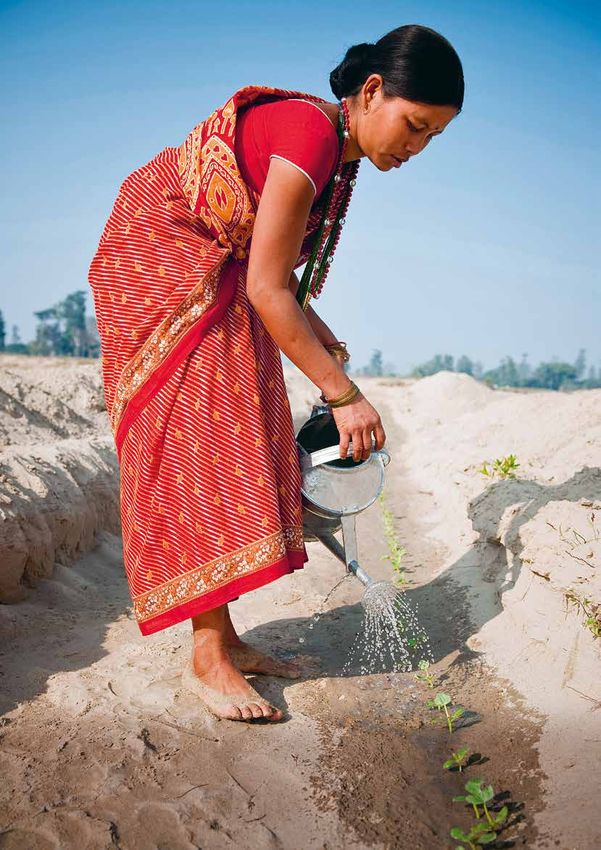
Rupa Chaudari waters seedlings in a riverbed in Nepal. Women, who
carry out a large share of agricultural labor worldwide, are often
particularly vulnerable to the impacts of climate change. Their knowledge
and roles in communities are key to developing adaptation strategies.
CLIMATE JUSTICE: A NEW
NARRATIVE FOR ACTION

                                Mary Robinson
                                Adjunct Professor of Climate Justice, Trinity College Dublin
                                Former UN High Commissioner for Human Rights and
                                Former President of Ireland

I
    t is a terrible global indictment that after decades of sustained    stemming from the different social roles of women and men in many
    progress in reducing global hunger, climate change and conflict      areas, there is a need for women’s leadership on climate justice.
    are now undermining food security in the world’s most vulnera-          Climate justice is a transformative concept. It insists on a shift
ble regions.                                                             from a discourse on greenhouse gases and melting icecaps into a civil
    With the number of hungry people rising from 785 million in          rights movement with the people and communities most vulnerable to
2015 to 822 million in 2018, we can no longer afford to regard the       climate impacts at its heart. It gives us a practical, grounded avenue
2030 Agenda and the Paris Climate Agreement as voluntary and a           through which our outrage can be channeled into action. Ensuring
matter for each member state to decide on its own. Instead, the full     access to nutritious food is central to this pursuit of climate justice.
implementation of both has become imperative in order to secure             While we live in an age of great uncertainty, we are beginning to
a livable world for our children and grandchildren. This requires a      witness a greater consensus on the need for change. As we see the
change of mind-set at the global political level.                        overlapping and compounding effects of climate change, inequality,
    In the past decade, since the formation of the Climate Justice       conflict, poverty, and hunger, we must understand the inextricable
Foundation, I have had the opportunity to speak with those on the        connections between environmentalism, development, and social
front lines of climate change: leaders of Pacific Island communities     justice. With that understanding come opportunities for galvanized
facing an immediate existential threat from rising sea levels; women     action and impact on an unprecedented scale.
in Honduras who for the first time had no access to water because           The next generation are the activists of today. The next generation
of an El Niño phenomenon of unprecedented strength; herdsmen             also includes those children whose health and well-being are being
and herdswomen of the Sahel and the Lake Chad Basin whose live-          shaped by undernutrition, whose futures will be determined by our
lihoods are evaporating with the lake itself. These people showed        climate action—or our inaction.
me how the climate breakdown is hitting those furthest behind first.        Climate breakdown is a spotlight on the fragility of our shared
    That is the greatest injustice of climate change—that those who      existence, and we all must live up to the universal obligations that
bear the least responsibility for climate change are the ones who will   we have to each other, to our planet, and to its future.
suffer the most. This year’s Global Hunger Index provides a timely
illustration of how climate breakdown disrupts food systems, jeop-       Climate justice gives us a new narrative for action.
ardizing one of the most fundamental rights we all share as human
beings—the right to adequate and sufficient food.
    Climate change is an issue not only of environmental conservation,
but also of justice and human rights. Because of the gender impacts

2019 Global Hunger Index | Climate Justice: A New Narrative for Action3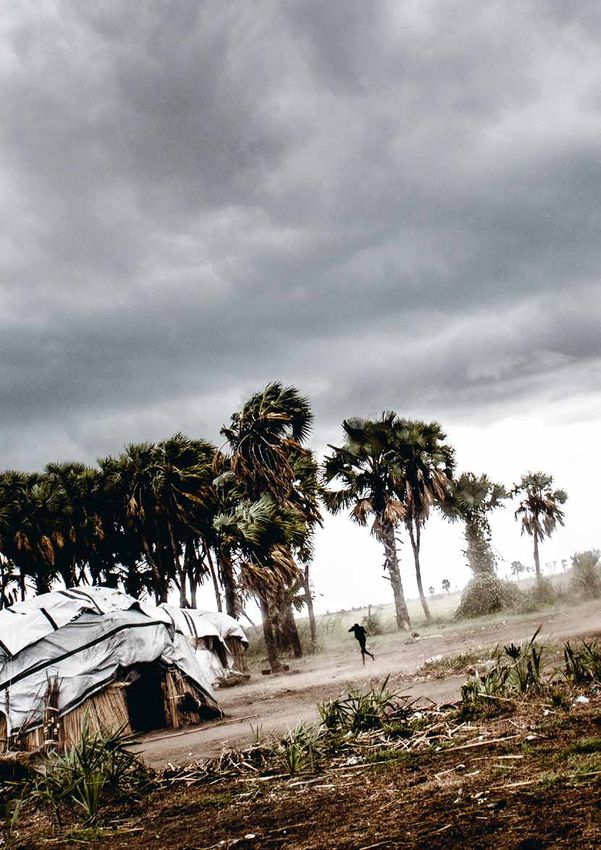
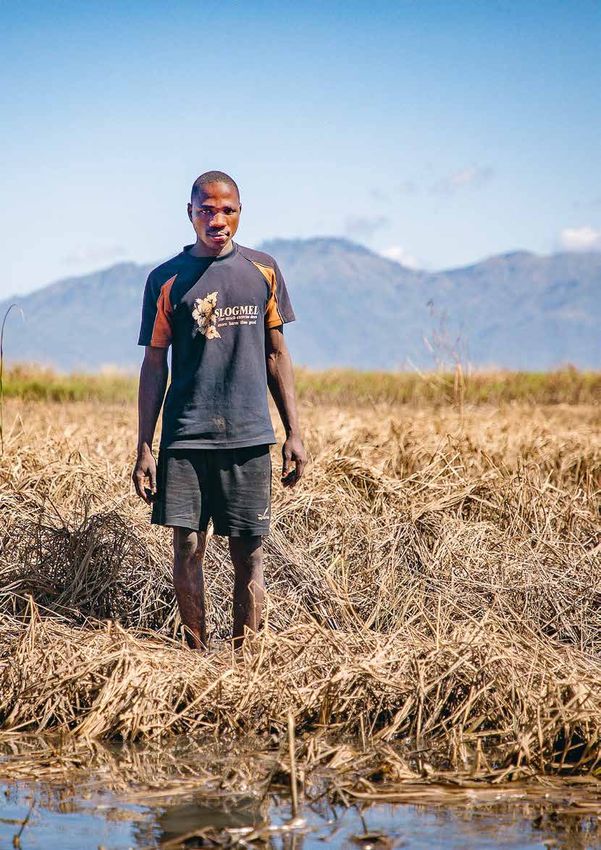
Patrick Ghembo stands in his maize field in Monyo Village, Malawi, his
harvest destroyed by Cyclone Idai. He returned to his farm to fish in order
to feed his family, who lived in a temporary camp for displaced people.
FOREWORD

W
          e have just a decade left. Although the commitment to            people’s food security and nutrition, they require additional efforts
          reach Zero Hunger by 2030 is a fundamental ambition of           and support if they are to achieve a sustained positive impact.
          the Sustainable Development Goals, our hard-won gains               With climate change radically altering the environment within
are now under threat or being reversed. The 2019 GHI shows that            which we work to eliminate hunger, the connection between climate
multiple countries have higher hunger levels now than in 2010, and         and hunger is the focus of this year’s special GHI essay by Rupa
approximately 45 countries are set to fail to achieve low levels of hun-   Mukerji of the Swiss development organization Helvetas. Climate
ger by 2030. Conflict, inequality, and the effects of climate change       change involves a painful element of injustice: its impacts are likely
have all contributed to persistently high levels of hunger and food        to be felt most severely by the poorest and most vulnerable—those
insecurity around the world.                                               who have contributed to it the least and often have the least capacity
   Some countries, such as Ethiopia and Rwanda, have made nota-            to adapt to it. Climate change is already exacerbating tensions and
ble progress in reducing hunger in the past 20 years, illustrating the     conflict, destroying livelihoods, driving displacement, worsening eco-
effects of well-targeted hunger reduction policies as well as the con-     nomic and gender inequalities, and undermining long-term recovery
sequences of their emergence from periods of conflict and instabil-        and sustainable development. This year’s GHI sets out in no uncer-
ity. However, this year’s GHI shows that many countries still require      tain terms the ways in which climate change is likely to jeopardize
urgent attention. Alarming levels of hunger exist in four countries,       food and nutrition security in the future.
Chad, Madagascar, Yemen, and Zambia, while for the second year                Concern Worldwide and Welthungerhilfe share a mission to
in a row, the Central African Republic is the only country where hun-      eradicate hunger, and produce the GHI every year to track hunger
ger is classified as extremely alarming. Furthermore, in many coun-        levels around the world, understand progress, and spotlight areas
tries where we know that hunger is widespread, such as Burundi,            for action. This year’s GHI highlights the inextricable link between
Democratic Republic of Congo, Somalia, South Sudan, and Syria,             hunger and climate change and the shared urgency of solving two of
there are insufficient data for assessment and inclusion in the GHI.       the world’s greatest challenges. As climate breakdown accelerates,
   This year’s report includes a closer look at hunger and undernu-        it is clear that all sections of society—nations, donors, businesses,
trition in Haiti and Niger, with an examination of the main factors        NGOs, and communities—will have to put their shoulders to the wheel
contributing to hunger and the policy environment in which those           to arrest this environmental devastation and ensure we set a course
factors operate. Both countries face serious hunger and are already        for genuine global sustainability, universal food security, and
being severely impacted by climate change. Although the two coun-          Zero Hunger.
tries are implementing a range of programs and policies to improve

                                                                           Mathias Mogge                                Dominic MacSorley
                                                                           Secretary General                            Chief Executive Officer
                                                                           Welthungerhilfe                              Concern Worldwide

2019 Global Hunger Index | Foreword5
CONTENTS

     Chapter 01                Chapter 02                 Chapter 03              Chapter 04               Chapter 05

SUMMARY                                                                                                                    7

CHAPTERS
01      The Concept of the Global Hunger Index                                                                             8
02      Global, Regional, and National Trends                                                                             12
03      Climate Change and Hunger                                                                                         26
04      A Closer Look at Hunger and Undernutrition: Niger and Haiti                                                       36
05      Policy Recommendations                                                                                            48

APPENDIXES
A       Formula for Calculation of Global Hunger Index Scores                                                             50
B       Data Sources for the Global Hunger Index Components, 2000, 2005, 2010, and 2019                                   51
C       Data Underlying the Calculation of the 2000, 2005, 2010, and 2019 Global Hunger Index Scores                      52
D       2000, 2005, 2010, and 2019 Global Hunger Index Scores, and Change since 2000                                      54
E       Regional Comparisons, Ordered from Highest to Lowest 2019 Global Hunger Index Scores                              55

BIBLIOGRAPHY                                                                                                              59

PARTNERS                                                                                                                  66

6                                                                                         Contents | 2019 Global Hunger Index
SUMMARY
The 2019 Global Hunger Index (GHI) shows that while the world has are alarming. Out of the 117 countries that were ranked, 43 have
made gradual progress in reducing hunger on a global scale since serious levels of hunger. The GHI report also looks more closely at
2000, this progress has been uneven. Hunger persists in many coun- hunger in Haiti and Niger, both of which have serious levels of hunger
tries, and in some instances progress is even being reversed. The and are highly vulnerable to the effects of climate change.
GHI highlights where more action is most needed.
Data Are Missing for Some Countries of Concern
Global Hunger Is Moving from Serious to Moderate
GHI scores could not be calculated for several countries because
With a 2019 GHI score of 20.0, the level of hunger and undernutrition data were not available for all four GHI indicators. In nine of these
worldwide is on the cusp of the moderate and serious categories. This countries—Burundi, Comoros, Democratic Republic of Congo, Eritrea,
score reflects a decline of 31 percent since 2000, when the global Libya, Papua New Guinea, Somalia, South Sudan, and Syria—hunger
GHI score was 29.0 and fell into the serious category. Underlying this and undernutrition are identified as a cause for significant concern.
improvement are reductions in each of the four GHI indicators—the
rates of undernourishment, child stunting, child wasting, and child
Addressing Hunger Means Understanding
mortality—since 2000.
Subnational and Local Realities
Inequalities within country borders allow hunger and undernutrition
Areas of Severe Hunger Remain
to persist even in countries that appear to be doing well according to
Extreme climatic events, violent conflicts, wars, and economic slow- national averages. Subnational data on child stunting are invaluable
downs and crises continue to drive hunger in many parts of the world. for highlighting areas within a country that are losing ground, stag-
The number of people who are undernourished actually rose from nating, or excelling in the fight against child undernutrition.
785 million in 2015 to 822 million in 2018. Nine countries in the
GHI in the moderate, serious, alarming, or extremely alarming cate-
Climate Change Is a Threat Multiplier for Hungry and
gories have higher scores today than in 2010, including the Central
Undernourished People
African Republic, Madagascar, and Yemen.
Since the early 1990s, the number of extreme weather-related disas-
ters has doubled, reducing the yields of major crops and contributing
Hunger Is Highest in the Regions of South Asia and
to food price hikes and income losses. These disasters have dispro-
Africa South of the Sahara
portionately harmed low-income people and their access to food.
South Asia and Africa South of the Sahara are the regions with the high- Looking ahead, climate models project higher average temperatures
est 2019 GHI scores, at 29.3 and 28.4 respectively, indicating seri- in most land and ocean regions, hot extremes in most inhabited
ous levels of hunger. In South Asia this score is driven by high rates of regions, and heavy precipitation and an increasing probability of
child undernutrition; in Africa South of the Sahara the score is due to drought in some areas—all additional challenges for reducing hunger.
high undernourishment and child mortality rates, as well as high child
undernutrition. In contrast, the 2019 GHI scores for Eastern Europe
Reducing the Threat Requires Large-scale Action and
and the Commonwealth of Independent States, Latin America and
Radical Transformation
the Caribbean, East and Southeast Asia, and the Near East and North
Africa range from 6.6 to 13.3, indicating low or moderate hunger levels. Ending hunger and undernutrition in a changing climate demands
large-scale action to address the inequities exacerbated by climate
change while minimizing environmental changes that could prove
In Five Countries, Hunger Remains Alarming or
catastrophic to human life. It requires us to better prepare for and
Extremely Alarming
respond to disasters, support resilience and adaptation among the
According to the 2019 GHI, of the countries for which data are most vulnerable groups and regions, address global inequalities, mit-
available, one country, the Central African Republic, suffers from a igate climate change without compromising food and nutrition secu-
level of hunger that is extremely alarming, while four others—Chad, rity, make financing for climate action fair and effective, and radically
Madagascar, Yemen, and Zambia—suffer from levels of hunger that transform food systems.
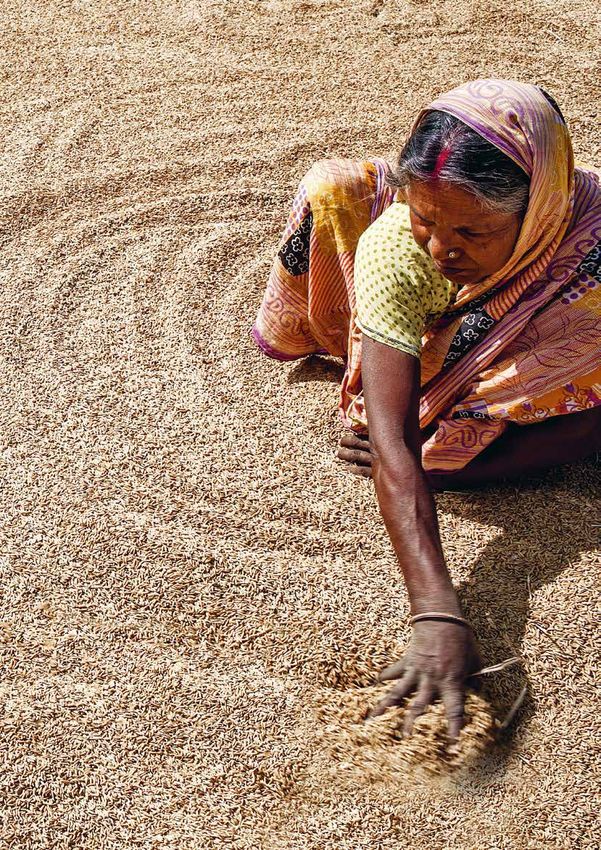
2019 Global Hunger Index | Summary701 A rice producer spreads out the harvest to dry in the sun in Dudhitanr, Jharkhand, India. Rice, the main staple crop for more than half of the world’s population, is highly sensitive to minor changes in temperature, making yields extremely susceptible to climate change.
THE CONCEPT OF THE
GLOBAL HUNGER INDEX

T
     he Global Hunger Index (GHI) is a tool designed to compre-
     hensively measure and track hunger at global, regional, and                  BOX 1.1      WHAT IS MEANT BY “HUNGER”?
     national levels.1 GHI scores are calculated each year to assess
progress and setbacks in combating hunger. The GHI is designed to                 The problem of hunger is complex, and different terms are
raise awareness and understanding of the struggle against hunger,                 used to describe its various forms.
provide a way to compare levels of hunger between countries and                        Hunger is usually understood to refer to the distress
regions, and call attention to those areas of the world where hunger              associated with a lack of sufficient calories. The Food
levels are highest and where the need for additional efforts to elim-             and Agriculture Organization of the United Nations (FAO)
inate hunger is greatest.                                                         defines food deprivation, or undernourishment, as the
   Measuring hunger is complicated. To use the GHI information                    consumption of too few calories to provide the minimum
most effectively, it helps to understand how the GHI scores are                   amount of dietary energy that each individual requires to
calculated and what they can and cannot tell us.                                  live a healthy and productive life, given that person’s sex,
                                                                                  age, stature, and physical activity level.3
Assembling the GHI                                                                     Undernutrition goes beyond calories and signifies defi-
                                                                                  ciencies in any or all of the following: energy, protein, and/
How are the GHI scores calculated?                                                or essential vitamins and minerals. Undernutrition is the
GHI scores are calculated using a three-step process that draws on                result of inadequate intake of food in terms of either quan-
available data from various sources to capture the multidimensional               tity or quality, poor utilization of nutrients due to infections
nature of hunger (Figure 1.1).                                                    or other illnesses, or a combination of these immediate
                                                                                  causes. These, in turn, are caused by a range of under-
First, for each country, values are determined for four indicators:               lying factors, including household food insecurity; inade-
                                                                                  quate maternal health or childcare practices; or inadequate
1. UNDERNOURISHMENT: the share of the population that is under-                   access to health services, safe water, and sanitation.
   nourished (that is, whose caloric intake is insufficient)                           Malnutrition refers more broadly to both undernutrition
                                                                                  (problems caused by deficiencies) and overnutrition (prob-
2. CHILD WASTING: the share of children under the age of five who                 lems caused by unbalanced diets, such as consuming too
   are wasted (that is, who have low weight for their height, reflect-            many calories in relation to requirements with or without low
   ing acute undernutrition)                                                      intake of micronutrient-rich foods). Overnutrition, resulting
                                                                                  in overweight, obesity, and noncommunicable diseases, is
3. CHILD STUNTING: the share of children under the age of five who                becoming increasingly common throughout the world, with
   are stunted (that is, who have low height for their age, reflecting            implications for human health, government expenditures,
   chronic undernutrition)                                                        and food systems development. While overnutrition is an
                                                                                  important concern, the GHI focuses specifically on issues
4. CHILD MORTALITY: the mortality rate of children under the age of               relating to undernutrition.
   five (in part, a reflection of the fatal mix of inadequate nutrition                In this report, “hunger” refers to the index based on
   and unhealthy environments)2                                                   four component indicators. Taken together, the compo-
                                                                                  nent indicators reflect deficiencies in calories as well as
   Second, each of the four component indicators is given a stan-                 in micronutrients.
dardized score on a 100-point scale based on the highest observed
level for the indicator on a global scale in recent decades.
   Third, standardized scores are aggregated to calculate the GHI
                                                                          1
score for each country, with each of the three dimensions (inade-             For further background on the GHI concept, see Wiesmann (2006) and Wiesmann et al.
                                                                              (2015).
quate food supply; child mortality; and child undernutrition, which       2
                                                                              According to Black et al. (2013), undernutrition is responsible for 45 percent of deaths
is composed equally of child stunting and child wasting) given                among children younger than five years old.
                                                                          3
                                                                              The average minimum dietary energy requirement varies by country—from about 1,650 to
equal weight (the formula for calculating GHI scores is provided
                                                                              more than 2,000 kilocalories (commonly, albeit incorrectly, referred to as calories) per per-
in Appendix A).                                                               son per day for all countries with available data in 2016 (FAO 2017).

2019 Global Hunger Index | Chapter 01 | The Concept of the Global Hunger Index9
Figure 1.1 COMPOSITION OF THE GLOBAL HUNGER INDEX
cognitive development, and death. The inclusion of both child wast-
ing and child stunting allows the GHI to document both acute and
chronic undernutrition. By combining multiple indicators, the index
reduces the effects of random measurement errors.
1/3 CH
LY IL
PP UN
DE
T Where do the source data for the four indicators come from?
D
SU
N > Measures > Death is the most
R
M
E
-F
Data for the indicators come from data collected by various UN and
OD
M
inadequate food serious consequence
OR
IV
SH
supply, an important of hunger, and children
E
FO
TA
RI
indicator of hunger are the most vulnerable
MO
other multilateral agencies. Undernourishment data are provided by
OU
> Refers to the entire > Improves the GHI’s ability to LIT
TE
RT
ERN
population, both children reflect micronutrient
the Food and Agriculture Organization of the United Nations (FAO).
ALI
INADEQUA
Y 1/3
and adults deficiencies
UND
TY R
> Used as a lead
indicator for
> Wasting and stunting
only partially capture
Child mortality data are sourced from the United Nations Interagency
GHI
ATE
international the mortality risk of
hunger targets, COMPOSITION undernutrition Group for Child Mortality Estimation (UN IGME). Child wasting and
including the
SDGs 3 dimensions child stunting data are drawn from the joint database of UNICEF, the
4 indicators
World Health Organization (WHO), and the World Bank, as well as
> Goes beyond calorie availability,
considers aspects of diet quality and utilization
from WHO’s continually updated Global Database on Child Growth
> Children are particulary vulnerable to nutritional deficiencies and Malnutrition, the most recent reports of the Demographic and
> Is sensitive to uneven distribution of food within
the household Health Surveys (DHS) and Multiple Indicator Cluster Surveys (MICS),
W > Stunting and wasting are nutrition
6
AS indicators for the SDGs 1/ and statistical tables from UNICEF.
TI G
NG T IN
1/6 UN The GHI scores presented here reflect the latest revised data
ST
CH
ILD 1/3 available for the four indicators.4 Where original source data were
UNDER ON
NUTRITI unavailable, estimates for the GHI component indicators were based
on the most recent available data. (Appendix B provides more detailed
Source: Wiesmann et al. (2015).
Note: The values of each of the four component indicators are standardized. See Appendix A background information on the data sources for the 2000, 2005,
for the complete GHI formula and Appendix B for the sources of data. SDGs = Sustainable 2010, and 2019 GHI scores.)
Development Goals.
Understanding the GHI
This three-step process results in GHI scores on a 100-point GHI
Severity Scale, where 0 is the best score (no hunger) and 100 is the Why is a certain country’s GHI score so high (or so low)?
worst. In practice, neither of these extremes is reached. A value of The key to understanding a country’s GHI score lies in that country’s
0 would mean that a country had no undernourished people in the indicator values, especially when compared with the indicator values
population, no children younger than five years who were wasted or for other countries in the report (see Appendix C for these values).
stunted, and no children who died before their fifth birthday. A value For some countries, high scores are driven by high rates of under-
of 100 would signify that a country’s undernourishment, child wasting, nourishment, reflecting a lack of calories for large swathes of the
child stunting, and child mortality levels were each at approximately population. For others, high scores result from high levels of child
the highest levels observed worldwide in recent decades. The GHI wasting, reflecting acute undernutrition; child stunting, reflecting
Severity Scale on p. 11 shows the severity of hunger—from low to chronic undernutrition; and/or child mortality, reflecting children’s
extremely alarming—associated with the range of possible GHI scores. hunger and nutrition levels, as well as other extreme challenges fac-
ing the population. Broadly speaking, then, a high GHI score can be
Why does the GHI incorporate four different indicators? evidence of a lack of food, a poor-quality diet, inadequate child care-
Using this combination of indicators to measure hunger offers sev- giving practices, an unhealthy environment, or all of these factors.
eral advantages. The indicators included in the GHI formula reflect While it is beyond the scope of this report to provide a detailed
caloric deficiencies as well as poor nutrition. The undernourishment explanation of the circumstances facing each country in the
indicator captures the hunger situation of the population as a whole, index, Chapter 2 describes the circumstances in select coun-
while the indicators specific to children reflect the nutrition status tries. Furthermore, this report offers other avenues for examining a
within a particularly vulnerable subset of the population for whom a
4
For previous GHI calculations, see von Grebmer et al. (2018, 2017, 2016, 2015, 2014,
lack of dietary energy, protein, and/or micronutrients (essential vita-
2013, 2012, 2011, 2010, 2009, 2008); IFPRI, WHH, and Concern Worldwide (2007); and
mins and minerals) leads to a high risk of illness, poor physical and Wiesmann, Weingärtner, and Schöninger (2006).
10 The Concept of the Global Hunger Index | Chapter 01 | 2019 Global Hunger IndexGHI Severity Scale
≤ 9.9 10.0–19.9 20.0–34.9 35.0–49.9 ≥ 50.0
low moderate serious alarming extremely alarming
0 10 20 35 50
Source: Authors.
country’s hunger and nutrition situation: country rankings based on Can I compare the GHI rankings in this report to those in previous
2019 GHI scores appear in Table 2.1; GHI scores for selected years reports to understand how the situation in a country has changed
for each country appear in Appendix D; and regional comparisons over time relative to other countries?
appear in Appendix E. No—like the GHI scores and indicator values, the rankings from one
year’s report cannot be compared to those from another. In addition
Does the 2019 GHI reflect the situation in 2019? to the data and methodology revisions described previously, differ-
The GHI uses the most up-to-date data available for each of the GHI ent countries are included in the ranking every year. This is due in
indicators, meaning that the scores are only as current as the data. part to data availability—the set of countries for which sufficient
For the calculation of the 2019 GHI scores, undernourishment data data are available to calculate GHI scores varies from year to year. If
are from 2016–2018; child stunting and child wasting data are from a country’s ranking changes from one year to the next, it may be in
2014–2018, with the most current data from that range used for part because it is being compared with a different group of countries.
each country; and child mortality data are from 2017. Furthermore, the ranking system was changed in 2016 to include
all of the countries in the report rather than just those with a GHI
How can I compare GHI results over time? score of 5 or above. This added many countries with low scores to
Each report includes GHI scores and indicator data for three refer- the ranking that had not been previously included.
ence years in addition to the focus year. In this report, 2019 GHI
scores can be directly compared with the GHI scores given for three Why do some countries not have a GHI score?
reference years—2000, 2005, and 2010 (Appendix D). Because data for all four indicators in the GHI formula are not avail-
able for every country, GHI scores could not be calculated for some.
Can I compare the GHI scores and indicator values in this report Box 2.1 in Chapter 2 briefly describes conditions in the countries
with results from previous reports? without GHI scores where hunger and undernutrition are cause for
No—GHI scores are comparable within each year’s report, but not significant concern. Several of these countries are experiencing unrest
between different years’ reports. The current and historical data or violent conflict, which affects the availability of data as well as the
on which the GHI scores are based are continually being revised food and nutrition situation in the country. It is quite possible that
and improved by the United Nations agencies that compile them, one or more of these countries would have a higher GHI score than
and each year’s GHI report reflects these changes. Comparing the Central African Republic—the country with the highest 2019
scores between reports may create the impression that hunger has GHI score—if sufficient data were available.
changed positively or negatively in a specific country from year to Likewise, GHI scores are not calculated for some high-income
year, whereas in some cases the change may be partly or fully a countries where the prevalence of hunger is very low. Even though
reflection of a data revision. hunger and undernutrition are serious concerns for segments of the
Moreover, the methodology for calculating GHI scores has been population in certain high-income countries (see p. 18), nationally
revised in the past and may be revised again in the future. In 2015, representative data for child stunting and child wasting are not reg-
for example, the GHI methodology was changed to include data ularly collected in most high-income countries. In addition, although
on child stunting and wasting and to standardize the values (see data on child mortality are usually available for these countries, child
Wiesmann et al. 2015). This change caused a major shift in the GHI mortality does not reflect undernutrition in high-income countries to
scores, and the GHI Severity Scale was changed to reflect this shift. the same extent it does in low- and middle-income countries.
Since 2015, almost all countries have had much higher GHI scores Finally, GHI scores are not calculated for certain countries with
compared with their scores from 2014 and earlier. This does not small populations (such as Belize) or for non-independent entities
necessarily mean that their hunger levels rose in 2015—the higher or territories (such as Western Sahara).
scores merely reflect the revision of the methodology.
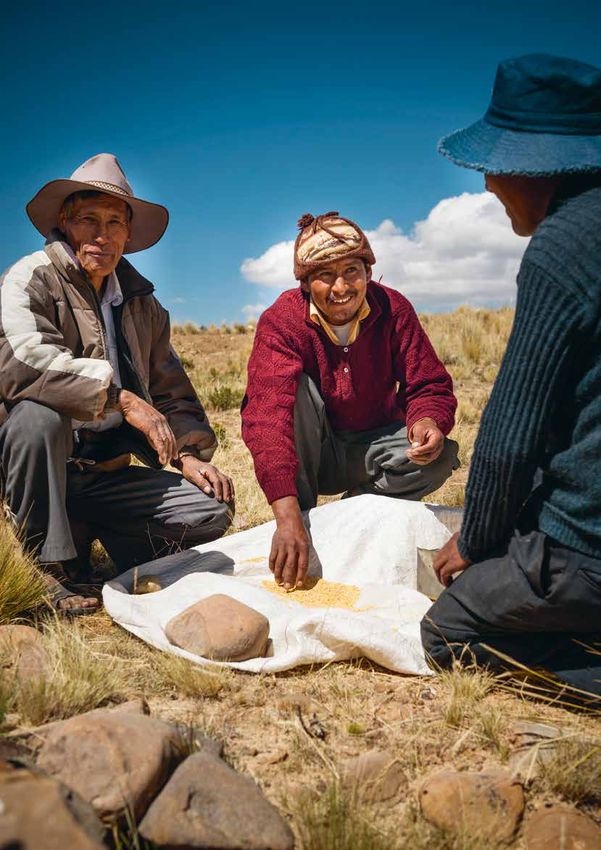
2019 Global Hunger Index | Chapter 01 | The Concept of the Global Hunger Index1102 Leandro Ortega Rivas and his son, Armando Ortega Gamaura, display a sample of their quinoa harvest in the Bolivian Altiplano. Here they receive advice from a yapuchiri, an expert farmer who integrates traditional knowledge, new insights, and groundbreaking technologies for disaster risk reduction and climate change adaptation.
GLOBAL, REGIONAL, AND
NATIONAL TRENDS
The World amount should be attainable considering the overwhelming benefits
expected from these investments (Shekar et al. 2017).
The 2019 Global Hunger Index (GHI) indicates that the level of hun- The reduction in GHI scores at the global scale brings into sharper
ger and undernutrition worldwide falls on the cusp of the moderate focus the many challenges that remain in the fight against hunger
and serious categories, at a value of 20.0 (Figure 2.1).1 This value and undernutrition. Extreme climatic events, violent conflicts, wars,
reflects a decline in the global GHI score in each period examined and economic slowdowns and crises continue to drive hunger in many
since 2000, when the global GHI score was 29.0 and fell into the parts of the world (FSIN 2019; FAO et al. 2019). Inequalities within
serious category. Underlying this improvement are reductions in each country borders allow hunger and undernutrition to persist even in
of the four GHI indicators—undernourishment, child stunting, child countries that appear to do well according to national averages. The
wasting, and child mortality—since 2000. prevalence of undernourishment—the percentage of the population
This achievement is no small feat. It coincides with a decline in without regular access to adequate calories—has stagnated since
poverty at the global level from 28.6 percent in 1999 to 9.9 percent 2015, and the number of people who are hungry has actually risen
in 2015 (World Bank 2019a).2 Poverty and hunger are closely cor- to 822 million from 785 million in 2015 (FAO et al. 2019).
related, with each influencing the other (Barrett and Lentz 2016; There is still much work to be done before hunger and undernu-
Headey 2013). Furthermore, the global development community and trition can be eradicated for good. This chapter provides an overview
individual countries have made concerted efforts in recent years to of the current situation at regional, national, and subnational levels.
address undernutrition, as evidenced by the increased funding for The essay in Chapter 3 complements this overview by describing the
nutrition initiatives worldwide. However, current action and spend- effects of climate change on food and nutrition security now and in
ing are still insufficient to reach the global nutrition targets to which 1
The worldwide estimates in this paragraph include the 117 countries in this report with
countries have declared their commitment. It is estimated that an 2019 GHI scores plus 15 countries for which some but not all of the GHI indicator data or
estimates were available.
additional US$70 billion beyond current budget expectations over 2
The poverty rates expressed here are poverty headcount ratios at $1.90 per day (2011 pur-
10 years is needed to achieve the global targets for child stunting, chasing power parity).
3
This estimate was based on the additional financing that would be needed between 2016
anemia in women, exclusive breastfeeding, and the scaling up of treat-
and 2025. The global nutrition targets discussed here and analyzed by Shekar et al. (2017)
ment for severe child wasting. While ambitious in some regards, this
3
are four of the six targets established by the World Health Assembly in 2012.
Figure 2.1 GLOBAL AND REGIONAL 2000, 2005, 2010, AND 2019 GLOBAL HUNGER INDEX SCORES, WITH CONTRIBUTION OF COMPONENTS
Under-five mortality rate
50
43.5
Prevalence of wasting in children
38.4
37.8
37.6
40 Prevalence of stunting in children
32.1
32.4
Proportion of undernourished
GHI score
29.3
29.0
28.4
26.9
30
23.0
20.3
20.0
17.8
16.3
20
15.0
14.7
13.9
13.6
13.3
13.2
11.5
11.1
9.9
9.4
8.1
8.2
10
6.6
0
'00 '05 '10 '19 '00 '05 '10 '19 '00 '05 '10 '19 '00 '05 '10 '19 '00 '05 '10 '19 '00 '05 '10 '19 '00 '05 '10 '19
World South Asia Africa South Near East & East & Latin America Eastern Europe &
of the Sahara North Africa Southeast Asia & Caribbean Commonwealth
of Independent
States
Source: Authors.
Note: See Appendix B for data sources. The regional and global GHI scores are calculated using regional and global aggregates for each indicator and the formula described in Appendix A. The
regional and global aggregates for each indicator are calculated as population-weighted averages, using the indicator values reported in Appendix C. For countries lacking undernourishment data,
provisional estimates provided by the Food and Agriculture Organization of the United Nations (FAO) were used in the calculation of aggregates only, but are not reported in Appendix C.
2019 Global Hunger Index | Chapter 02 | Global, Regional, and National Trends13the future. To address the current challenges while also preparing 2015–2016, 90 percent of Indian households used an improved drink-
to sustainably feed a world population expected to number about ing water source while 39 percent of households had no sanitation
10 billion by 2050, monumental changes to the global food system facilities (IIPS and ICF 2017). In 2014 the prime minister instituted
are needed (Willett et al. 2019). The reduction in GHI scores since the “Clean India” campaign to end open defecation and ensure that
2000 demonstrates that hunger and undernutrition are not immutable all households had latrines. Even with new latrine construction, how-
problems and serves as cause for cautious optimism. In many coun- ever, open defecation is still practiced. This situation jeopardizes the
tries, however, progress is too slow to be able to achieve the second population’s health and consequently children’s growth and develop-
Sustainable Development Goal—known in short as Zero Hunger—by ment as their ability to absorb nutrients is compromised (Ngure et al.
2030. At the current pace, approximately 45 countries will fail even 2014; Caruso et al. 2019).
to reach low hunger as defined by the GHI Severity Scale by 2030.4 Outside of India, two countries in South Asia have made signif-
It is now essential to double down on the task of reducing hunger icant advances in child nutrition, and their experiences are instruc-
and undernutrition in the many parts of the world that are faltering. tive. A 2015 study sought to identify the reasons behind the decline
in stunting in Bangladesh at the national level from 58.5 percent
in 1997 to 40.2 percent in 2011 (Headey et al. 2015). The study
The Regions
attributed the decrease primarily to rising household wealth asso-
At the regional level, South Asia and Africa South of the Sahara ciated with pro-poor economic growth and gains in parental educa-
have the highest 2019 GHI scores in the world, at 29.3 and 28.4, tion, as well as health, sanitation, and demographic factors reflecting
respectively (Figure 2.1). These scores indicate serious levels of hun- decreased fertility rates. The authors conclude that success in this
ger according to the GHI Severity Scale. In contrast, the 2019 GHI area can be achieved with robust economic growth and attention to
scores of Eastern Europe and the Commonwealth of Independent “nutrition-sensitive” sectors such as education, sanitation, and health.
States, Latin America and the Caribbean, East and Southeast Asia, Nepal’s remarkable reduction in child stunting from 56.6 percent in
and the Near East and North Africa range from 6.6 to 13.3, indicat- 2001 to 40.1 percent in 2011 is associated with, and likely attrib-
ing low or moderate hunger levels. utable to, increased household assets (a proxy for household wealth),
South Asia’s high GHI score is driven by its high rates of child increased maternal education, improved sanitation, and implemen-
undernutrition. The child stunting rate for the region is 37.6 percent, tation and use of health and nutrition programs, including antenatal
and the child wasting rate is 17.5 percent; both are the highest levels and neonatal care (Headey and Hoddinott 2015).
of any region in this report. In South Asia, the key factors that con- In Africa South of the Sahara, the region’s high GHI score is
tribute to stunting are poor infant and young child feeding practices, driven up by its undernourishment and child mortality rates, which
poor nutrition among women before and during pregnancy, and poor are the highest of any region, at 22.3 and 7.5 percent, respectively.
sanitation practices (Smith and Haddad 2015). A study of six South Meanwhile, its child stunting rate, 34.6 percent, is nearly as high as
Asian countries found that a lower maternal body mass index was that of South Asia. Perhaps most troubling is that while the prevalence
significantly associated with child wasting in five of the six countries. of undernourishment consistently declined between 1999–2001 and
Inadequate access to improved water sources and low family wealth 2013–15, it has since reversed course and begun to rise (FAO 2019b).
were also associated with child wasting in some countries, but not Africa South of the Sahara is the region of the world with the
systematically so. Because a reduction in poverty does not neces- highest percentage of the population employed in agriculture, at
sarily imply adequate access to improved water sources and sanita- 55 percent, yet agriculture in the region faces enormous challenges
tion, poverty alleviation policies may not be sufficient to reduce child (World Bank 2019a). Governments invest too little in agriculture:
wasting (Harding, Aguayo, and Webb 2018). most countries fail to meet the Comprehensive Africa Agriculture
Because of its large population, India’s GHI indicator values have Development Programme target of directing 10 percent of govern-
an outsized impact on the indicator values for the region. India’s ment spending to agriculture (Shimeles, Verdier-Chouchane, and Boly
child wasting rate is extremely high at 20.8 percent—the highest 2018). Farmers’ use of agricultural inputs is inadequate—fertilizer
wasting rate of any country in this report for which data or estimates
4
The 2030 projections are linear projections based on the existing 2000, 2005, 2010, and
were available. Its child stunting rate, 37.9 percent, is also catego-
2019 GHI scores for each country. These projections are not comparable to projections
rized as very high in terms of its public health significance (de Onis from previous reports owing to changes in data availability and revisions of the existing data.
5
A “minimum acceptable diet” is a standard that combines minimum dietary diversity and
et al. 2019). In India, just 9.6 percent of all children between 6
minimum meal frequency, with different recommendations for breastfed and non-breastfed
and 23 months of age are fed a minimum acceptable diet. As of 5 children, who need to receive milk or milk products as a substitute for breast milk.
14 Global, Regional, and National Trends | Chapter 02 | 2019 Global Hunger IndexTable 2.1 GLOBAL HUNGER INDEX SCORES BY 2019 GHI RANK
Rank1 Country 2000 2005 2010 2019 Rank1 Country 2000 2005 2010 2019
Belarususe, for example, is lower in Africa South of the Sahara than in any shows how countries compare with others within their regions and how
other region (World Bank 2019b). Use of irrigation is very low, and each country’s GHI score has changed over time. Appendix C shows
most farmers are dependent on rainfed agriculture, leaving them the values of the GHI indicators—the prevalence of undernourishment,
extremely vulnerable to drought and changing rain patterns. Access child wasting, child stunting, and child mortality—for each country,
to and use of tractors and mechanization are also extremely lim- including their historic values. An examination of the individual indi-
ited (Sheahan and Barrett 2018). Because of these and other fac- cators provides a useful glimpse into the nature of hunger and under-
tors, Africa South of the Sahara has the world’s lowest agricultural nutrition in each country and how it has changed over time.
productivity, as measured by cereal output per hectare (World Bank For nine countries with GHI scores in the moderate, serious, alarm-
2019b). Low productivity combined with high levels of poverty means ing, or extremely alarming categories, their 2019 GHI scores are
that households’ access to food is constrained in terms of both their higher than their scores for 2010, which is the most recent historical
own production and their ability to purchase food in the market. reference period in this year’s report. These nine countries are the
Compounding the ongoing challenges facing agriculture and food Central African Republic, Jordan, Lebanon, Madagascar, Malaysia,
production in Africa South of the Sahara, extreme climate events Mauritania, Oman, Venezuela, and Yemen.6 Venezuela’s GHI score
such as the 2015–2016 El Niño drought and ongoing violent con- has doubled since 2010, reflecting the severe food shortages and the
flicts in many countries have intensified food insecurity in the region. economic and political crises that have gripped the country in recent
While hunger, in the sense of insufficient access to calories, is a years. Hyperinflation, a rapidly contracting GDP, overdependence on
pressing concern in Africa South of the Sahara, it has the potential oil revenues coupled with falling oil production, and poor governance
to overshadow key nutritional concerns, including child undernutri- characterized by rampant corruption and growing autocracy have all
tion. Of 43 countries in the region with data or estimates on stunting contributed to the situation (Labrador 2019). Venezuela’s GHI score
for 2014–2018, 21 have stunting rates over 30 percent (considered could quite possibly be higher in future years when more up-to-date
very high in terms of public health significance) and an additional data on child nutrition become available.
19 countries have stunting rates between 20 and 30 percent (high). The Central African Republic has the highest 2019 GHI score
Two countries, Sudan and Djibouti, have wasting levels exceeding in this report—53.6—and is the only country that falls into the
15 percent (very high), 6 countries have wasting rates between 10 extremely alarming category of the countries with sufficient data for
and 15 percent (high), and an additional 21 countries have wast- calculating their GHI scores. Nearly half of all children in the Central
ing rates between 5 and 10 percent (medium) (de Onis et al. 2019). African Republic are stunted, and 60 percent of the population is
undernourished. Since 2012 the country has been embroiled in a
civil war, contributing to a crisis of hunger and undernutrition. As of
The Countries
June 2019, 605,000 refugees had left the country and an additional
According to the 2019 GHI, of the countries for which data are avail- 655,000 people were internally displaced out of a population of just
able, four suffer from levels of hunger that are alarming, and one 4.7 million (UNHCR 2019d; UN DESA 2019). More than half of the
country, the Central African Republic, suffers from a level that is population is in need of humanitarian assistance in 2019, although
extremely alarming. The four countries with alarming levels of hunger security concerns often prevent aid agencies from reaching those in
are Chad, Madagascar, Yemen, and Zambia. Forty-three countries need (USAID 2019a). A peace agreement was signed between the
out of 117 countries that were ranked have serious levels of hunger. government and warring factions in February 2019, but violations
It is critical to understand that GHI scores for several countries of the terms threaten to undermine the agreement (Schlein 2019).
could not be calculated because data were not available for all four The situation in the Central African Republic clearly demonstrates
GHI indicators. However, the hunger and undernutrition situations the role that conflict plays in worsening hunger and undernutrition.
in nine of these countries—Burundi, Comoros, Democratic Republic At 45.9, Yemen’s GHI score is the second highest in this year’s
of Congo, Eritrea, Libya, Papua New Guinea, Somalia, South Sudan, report and falls into the alarming category. Its child stunting and wast-
and Syria—are identified as cause for significant concern (Box 2.1). ing rates are estimated to be 61.1 and 17.9 percent, respectively. The
In some cases, the hunger levels might be higher than in the coun- country has been affected by civil war since 2014, although there are
tries for which GHI scores were calculated. in fact multiple conflicts at play whose roots go as far back as the
To understand how the countries included in the GHI compare with 1990s (Ahram 2019). In November 2018 UNICEF’s regional director
each other, Table 2.1 shows the numerical ranking, from lowest to high- 6
Countries are not included in this trend analysis if their hunger level is still considered low
est hunger levels, for each country with a 2019 GHI score. Appendix E even if it has increased since 2010.
16 Global, Regional, and National Trends | Chapter 02 | 2019 Global Hunger IndexFigure 2.2 2019 GHI SCORES AND PROGRESS SINCE 2000
55
extremely
Central African
alarming
Republic
50
Higher
hunger
Yemen
45
Chad
alarming
Madagascar
40
Zambia
2019 Global Hunger Index Score
35 Liberia Haiti Zimbabwe
Afghanistan
GHI Severity Scale
Djibouti Uganda Congo, Rep.
Sierra Leone India
30 Niger
Angola Guinea-Bissau
Rwanda
Ethiopia Tanzania Pakistan
serious
Mozambique Nigeria
Guinea North Korea
Bangladesh Mauritania
Lao PDR Burkina Faso Côte d’Ivoire
25 Kenya
Namibia
Mali Togo Benin Botswana
Malawi Lesotho
Cameroon
Cambodia
Gambia
Nepal Eswatini
Philippines
20 Myanmar
Guatemala Indonesia
Iraq
Senegal
Sri Lanka Venezuela
moderate
Gabon
Bolivia Viet Nam
15 Egypt
Ghana South
Lower Honduras Africa
hunger Nicaragua Malaysia
Guyana
Turkmenistan Oman
Lebanon
Uzbekistan Ecuador
Suriname Jordan
10 Algeria
low
5
-40 -35 -30 -25 -20 -15 -10 -5 0 5 10
Higher reduction Lower reduction Increase in
in hunger in hunger hunger
Absolute change in GHI score since 2000
Source: Authors.
Note: This figure illustrates the change in GHI scores since 2000 in absolute values. This figure features countries where data are available to calculate 2000 and 2019 GHI scores and where
2019 GHI scores show moderate, serious, alarming, or extremely alarming hunger levels. Some likely poor performers may not appear due to missing data.
2019 Global Hunger Index | Chapter 02 | Global, Regional, and National Trends17for the Middle East and North Africa, Geert Cappelaere, warned The situation is more positive in many countries in terms of both
that the war and ongoing economic crisis have had dire impacts on their GHI scores and their progress in reducing hunger and under-
the children of Yemen, including extreme hardship, elevated rates nutrition over time. This year’s GHI includes 23 countries with mod-
of malnutrition and disease, and increased mortality (Cappelaere erate levels of hunger and 46 countries with low levels of hunger. Of
2018). The warring factions signed the Stockholm Agreement in the countries with moderate levels of hunger, two—Myanmar and
December 2018 to ease the conflict and humanitarian crisis, but as Senegal—had alarming hunger levels as recently as 2000. Of the
of June 2019 the agreement had still not been fully implemented countries with low levels of hunger, five had serious hunger levels as
and some civilians and communities in need were still blocked from recently as 2000: Albania, Azerbaijan, Mongolia, Panama, and Peru.
receiving humanitarian aid (UN 2019b). It is estimated that 17 million Figure 2.2 shows the progress countries have made since 2000,
people out of a population of 28 million (World Bank 2019a) will along with their 2019 GHI scores. Perhaps most informative is the
face crisis-level food insecurity or worse through early 2020, with dramatic improvement in GHI scores for the countries on the left-
some areas in the west of the country facing emergency-level food hand side of the figure, particularly Angola, Rwanda, and Ethiopia.
crises.7 If the security situation deteriorates, the country is at risk of These countries each had GHI scores in the extremely alarming cate-
famine (FEWS NET 2019a). gory in 2000, largely as a result of civil wars. As is evident through-
Chad has the third-worst GHI score according to this year’s rank- out this report, violent conflict and war are strong drivers of hunger
ing; at 44.2, it is considered alarming. Chad’s child mortality rate and undernutrition, yet it is important to realize that even the worst
is 12.3 percent, the second-highest rate in this report. Chad ranks situations can improve with the return of peace and stability.
186th out of 189 countries in the Human Development Index, with As noted in Chapter 1, GHI scores are not calculated for some
only South Sudan, the Central African Republic, and Niger ranking high-income countries where the prevalence of hunger tends to be
worse (UNDP 2018). In recent years Chad has also experienced an very low. This gap occurs mainly for two reasons: (1) not all GHI indi-
influx of refugees, primarily from South Sudan, the Central African cators are appropriate for assessing hunger in these countries and
Republic, and Nigeria. By the end of 2018 the number of refugees (2) some data are unavailable because they are not regularly collected
exceeded 450,000, with more arriving in 2019, putting a strain on there. Nonetheless, the high-income countries that are not included
resources in the host communities (UNHCR 2019f; UN 2019a). In in the GHI are not immune to food insecurity.
the Lake Chad basin, incursions of armed groups into Chad from High-income countries show variable, non-negligible rates of food
neighboring Nigeria have increased insecurity and disrupted liveli- insecurity as measured by locally adapted household food security
hoods, access to markets, and trade (UN OCHA 2019a). scales that yield comparable results: 5 percent of households were
In addition to considering countries’ GHI scores and rankings, it food insecure in South Korea in 2008, 7 percent in Canada in 2011–
is useful to compare countries’ individual GHI component indicators: 2012, 12 percent in the United States in 2017, and 17 percent in
Portugal in 2005–2006 (Kim et al. 2011; Tarasuk, Mitchell, and
>> Haiti, Zimbabwe, and the Central African Republic have the Dachner 2014; Coleman-Jensen et al. 2018; Álvares and Amaral
highest rates of undernourishment, ranging between 49.3 and 2014). In the United States, 16 percent of households with children
59.6 percent. under age 18 were food insecure in 2017 at some point during the
year (Coleman-Jensen et al. 2018), and a UNICEF study regarding
>> Stunting rates are highest in Madagascar, Burundi, and Yemen, food insecurity in the 28 countries of the European Union found that
where data or estimates show that more than half of all children 18 percent of households with children under age 15 experience
under five suffer from stunting. moderate or severe food insecurity based on the Food Insecurity
Experience Scale (Pereira, Handa, and Holmqvist 2017). The expe-
>> Wasting is most prevalent in Yemen, Djibouti, and India, ranging rience-based concept of the household food security scale and mea-
from 17.9 to 20.8 percent. sures such as the Food Insecurity Experience Scale should not be
confused with the measurement approach of the undernourishment
>> The highest under-five mortality rates are in the Central African indicator, which reflects shortfalls in calorie intake; the prevalence
Republic (12.2 percent), Chad (12.3 percent), and Somalia
(12.7 percent).
7
This is according to the Acute Food Insecurity Phases of the Integrated Food Security Phase
Classification: Phase 1 (minimal), Phase 2 (stressed), Phase 3 (crisis), Phase 4 (emergency),
and Phase 5 (famine) (IPC 2017).
18 Global, Regional, and National Trends | Chapter 02 | 2019 Global Hunger IndexFigure 2.3 SUBNATIONAL INEQUALITY OF CHILD STUNTING
Paraguay (9)
Serbia (4)
Mongolia (5) Stunting rate, lowest region
Kazakhstan (16)
Stunting rate, national average
Tunisia (7)
Armenia (11) Stunting rate, highest region
Turkey (12)
Iraq (18)
Thailand (5)
Albania (12)
Turkmenistan (6)
Kyrgyz Republic (9)
Guyana (9)
El Salvador (5)
Bolivia (9)
Senegal (14)
Sri Lanka (25)
Tajikistan (5)
Ghana (10)
North Korea (10)
Malaysia (15)
Congo, Rep. (12)
Egypt (4)
Côte d'Ivoire (11)
Haiti (11)
Eswatini (4)
Kenya (8)
Sierra Leone (14)
Zimbabwe (10)
Mali (9)
South Africa (9)
Togo (6)
Guinea-Bissau (9)
Mauritania (13)
Uganda (15)
Myanmar (15)
Guinea (8)
Cameroon (12)
Benin (12)
Cambodia (19)
Lao PDR (18)
Lesotho (10)
Philippines (17)
Tanzania (30)
Nepal (7)
Bangladesh (7)
Nigeria (37)
Malawi (28)
Angola (18)
Pakistan (6)
Rwanda (30)
Sudan (18)
Ethiopia (11)
India (34)
Chad (21)
Zambia (10)
Niger (8)
Congo, Dem. Rep. (11)
Guatemala (22)
Burundi (18)
0 10 20 30 40 50 60 70 80
Stunting rate for children under five (%)
Source: Authors. Based on surveys included in UNICEF/WHO/World Bank (2019), WHO (2019a), UNICEF (2019), and MEASURE DHS (2019) from 2014–2018. Countries included are those
with subnational stunting data available for 2014–2018. If more than one survey has been completed for a country during this period, that with the most recent subnational values is used.
Note: The number in parentheses following each country name indicates the number of subnational units into which the country was divided for the sake of the survey, which can influence the
degree of disparity that is revealed. All stunting values in this figure are taken directly from original survey reports. The national averages may vary slightly from those used for GHI calculations,
which in some cases underwent additional analysis before inclusion in UNICEF/WHO/World Bank (2019) and WHO (2019a).
2019 Global Hunger Index | Chapter 02 | Global, Regional, and National Trends19Box 2.1 COUNTRIES WITH INSUFFICIENT DATA, YET SIGNIFICANT CONCERNS
In the case of 15 countries assessed for this report, data were COMOROS: Densely populated and heavily reliant on agriculture,
unavailable for one or more indicators used in the GHI formula, the Comoros suffers from poor environmental management
preventing the calculation of their 2019 GHI scores. In some and has limited resources to support its growing population.
cases, data are unavailable as a result of violent conflict or polit- A low-lying island nation in the Indian Ocean, the Comoros
ical unrest. These contexts are causal factors and strong predic- is vulnerable to the effects of climate change and has been
tors of hunger and undernutrition, so the countries with missing repeatedly hit by natural disasters (Burak and Meddeb 2012).
data may be the ones with citizens in the greatest distress due A Category 4 hurricane struck the Comoros in April 2019, dam-
to hunger. Based on the available data that we have assessed aging hospitals, water supplies, agriculture, and livestock, and
and information from international organizations that specialize this damage has in turn worsened food insecurity and child
in combating hunger and undernutrition, we have determined undernutrition (WHO 2019b). An estimated 39.9 percent of
that nine of the countries with missing data are cause for sig- children are stunted, 9.2 percent are wasted, and 6.9 percent
nificant concern. The following is a brief explanation of what is die before the age of five.
known about the hunger and nutrition situation in each of the
nine countries; the table below shows the existing GHI indica- DEMOCRATIC REPUBLIC OF CONGO (DRC): In the DRC 42.7 percent
tor values for these countries. of children under age five are stunted, 8.1 percent are wasted,
and 9.1 percent do not live to the age of five. The DRC has
BURUNDI: At 55.9 percent, Burundi’s child stunting level is been beset by ongoing conflict and far-reaching poverty in
the second highest of all countries covered in this report, recent decades. These factors, along with the deterioration of
5.1 percent of children in Burundi experience wasting, infrastructure and productive assets, high food prices, and a
and 6.1 percent die before the age of five. Approximately decline in agricultural production, have worsened food secu-
1.7 million Burundians out of a population of 11 million were rity (WFP 2015; FAO 2019a). As of December 2018, about
estimated to face crisis or emergency levels of food inse- 3.1 million people were internally displaced (IDMC 2019a) and
curity in 2018 (FSIN 2019). Burundi is ranked 185th out more than 800,000 refugees from the DRC had fled to neigh-
of 189 countries on the 2018 Human Development Index boring countries. More than 500,000 refugees, mainly from
(UNDP 2018), and its rate of poverty is extremely high at Burundi, Central African Republic, and South Sudan, had come
over 70 percent (World Bank 2019a). More than 340,000 to the DRC as of February 2019 (UNHCR 2019c). According
refugees have fled Burundi in recent years, most since 2015 to the latest data, 13 million people in the DRC—approxi-
(UNHCR 2019b). Climate shocks, political instability, and mately a quarter of the population—face crisis or emergency
structural economic issues all contribute to food insecu- levels of food insecurity (USAID 2019b). In North Kivu prov-
rity, while poor child feeding practices, food insecurity, a ince, food insecurity is compounded by the current Ebola out-
high burden of disease, and inadequate water, sanitation, break, resulting in a spiraling confluence of hunger and disease
and health facilities all contribute to poor child nutrition for the affected families (Norwegian Refugee Council 2019).
(FSIN 2019).
EXISTING GHI INDICATOR VALUES
Undernourishment Child stunting Child wasting
Child mortality
Prevalence of Prevalence of stunting in Prevalence of wasting in
Country Under-five mortality
undernourishment children under five children under five
2017 (%)
2016–2018 (%) 2014–2018 (%) 2014–2018 (%)
Burundi — 55.9 5.1 6.1
Comoros — 39.9* 9.2* 6.9
Congo, Dem. Rep. — 42.7 8.1 9.1
Eritrea — — — 4.3
Libya — 22.4* 8.0* 1.2
Papua New Guinea — 39.9* 7.1* 5.3
Somalia — — — 12.7
South Sudan — — — 9.6
Syrian Arab Republic — — — 1.7
Source: Authors. See Appendix B for a list of data sources.
Note: — = not available. *indicates authors’ estimates.
20 Global, Regional, and National Trends | Chapter 02 | 2019 Global Hunger IndexYou can also read