Global mercury supply, trade and demand - UN Environment Document Repository Home
←
→
Page content transcription
If your browser does not render page correctly, please read the page content below
Global mercury
supply, trade and demand

            -I-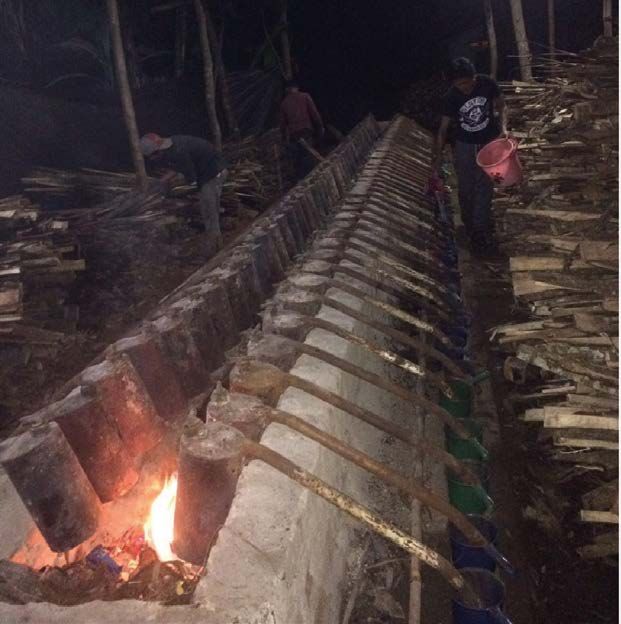
Copyright © United Nations Environment Programme, 2017.

ISBN No: 978-92-807-3665-6
Job No: DTIE/2125/PA

Citation: UN Environment, 2017. Global mercury supply, trade and demand. United Nations Environment Pro-
gramme, Chemicals and Health Branch. Geneva, Switzerland.

This global overview updates and builds on a previous publication of the United Nations Environment Pro-
gramme entitled, Summary of Supply, Trade and Demand Information on Mercury (November 2006).

Disclaimer
The designations employed and the presentation of the material in this publication do not imply the expres-
sion of any opinion whatsoever on the part of the United Nations Environment Programme concerning the
legal status of any country, territory, city or area or of its authorities, or concerning delimitation of its frontiers
or boundaries. Moreover, the views expressed do not necessarily represent the decision or the stated policy of
the United Nations Environment Programme, nor does citing of trade names or commercial processes consti-
tute endorsement. While the information provided is believed to be accurate, UN Environment disclaims any
responsibility for possible inaccuracies or omissions and consequences that may flow from them. Neither UN
Environment nor any individual involved in the preparation of this publication shall be liable for any injury, loss,
damage or prejudice of any kind that may be caused by persons who have acted based on their understanding
of the information contained in this publication.

Reproduction
This publication may be reproduced in whole or in part and in any form for educational or non-profit purposes
without special permission from the copyright holder, provided acknowledgement of the source is made.
Material in this report may be freely quoted or reprinted. UN Environment would appreciate receiving a copy
of any publication that uses this report as a source at the email or postal address below. No use of this pub-
lication for resale or for any other commercial purpose whatsoever may be made without prior permission in
writing from the United Nations Environment Programme.

Produced by
UN Environment – Economy Division
Chemicals and Health Branch
International Environment House
11-13, Chemin des Anémones
CH -1219 Châtelaine
Geneva, Switzerland

Tel: +41 (0) 22 917 12 34
Fax: +41 (0) 22 797 34 60
Email: metals.chemicals@unep.org
Website: www.unep.org/chemicalsandwaste

This publication may be accessed at the following website:
www.unep.org/chemicalsandwaste/resources/publications

Acknowledgments
The lead author of this report was Peter Maxson. Zoï Environment Network was responsible for the overall
delivery of the report including layout, editing, and all original graphics. The Zoï team - in alphabetical order
- were Matthias Beilstein, Emmanuelle Bournay, Carolyne Daniel, Geoff Hughes, Otto Simonett and Christi-
na Stuhlberger. Kenneth Davis managed the project for UN Environment, assisted by Sheila Logan and Jac-
queline Alvarez. This report greatly benefited from review and comments from a range of experts, including
from the Global Mercury Partnership, who have worked over many years to advance the research and under-
standing of mercury-related issues. In addition, many national government representatives provided informa-
tion and feedback on mercury supply, trade and demand in their countries. This report was made possible
through funding from the United States Environmental Protection Agency and the Government of Germany.

                                                                             - II -
Global mercury
supply, trade and demand

           - III -
Table of Contents
Tables - Vll -
Figures - Vll -
Executive Summary - Vlll -
1.
Introduction - 01-
4.
Global, regional and sectoral - 44 -
1.1. Scope - 02 - consumption of mercury
1.2. Methodology - 03 - 4.1. Background - 45 -
4.2. Artisanal and small-scale gold mining - 49 -
4.3. Vinyl chloride monomer production - 51 -
2.
4.4. Chlor-alkali production - 51 -
4.5. Batteries - 52 -
4.6. Dental amalgam - 54 -
4.7. Measuring and control devices - 56 -
Sources and supply of mercury - 04-
4.8. Lamps - 57 -
2.1. Primary mercury mining - 05 -
4.9. Electrical and electronic devices - 58 -
2.2. By-product mercury - 10 -
4.10. Mercury compounds and other applications - 59 -
2.3. Chlor-alkali industry - 14 -
4.11. Summary of global mercury consumption - 61 -
2.4. Recycled mercury - 16 -
2.5. Mercury stocks - 18 -
2.6. Summary - 20 -
5.
3.
Global and regional mercury trade - 22-
Conclusions - 64 -
Acronyms & abbreviations - 67 -
3.1. Mercury in commodity trade databases - 23 -
3.2. Country and regional trade flows - 27 - References - 68 -
3.3. Trade related problems - 40 -
Appendix - 72 -
3.4. General observations - 42 -
-V-Tables
06 - Table 1. Mercury exports to all countries, 2010-2015, as reported by Mexico
08 - Table 2. Mercury exports to all countries, 2010-2015, as reported by Indonesia
10 - Table 3. Global primary mercury mining, 2015
13 - Table 4. Global by-product mercury production, 2015
15 - Table 5. Mercury recovered from chlor-alkali for commercial use, 2015
17 - Table 6. Recycled mercury introduced into commerce, 2015
21 - Table 7. Global mercury supply, 2015
21 - Table 8. Countries producing more than average 25 tonnes/year, 2013-2015
38 - Table 9. Major importers and exporters of mercury compounds, 2013-2015
42 - Table 10. Global mercury imports and exports
42 - Table 11. Countries reporting exports of more than 25 tonnes of mercury in 2015
46 - Table 12. Global mercury consumption by sector
47 - Table 13. Global mercury consumption by geographic region
53 - Table 14. Default mercury content, by battery type
56 - Table 15. Common mercury-added measuring and control devices
57 - Table 16. Major mercury-added lamp categories
62 - Table 17. Mean mercury consumed by region and by major application, 2015
72 - Table 18. Key sources for country-specific information on mercury-added products
75 - Table 19. Geographic regions as defined for this study
76 - Table 20. Regional population and economic activity, 2015
77 - Table 21. Mercury use in artisanal and small-scale gold mining
79 - Table 22. Mercury consumed in the chlor-alkali industry, 2015
81 - Table 23. Mercury consumed worldwide by region and by major application, 2015
Figures
25 - Figure 1. Discrepancies in reported mercury IMPORT data, 2013-2015
26 - Figure 2. Discrepancies in reported mercury EXPORT data, 2013-2015
28 - Figure 3. Key mercury importers and exporters, as reported to Comtrade
30 - Figure 4. Global mercury trade as reported by the importing countries, 2015
32 - Figure 5. Global mercury trade, 2008
35 - Figure 6. European mercury trade as reported by the importing countries, 2015
37 - Figure 7. European mercury trade, 2008
63 - Figure 8. Global mercury demand by sector, including uncertainties
66 - Figure 9. Mass balance for intentional use of mercury, 2015
- VII -Executive Summary
A response by the world’s nations to the abundant evidence of the neg-
ative effects of mercury pollution on human health and the environ-
ment, the Minamata Convention on Mercury entered into force on 16
August 2017. The Convention includes provisions to control the supply,
trade and use of mercury. This report provides an overview of the cur-
rent state of these activities in order to assist governments and other
stakeholders as the Convention moves into the implementation phase.
The most important findings and observations are summarized here.
Mercury supply
Chlor-alkali residual mercury
One of the major changes in mercury supply since 2011 appears to be past, but the free market price of mercury
is the reduced volume of chlor-alkali residual mercury remains high in historical terms. Also as a result of the
available on the open market, due in large part to restric- export bans, a two-tiered pricing system has emerged
tions imposed by export bans. In the European Union in the United States and European Union. With export
alone, an estimated 650 tonnes per year of chlor-alkali bans in place, the domestic price of mercury in these
related mercury are no longer available. Despite such two regions, where supply is plentiful and demand lim-
advances, many countries do not yet have plans to ited, has become significantly lower than the free mar-
move away from the mercury process in this industry. ket price. This low domestic price of mercury may act
to discourage the collection and recycling of mercury-
Mercury mining added products and “scrap”.
A second fundamental change in mercury supply is the
emergence of new mercury mining in Mexico and Indo- The two-tiered pricing system also creates an incentive
nesia, with production estimated at 800-1 100 tonnes in for less scrupulous operators to attempt to profit from the
2015. In neither of these cases is the extent or the rate price difference. Some have already tried to circumvent
of growth of production very clear. The Minamata Con- export restrictions in an attempt to sell mercury for a high-
vention requires Parties to phase out existing mercury er price on the open market. Authorities aware of this pos-
mining. Once such operations are established, however, sibility are in a better position to counter such activities.
and mining communities become accustomed to the
economic benefits, it may be difficult to phase out these Recent trends
mining activities and disrupt the social structure that While the quantity of mercury available on the open mar-
has developed around them. ket from the chlor-alkali industry has declined in recent
years, primary mercury mining has increased overall in
Mercury price response to strong demand, such that the global mer-
The greatly reduced global supply of mercury during cury supply in 2015 was in the range of 3 850 to 4 400
2011 and 2012 encouraged a spike in the market price tonnes per year. Better information to be provided under
between 2011 and 2013, and this likely encouraged the Minamata Convention will permit more precise
some of the new mining activities. That price spike estimates.
- VIII -Mercury trade
Mercury trading hubs Quality of trade data
Largely due to restrictions on mercury exports from the This research has confirmed that, although databases such
European Union and the United States, since 2010 there as Comtrade and Eurostat are populated by data furnished
has been a major shift in the locations of the key mercury by national statistical agencies, they are imperfect resourc-
trading hubs. The main United States and Spanish mer- es for understanding demand for and trade of mercury,
cury traders operating in 2010 are no longer in the inter- and even more so, mercury-added products. For example,
national trading business, and the main European trader these databases do not show informal or illegal transfers.
operating mostly out of Rotterdam in 2010 has moved Moreover, in light of the enormous number of shipments
all mercury stocks outside the European Union. The for- and related documentation that customs agencies deal
mer European Union and United States trading hubs have with, the authorities are able to carry out no more than spot
given way to Singapore and Hong Kong, and to a less- checks to confirm that shipping manifests are consistent
er extent Turkey and Viet Nam, which have become the with the commodities carried; the trade data typically do
major storage and transit points for global mercury trade. not differentiate between mercury-added and mercury-free
Periodic reporting on stocks held in such locations would products; there is occasional difficulty in identifying the
help to clarify the links between the sources and final des- actual origins and final destinations of shipments; and there
tinations of international mercury trade. are sometimes mistakes (some of them intentional) in the
tariff codes listed with shipments of certain commodities.
Undocumented and illegal transfers These sorts of errors could be reduced by closer scrutiny
As mercury trade has been subjected to additional of mercury shipments, and by the creation of additional
scrutiny, and the market price remains relatively high, tariff codes for mercury-added products. Even with such
undocumented or illegal transfers have increased. In improvements, however, there would still be limits to the lev-
one example, a German company illegally exported el of detail available from trade data, especially as some of
large quantities of mercury (improperly characterized as the shipping information is considered to be commercially
waste) from Germany to Switzerland. Customs agents sensitive and therefore not accessible to the public.
in Indonesia and the Philippines have intercepted Indo-
nesian mercury and cinnabar ore smuggled in shipping Recent trends
containers. Mercury from China has appeared informal- It is notable that global imports and exports of mercury
ly in sub-Saharan Africa and Myanmar. Undocumented have decreased significantly during the last five years.
Mexican mercury moves across the country’s southern According to the Comtrade database, in 2010 glob-
border. Large quantities of mercury imported by Colom- al imports were about 2 600 tonnes, and exports were
bia and Bolivia are transferred informally to neighbour- about 3 200 tonnes. By 2015 global imports were less
ing countries such as Peru, primarily for use in artisanal than 1 200 tonnes, and exports were just more than 1 300
and small-scale gold mining. tonnes. This decreased level of trade suggests that there
are fewer steps in the mercury supply chain, and probably
Potentially dangerous practices implies that the end uses are increasingly focused on spe-
Along with the increase in informal mercury trade, there cific sectors such as artisanal and small-scale gold min-
are also accounts of substandard mercury shipping ing and the production of vinyl chloride monomer. Even
flasks being used in Asia. In some cases non-certified while the total volume of mercury trade has decreased,
steel flasks have been found with plastic bags inserted as the fact that the overall supply of mercury has increased
internal liners in order to prevent mercury leakage. Forged during the same period is a reminder of the significant
hazardous transport safety labels have been fixed to sub- challenges faced in the implementation of the Minamata
standard mercury flasks. Convention.
- IX -Mercury demand
Principal industrial processes using mercury
Since 2005 the major mercury uses continue to be in ar- The accompanying figure summarizes the evolution of
tisanal and small-scale gold mining (primarily in Africa, mercury demand in different sectors over the last 10
Asia and Latin America) and for the production of vinyl years, although the marked increase in the category of
chloride monomer (mostly in China). These two applica- “other” uses should be seen more as a reflection of the
tions are responsible for over 60 per cent of global mer- recent availability of better information about these uses,
cury demand. The extent of artisanal and small-scale than as an indication of a significant increase in demand.
gold mining has steadily increased (along with the spot The shaded areas bordering each trend line in the figure
price of gold) since about 2000, and shows no sign of show the extent of the uncertainties in the data.
falling off as long as the price of gold remains historically
high. Multiple programs are in place to help miners shift
to mercury-free mining processes, but the challenges
are vast. Mercury use in the production of vinyl chloride Evolving mercury demand by sector, including
monomer is also at an all-time high, although measures uncertainties
are in place to reduce and ultimately phase out the mer-
cury-based process.
In contrast, the use of mercury in chlor-alkali production
has shown a significant global decline over the past ten
years as mercury-cell facilities age, and a number of na-
tions are encouraging their closure and/or replacement
with mercury-free processes. Provisions in the Minamata
Convention further encourage the mercury-free transition
in all of these processes – artisanal and small-scale gold
mining, vinyl chloride monomer and chlor-alkali production.
Mercury-added products and other uses
For mercury-added products, China remains a major
manufacturer of such key products as measuring instru-
ments, batteries and lamps. Mercury demand for all of
these products has declined modestly in recent years,
although some are subject to competing influences. For
example, incentives for reduced energy demand have
encouraged the substitution of incandescent lamps
(that do not contain mercury) by compact fluorescent
lamps (that do contain mercury) in many countries. At
the same time, wealthier economies are already wit-
nessing the replacement of compact fluorescent lamps
by such energy-efficient and mercury-free alternatives
as light-emitting diodes.
The use of dental amalgams, which contain about 50 per
cent mercury, is also widespread, although global mercu-
ry demand has declined somewhat as mercury-free com-
posites and other alternatives become more available
and more reasonably priced. Many countries are seeing
a growing preference for alternatives to amalgam and
some, like Sweden and Norway, have already effectively
phased out the use of mercury in dental care. In this sec-
tor as well, however, improvements in dental health care
in less prosperous countries, where cost-effective mer-
cury-free alternatives to amalgam may be less available,
have led to increases in the use of amalgam (and there-
fore mercury) in those countries.
-X-Recent trends
Largely due to the increases in demand for mercury in arti- must - even if they remain accumulated in the economy
sanal and small-scale gold mining and the production of for some years - eventually become outputs from the
vinyl chloride monomer, the global demand for mercury economy. This model simplifies the outputs as:
in products and processes has increased during the past
ten years. For 2015, global demand for mercury was in the 1. Mercury in products or wastes that go to recycling
range of 4 500 to 4 900 tonnes, of which over 50 per cent
was attributed to East Asia and Southeast Asia. These 2. Releases to the environment
trends in certain sectors informed the negotiations leading
up to the Minamata Convention, which includes provisions 3. Transfers to long-term storage or disposal (e.g.,
addressing all of the main categories of mercury demand. hazardous waste landfill or salt mine)
Linking global
Of all the intentional uses of mercury in a given year,
only about one-third of the mercury supply comes from
recovery and recycling, while approximately twice that
mercury supply
quantity still ends up as releases to the environment, if
one includes releases from mercury-added products and
applications that were previously accumulated in society
and demand (e.g., mercury fever thermometers, blood pressure cuffs,
batteries, etc., going into the municipal waste stream).
Mercury demand presently exceeds the basic supply by a
The analysis summarized in this report permits the vis- significant amount, and it is likely that much of the differ-
ualization of global mercury pathways, from sources of ence in 2015 was made up through a drawdown of mer-
supply to uses and sinks. The overview presented in the cury stocks or inventories. Unless mercury demand can
next figure is predicated on the assumption that all of the be reduced rather rapidly, this imbalance will further stim-
sources or intentional inputs of mercury to the economy ulate formal and informal mercury supplies and trade,
and will add to the difficulty of changing course.
Global mercury supply and demand, 2015
- XI -1. Introduction The Minamata Convention on Mercury1 entered into force on 16 Au- gust 2017. In support of the ongoing discussions concerning the implementation of the provisions of the Convention, this report pro- vides an overview of the global mercury market, which has seen fun- damental changes in recent years, including major disruptions that have occurred during periods sometimes as brief as a year or two. 1 For details, see
In 2006 UN Environment published the Summary of Sup-          This report includes:
ply, Trade and Demand Information on Mercury. The report
helped countries better understand the sources, trade             1. Identification of the main mercury producers and
flows and end uses of mercury. Now 10 years later, there             exporters
are many differences in the ways that mercury moves
through global commerce. The recently adopted Minama-             2. Appreciation of the rate at which mercury cell
ta Convention on Mercury includes various provisions to              chlor-alkali facilities are decommissioning
control the supply, trade and use of mercury, providing an
ideal opportunity to take a fresh look into the global mar-       3. Discussion of the importance of the Minamata
ket.                                                                 Convention, especially in generating better infor-
                                                                     mation, in setting priorities, in educating stakehold-
The purposes of this report are:                                     ers, in catalyzing concrete actions, and in training
                                                                     technical staff
   •   To provide an updated perspective on global mer-
       cury supply, trade and demand                              4. Information about some of the main impacts of the
                                                                     export restrictions imposed by the European Union
   •   To identify key changes over the last ten years               Regulation on Mercury,2 and its predecessor, and the
                                                                     United States Mercury Export Ban Act3
   •   To support the Minamata Convention, especially
       regarding the availability and quality of data             5. Descriptions of the substantial flows of mercury
                                                                     from primary mercury mining destined for arti-
   •   To determine the extent to which supply/trade/de-             sanal and small-scale gold mining activities, which
       mand “snapshots” may be more readily developed                will receive particular attention during the early im-
       than in previous iterations or reports                        plementation of the Minamata Convention

The main audiences for the report include governmen-              6. Insights into illegal and undocumented mercury
tal decision-makers, intergovernmental organizations,                trade
non-governmental organizations and others seeking to
better understand current mercury movements so as to              7. Updated information on mercury-added products
integrate these findings into policy decisions. To support           and other uses of mercury that may not be specifi-
this goal, analysts need to:                                         cally cited in the Minamata Convention

   •   Identify gaps in understanding and information         Among other resources, this report benefits from the
       concerning mercury supply and trade                    UN Environment Mercury Inventory Toolkit, a valuable
                                                              resource for educating users and focusing attention on
   •   Identify methods for collecting additional (and/or     priority mercury uses and releases. At the same time, this
       better) trade data                                     research has confirmed that even the best available infor-
                                                              mation still provides an imperfect picture of global mercu-
   •   Understand the scope and reliability of the data re-   ry sources, flows and uses.
       ported to Comtrade and other data sources
                                                              2   Formally known as Regulation (EU) 2017/852 of the European
   •   Identify measures that may help countries imple-           Parliament and of the Council of 17 May 2017 on mercury, and
       ment the Convention                                        repealing Regulation (EC) No 1102/2008. See European Union
                                                                  (2017).

Global mercury trade flows, marked by sometimes large         3   Certain exemptions to the US and EU export “bans” permit limited
annual variations and often conflicting data, only make           mercury exports under specific circumstances. These regulations
                                                                  may therefore be technically regarded as export “restrictions” rather
sense when put in the context of the relevant mercury
                                                                  than “bans”. In order to respect the intentions and titles of these le-
supply sources and ultimate demand, that is, intentional          gal measures, however, as well as for purposes of clarity, this report
use in products and processes.                                    will continue to refer to them as export “bans”.

                                                          -1-
1.1. Scope
This report does not cover health and environmental im-
pacts of mercury releases and exposures. Health effects
are treated in publications of the World Health Organiza-
tion (e.g., WHO 2010). Nor does this report deal with mer-
cury emissions and releases, which are periodically up-
dated by the Global Mercury Assessment reports (AMAP/
UNEP 2013).
Rather, this report provides a comprehensive update of
global sources of mercury, global trade flows and end
uses of mercury by geographical region and by category
of end use. It includes:
• Quantification of the global mercury supply for
2015
• An overview of global mercury trade from 2007 to
2015, with a particular focus on trade during 2013-
2015
• An assessment of the global demand for mercury
in products and processes in 2015
• Discussion of shifts in the global and regional trade
flows during the last 10 years, especially taking
into consideration the export restrictions imposed
by the United States and European Union mercury
export bans
• Identification of major gaps in our understanding
of the mercury supply-trade-demand continuum
-2-1.2. Methodology
Comprehensive and precise information on most as- The report relies on published and unpublished reports
pects of mercury supply, trade and demand is not readily and research, mercury production and trade databases,
available. At the same time, however, the extensive infor- personal contacts and interviews, reporting from the
mation that is available touches on virtually all aspects field, and input from experts and national authorities.
of this matter, and permits a reasonable understanding Personal contacts included communications with indus-
of conditions as the Minamata Convention enters into try operators (some of whom preferred to remain anony-
force. The development of the report entailed: mous), specialty metals brokers, academic researchers,
consultants and ASGM experts. Non-governmental or-
• Organizing a stakeholder discussion to obtain ganizations and other contacts with knowledge of the
broad input regarding the structure of the study sector were also a valuable source of information, and
helped with cross-checking other information. Also in-
• Compiling all relevant information, as described cluded are preliminary data or Toolkit-based mercury
below inventories from countries undertaking Minamata Initial
Assessments, as available, to complement other infor-
• Compiling data in such a way that it can be adapt- mation on mercury-added products.
ed to the needs of the periodic update of the Glob-
al Mercury Assessment The trade section of the report relies heavily on interna-
tional trade statistics available from the United Nations
• Highlighting the major uses of mercury and the International Trade Statistics Database (Comtrade), with
main challenges anticipated in early implementa- reference to certain national and other databases. Trade
tion of the Minamata Convention statistics submitted by national agencies to the United Na-
tions Statistics Division may be assumed to be consistent
• Producing appropriate graphics, visualizations, with national and international guidelines such as the Eu-
and summaries to assist in communicating the ropean Union Waste Shipment Regulation, the European
results of the analysis and any trends identified Union Prior Informed Consent Regulation and relevant US
laws. All statistics used in support of the analysis in this re-
• Organizing stakeholder review of the draft final port may be found in the appendix to the report or in online
report, and incorporating comments into the final appendices referenced in the body of the report.
draft, as appropriate
As a structure for analysis and as a resource of mercu-
• Disseminating the updated results in both digital ry information, the Mercury Inventory Toolkit has proven
and print formats valuable. However, the ranges of mercury content in prod-
ucts, presented as default factors in the Toolkit – and
All documents consulted are listed in the references and reflecting the real world situation – are often broad, and
the appendix. A literature search was carried out for rel- some researchers have simply used these broad ranges
evant peer-reviewed papers published since 2010. Also when lacking the resources necessary to carry out a more
reviewed were consultant reports, other “grey” literature, fundamental investigation. As a result, imprecision in na-
latest revisions to the UN Environment Mercury Invento- tional inventories has been observed in cases where re-
ry Toolkit, and online sources. searchers may have limited previous experience collect-
ing and analyzing the relevant data.
-3-2. Sources and supply
of mercury
The objective of this chapter is to roughly quantify the global mercu-
ry supply in 2015, including estimates of undocumented mercury that
may have been produced or marketed. The mercury supply is derived
from five main sources:
• Primary mercury mining, involving the processing of cinnabar ore
• By-product mercury recovery or “production” from other non-ferrous mining oper-
ations, as well as oil and gas processing
• Decommissioning (closure or conversion) of chlor-alkali facilities, followed by the
recovery of mercury from the electrolytic cells and other parts of the plant
• Recycling of mercury-added products and other mercury-bearing wastes
• The net change in government or private stocks of mercury4
4 Most commonly the original source of mercury in government and private stocks would have been prima-
ry or by-product mercury, or mercury recovered after chlor-alkali decommissioning.As contrasted with primary (mined) mercury, various 6. Ongoing demand (especially for ASGM and vinyl
references use the term “secondary mercury” to refer to chloride monomer production) combined with un-
by-product sources, to mercury recovered from process- certain supply in recent years has contributed to
ing operations and even to recycled mercury. In order to increases and volatility in the free market price of
avoid confusion regarding these mercury sources, there- mercury, which in turn has encouraged new mercu-
fore, the term is not used in this report. ry mining in Mexico and Indonesia.
Important issues with regard to changes and trends in 7. Major stocks of mercury (in one recent case, an
global mercury sources include the following: older Russian inventory that reportedly originated
in Kyrgyzstan) continue to appear on the market
1. Recent EU and US export bans have greatly re- periodically.
stricted the export of previously important mer-
cury supplies (especially mercury coming from 8. In the United States, some companies such as gold
the chlor-alkali industry), and other countries have mines are storing more of their by-product mercury
adopted, or are considering similar export bans. in the hope that the cost of handing it over to the
government will not be excessive when eventually
2. In the past, virtually all mercury recycled and recov- the government is obliged to take ownership of the
ered in the European Union and the United States mercury and manage it consistent with the 2016
was expected to be sold; now, due to limited domes- amendments to the Mercury Export Ban Act of
tic demand, severe export restrictions and limited 2008.6
options for dealing with hazardous waste, mercury
2.1. Primary
recycling is increasingly viewed as an intermediate
step on the way to stabilization and final dispos-
al (B. Lawrence, personal communication, 29 July
2016; Dieter Offenthaler, personal communication,
18 July 2017). mercury mining
3. Due to the domestic or regional surplus, the value
of mercury inside the United States and the Euro- Greer et al. (2007, 108) note, “It is crucially important that
pean Union is substantially lower than its value on any mercury reduction strategy ratchet down supply and
the global market, providing an incentive for the il- demand in a coordinated manner. This will ensure that
legal export of elemental mercury, as has occurred steps taken to reduce demand do not flood the market
in the European Union, or the legal export of com- with excess mercury supplies, which would invite mis-
pounds that could be transformed back into ele- management. Similarly it will ensure that a plummet in
mental mercury. supply does not trigger a re-opening of already closed pri-
mary mines to meet unsatisfied demand.”
4. Prior to the export bans, when mercury inside the
European Union and the United States had a higher This chapter deals with the supply side of the equation. A
value, scrap metal dealers would routinely collect separate chapter deals with the demand side.
and deliver mercury-added products for recycling.
Now there is less incentive for mercury scrap col- Mercury is currently mined only in China, Mexico, Indo-
lection. nesia and the Kyrgyz Republic. USGS (2015) mentions
mercury mining in Tajikistan, but since the main output
5. Sources of mercury will be increasingly scrutinized of the Anzob facility is antimony, its mercury production
as the Minamata Convention provisions to restrict has been included with by-product mercury in this report.
the use of mercury from certain sources become Likewise, USGS (2015) and previous USGS publications
operational. For example, primary mined mercury have reported 50 tonnes of mercury production in Rus-
should no longer go to ASGM now that the Conven- sia, but this is by-product mercury addressed later in this
tion has entered into force.5 chapter.
5 Two separate Convention requirements apply to this mining acti- 6 The 2016 Toxic Substances Control Act statutory amendments pro-
vity. First, effective upon the Convention entering into force, prima- vided non-ferrous mining and some related operations relief from
ry mined mercury cannot be used for ASGM. Second, all primary Resource Conservation and Recovery Act hazardous waste storage
mercury mining must be phased out within 15 years of when the requirements, allowing on-site storage for an extended period of
Convention enters into force for the Party. time.
-5-China has previously reported (Lin et al. 2016; Hui et al. ered mercury from mine tailings, as discussed in the
2017) mercury mining, although sources do not agree on section on by-product mercury. When funding becomes
the quantity of primary mercury produced. A recent re- available from the Global Environment Facility (GEF),
port put production at approximately 780 tonnes annually and in collaboration with UN Environment, a detailed as-
(GEF 2015). Other estimates in the same range, such as sessment of mercury mining operations is to be carried
664 tonnes in 2014 (CNIA 2015), and some much higher out by Semarnat, the Mexican Ministry of Environment
(Qiu et al. 2016), have also been published. Considering and Natural Resources.
the magnitude of China’s domestic mercury demand,
however, and the existence of artisanal mercury mining As seen in Table 1, Mexican exports reached about 300
(Hu 2010; Qiu et al. 2016), the range of 800-1 000 tonnes tonnes in both 2014 and 2015, with main destinations
is a reasonable estimate for the purposes of this report. in Latin American countries engaged in ASGM (SIAVI
China’s trading partners have documented some mer- 2016). There are also indications of important informal
cury coming from China, and there are periodic reports transfers of mercury from Mexico to Latin America, also
of undocumented Chinese mercury appearing in Africa likely destined for ASGM. One expert (L. Bernaudat, per-
(World Bank 2016b; CEC 2017). Meanwhile China’s trade sonal communication, 14 September 2016) has estimat-
relationship with Hong Kong remains fluid. For example, ed that total mercury mine production in recent years
shipments from mainland China to Hong Kong are not may be twice the level of documented (as contrasted
reported as exports. When Hong Kong ultimately reports with informal or undocumented) exports, while others
significant exports of mercury, it is logical that some of (J. Castro Díaz, personal communication, 14 September
those may have originated on the mainland. Moreover, at 2016) believe the total is not that high. The best esti-
the ultimate destination, it is not necessarily clear wheth- mate of primary mercury production in 2015 is in the
er the mercury originated in China or in Hong Kong. range of 400-600 tonnes.
Official primary mercury mining in Mexico ceased in Both China and Mexico have ratified the Minamata Con-
1994 due to low global mercury demand and prices vention. For Parties to the Convention, new primary mer-
(Díaz 2013), but in 2011 the Mexican Geological Service, cury mines are not allowed to start up after the Conven-
a federal agency, reported that three mercury mines ap- tion enters into force, and all existing mines are to be
peared to have reopened and were working intermittent- phased out within 15 years of that date (UNEP 2013c).
ly (Díaz 2011). In June 2016, UN Environment officials Moreover, under Article 3 of the Convention, any primary
conducted a field visit and verified the existence of five mined mercury cannot be used for ASGM, which is a re-
resurrected mines, inferring that there are others as well striction some countries will find challenging to monitor
(see box). In addition, some operations have long recov- and to enforce.
Table 1. Mercury exports to all countries, 2010-2015, as reported by Mexico
Price per kg Price per flask
Value (US$) Quantity (kg) (average, US$) (average, US$)
2010 $958 941 25 513 $37.59 $1 297
2011 $8 669 938 134 302 $64.56 $2 227
2012 $21 454 783 261 841 $81.94 $2 827
2013 $23 406 327 267 645 $87.45 $3 017
2014 $17 681 581 300 931 $58.76 $2 027
2015 $13 909 189 306 695 $45.35 $1 565
Source: SIAVI database, available at ; accessed 24 July 2016.
-6-Mercury mining in Mexico
Mexico has a long history of mercury mining at least 300 ings in the state of Zacatecas, mercury mining had not been
former mines have been identified. The richest mercury considered an economically viable activity. This assessment
deposits are found in locations in the central states, such began to change around 2010 as the economic situation in
as Nuevo Mercurio in Zacatecas, Sierra Gorda in Queréta- the country and the rise in the price of mercury encouraged
ro, and the High Plateau in San Luis Potosí (Diaz 2013; some individuals to organize the collection of mercury from
Camacho et al. 2016). artisanal miners for export. From 2010 to 2011 formal (as
compared with undocumented, or informal) mercury ex-
Since the 1970s, however, other than ongoing recovery of ports increased from 26 to 134 tonnes, and even more in
about 24 tonnes of mercury per year from silver mine tail- subsequent years, as in the table below (SIAVI 2016).
Mexican documented mercury exports and imports, 2010-2015 (kg)
2010 2011 2012 2013 2014 2015
Exports 25 513 134 302 261 841 267 645 300 931 306 695
Imports 14 543 13 892 26 583 733 28 239
Source: SIAVI database, available at ; accessed 24 July 2016.
A number of the old mines that had been closed in the
1970s have been reopened. Studies from the Universi-
ty of Querétaro and the University of San Luis Potosí, a
neighbouring state, estimated that 300-400 tonnes of
mercury are extracted in their states each year. One ex-
pert on a mission to Mexico in 2017 estimated that mer-
cury production only in the province of Querétaro involved
1000 miners producing nearly 300 tonnes of mercury per
year (Spiegel et al. 2017). Bolivia, Colombia and Peru are
the main destinations. These three countries are known
to have extensive ASGM operations, although recent
government controls in Peru have recently reduced docu-
mented imports of mercury for ASGM.7
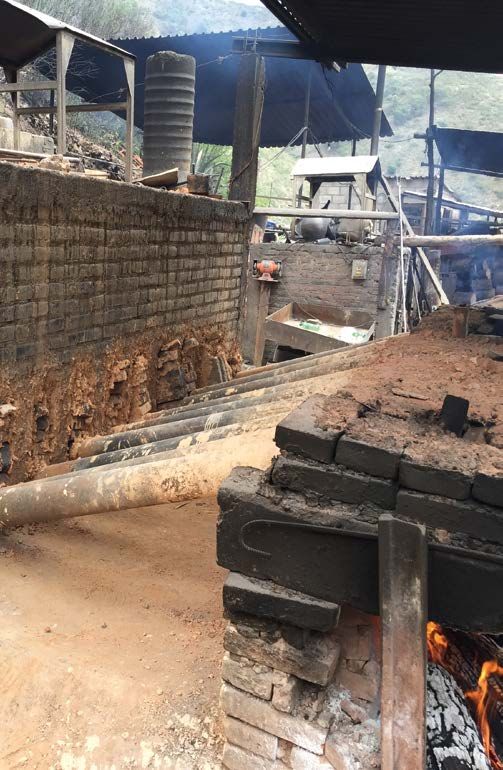
Recent site visits confirmed the artisanal mercury extrac-
tion techniques typically employed, consisting of hand
crushing and manual selection of material to roast, roast-
ing in cylindrical chambers, and natural condensation of
the gases. The various sites visited used mostly wood for
the roasting process, although some used gas burners.
Experts from the University of Querétaro have estimated
that 20-25 per cent of the mined mercury is not recov-
ered, either remaining in the cinnabar ore due to ineffi-
cient crushing, or lost to the environment as vapour leaks
during processing (Source and photo: Bernaudat 2016).
7 In 2012 Peru published Legislative Decree No. 1103 establishing
control measures for the distribution, transport and marketing of
chemicals used in illegal mining. In 2014 it published Supreme De-
cree No. 029-2014-PCM, in which the President and the Council of
Ministers endorsed a strategy and measures for the reduction and
ultimate elimination of mercury in ASGM.
-7-National government officials acknowledged in March in previous years, in 2015 Indonesia documented mercu-
2015 that primary mercury mining was occurring in In- ry exports of 284 tonnes (mostly to Hong Kong, Switzer-
donesia. At that time their estimate for primary mining land, Singapore and Viet Nam), as in Table 2.8
output was a minimum of 13 tonnes, while some Indo-
nesian non-governmental organizations believed it was Since ASGM activities in Indonesia during that period were
higher (Davis 2016). Not long afterward, in 2016, it was estimated to consume on the order of 150-200 tonnes of
confirmed that Indonesian demand for imported mercu- mercury (AMAP/UNEP 2013), questions were raised about
ry had declined significantly. In a recent paper, Spiegel et the sources of so much mercury. Documented imports of
al. (2017) reported for the first time that mercury mining mercury were minimal, although some undocumented im-
in Indonesia has substantially increased after starting ports were possible, mercury recovered from the oil and
quietly in 2012, encouraged by the high price of mercury gas industry did not exceed 20-30 tonnes, and mercury in
(imported mercury is more than twice the price of locally local storage had apparently been drawn down. Despite
produced mercury, though generally of higher purity) and the many uncertainties, it is likely that mercury mining in
substantial domestic demand from ASGM operations Indonesia amounted already to 400-500 tonnes in 2015,
(see box). After exporting less than 20 tonnes of mercury and has surely increased since then (Spiegel et al. 2017).
Table 2. Mercury exports to all countries, 2010-2015, as reported by Indonesia
Price per kg Price per flask
Value (US$) Quantity (kg) (average, US$) (average, US$)
2010 $42 687 14 370 $2.97 $102
2011 $9 610 19 467 $0.49 $17
2012 $8 530 16 250 $0.52 $18
2013 $1 929 6 978 $0.28 $10
2014 $255 810 $0.31 $11
2015 $2 615 999 283 767 $9.22 $318
Source: Comtrade database, available at , accessed 28 August 2017.
8 In 2016 mercury exports of 350 tonnes were reported only from
the main seaport of Jakarta, primarily to Singapore, India, Hong
Kong, the United Arab Emirates and Viet Nam (Indonesian Customs
2016).
-8-Mercury mining in Indonesia
As mercury prices skyrocketed from 2011 to 2013, and smelting, and some to Surabaya. More recently, smelting
local demand from ASGM continued to increase, artisanal operations have opened in Sukabumi (West Java), Ambon
mercury mining in Indonesia gradually took on a much City and Seram (one of the Maluku islands).
larger role (Spiegel et al. 2017) – first to supply domestic
ASGM demand, and then for the export market. The manager of one of the smelting operations in East Ja-
karta, which has been operating only since the last quarter
Prior to 2015 the Indonesian government had not acknowl- of 2016, reports that his operation receives extraordinar-
edged the existence of domestic mercury mining. In March ily high-grade cinnabar (50-65 per cent mercury content)
2015 the government acknowledged mercury mining flown to Jakarta from Seram. The smelter receives cinna-
amounting to at least 13 tonnes, while some Indonesian bar in sacks, crushes the cinnabar, and fills iron cylinders
non-governmental organizations were convinced the pro- with the material (and a small amount of “catalyst”) for
duction was much greater (Davis 2016). During the course smelting over a fire in a long trench, as in the photo pro-
of 2015 Indonesian Customs seized at least 14 shipping vided. The distilled mercury condenses down long tubes
containers of cinnabar and metallic mercury prepared for welded to the cylinders and drips into cups filled with water
export and believed to be obtained from domestic mining. (personal communications, March 2017).
Two of the destinations listed were Hong Kong and the
Philippines. Some of the goods were accompanied by a This operation has a present production capacity of 4-5
false export declaration, and in one case the exporter used tonnes of mercury per week, although average sales so far
another company’s name for exporting the goods (Lestari- are about one-third of that amount. The manager is active-
post 2015; Jakarta Globe 2015). ly looking for international buyers, who will pay more for
the mercury than local merchants, and has already sold
Mercury mining permits are rarely granted by the govern- mercury to buyers from China, Hong Kong and India. He
ment, so these operations located mainly in Maluku Prov- says he is able to arrange export of the mercury, but pre-
ince, West Kalimantan and East Java are mostly illegal. In- fers that buyers make their own transport arrangements
itially, most of the cinnabar was transported to Jakarta for for export.
-9-2.2. By-product
mercury
2.2.1. Non-ferrous ores
The Kyrgyz Republic’s Khaidarkan mine once supplied For the purposes of this report, by-product mercury is de-
primary mined mercury to the global marketplace. During fined as mercury that is a naturally occurring component
the last 10 years production has been in decline due to of an ore from which it is separated through an industri-
technical challenges related to deep mining, and a lack al or chemical process, as contrasted with a material or
of adequate investment in an uncertain economic envi- product to which mercury is intentionally added. Mercury
ronment. The United States Geological Survey (USGS may appear as a trace contaminant in other non-ferrous
2016b) estimated mine production at 70 tonnes in 2015, ores, especially zinc, gold, lead and copper ores, but also
although the main western buyer estimated the output sometimes silver and antimony. If the mercury content
at no more than 30 tonnes (personal communication, 9 in a non-ferrous ore is high enough to warrant removal,
August 2016), especially as Khaidarkan is no longer refin- there are various methods for removing it at some stage
ing the antimony-mercury concentrates it used to receive of the refining process in order to produce a metal of the
from Tajikistan. required purity. After removal, the by-product mercury is
typically in the form of calomel (Hg2Cl2) or metallic mer-
For some years, with leadership from the governments cury, or it may be captured on activated carbon filters or
of Switzerland and the United States, UN Environment at other stages of the removal process.
has made it a priority to assist the Kyrgyz government in
transitioning away from primary mining (UNEP undated It is evident that for reasons of limiting the total quanti-
1). In October 2009, the government of the Kyrgyz Re- ty of mercury circulating in the biosphere, when mercury
public announced its willingness to consider closure of is needed in commerce it is preferable to use by-product
the Khaidarkan mine under certain conditions (UNITAR mercury than to mine primary mercury. By-product mer-
2009), but outstanding issues have not been resolved. cury is most frequently generated from non-ferrous metal
Since that time there have been other international ef- refining operations, however, and most of this mercury
forts to encourage closing the mine. The most recent is still goes to disposal or is released to the environment
a Global Environment Facility project designed to replace (AMAP/UNEP 2013). This poses a challenge in determin-
primary mercury mining with alternative sources of in- ing how much by-product mercury is eventually market-
come (GEF 2013). ed, since the recovery of mercury from other ores does
not necessarily imply that the recovered mercury will be
Other informal mercury mining activities may take place in put on the market.
a few other countries such as Peru, but the output would
not be significant enough to change the general conclu- Until recently, in the United States by-product mercury in
sion of this analysis, which is that global primary mercury elemental form, calomel, mercury-bearing sludge, mer-
production, both formal and informal, is estimated to be in cury-zinc precipitates and mercury collected on pollution
the range of 1 630-2 150 tonnes, as summarized in Table 3. control devices were typically sold to US recycling com-
panies for further processing (USEPA 2009). Now that
the recyclers can no longer export the refined elemental
Table 3. Global primary mercury mining, 2015
mercury, some of this by-product is going to disposal and
some is put in storage. Since 2006, in order to better mon-
Mercury marketed itor the trace mercury in many of the local non-ferrous
Country or region ores, the US state of Nevada Mercury Control Program
(tonnes)
has required that local companies must report annual
China 800 – 1 000 mercury production and emission statistics to the Ne-
Mexico 400 – 600 vada Division of Environmental Protection (USGS 2013).
Indonesia 400 – 500
Kyrgyz Republic 30 – 50
Peru and other minimal
countries
TOTAL 1 630 – 2 150
- 10 -Barrick Gold Corporation, a major mining company oper- In China, despite the large quantity of mercury (estimated
ating in various countries as well as Nevada, states: by Wu et al. (2016) at 1 005 tonnes in 2014) in non-fer-
rous metal ore concentrates processed annually, it is only
“… elemental mercury captured from air pollution in recent years that some mercury has been recovered
controls at our US operations is currently stored from the processing of zinc and antimony concentrates.
pending the construction of the federal mercury re- Currently, there is one antimony-mercury mine located in
pository. Mercury compounds are disposed of at a Xunyang, Shaanxi, that produces mercury at a relatively
licensed hazardous waste facility…. In the case of large scale (Lin et al. 2016). In 2014, antimony ores con-
operations at Latin American sites, mercury is cur- tributed 70-90 tonnes of mercury (CNIA 2015). A figure
rently securely stored on site….”9 was not given for zinc, but since Wu et al. (2016) estimat-
ed recovered mercury at 63 tonnes total in 2014, the quan-
In Canada, Teck Metals Ltd./Cominco/Trail Operations in tity for zinc in 2015 would not be expected to be greater
Trail, British Columbia, in 2014 sent 3.7 tonnes of mercury than that for antimony. It should also be noted that these
(including the mercury content of mercury compounds) sources of mercury may not be considered to come from
from non-ferrous ore processing to the United States10 for primary mercury mining, and therefore are not subject to
recycling and stabilization, followed by eventual dispos- the Minamata obligations associated with phase-out and
al in Quebec, Canada (B. Lawrence, personal communi- use restrictions.
cation, 29 July 2016). Alternatively the recycled mercury
could have been sold in the US domestic market, or kept The US Geological Survey (2016) estimated total mercury
in long-term storage and management consistent with by-product from non-ferrous metal mining in Peru, Argen-
the provisions of the Mercury Export Ban Act. tina and Chile at 70 tonnes, which was a substantial re-
duction from USGS estimates published less than a year
The USEPA Chemical Data Access Tool (CDAT)11 shows before, and inconsistent with the quantities of by-product
that Barrick Goldstrike Elko in 2010 reported as by-prod- mercury Peru exported to the United States in previous
uct and sent for recycling nearly 55 tonnes of mercury (13 years (B. Lawrence, personal communication, 18 July
tonnes elemental and nearly 42 tonnes of mercury in mer- 2017). In Argentina alone, Barrick’s Veladero gold mine
cury(II) chloride).12 Although most US gold mining takes produced 59 tonnes of by-product mercury in 2015 and
place in Nevada, Barrick is responsible for only about 50 135 tonnes in 2016.13 Some of the US Geological Survey
per cent of the total (Perry and Visher 2016), so the in- estimates are based simply on export data, and would not
dustry-wide figure for the United States is evidently larger. necessarily include mercury stored on site. Referring to
information previously reported in UNEP (2008), the total
by-product mercury recovered from these mining opera-
tions is therefore estimated to be more than 100 tonnes.
9 See , accessed 24 August 2017. Stepanov and Moiseenko (2008) estimated by-prod-
10 Data from Canada’s National Pollutant Release Inventory uct mercury recovered from Russian gold mining at 50
(NPRI) database, available online at
that at least as much mercury continues to be recovered.
11 The Chemical Data Reporting (CDR) Rule, issued under the Toxic USGS (2016) did not estimate Russian mercury produc-
Substances Control Act (TSCA), requires manufacturers (including tion, although in previous years it supported the estimate
importers) to give EPA information on the chemicals they manu-
of 50 tonnes.
facture domestically or import into the United States. The USEPA’s
Chemical Data Access Tool (CDAT) permits a search of the reported
data by chemical name, and company. accessed 21 June 2016. Tajikistan began to recover on site and sell on the open
12 For its worldwide operations Barrick reported generating 142 tonnes market by-product mercury from antimony concentrates,
of by-product mercury in 2015 and 275 tonnes in 2016. See , accessed 24 August 2017. 13 Ibid.
- 11 -2.2.2. Oil and natural gas
amounting to nearly 30 tonnes of mercury per year. For- Most oil and natural gas contain mercury in trace quanti-
merly these concentrates had been sent to Kyrgyzstan’s ties. In many regions of the world, depending on geology,
Khaidarkan complex for recovery of the mercury (person- especially some gas fields in the Netherlands, North Sea,
al communication, 9 August 2016). Algeria, Croatia, Malaysia, and Indonesia, the trace mercury
content is high enough to cause serious equipment prob-
For many years miners in Mexico have recovered silver and lems during processing if the mercury is not removed.14
mercury from mine tailings in Zacatecas using the lixivia-
tion method. These tailings were generated by silver mines Crude oil
(operating between 1556 and 1900) that used the amalga- As cited in UNEP (2015), the production weighted global av-
mation method (Díaz 2013). Production of mercury in 2015 erage mercury concentration in crude oil was somewhere
has been estimated at around 25 tonnes. Meanwhile a new between 3.4 mg/tonne and 5.7 mg/tonne, or on the order
plant – also with mercury production capacity estimated of 15-20 tonnes of mercury in 2015, assuming crude pro-
at 25 tonnes per year – has been constructed and has ap- duction of about 30 billion barrels, or about 4 billion tonnes
plied to Semarnat (Mexican Ministry of Environment and of oil equivalent. Oil refineries often remove mercury when
Natural Resources) for an operating permit (CEC 2017). it exceeds certain levels, but the total removed and then
recycled is small in relation to other sources of by-product
Apart from gold ores, in light of the quantity of ore mined mercury, so will be ignored for the purpose of this report.
and the trace mercury content, zinc ores have the poten-
tial to supply the greatest quantity of by-product mercury
Natural gas
globally. In 2007, based on the equipment installed world-
Mercury in natural gas, on the other hand, should not be ig-
wide for removing mercury from zinc ores, Boliden officials
nored, especially considering the quantities of gas that are
calculated theoretical by-product mercury production
flared regardless of the mercury content. As mentioned, the
based upon the design capacity of the units, the amount
mercury concentration in natural gas varies considerably
of gas managed in the units, and the typical mercury con-
with the geology, and may even vary significantly between
tent of the gas. Globally, they estimated that about 260
gas fields in the same region. The variation is wide enough
tonnes of mercury content in calomel could be generated
that a global average mercury concentration would have
annually at zinc smelters, with major uncertainties related
little meaning.
to individual plant operating characteristics, the operating
status of the mercury removal units, and other factors
Pirrone et al. (2001) reported that “a reduction of mercury
(UNEP 2008). This information is used here only for an
to below 10 g/Nm3 has to be obtained before the gas can
order-of-magnitude indication of by-product mercury pro-
be used,” although mercury at far lower concentrations is
duction in other countries not identified above, of which
often removed from gas as well. An equipment provider
relatively little mercury appears to reach the marketplace.
has suggested that it is desirable to reduce the mercury
concentration to as little as 0.01 µg/Nm3 in order to avoid
As regards the generation of mercury compounds during
mercury damage (UoP-Honeywell, CalgonCarbon). This
the purification of ores, according to the Comtrade data-
is a level that is exceeded in most gas fields – not infre-
base, in 2015 the United States exported over 200 tonnes
quently by several orders of magnitude. UNEP (2015, 83)
of mercury compounds (HS code 2852), mostly to Cana-
provides examples of a dozen measurements taken in the
da, although there is no indication as to what part of that
field, varying from close to zero in some parts of the Neth-
total may have been generated as by-product.
erlands, to nearly 50 µg/Nm3 in the Middle East, and to 300
µg/Nm3 in East Asia and other parts of the Netherlands. An
According to the Comtrade database, the 28 member
industry technical report gives a range of 1-2 000 µg/Nm3
states of the European Union exported between 118 and
based on assessments from five continents (UOP 2010). A
160 tonnes of mercury compounds (HS code 2852) from
single gas field in Indonesia estimated it could recover 85
the EU each year from 2012 to 2014. Again, there is no
kg of elemental mercury (plus 1-3 kg of mercury recovered
indication as to what part of that total may have been
from spent catalyst) per month if it set up the necessary
by-product. Beginning in 2015, however, this trend had re-
recovery system (Indonesia 2010).
versed and the EU-28 became a net importer of mercury
compounds with a net import of 28.5 tonnes, followed by
120 tonnes in 2016. Based on a recent study for the Eu-
14 Specifically, mercury condenses as liquid mercury on the inside of pi-
ropean Commission (2015a), it is estimated that 50-100
ping and equipment, or it amalgamates with aluminum (most proble-
tonnes of equivalent mercury in compounds were put on matic) or other metals (except iron), gradually corroding and weake-
the EU market in 2015. ning the metals, which has resulted in serious industrial accidents.
- 12 -You can also read