CPB - Safe Micromobility - ITF Remote Access
←
→
Page content transcription
If your browser does not render page correctly, please read the page content below
CPB
               Corporate Partnership
               Board

Safe Micromobility

                                       Corporate Partnership Board
                                       Report
Safe Micromobility

                     Corporate Partnership Board
                     Report
The International Transport Forum

The International Transport Forum is an intergovernmental organisation with 60 member countries. It
acts as a think tank for transport policy and organises the Annual Summit of transport ministers. ITF is
the only global body that covers all transport modes. The ITF is politically autonomous and
administratively integrated with the OECD.
The ITF works for transport policies that improve peoples’ lives. Our mission is to foster a deeper
understanding of the role of transport in economic growth, environmental sustainability and social
inclusion and to raise the public profile of transport policy.
The ITF organises global dialogue for better transport. We act as a platform for discussion and pre-
negotiation of policy issues across all transport modes. We analyse trends, share knowledge and
promote exchange among transport decision-makers and civil society. The ITF’s Annual Summit is
the world’s largest gathering of transport ministers and the leading global platform for dialogue on
transport policy.
The Members of the Forum are: Albania, Armenia, Argentina, Australia, Austria, Azerbaijan, Belarus,
Belgium, Bosnia and Herzegovina, Bulgaria, Canada, Chile, China (People’s Republic of), Croatia,
Czech Republic, Denmark, Estonia, Finland, France, Georgia, Germany, Greece, Hungary, Iceland, India,
Ireland, Israel, Italy, Japan, Kazakhstan, Korea, Latvia, Liechtenstein, Lithuania, Luxembourg, Malta,
Mexico, Republic of Moldova, Montenegro, Morocco, the Netherlands, New Zealand, North Macedonia,
Norway, Poland, Portugal, Romania, Russian Federation, Serbia, Slovak Republic, Slovenia, Spain,
Sweden, Switzerland, Tunisia, Turkey, Ukraine, the United Arab Emirates, the United Kingdom and the
United States.

                  About the Corporate Partnership Board

The Corporate Partnership Board (CPB) is the International Transport Forum’s platform for engaging with
the private sector and enriching global transport policy discussion with a business perspective. The
members of the ITF Corporate Partnership Board are: AB InBev, Airbus, Alstom, Aramco, Bird, Bosch,
Cruise, ExxonMobil, Grin, Iberdrola, Incheon International Airport, Kakao Mobility, Kapsch TrafficCom,
Kyyti Group, Latvian Railways, Michelin, NXP, Penta Security, PTV Group, RATP Group, The Renault-
Nissan-Mitsubishi Alliance, Siemens, SNCF, Spea Engineering, Total, Toyota, Uber, Valeo, Volvo Cars,
Volvo Group and Waymo.

                                            Disclaimer

Funding for this work has been provided by the ITF Corporate Partnership Board. This report is published
under the responsibility of the Secretary-General of the ITF. It has not been subject to the scrutiny of ITF
or OECD member countries and does not necessarily reflect their official views or those of the members
of the Corporate Partnership Board.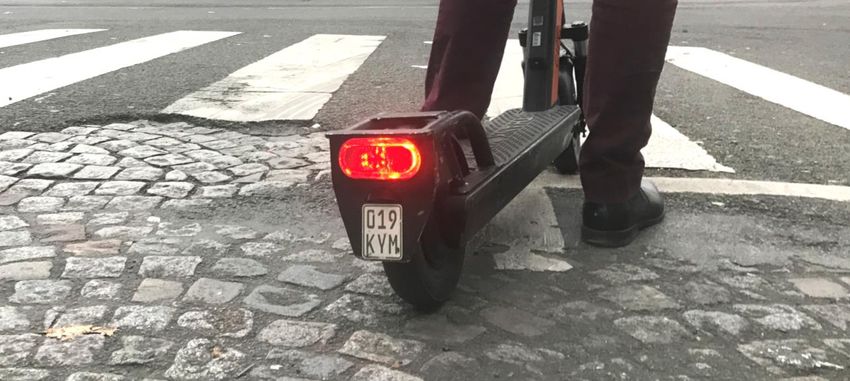
ACKNOWLEDGEMENTS

                                     Acknowledgements

The principal author of this report is Alexandre Santacreu of the International Transport Forum (ITF).
Substantial contributions came from George Yannis (National Technical University of Athens), Ombline
de Saint Léon (ITF) and Philippe Crist (ITF).
The author is thankful for information and thoughts shared by Annie Chang (SAE International), Marko
Dozza (Chalmers University), Tina Gehlert (German Insurance Association), Catherine Pérez (Public
Health Agency of Barcelona), Adrià Gomila (City of Barcelona), Sophie Hamada (Inserm), Jean-Louis
Martin (Ifsttar), Pernille Ehlers (Danish Road Safety Council), Candida Castro (University of Granada), Urs
Walter (Swiss Federal Roads Office), Vaughn Allan (Institute for Sensible Transport), Adriana Jakovcevic
(Buenos Aires City Government), Alexis Merkling and Antonin Nonis (French Insurance Federation),
Valentin Löwenstein (Dekra) and AXA.
The report also draws on contributions and discussions during an expert’s workshop, organised
18 October 2019 in Lisbon. The ITF wishes to thank Deputy Mayor Miguel Gaspar, Pedro Homem de
Gouveia, Vasco Mora, Cristina Rocha and Pedro Machado for hosting this event. Workshop participants
are listed in Annex E.
At the International Transport Forum, credits go to Stephen Perkins and Sharon Masterson for
contributions to the workshop and reviewing of the document. Sokob Challener supported the project
and Hilary Gaboriau edited the draft.
Special thanks go to the members of the ITF Safer City Streets network for their contributions and for
helping to develop a better understanding of urban road safety challenges.
The work for this report was carried out in the context of a project initiated and funded by the ITF’s
Corporate Partnership Board (CPB).
CPB projects are designed to enrich policy discussion with a business perspective. They are launched in
areas where CPB member companies identify an emerging issue in transport policy or an innovation
challenge to the transport system. Led by the ITF, work is carried out in a collaborative fashion in working
groups consisting of CPB member companies, external experts and ITF staff.
The authors wish to thank the members of the Corporate Partnership Board involved in this project: Bird,
Bosch, Grin, Incheon Airport, Kapsch TrafficCom AG, Michelin, PTV Group, Toyota and Uber.
The project was managed by Alexandre Santacreu and Philippe Crist. Sharon Masterson manages the
Corporate Partnership Board and its activities.

SAFE MICROMOBILITY © OECD/ITF 2020                                                                      3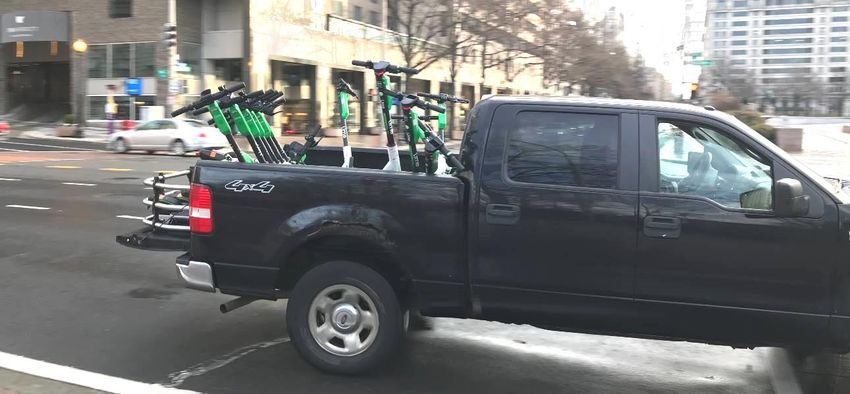
TABLE OF CONTENTS

                                                     Table of contents

Glossary............................................................................................................................................... 7
Executive summary ........................................................................................................................... 10
What is micromobility?...................................................................................................................... 13
    Micromobility definition and classification ................................................................................... 14
    International vehicle classification systems .................................................................................. 15
    Other efforts to classify micromobility .......................................................................................... 17
How safe are micromobility trips? ..................................................................................................... 20
    Lessons from fatality data ............................................................................................................. 20
    Lessons from injury data ............................................................................................................... 24
    Safety through mode shift............................................................................................................. 29
    Data collection: Why do it and how to improve it ......................................................................... 33
Safe vehicles and operations ............................................................................................................. 36
    Vehicle design ............................................................................................................................... 37
    Type approval and technical inspections ...................................................................................... 41
    Shared fleet operations: Best practice in maintenance, recharging and redistribution ................ 46
Safe road users .................................................................................................................................. 48
    Experience, training and education: Will micromobility become safer over time? ....................... 48
    The regulatory questions .............................................................................................................. 54
    Pedestrian protection.................................................................................................................... 59
Safe infrastructure............................................................................................................................. 62
    Rethinking cycling facilities ............................................................................................................ 64
    Can cycling facilities accommodate all types of micro-vehicles? .................................................. 66
    Collect data to identify dangerous locations ................................................................................. 68
Finding the right regulatory balance .................................................................................................. 70
    Vehicle types: Ensuring regulations are proportionate to public health and safety impacts ........ 71
    Potential for self-regulation .......................................................................................................... 73
Notes................................................................................................................................................. 75
References ........................................................................................................................................ 76
Annex A. Standing e-scooter fatality details....................................................................................... 89
Annex B. Vehicle involvement in fatal crashes ................................................................................... 91
Annex C. Micromobility safety research priorities: Survey results...................................................... 92
Annex D. Summary of vehicle requirements in European regulation No. 168/2013 .......................... 94
Annex E. List of Workshop participants ............................................................................................. 95

4                                                                                                               SAFE MICROMOBILITY © OECD/ITF 2020
TABLE OF CONTENTS
Figures
Figure 1. Proposed micromobility definition and classification .......................................................... 15
Figure 2. Types of powered micromobility vehicles as defined by SAE............................................... 18
Figure 3. NUMO’s framework for mapping vehicle characteristics with policy requirements ............ 19
Figure 4. Fatalities in collisions involving a given user group.............................................................. 20
Figure 5. Vehicle occupant fatalities by third party involvement ....................................................... 21
Figure 6. Population density and land areas of cities from the ITF Safer City Streets database .......... 23
Figure 7. Number of crashes reported by riders of two standing e-scooter companies ..................... 28
Figure 8. Number of fatalities in collisions involving a given user group in selected cities, 2011-15... 29
Figure 9. Poster to assist medical staff with the coding of micromobility injuries .............................. 33
Figure 10. Taxonomy adopted by police and public health departments in San Francisco ................. 34
Figure 11. German vehicle dynamics testing elements ...................................................................... 42
Figure 12. Cargo bike used in maintenance and battery swap operations ......................................... 46
Figure 13. Contractors or “juicers” use private vehicles to collect and recharge e-scooters .............. 47
Figure 14. In-app taxi passenger alerts for the safe opening of car doors near bikes ......................... 51
Figure 15. Screen captures from online traffic school RideLikeVoila .................................................. 53
Figure 16. In Europe, Germany has the most cities with shared standing e-scooters......................... 54
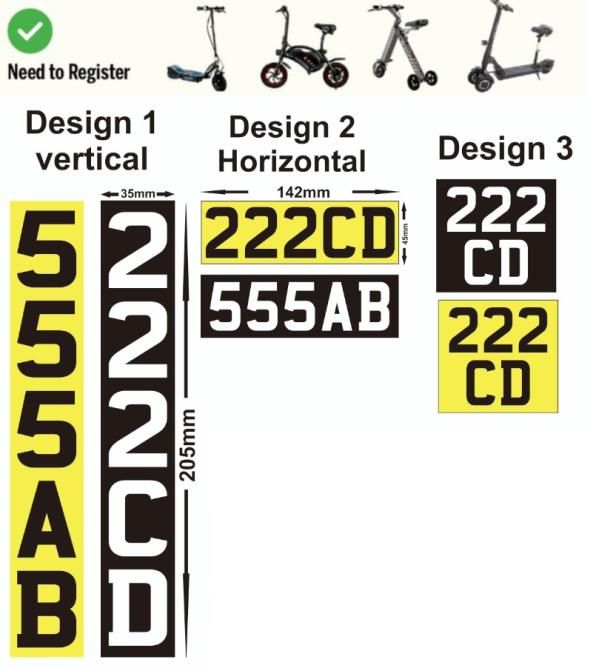
Figure 17. E-scooter identification plate in Europe ............................................................................ 60
Figure 18. Design standard for identification stickers in Singapore .................................................... 61
Figure 19. Bicycle Network Analysis of New York City by PeopleForBikes .......................................... 64
Figure 20. Road surface damage and illegal parking at a bus stop ..................................................... 65
Figure 21. Desired infrastructure improvements, responses from a Bird Rider Survey ...................... 66
Figure 22. Micromobility safety research priorities: Survey results .................................................... 93
Tables
Table 1. Standing e-scooter injury studies comparison ...................................................................... 24
Table 2. Rider injury rates per billion trips ......................................................................................... 27
Table 3. Mode shift reported by shared standing e-scooter users ..................................................... 31
Table 4. Approval requirements for powered cycles and two-wheel mopeds in Europe .................... 44
SAFE MICROMOBILITY © OECD/ITF 2020 5
TABLE OF CONTENTS

Table 5. Requirements for bicycles and slow e-bikes in the United States ......................................... 45
Table 6. Details of e-scooter related deaths, May 2018 to end October 2019 ................................... 89
Table 7. Vehicle involvement in fatal crashes .................................................................................... 91
Table 8. Number of survey responses by type of organisation ........................................................... 92
Table 9. Summary of vehicle requirements in European regulation No. 168/2013 ............................ 94

                                                                Boxes

Box 1. The ITF Safer City Streets network .......................................................................................... 23
Box 2. German product testing .......................................................................................................... 42
Box 3. Teaching cycling skills in schools ............................................................................................. 50
Box 4. Where speed pedelecs are classified as bicycles ..................................................................... 52
Box 5. Online e-scooter traffic school by VOI ..................................................................................... 53
Box 6. Current situation of electric scooters in Germany ................................................................... 55
Box 7. New terms to describe a micromobility infrastructure? .......................................................... 63

6                                                                                                     SAFE MICROMOBILITY © OECD/ITF 2020
GLOSSARY

                                                     Glossary

This report proposes a glossary of terms to reflect some globally understood language and definitions
regarding vehicle types. It does not seek to present legal terms and regulations from specific countries.

Micromobility
Personal transportation using devices and vehicles weighing up to 350 kg and
whose power supply, if any, is gradually reduced and cut off at a given speed limit
which is no higher than 45 km/h. Micromobility includes the use of exclusively
human-powered vehicles, such as bicycles, skates, skateboards and kick-scooters.

Micro-vehicle
Device or vehicle used for micromobility (see micromobility).

Powered (adj.) (Synonym: motorised)
Qualifies a vehicle which can be propelled without human energy input. Throttle-
controlled or self-balancing micro-vehicles can be described as powered. Bicycles
and pedal-assisted bicycles do not qualify as powered.

Motor vehicle
In the context of this report, a motor vehicle is a moped, motorcycle, car, van,
truck, bus or coach.

Motor scooter
Vehicle shape or “form factor” found across different vehicle classes that consists
of a low platform between the back and front wheels. Motor scooters can be
legally classified as mopeds or motorcycles depending on their power and speed.

Powered two-wheeler
A class of motor vehicle which includes mopeds and motorcycles. It includes both
petrol-powered and electric models.

Motorcycle
Powered street vehicle, with two to three wheels and a seat, designed to reach
speeds greater than 45 km/h.

Moped
Powered street vehicle, with two to three wheels and a seat, sometimes equipped
with pedals. When powered by internal combustion engine, its capacity is typically
limited to 50 cc. Maximum vehicle speed depends on national regulations but is
typically limited to 45 km/h. Number plates are imposed in some countries and on
some classes of mopeds.

SAFE MICROMOBILITY © OECD/ITF 2020                                                                   7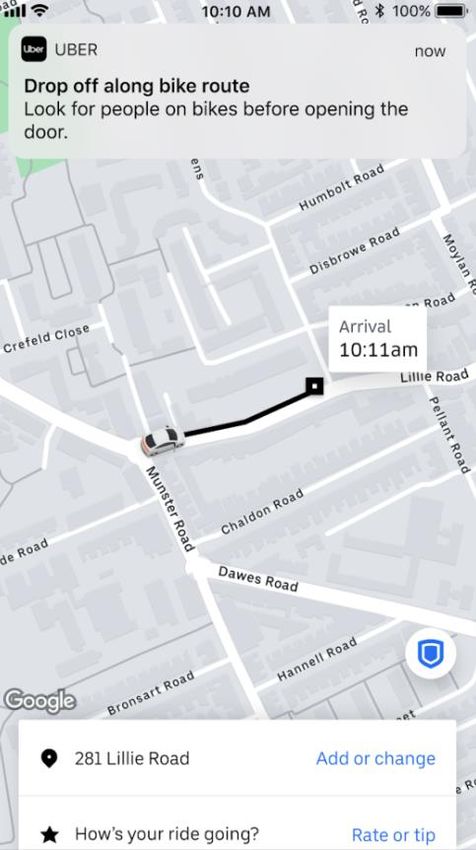
GLOSSARY

Bicycle (Synonym: bike, cycle)
A road vehicle that has two or more wheels and is generally propelled by the
muscular energy of the persons on that vehicle, in particular by means of a pedal
system, lever or handle (e.g. bicycles, tricycles, quadricycles and invalid carriages).
Included are cycles with a supportive power unit (e.g. e-bikes, pedelecs).

E-bike (Synonym: electric bicycle)
A type of bicycle with a supportive power unit, providing pedal assistance or fully
throttle-controlled propelling force.

Pedal assisted bicycle
A type of e-bike which only provides assistance when the user is pedalling. It
includes models of various power output levels, such as pedelecs and speed-
pedelecs.

Pedelec (Synonym: slow e-bike)
A type of pedal-assisted bicycle where the electric power cuts off when the vehicle
reaches approximatively 25 km/h (exact limit depends on local regulations).

Speed-pedelec (Synonym: fast e-bike)
A type of pedal-assisted bicycle where the electric power cuts off when the vehicle
reaches approximately 45 km/h (exact limit depends on local regulations).

Mobility scooter
Electrically powered vehicle specifically designed for people with restricted
mobility, typically those who are elderly or disabled. The term scooter is used in
reference to the flat vehicle frame and the foot platform.

Standing scooter (Synonym: kick scooter, push scooter)
Human-powered street vehicle with a handlebar, deck, and wheels propelled by a
rider pushing off the ground. Models exist with two, three or four wheels.
Standing scooters can be distinguished from skateboards by the presence of a
central control column and a set of handlebars.

E-scooter (Synonym: Standing Electric Scooter)
A stand-up or seated scooter that can be propelled by the electric motor itself,
irrespective of the user kicking.

Skateboard
Board with four wheels on two axles, propelled by the user kicking against the
ground.

8                                                                                         SAFE MICROMOBILITY © OECD/ITF 2020
GLOSSARY

Electric skateboard (e-skateboard)
Skateboard with electric battery, motor, and wireless remote controller.

Self-balancing (adj.)
Qualifies a number of electrically powered micro-vehicles whose upright position
is maintained by the stabilising effect of an electric motor. Such micro-vehicles can
have one or more wheels positioned on a single axle. Motion is controlled by the
direction in which the rider leans, but can be controlled by hand in the case of
electric wheelchairs. Only a minority of self-balancing vehicles come equipped
with a central column and a handlebar.

Hoverboard (Synonym: self-balancing board)
Self-balancing micro-vehicle consisting of two motorised wheels connected to a
pair of articulated pads on which the rider places their feet. The rider controls the
speed by leaning forwards or backwards, and direction of travel by twisting the
pads.

Onewheel
Self-balancing electric personal transporter, on which the user stands and places
feet perpendicular to the direction of travel, on front and back platforms.

Electric unicycle (abbreviated: EUC)
Self-balancing electric personal transporter with a single wheel. The rider controls
the speed by leaning forwards or backwards, and steers by twisting the unit using
their feet. Some dual-wheel models exist, but the principle remains that of a single
axle device, used with feet in the direction of travel and placed either side of the
wheel(s).

Electric skates (e-skates)
Skates with electric battery and motor, controlled by the user leaning forward or
backward or using a remote controller.

Skates
Pair of boots with a set of wheels fixed to the bottom.

SAFE MICROMOBILITY © OECD/ITF 2020                                                         9
EXECUTIVE SUMMARY

                                  Executive summary

What we did

This report examines the traffic safety of pedal cycles, electrically assisted cycles and electrically powered
personal mobility devices such as e-scooters, whether owned or shared, in an urban context. In a fast-
evolving urban transport environment, micromobility is changing how people move on a daily basis. This
brings new and urgent challenges for national policymakers and city officials. The report proposes a
framework to define micromobility which includes all the above vehicles and suggests certain limits on
mass and speed to classify them. It also compares the safety of powered standing scooters (e-scooters)
to that of bicycles, mopeds and motorcycles.
The report defines micromobility as the use of vehicles with a mass of less than 350 kg and a design
speed of 45 km/h or less. This definition limits the kinetic energy of such micro-vehicles to 27 kJ, one
hundred times less than the kinetic energy reached by a compact car at top speed. The report classifies
micro-vehicles into four types based on their speed and mass: Type A micro-vehicles have a mass of up
to 35 kg and their power supply (if any) is electronically limited so the vehicle speed does not exceed
25 km/h (15.5 mph). Many bicycles, e-bikes, e-scooters and self-balancing vehicles fall into this category.
Other types of micro-vehicles have a higher mass (Type B) or speed (Type C) or both higher mass and
higher speed (Type D).
The report proposes a range of safety improvements for micromobility. These relate to vehicle design,
fleet operation, infrastructure, regulatory enforcement and training. It proposes future-proof, balanced
safety regulations proportional to the risks imposed.
The analysis draws on the results of a workshop attended by 40 participants from 15 countries in
October 2019.

What we found

A trip by car or by motorcycle in a dense urban area is much more likely to result in the death of a road
user – this includes pedestrians – than a trip by a Type A micro-vehicle. A modal shift from motor
vehicles towards Type A micro-vehicles can thus make a city safer. A shift from walking to Type A micro-
vehicles would have the opposite effect.
The very limited available data reveals similarities and differences between e-scooters and bicycles in
terms of risks. A road fatality is not significantly more likely when using a shared standing e-scooter
rather than a bicycle. The risk of an emergency department visit for an e-scooter rider is similar to that
for cyclists. Two studies, however, found the risk of hospitalisation to be higher with e-scooters, which
calls for further investigation.
Strategically, Type A micromobility could improve traffic safety by reducing the number of car and
motorcycle trips in a city. It can increase the catchment area of public transport by allowing wider access
to stations. It can also offer a convenient door-to-door transport solution. Not least, it can support
existing sustainable mobility policies by increasing demand for a safe and connected network of cycle
paths, facilitating construction – a process that may otherwise be slow and politically controversial.

10                                                                          SAFE MICROMOBILITY © OECD/ITF 2020
EXECUTIVE SUMMARY E-scooter safety, in particular, will likely improve once users learn to navigate urban traffic and car drivers become accustomed to novel forms of mobility. Safety will also improve as governments put in place safe cycling infrastructure and targeted safety regulations for micro-vehicles and shared mobility operations. Considerable regulatory challenges exist due to the rapid pace of innovation in micro-vehicle design. What we recommend Allocate protected space for micromobility and keep pedestrians safe Where pedestrians do not feel safe on sidewalks, the number of people walking will decline. The use of micro-vehicles on sidewalks should be banned or subject to a low, enforced speed limit. Authorities should create a protected and connected network for micromobility, either by calming traffic or by redistributing space to physically protected lanes for micro-vehicles. This network should be more attractive than sidewalks; design guidelines for wide and protected cycling infrastructure should be developed. For its rapid, low-cost development, light separation on busy streets and traffic filtering on residential streets are proven techniques. Speed limits for all motor vehicles should be no higher than 30 km/h where motorised vehicles and vulnerable road users share the same space. To make micromobility safe, focus on motor vehicles Motor vehicles are involved in about 80% of crashes that result in the death of bicycle or e-scooter riders. The novelty of e-scooters should not distract from focusing on known solutions to reduce the risk imposed on all vulnerable road users by motor vehicles. Authorities at all levels should intensify their efforts to address risky driver behaviour including speeding, distracted driving and driving under the influence of alcohol. They should impose safe speed limits. They should require safe motor vehicle designs that include both active and passive safety solutions. Relevant active safety features include intelligent speed assistance (available on all new cars in Europe from 2022) and autonomous emergency braking (AEB). AEB should be able to reliably identify all types of micro-vehicles. Regulate low-speed e-scooters and e-bikes as bicycles, higher-speed micro-vehicles as mopeds If regulated well, micromobility can support broader policy goals including sustainability, efficiency, inclusiveness and public health. To encourage it, relatively light bicycle regulations should apply to all forms of low-speed, low-mass (Type A) micro-vehicles. Moreover, a simple set of rules for all is more likely to be understood and adhered to, facilitating enforcement, signage and parking restrictions. Powered micro-vehicles with a maximum speed of 45 km/h should be regulated as mopeds. Derogations for high-speed pedal-assisted e-bikes should be based mainly on their potential to contribute to public health goals by increasing physical activity. Throttle-assist bicycles should not be eligible. Where faster micro-vehicles (types C and D) are allowed on cycling facilities, regulations should ensure that riders adopt lower speeds in order not to undermine the perception of safety among people of all ages and abilities cycling at a slower pace. Collect data on micro-vehicle trips and crashes Relatively little is known about the safety performance of different micro-vehicle types and models, about the role of various crash factors, and about which counter-measures would be most effective. Research on micromobility safety requires accurate crash data to be collected by the police and health services, and trip data to be collected by governments through operators, travel surveys and on-street observation. Collecting this data should be a priority for road safety agencies. SAFE MICROMOBILITY © OECD/ITF 2020 11
EXECUTIVE SUMMARY

Proactively manage the safety performance of street networks
Authorities should prioritise proactive crash prevention on the street network. Many shared micro-
vehicles are equipped with motion sensors and live positioning via GPS. These systems can yield useful
data on potholes, falls and close-calls to map the places where crashes are most likely to happen.
Authorities and operators should work together to exploit these sources of information. Governments
should also monitor damage to the road network, improving preventive maintenance to quickly repair
potholes and other damage that create risks for users of micro-vehicles.

Include micromobility in training for road users
Authorities should ensure that car, bus and truck drivers are trained to avoid crashes with micro-vehicle
riders. Relevant training should be mandatory for obtaining a driving license. Cycle training should be
part of the school curriculum so that children acquire the skills to safely navigate a micro-vehicle in
traffic. All adults should have access to affordable micromobility safety training. All training programmes
should be regularly evaluated for their effectiveness and revised accordingly.

Tackle drunk driving and speeding across all vehicle types
Governments should define and enforce limits on speed and alcohol and drug use among all traffic
participants. This includes motor vehicle drivers and micromobility users.

Eliminate incentives for micromobility riders to speed
Shared micromobility operators should review their pricing mechanisms to ensure these do not
encourage risk taking. By-the-minute rental can be an incentive to speed or to ignore traffic rules.
Companies should therefore reduce minute-based charging and compensate with alternatives. These
could include a fixed-amount trip charge, a distance-based charge or a membership fee.

Improve micro-vehicle design
Manufacturers of micro-vehicles should seek to enhance stability and road grip. Solutions could be found
in pneumatic tyres, larger wheel size and frame geometry, but also in areas yet to be explored.
Regulators should consider imposing indicator lights on powered micro-vehicles controlled by switches
on the handlebar. On shared micro-vehicles, brake cables should be protected from accidental damage
and vandalism.

Reduce wider risks associated with shared micromobility operations
Many shared micromobility services rely on vans for repositioning or recharging e-scooters or bicycles.
Operators should minimise the vehicle-kilometres driven by these support vans in order to reduce the
additional risk imposed on all road users. Using removable or higher capacity batteries and plug-in docks
offer solutions to reduce the need for collecting vehicles for recharging. Cities should allocate space for
on-street micro-vehicle parking in the proximity of delivery bays so that support vehicles can park safely.

12                                                                        SAFE MICROMOBILITY © OECD/ITF 2020
WHAT IS MICROMOBILITY?

                                 What is micromobility?

Micromobility is an ambiguous term associated with a rapidly evolving range of light vehicles that are
increasingly populating streets across the globe. “Micro-vehicles” seem to be released daily, for private
or shared use, to more easily navigate congested city streets. The breadth of their popularity was
perhaps unforeseen but is well illustrated by the expansion of shared e-bike and e-scooter companies.
The term micromobility also includes privately-owned vehicles invented over a century ago: conventional
bicycles, kick scooters and even powered standing scooters (Gibson, 1915) and powered skates
(Scientific American, 1906).
The term micromobility was popularised by Horace Dediu, an American industry analyst and investor. It
emerged around 2016 with connected bicycle, scooter and moped sharing services. According to Dediu
(2019), the term “micro” can refer to the vehicles used, which are typically less than 500 kg, but also to
the short-distance trips that can be fun, cheap and convenient. This report examines other attempts to
define and classify micromobility, and proposes a framework that might facilitate the elaboration of
safety regulations.
Micromobility appears to be here to stay. The portable electric power revolution that started with the
creation of the lithium-ion battery in 1991, made possible by the development of light-weight, powered
vehicles. Such micro-vehicles have a low environmental impact, with little noise and zero tailpipe
emissions. Their light weight suggests a smaller carbon footprint over the vehicle life cycle when
compared to other vehicle types, a question that is under investigation by the ITF (forthcoming a).
Bicycles and other human-powered micro-vehicles provide additional public health benefits by keeping
the population physically active. Smaller vehicles also consume less of the city’s most valuable resource,
space. For all these reasons, micromobility is attractive to individuals and policy makers alike.
Who uses micromobility? The majority of cyclists in car-oriented cities are young to middle-aged males.
In bicycle-friendly cities, however, cycling is inclusive with a larger share of women, children and seniors
(Garrard et al., 2012). The use of standing e-scooters in shared fleets may follow the same pattern but
may also be affected by the cost of such services. The City of Santa Monica (2019a) collected data on
shared electric scooters and bikes operated by private companies in a pilot test. It found that the early
adopters were predominantly male (67%) and aged 25-34 (64%), with higher-than-average income
distribution. Data collected in Washington D.C., however, suggests that shared micromobility delivers
new options to communities that have been traditionally underserved, and that the adoption of shared
micromobility was higher amongst black and African-American residents (Clewlow, 2018).
The safety performance of micro-vehicles and shared micromobility services is the focus of intense
media attention. Countries and cities have started to adapt their road safety regulations to include
micromobility, leading to sometimes divergent rules. In France and Germany “personal mobility devices”
were integrated into traffic regulations in 2019, requiring micro-vehicles users to ride on cycling facilities
when they exist (JORF, 2019; BMVI, 2019). In Portugal, kick-scooters and e-scooters have been subject to
the same traffic regulations as bikes and e-bikes since 2013. Conversely, in South Korea micro-vehicles
are required to follow the same regulation as cars and are not given access to bike lanes (RTA, 2006). In

SAFE MICROMOBILITY © OECD/ITF 2020                                                                       13
WHAT IS MICROMOBILITY?
the United Kingdom and Ireland, motorised micro-vehicles are simply excluded from public roads until
definitions of vehicles permitted for use on the road are updated to include them.
This report examines how micro-vehicles can best be classified and approved for on-street use. Should
they be licenced on a technology-specific basis or on a more general mass, power and speed basis?
Where should they be allowed to operate? Will infrastructure need to be adapted to allow for their safe
use? Which traffic safety requirements should national and local authorities place on shared
micromobility operators?
This report proposes regulating micromobility in a way that is adapted to the indeterminate boundaries
of the sector. Innovation in vehicle design will undoubtedly bring new device types. Will policy makers
have to revise their road safety regulations each time a new type of micro-vehicle appears on the
market? Instead, this report offers a set of rules for defining and classifying micromobility vehicles based
on safety criteria, and a framework for sharing street space and protecting road users from crash risks
coherent with overall policy for promoting more sustainable mobility.
Micromobility definition and classification
This report proposes to define micromobility as the use of micro-vehicles: vehicles with a mass of no
more than 350 kilograms (771 pounds) and a design speed no higher than 45 km/h. This definition limits
the vehicle’s kinetic energy to 27 kJ, which is one hundred times less than the kinetic energy reached by
a compact car at top speed. Speed and weight together determine the kinetic energy of a vehicle, which
correlates with the risk of fatal or serious injuries (Khorasani-Zavareh et al., 2015).
This definition includes human-powered and electrically-assisted vehicles, such as bicycles, e-bikes,
skates and kick scooters. The broad definition includes vehicles much heavier and faster than a bicycle.
Most experts do not think that bike lanes should accommodate 350 kg powered vehicles with a speed
capacity of 45 km/h. As an illustration of this debate, countries are unable to reach a consensus on
where to place speed pedelecs. The broad definition used in this report is not intended to prescribe
which vehicles are allowed onto bike lanes. Authorities should acknowledge that the micro-vehicle
spectrum is wide and heterogeneous, and consider the risks and value of different vehicles to society
when regulating them.
This report proposes to classify micro-vehicles as follows:
Micro-vehicles can be classified primarily according to their maximum speed (Figure 1). Type A
and Type B micro-vehicles include human-powered vehicles such as bicycles, as well as vehicles
whose power supply cuts off at 25 km/h. Many bicycles, e-bikes, e-scooters and self-balancing
vehicles would fall into this category. The threshold of 25 km/h is known to separate the main
categories of e-bikes in Europe. Up to 25 km/h, e-bikes are generally considered and regulated
as bicycles. When their design speed is beyond 25 km/h and up to 45 km/h, e-bikes are often
excluded from bike lanes and subject to further safety regulation (Santacreu, 2018).
Micro-vehicles can be further classified by weight, with a threshold of 35 kg, beyond which
regulators could impose more safety requirements. Vehicle weight has indeed an influence on
kinetic energy and braking systems. Weight can also be seen as a proxy for the capacity to
transport additional passengers and goods.
Micro-vehicles are polymorphic devices that do not share a common form factor. They cannot be
defined by the number of wheels, nor by the riding position, which can be seated or standing. Micro-
14 SAFE MICROMOBILITY © OECD/ITF 2020WHAT IS MICROMOBILITY?
vehicles may be powered by muscular energy, electric batteries, a fuel tank or a combination of these.
Defining micro-vehicles by a specific power source is, therefore, of little value. In the process of
regulating micro-vehicles, however, it is worth accounting for the physical activity which the vehicle
requires to operate. Unpowered and pedal-assisted vehicles have a positive impact on public health
through physical activity which throttle-powered vehicles do not, everything else being equal.
Figure 1. Proposed micromobility definition and classification
Type A Type B Type C Type D
unpowered or powered with top speed
powered up to 25 km/h between 25-45 km/h
(16 mph) (16-28 mph)WHAT IS MICROMOBILITY?
Micromobility in Europe
European Union regulation N°168/2013 established the L-category vehicles as a reference for member
countries. L-category vehicles are powered two-, three- and four-wheel vehicles. The category uses
power, power source, speed, length, width and height as classification criteria.
Some types of micro-vehicles can be mapped to the L1e category called “light two-wheel powered
vehicle”:
L1e-A powered cycle: electric bicycle equipped with auxiliary propulsion with a maximum speed
of 25 km/h and a net power between 250 watts and 1 000 watts. This category includes low-
powered throttle only electric bikes.
L1e-B two-wheel moped: any two-wheel vehicle with a maximum design speed of more than
25 km/h and up to 45 km/h and a net power of up to 4 000 watts. It includes speed-pedelecs,
though most speed-pedelecs have a power of 500-750 watts.
Other micro-vehicles are left outside the L1e category, most notably:
human-powered vehicles, such as bicycles, skates and kick scooters
pedelecs, defined as bicycles with pedal assistance up to 25 km/h and with an auxiliary electric
motor having a maximum continuous rated power of up to 250 watts.
self-balancing vehicles and vehicles not equipped with a seat (ie. standing scooters).
The United Nations Economic and Social Council published the Consolidated Resolution on the
Construction of Vehicles, which included a vehicle classification system and safety standards that are now
used as international references. The World Forum for Harmonization of Vehicle Regulations allows open
discussions among policy makers. This leads to the construction of a shared reference across countries,
even if it still excludes the large part of micro-vehicles cited above (UNECE, 2017).
Micromobility in the United States
In the United States, vehicles such as e-bikes and e-scooters are predominantly regulated at state level.
State-by-state legislation is being passed which distinguishes e-scooters and e-bikes from mopeds and
other motor vehicles, thus enabling the use of bike lanes, and avoiding requirements for licencing and
registration (NCSL, 2019).
For the use of e-scooters, some states impose a minimum age of 8, 12, 16 or 18, some only require the
use of helmets, and others have set both a minimum age and a helmet requirement. State-specific speed
limits for e-scooters range from 20 km/h (12.5 mph) to 32 km/h (20 mph) (Sikka et al., 2019).
For the use of e-bikes, state regulations typically impose that an e-bike falls within one of the following
three classes:
Class 1 electric bicycle: a bicycle equipped with a motor that provides assistance only when the
rider is pedalling, and that ceases to provide assistance when the bicycle reaches the speed of
20 mph (32 km/h).
Class 2 electric bicycle: a bicycle equipped with a motor that may be used exclusively to propel
the bicycle, and that is not capable of providing assistance when the bicycle reaches the speed of
20 mph (32 km/h).
16 SAFE MICROMOBILITY © OECD/ITF 2020WHAT IS MICROMOBILITY?
Class 3 electric bicycle: a bicycle equipped with a motor that provides assistance only when the
rider is pedalling, and that ceases to provide assistance when the bicycle reaches the speed of
28 mph (45 km/h) and is equipped with a speedometer.
Micromobility in Asia
In People’s Republic of China, electric bicycles are classified as bicycles. The latest regulation stipulates
that electric bicycles must have working pedals, with a maximum design speed not exceeding 25 km/h,
weight (including battery) up to 55 kg, motor power up to 400 W, and battery voltage up to 48 V (Large,
2019).
Singapore created a new category of vehicle called the “personal mobility device” (PMD). E-scooters fall
within this category. It differentiates PMD from cars, but also from bicycles and e-bikes (SLA, 2019).
In Korea, all power-driven vehicles are considered as motor vehicles (KMVSS, 2019). However, there is no
specific classification to categorise the different vehicle types. Authorities are currently using the UNECE
regulation and safety requirements as a reference (UNECE, 2019).
Micromobility in Latin America
Latin American countries classify micro-vehicles according to the speed they can develop through
assistance or propulsion engines, according to experts.
In Mexico City, the traffic regulations clearly define that any vehicle capable of autonomously developing
a maximum of 30 km/h is a non-motorised vehicle. Any vehicle that exceeds 30 km/h is a motorised
vehicle that needs a licence plate, registration and must follow the common rules applicable to cars.
In Colombia, a vehicle type exists for pedal-assisted e-bikes with a motor power of up to 300 W, a weight
of up to 35 kg and with a maximum design speed not exceeding 25 km/h (MDT, 2017). PMDs were
defined as a new vehicle category, just as they were in Singapore. They are defined as electrical
motorised individual vehicles with one or more wheels, a minimum design speed of 6 km/h and
maximum design speed of 25 km/h (DGT, 2019). According to this definition, PMDs include e-scooters,
e-bikes, e-skateboards, one-wheels and more micro-vehicle forms, insofar as they respect the limit
applied to the design speed.
Other efforts to classify micromobility
SAE International is a U.S.-based, globally active professional association and standards developing
organisation for engineering professionals in various industries. Their taxonomy can be used by
authorities at the local and national level to develop policy that is compatible with their policy objectives
and with the infrastructure available.
SAE International published the J3194™ Standard defining powered micromobility as a category of
powered vehicles that can be classified according to four main criteria (SAE, 2019):
vehicle weight of up to 227 kg (500 lb)
vehicle width of up to 1.5 m (5 ft)
top speed of up to 48 km/h (30 mph)
power source by an electric motor or a combustion engine.
SAFE MICROMOBILITY © OECD/ITF 2020 17WHAT IS MICROMOBILITY?
The (trademarked) J3194 standard distinguished six types of powered micro-vehicles: powered bicycle,
powered standing scooter, powered seated scooter, powered self-balancing board, powered non-self-
balancing board, and powered skates. It only includes vehicles that are primarily designed to transport
people and to be used on paved roadways and paths.
Figure 2. Types of powered micromobility vehicles as defined by SAE
Source: SAE (2019).
It excludes solely human-powered vehicles like traditional bikes. However, it distinguishes between three
classes of e-bikes:
Class 1: pedal assist (or “class 1 e-bikes”, “pedelecs”, “low-speed, pedal-assisted e-bike”)
Class 2: throttle on demand (or “class 2 e-bikes”, “low-speed, throttle-assisted e-bike”)
Class 3: speed pedelec (or “class 3 e-bike”, “speed pedelec” and “speed pedal-assisted e-bike”).
18 SAFE MICROMOBILITY © OECD/ITF 2020WHAT IS MICROMOBILITY?
Figure 3. NUMO’s framework for mapping vehicle characteristics with policy requirements
Source: adapted from NUMO (2020).
An alternative vehicle classification focuses on the vehicle’s top speed, weight, emissions, spatial
footprint and health footprint (a function of the physical activity input) normalised by the vehicle’s
passenger capacity. This approach is being formalised by the New Urban Mobility Alliance (NUMO): a
global alliance organisation consisting of partners including cities, NGOs and companies from diverse
sectors. This approach helps policy makers link these “vehicle profiles” with specific requirements and
regulations (e.g. space allocation, data, pricing, licencing). It proposes to use radar charts (Figure 3) to
represent vehicle characteristics: the farther from the centre, the more requirements needed.
SAFE MICROMOBILITY © OECD/ITF 2020 19HOW SAFE ARE MICROMOBILITY TRIPS?
How safe are micromobility trips?
A trip by car or by motorcycle in a dense urban area is more likely to result in a traffic fatality than a trip
by micro-vehicle of Type A. This section provides evidence of that and seeks to measure the mode shift
achieved by new micromobility solutions.
A trip by shared standing e-scooter is no more likely than a bicycle trip to result in a road traffic death.
The risk of hospital admission may be higher on e-scooters, but there have been too few studies to draw
firm conclusions. This section provides information on casualties and trips, and compares the safety of
e-scooters with that of other modes.
Lessons from fatality data
The detailed and comprehensive reporting of fatal crashes delivers precious insights. The ITF typically
uses traffic death figures to compare cycling safety across various countries (Santacreu, 2018) and cities
(ITF, 2019a). Police crash datasets identify bicycle casualties but do not identify standing e-scooter
casualties as yet, at least in most countries. This report draws information from 38 media reports of
standing e-scooter fatalities, up until end-October 2019 (Annex A). This section examines the risk
imposed on pedestrians, the risk imposed by motor vehicles, and the risk experienced by riders of
standing e-scooters.
Pedestrian fatalities are rare
Pedestrians represent less than one in ten fatalities in crashes involving standing e-scooters. Research for
this report found that only two such fatalities occurred in the world through October 2019. Both crashes
involved privately owned e-scooters, according to one expert, neither of which was equipped with a
speed limiter. Similarly, in crashes involving bicycles, pedestrians represent no more than one in ten
fatalities. Overall, riders themselves represent over 90% of fatalities in crashes involving Type A micro-
vehicles (a category which includes bicycles and low-speed standing e-scooters).
Figure 4. Fatalities in collisions involving a given user group
Fatalities within user group Fatalities in other user groups
Standing e-scooter
Pedal cycle
Motorcycle or moped
Passenger car
0% 20% 40% 60% 80% 100%
Sources: Standing e-scooter data from media reports compiled by the ITF (Annex A), crash matrices collected
from the ITF Safer City Streets network in Bogota, Inner London, Paris, Rome and Milan for various time periods
(Annex B).
20 SAFE MICROMOBILITY © OECD/ITF 2020HOW SAFE ARE MICROMOBILITY TRIPS?
In comparison, car occupants represent less than 40% of fatalities in crashes involving passenger cars
(Figure 4). The majority of victims killed in crashes involving a car are found in other, more vulnerable
user groups. This finding reflects the impact of the relatively higher mass, speed and driver protection
found on passenger cars. Public debate around sidewalk protection and micromobility rider
accountability is legitimate but should not distract policy makers from the main sources of danger in the
urban environment.
Most fatal crashes involve a heavier vehicle
Over 80% of cyclist and e-scooter rider deaths result from crashes with heavier vehicles (Figure 5). In
comparison, car occupants are more likely to be killed in crashes where no other motor vehicle is
involved. This once again reflects the higher speed of these vehicles, even in urban areas where this data
was collected.
Figure 5. Vehicle occupant fatalities by third party involvement
Fatalities in crashes involving motor vehicles Fatalities in crashes involving no motor vehicle
Standing e-scooter
Pedal cycle
Motorcycle or moped
Passenger car
0% 20% 40% 60% 80% 100%
Sources: Standing e-scooter data from media reports compiled by the ITF (Annex A), crash matrices collected
from the ITF Safer City Streets network in Bogota, Inner London, Paris, Rome and Milan for various time periods
(Annex B).
Several caveats should be borne in mind when interpreting these figures:
not all fatalities are reported in the media, especially as the novelty aspect of e-scooters fades
some media reports lack clarity with regards to the exact e-scooter type (with/without seat,
shared/private)
three media reports lack clarity on the role of third parties in the crash, in which case the ITF
assumed a motor vehicle was involved.
Fatality risk: Similar results for cycle and e-scooter trips
The risk of being killed on a shared standing e-scooter trip is no different from that of being killed on an
average bicycle trip, and substantially lower than on an average motorcycle trip. In high- and middle-
income countries, one bicycle rider is killed in every 10 million bicycle trips on average. This figure
provides the reader with an order of magnitude but hides dramatic differences between countries and
SAFE MICROMOBILITY © OECD/ITF 2020 21HOW SAFE ARE MICROMOBILITY TRIPS? cities. Shared e-scooters belong to Type A in the micro-vehicle classification proposed here. This report could not find data to assess the safety of e-scooters reaching higher speeds (Type C). Three people were killed in the United States on shared standing e-scooters in 2018, according to media reports, for an estimated 38.5 million trips (NACTO, 2019a). Worldwide, one of the most popular e-scooter companies, Lime, reported its first 100 million rides on 16 September 2019. Of these, industry experts assume that over 90 million are e-scooter rides, the rest being bike-share rides. Over the same period of time, the media reported nine fatalities among Lime e-scooter riders (Annex A). The risk for Lime riders is therefore estimated at fewer than 100 fatalities per billion trips. Another e-scooter company, Bird, reported their first 50 million rides in August 2019 (Scoot, 2019), at a time when five of their riders had died in crashes according to media reports, a number confirmed by the company. Available figures for shared e-scooter risk range between 78 and 100 fatalities per billion trips. This range should be considered an order of magnitude. Its precision is limited by the number of fatalities which, in terms of statistical robustness, should be considered as small. Cycling risk across cities ranges between 21 and 257 fatalities per billion trips. Figures come from the ITF Safer City Streets network and database (Box 1) and are consistent with other research (Bassil et al., 2015). Motorcycles and mopeds together are called powered two-wheelers (PTW). Riding a PTW in cities comes with a risk of fatality ranging between 132 and 1 164 per billion trips. The risk of being killed in a PTW trip is at least two times higher than in a cycle trip, according to the information the ITF collected for both modes in eight different cities. The comparison between e-scooters, bicycles and other modes is delicate, due to the absence of data in a comparable global sample of cities. Indeed, previous ITF research revealed great differences in risk across countries and cities. Cycling risk in the United States was found to be six times higher than in Northern European countries (Santacreu, 2018). City-level data collected through the ITF Safer City Streets network (Box 1) showed that the same difference in cycling risk (a factor of six) is observed between Berlin (with 21 fatalities per billion trips) and New York City (128 fatalities per billion trips). The risk analysis per unit distance travelled, as opposed to the analysis per ride, would be marginally less favourable to e-scooter riders, due to a lower average trip distance. E-scooter sharing companies provide a wide range of estimates for average trip distances. This can reflect specific local circumstances but can also raise doubts on the reliability of trip distance data. Distances could be very sensitive to GPS sampling rates and signal noise, and be severely under-estimated if derived from start and end points alone. Limited studies have not yet managed to assess the risks of riding an e-bike. Riding a Class 1 e-bike, known as a pedelec and limited to 25 km/h, does not appear to be more dangerous than riding a bicycle, once trip distances and age are controlled for (Schepers, Klein Wolt and Fishman, 2018). More studies should investigate the risk of fatality on e-bikes. Research protocols should control for the number of older riders and for the trip distances, often higher with e-bike riders. 22 SAFE MICROMOBILITY © OECD/ITF 2020
HOW SAFE ARE MICROMOBILITY TRIPS?
Box 1. The ITF Safer City Streets network
The ITF Safer City Streets initiative is a platform for road safety experts working at city level to share their
experience and develop a global traffic safety database. It is funded by the FIA and shaped on the
national-level permanent working group of the ITF called the International Road Traffic Safety Analysis
and Data group (IRTAD).
Over 40 cities have joined the ITF Safer City Streets network, and its database includes over 70 urban
areas. In Figure 6, the bubble size represents the population of urban areas found in the database. Some
are defined by an administrative boundary, and others are defined by commuting flows. The latter are
called functional urban areas (FUAs): they tend to occupy a larger land area and have lower population
density. The plot reveals the diversity of situations:
land area varies from 80 km2 (The Hague) to over 9 000 km2 (Vienna FUA)
population varies from 400 000 (Zürich) to over 12 million (London FUA)
population density varies from 130 people per km2 (Graz FUA) to over 21 000 per km2 (Paris
City).
Figure 6. Population density and land areas of cities from the ITF Safer City Streets database
Paris City Bubble size = population
25 600
New York City
Population density per km²
The Hague Greater London
6 400
Lisbon
Zürich
London FUA
Portsmouth FUA Riga
1 600
Melbourne
400
Vienna FUA
Graz FUA
100
50 200 800 3 200 12 800
Land area in km²
The network enabled the ITF to collect data on casualties and trips for each mode of transport, and
calculate the risk of being killed per trip for each mode, making the comparison possible between
e-scooter, bicycle and motorcycle fatality numbers.
Members of the network provided responses to the ITF survey on micromobility safety research
priorities (Annex C) and participated in the CPB workshop that informed this report.
Source: ITF (2019a).
SAFE MICROMOBILITY © OECD/ITF 2020 23You can also read