Overview: Integrative and Comprehensive Understanding on Polar Environments (iCUPE) - concept and initial results - AWI
←
→
Page content transcription
If your browser does not render page correctly, please read the page content below
Atmos. Chem. Phys., 20, 8551–8592, 2020
https://doi.org/10.5194/acp-20-8551-2020
© Author(s) 2020. This work is distributed under
the Creative Commons Attribution 4.0 License.

Overview: Integrative and Comprehensive Understanding on Polar
Environments (iCUPE) – concept and initial results
Tuukka Petäjä1 , Ella-Maria Duplissy1 , Ksenia Tabakova1 , Julia Schmale2,3 , Barbara Altstädter4 , Gerard Ancellet5 ,
Mikhail Arshinov6 , Yurii Balin6 , Urs Baltensperger2 , Jens Bange7 , Alison Beamish8 , Boris Belan6 , Antoine Berchet9 ,
Rossana Bossi10 , Warren R. L. Cairns11 , Ralf Ebinghaus12 , Imad El Haddad2 , Beatriz Ferreira-Araujo13 ,
Anna Franck1 , Lin Huang14 , Antti Hyvärinen15 , Angelika Humbert16,17 , Athina-Cerise Kalogridis18 ,
Pavel Konstantinov19,30 , Astrid Lampert4 , Matthew MacLeod20 , Olivier Magand21 , Alexander Mahura1 ,
Louis Marelle5,21 , Vladimir Masloboev22 , Dmitri Moisseev1 , Vaios Moschos2 , Niklas Neckel16 , Tatsuo Onishi5 ,
Stefan Osterwalder21 , Aino Ovaska1 , Pauli Paasonen1 , Mikhail Panchenko6 , Fidel Pankratov22 , Jakob B. Pernov10 ,
Andreas Platis7 , Olga Popovicheva23 , Jean-Christophe Raut5 , Aurélie Riandet9,a , Torsten Sachs8 ,
Rosamaria Salvatori24 , Roberto Salzano25 , Ludwig Schröder16 , Martin Schön7 , Vladimir Shevchenko26 ,
Henrik Skov10 , Jeroen E. Sonke13 , Andrea Spolaor11 , Vasileios K. Stathopoulos18 , Mikko Strahlendorff15 ,
Jennie L. Thomas21 , Vito Vitale11 , Sterios Vratolis18 , Carlo Barbante11,27 , Sabine Chabrillat8 , Aurélien Dommergue21 ,
Konstantinos Eleftheriadis18 , Jyri Heilimo15 , Kathy S. Law5 , Andreas Massling10 , Steffen M. Noe28 ,
Jean-Daniel Paris9 , André S. H. Prévôt2 , Ilona Riipinen20 , Birgit Wehner29 , Zhiyong Xie12 , and
Hanna K. Lappalainen1,15
1 Institute for Atmospheric and Earth System Research/Physics, Faculty of Science,
P.O. Box 64, 00014 University of Helsinki, Finland
2 Laboratory of Atmospheric Chemistry, Paul Scherrer Institute, Villigen PSI, Switzerland
3 School of Architecture, Civil and Environmental Engineering, École Polytechnique Fédérale de Lausanne, Switzerland
4 Institute of Flight Guidance, Technische Universität Braunschweig, Germany
5 LATMOS/IPSL, Sorbonne Université, UVSQ, CNRS, Paris, France
6 V.E. Zuev Institute of Atmospheric Optics of Siberian Branch of the Russian

Academy of Science (IAO SB RAS), Tomsk, Russia
7 Center for Applied Geoscience, Eberhard Karls University, Tübingen, Germany
8 GFZ German Research Centre for Geosciences, Telegrafenberg, Potsdam, Germany
9 Laboratoire des Sciences du Climat et de l’Environnement, CEA-CNRS-UVSQ, IPSL, Gif-sur-Yvette, France
10 Department of Environmental Science, iClimate, Aarhus University, Frederiksborgvej 399, 4000 Roskilde, Denmark
11 Institute of Polar Sciences, National Research Council of Italy (CNR), Via Torino 155, 30172 Venezia-Mestre (VE), Italy
12 Helmholtz-Zentrum Geesthacht (HZG), Centre for Materials and Coastal Research, Geesthacht, Germany
13 Geosciences Environnement Toulouse, CNRS/IRD/Universite Paul Sabatier, Toulouse, France
14 Climate Research Division, ASTD/STB, Environment & Climate Change Canada (ECCC), Toronto, Canada
15 Arctic Space Centre, Finnish Meteorological Institute (FMI), Helsinki, Finland
16 Section Glaciology, Alfred Wegener Institute Helmholtz Centre for Polar and Marine Research (AWI),

Bremerhaven, Germany
17 Department for Geoscience, University of Bremen, Bremen, Germany
18 Environmental Radioactivity Laboratory, Institute of Nuclear and Radiological Science & Technology,

Energy & Safety, NCSR Demokritos, Athens, Greece
19 Faculty of Geography, Moscow State University, Moscow, Russia
20 Department of Environmental Science and Analytical Chemistry, Stockholm University, Stockholm, Sweden
21 University Grenoble Alpes, CNRS, IRD, Grenoble INP, IGE, 38000 Grenoble, France
22 Institute of Northern Environmental Problems (INEP), Kola Science Center (KSC),

Russian Academy of Sciences (RAS), Apatity, Murmansk region, Russia
23 Skobeltsyn Institute of Nuclear Physics, Lomonosov Moscow State University, Moscow 119991, Russia

Published by Copernicus Publications on behalf of the European Geosciences Union.
8552                               T. Petäjä et al.: Integrative and Comprehensive Understanding on Polar Environments

24 Institute of Polar Sciences, National Research Council of Italy (CNR), Monterotondo (RM), Italy
25 Institute of Atmospheric Pollution Research, National Research Council of Italy (CNR), Sesto Fiorentino (FI), Italy
26 Shirshov Institute of Oceanology, Russian Academy of Sciences, Moscow, Russia
27 Department of Environmental Sciences, Ca’ Foscari University of Venice, Informatics and Statistics,

Via Torino 155, 30172 Mestre, Venice, Italy
28 Institute of Agricultural and Environmental Sciences, Estonian University of Life Sciences, Tartu, Estonia
29 Department of Experimental Aerosol and Cloud Microphysics, Leibniz Institute for Tropospheric Research,

Leipzig, Germany
30 Peoples’ Friendship University of Russia (RUDN), Laboratory of smart technologies for sustainable development of urban

environment under global changes, Moscow, Russian Federation
a currently at: Institut Méditerranéen de Biodiversité et d’Ecologie marine et continentale (IMBE),

Aix-Marseille Université-Avignon Université-CNRS-IRD, Marseille, France

Correspondence: Tuukka Petäjä (tuukka.petaja@helsinki.fi)

Received: 31 December 2019 – Discussion started: 3 March 2020
Revised: 20 May 2020 – Accepted: 8 June 2020 – Published: 22 July 2020

Abstract. The role of polar regions is increasing in terms of     use of natural resources. These megatrends will rapidly and
megatrends such as globalization, new transport routes, de-       drastically affect the environment. In particular, the Arctic
mography, and the use of natural resources with consequent        will face such grand challenges as soil and water pollution,
effects on regional and transported pollutant concentrations.     climate change, land use change, higher demand for resource
We set up the ERA-PLANET Strand 4 project “iCUPE – in-            extraction, increased anthropogenic emissions due to year-
tegrative and Comprehensive Understanding on Polar Envi-          round shipping in the Arctic Ocean and other local sources,
ronments” to provide novel insights and observational data        and long-range-transported pollution from Europe, Asia, and
on global grand challenges with an Arctic focus. We utilize       North America (e.g., Buixadé Farré et al., 2014). Overall,
an integrated approach combining in situ observations, satel-     land and ocean areas located in the polar latitudes are cur-
lite remote sensing Earth observations (EOs), and multi-scale     rently undergoing and will undergo substantial changes due
modeling to synthesize data from comprehensive long-term          to increased anthropogenic activities and shipping during the
measurements, intensive campaigns, and satellites to deliver      next decades. These activities will put the fragile Arctic envi-
data products, metrics, and indicators to stakeholders con-       ronment and the population living in this area in a vulnerable
cerning the environmental status, availability, and extraction    position. The changes will pose unpredictable consequences
of natural resources in the polar areas. The iCUPE work con-      for food chains, biodiversity, and the primary production of
sists of thematic state-of-the-art research and the provision     different plant ecosystems and ecosystem capacity to recover
of novel data in atmospheric pollution, local sources and         from pollution exposure and environmental changes (e.g.,
transboundary transport, the characterization of arctic sur-      Arnold et al., 2016).
faces and their changes, an assessment of the concentrations         The future warming of the Arctic will affect demographic
and impacts of heavy metals and persistent organic pollutants     trends by increasing urbanization and migration to northern
and their cycling, the quantification of emissions from natu-     regions and by accelerating changes in societal issues and
ral resource extraction, and the validation and optimization      air quality (Schmale et al., 2018). One major consequence of
of satellite Earth observation (EO) data streams. In this pa-     warming in the northern latitudes is related to changes in the
per we introduce the iCUPE project and summarize initial          cryosphere, including ice sheet mass loss (Helm et al., 2014),
results arising out of the integration of comprehensive in situ   the thawing of permafrost, and the Arctic Ocean becoming
observations, satellite remote sensing, and multi-scale mod-      sea-ice-free part of the year (Kokelj et al., 2017; Meier et al.,
eling in the Arctic context.                                      2014; Kulmala et al., 2015; Lappalainen et al., 2016; Boy
                                                                  et al., 2019). Even with limiting global warming to 1.5 or
                                                                  2 ◦ C, temperatures over the high Arctic, in particular north
                                                                  Greenland, will rise by 3–4 ◦ C by 2100 due to polar ampli-
1   Introduction                                                  fication, enhancing impacts like mass loss of the ice sheet
                                                                  (Rückamp et al., 2018). This will accelerate global trade ac-
The project “iCUPE – integrative and Comprehensive Un-
                                                                  tivities in the Arctic region; then the northern sea route will
derstanding on Polar Environments” is motivated by the in-
                                                                  likely be seasonally opened for shipping between the Atlantic
creasing role of Arctic regions in terms of megatrends such
                                                                  and Asia’s Far East. Northern ecosystems and Arctic regions
as globalization, new transport routes, demography, and the

Atmos. Chem. Phys., 20, 8551–8592, 2020                                             https://doi.org/10.5194/acp-20-8551-2020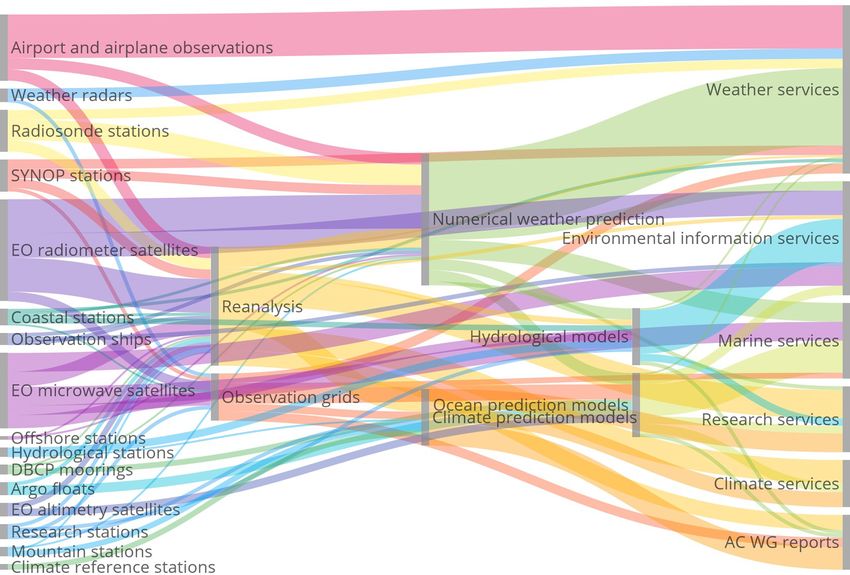
T. Petäjä et al.: Integrative and Comprehensive Understanding on Polar Environments                                              8553

are a source of major natural resources such as oil, natural          minimal amount of anthropogenic influence and can provide
gas, and minerals. The availability and exploitation of natural       clean reference observations.
resources also depends on how significantly the permafrost               The existing observational networks with comprehensive
thaw will damage existing infrastructure.                             in situ observational capacity for measurements of the at-
   Human activities have had a profound impact on the com-            mospheric concentrations of air pollutants extend to Arctic
position of the atmosphere and pollution in the environment           and Antarctic environments (e.g., Uttal et al., 2016). How-
through the introduction of increasing quantities of heavy            ever, there are still large gaps in the current measurement net-
metals and other trace elements (Barbante et al., 2001), ra-          works (Lappalainen et al., 2016), and the interaction between
dioactive nuclides (Ežerinkis et al., 2014), synthesized or-          the networks, made up of different national activities, needs
ganic compounds (Hermanson et al., 2010), aerosols such as            to be improved. Polar activities are often based on national
black carbon (McConnell and Edwards, 2008), trace gases,              activities and missing synergistic benefits of cooperation in
and greenhouse gases. Anthropogenic contaminants can be               challenging environments. In summary, the methodology of
transported over long distances and accumulate in polar ar-           data acquisition, data quality control, and future strategies on
eas. Persistent organic pollutants (POPs), such as polybromi-         data flows and data streams are not harmonized on either the
nated diphenyl ethers (PBDEs), polycyclic aromatic hydro-             European or global scale. Furthermore, particularly in the po-
carbons (PAHs), polychlorinated biphenyl (PCB), and per-              lar areas, measurements are not always continuous but often
sistent contaminants of emerging concern (CECs) (Sauvé                carried out campaign-wise due to economic, environmental,
and Desrosiers, 2014), are rarely produced in the Arctic but          or logistical challenges.
have been found in Arctic wildlife, lake sediments, annual               Satellite remote sensing in the Arctic is based on active
snow, and ice (Herbert et al., 2005; Ma et al., 2011; Seki            and passive missions of varying spatial resolution, repeat
et al., 2015). Mercury and other heavy metals, such as As,            visit times, and coverage of high latitudes. Monitoring the
Cd, and Pb, are considered toxic at any level. Their presence         surface properties and their variations in the Arctic region is a
is generally determined by local geochemistry, but they can           powerful tool to assess the impacts of changes induced in this
be emitted by human activities, resulting in their increased          vulnerable environment. The distribution of different types of
abundance in polar areas (Barbante et al., 2001; Zheng et al.,        land cover (snow, ice, vegetation, soil) can be efficiently ana-
2015; Angot et al., 2016). Black carbon (BC), a fine compo-           lyzed using optical data obtained from the new satellite mis-
nent of almost pure carbon from incomplete combustion, is             sions merged with data collected during field campaigns and
able to modify the snow albedo by absorbing incoming solar            data acquired from cooperative observer networks. In par-
radiation (Bond et al., 2013; Jiao et al., 2014). Human ac-           ticular, different patterns of snow cover (as well as soil and
tivities are impacting the net abundance of these pollutants          vegetation cover) exercise considerable influence on the sur-
in the atmosphere, but there is a lack of data exploring the          face energy balance, since variations in land cover change the
deposition patterns and the abundance of anthropogenic con-           surface albedo. While there are established methods for re-
taminants in polar areas. We also need an improved under-             trieving basic variables, changing snow and ice surfaces and
standing of their redistribution into different environmental         ice-free areas are still challenging, and the large variability
spheres, including the biota of the Arctic and Antarctic, and         of the system itself is limiting the accuracy of such retrievals
the full life cycle of these pollutants (Wöhrnschimmel et al.,        (Bokhorst et al., 2016). New Sentinel series of Copernicus
2013).                                                                sensors in orbit make it possible to retrieve improved land
   Local emissions currently make only a small contribution           surface variables due to increased capacities in terms of spa-
to the atmospheric loadings of various pollutants in polar ar-        tial, temporal, spectral, and angular observations. As a con-
eas, but this might change in the near future as Arctic ice-free      sequence, new Earth observation (EO) techniques will lead
areas will extend and more extensive Arctic shipping will be-         to the multi-mission time series needed for data assimilation
come possible (Corbett et al., 2010; Yumashev et al., 2018).          into models of Earth system compartments in the Arctic.
Nevertheless, air pollutants from other areas in the world do            In summary, in order to address the current state of
reach high-Arctic regions and have been estimated to have             the environment in polar areas and to provide fact-based
significant impacts on the regional ecosystem and climate (Di         decision-making tools for society in the future, comprehen-
Pierro et al., 2011; Breider et al., 2014). Knowledge of the          sive high-quality observations of atmospheric concentrations
source contribution of atmospheric pollution is very limited,         of aerosols, trace gases, and related environmental variables
and further efforts in terms of detailed source identification        from in situ observations are required in concert with EO
are urgently needed to formulate and settle mitigation strate-        from space (Petäjä et al., 2014; Hari et al., 2016). The EO
gies (e.g., Law et al., 2014). Measurements of short-lived cli-       data can be used to study the interactions between different
mate forcers (SLCFs) and their precursors are necessary for           types of surfaces and the atmosphere. The results obtained al-
evaluating the impacts of increased regional and international        low us to evaluate the impact of pollutants on the equilibrium
activities, e.g., in relation to natural resource extraction, espe-   of the Arctic system and provide an important input for evo-
cially in fragile Arctic environments. Correspondingly, simi-         lutionary scenarios of the Arctic environment. The picture
lar activities need to be carried out in Antarctica, which has a      needs to be harmonized and supported with complementary

https://doi.org/10.5194/acp-20-8551-2020                                               Atmos. Chem. Phys., 20, 8551–8592, 2020
8554                                T. Petäjä et al.: Integrative and Comprehensive Understanding on Polar Environments

multi-scale modeling (e.g., Kulmala et al., 2011a; Kulmala,
2018). The need to establish and maintain long-term, coher-
ent, and coordinated observations and research activities on
environmental quality and natural resources in polar areas
drives iCUPE activities. The core idea of iCUPE is the de-
velopment of novel, integrated, quality-controlled, and har-
monized in situ observations and satellite data in polar areas,
as well as the supply of data products to end users. The im-
pact of this integrated Arctic observing system needs to be
demonstrated for changing campaign practices to continu-
ous monitoring activities. The Sustaining Arctic Observing
Networks (SAON) initiative under the auspices of the Arctic
Council has been developing an assessment framework for
this since 2017 (IDA Science and Technology Policy Insti-           Figure 1. Atmospheric concentrations of pollutants and their life
tute and Sustaining Arctic Observing Networks, 2017), and           cycles in high latitudes are affected by local and regional anthro-
iCUPE has been helping to make the first full value tree anal-      pogenic activities and long-range transport from lower latitudes.
ysis for this. It connects observing activities in situ and from    Pollutant distributions and life cycles are modulated by transport
satellites through modeling and services to key objectives of       patterns, changes in the biosphere, increased natural resource ex-
societal benefit areas. This will greatly help in forming im-       traction, and increased shipping in the Arctic Sea. Various feed-
pact assessments in the future.                                     backs and interactions can either speed up or hinder the changes.
   The iCUPE project aims to synthesize data from compre-
hensive long-term measurements, intensive campaigns, and
satellites collected during the project or provided by ongo-        Multidisciplinary drifting Observatory for the Study of Arc-
ing international initiatives. The aim of this paper is to intro-   tic Climate (MOSAiC; Shupe et al., 2018) expedition con-
duce an ongoing project, iCUPE, and summarize its initial           ducted in polar areas through collaboration. These connec-
results. We put a specific emphasis on black carbon and per-        tions enable the iCUPE consortium partners to facilitate in-
sistent pollutants in the Arctic context. We explore snow and       teractions and strengthen coordination between national and
ice core samples to put the current concentrations in a longer      international activities in polar areas. A wide spectrum of ob-
perspective. We underline the capacity of continuous obser-         servational quantities, data products, and modeled variables
vations to monitor the impact of policies to reduce emissions.      is required to enable the delivery of the integrated data re-
We showcase the potential to address pollution in the Arctic        quired for decisions related to Arctic pollution.
environment by integrating satellite remote sensing, airborne
observations, in situ data, and modeling. Modern comprehen-
                                                                    3     iCUPE initial results
sive source apportionment can resolve the different sources
of atmospheric aerosols and differentiate between sources           In this section we summarize the results and findings of the
within and outside the Arctic environment. We also discuss          iCUPE project regarding the in situ observations (Sect. 3.1–
the iCUPE impact and relevance for Arctic research and for          3.6) and the satellite component (Sect. 3.7). We selected in-
stakeholder communities.                                            tegrating examples in Sect. 3.8, which also include method
                                                                    development and conceptualization. This is consistent with
                                                                    the iCUPE concept as a whole (multi-platform observations,
2   The concept                                                     modeling, synthesis; Fig. 2).

The motivation behind iCUPE stems from the need to ad-              3.1    Atmospheric observation capacity in the Arctic
dress global environmental challenges in a polar context
(Fig. 1). The underpinning concept of iCUPE is that transdis-       Figure 3 depicts year-round monitoring aerosol measure-
ciplinary research utilizing the full capacity of comprehen-        ments in the Arctic. Within the International Arctic Systems
sive in situ observations together with state-of-the-art satel-     for Observing the Atmosphere (IASOA; Uttal et al., 2016),
lite observations is required to make advances in the un-           there are 14 stations around the Arctic with a clear preva-
derstanding of atmospheric and cryospheric processes in the         lence of the west longitudes. In addition to the IASOA sites,
Arctic environment (Fig. 2). Therefore, the work in iCUPE           the Stations for Measuring Ecosystem–Atmosphere Rela-
utilizes both expertise with in situ observations and satel-        tions (SMEAR; Hari et al., 2016) observation network ex-
lite remote sensing in a close connection to modeling frame-        tends to the Arctic; the SMEAR I in Värriö, Finnish Lapland,
works to address this need (Fig. 3). The work is closely con-       has provided aerosol and trace gas observations since 1992
nected to ongoing activities such as the Integrated Arctic Ob-      (Hari et al., 1994). Many of these observation sites contribute
servation System (INTAROS; Sandven et al., 2018) and the            to the World Meteorological Organization’s Global Atmo-

Atmos. Chem. Phys., 20, 8551–8592, 2020                                               https://doi.org/10.5194/acp-20-8551-2020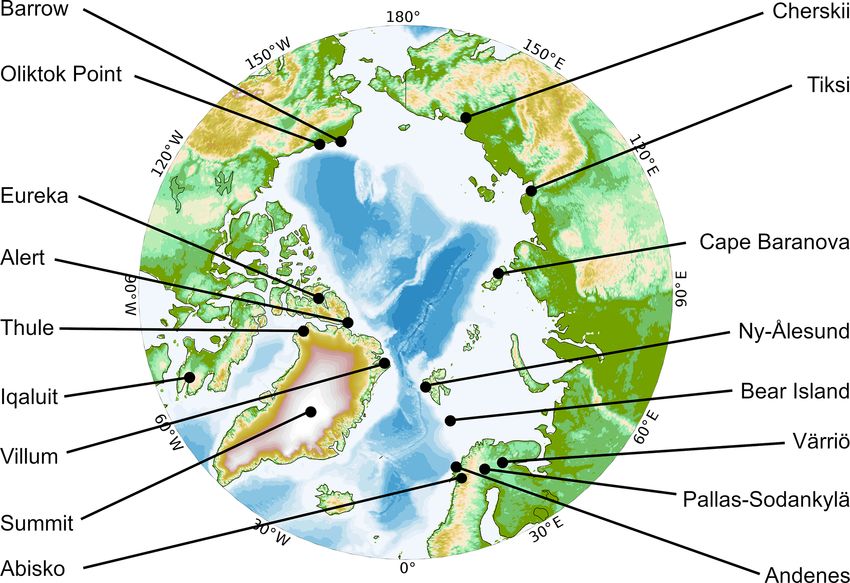
T. Petäjä et al.: Integrative and Comprehensive Understanding on Polar Environments                                               8555

Figure 2. The integrative concept of iCUPE incorporates data and knowledge from ground-based observations, satellite remote sensing, and
modeling results, providing a comprehensive view on the state of the environment in polar areas.

                                                                      tic (and Antarctica) is presented by several review papers
                                                                      via the POLAR-AOD network (Tomasi et al., 2007, 2012,
                                                                      2015) and Pan-Eurasian Experiment (PEEX; Lappalainen et
                                                                      al., 2018; Vihma et al., 2019).
                                                                          A geographically representative distribution of measure-
                                                                      ments is of particular importance. The atmospheric in situ
                                                                      observation network in the Arctic has been developed during
                                                                      the last 3 decades by individual scientists and groups utiliz-
                                                                      ing the resources available. National interests and logistical
                                                                      possibilities have played a role in the initial establishment
                                                                      of the stations and their maintenance. Considering all this,
                                                                      it is somewhat surprising to see that the distribution of mea-
                                                                      surement sites covers the entire Arctic Circle with relatively
                                                                      high homogeneity. A few gaps can be identified on the Cana-
                                                                      dian coast and in the Russian Arctic along the eastern edge
Figure 3. A map of stations with year-round observations in the       of Siberia and the Russian Far East (Petäjä et al., 2020).
Arctic with atmospheric aerosol measurements (note that Barrow is         The coastline of the Russian Arctic is over 24 000 km long,
now Utqiaġvik).
                                                                      thus being a significant region where more comprehensive
                                                                      atmospheric and aerosol observations are needed. Within the
                                                                      PEEX program, we have performed a gap analysis in terms
                                                                      of atmospheric and environmental observations within the
spheric Watch (WMO-GAW) as well as to many thematic
                                                                      Russian Arctic (Alekseychik et al., 2016). The work is ongo-
European research infrastructures, such as Integrated Carbon
                                                                      ing, and the PEEX catalog consists of metadata from 59 sta-
Observation System (ICOS) and the Aerosols, Clouds and
                                                                      tions altogether at the moment. The stations are operated by
Trace Gases Research Infrastructure (ACTRIS). Regionally,
                                                                      universities, the Russian Academy of Sciences, and Roshy-
the Svalbard Integrated Arctic Observing System (SIOS)
                                                                      dromet. The most comprehensive stations in the Russian Arc-
provides a platform for comprehensive measurement activi-
                                                                      tic providing atmospheric observations and aerosol data are
ties within the Svalbard area. Overall, the length and breadth
                                                                      the Tiksi Hydrometeorological Observatory in the Russian
of monitoring programs vary greatly from site to site. Some
                                                                      Far East (71.6◦ N, 128.9◦ E) and the Northeast Science Sta-
of these sites have been operational for almost 30 years, mea-
                                                                      tion (Cherskii; 68.73◦ N, 161.38◦ E).
suring a large number of parameters, while others, such as
Cape Baranova, have only been open for the past 2–3 years.
A historical perspective of aerosol measurements in the Arc-

https://doi.org/10.5194/acp-20-8551-2020                                                Atmos. Chem. Phys., 20, 8551–8592, 2020
8556                                T. Petäjä et al.: Integrative and Comprehensive Understanding on Polar Environments

3.2     Long-term atmospheric in situ observations                  cesses would only be pathways in high altitudes penetrating
                                                                    the Polar Dome by descending air masses through entrain-
As an example, we present results from long-term observa-           ment reaching high-Arctic sites, which is rarely observed.
tions of atmospheric aerosol particle measurements at the              The decrease in Arctic haze, coupled with increases in sun-
high-Arctic site Villum Research Station (VRS) in north             light and the melting of the sea ice–snowpack, allows nat-
Greenland and long-term data for black carbon data from             ural sources of aerosols and their corresponding precursor
Mt. Zeppelin at Svalbard. Furthermore, we summarize re-             gases to become an important source to the atmospheric bur-
cent mass spectrometric analyses of organic matter collected        den of Arctic aerosols. During the summer months, local and
on filters within the Arctic during iCUPE and present results       regional emissions from natural sources govern the aerosol
from vertical measurements of aerosol particle number con-          burden (Barrie, 1986). There is a minimum of ultrafine-
centrations.                                                        mode aerosol concentrations in the winter months, followed
                                                                    by an increase in April–May, reaching a maximum in July,
3.2.1    Aerosol particle number concentrations at the              before decreasing during August–September until reaching
         high-Arctic site Villum Research Station (VRS) in          a minimum again in October. The aerosol and precursor
         North Greenland                                            sources for the ultrafine aerosols (aerosol particle diameter
                                                                    100 nm) aerosol particles (Fig. 4a). The        distribution in the Arctic will enable us to resolve these in-
expansion of the Polar Front and inefficient wet removal in         teractions and feedbacks in the future.
the high Arctic allows for the transport and buildup of rela-
tively high concentrations of accumulation-mode particles at        3.2.2   Black carbon concentrations at Mt. Zeppelin,
VRS. This mode increases in concentration from November                     Svalbard
until it reaches a maximum in April. When the Polar Front
retreats, the transport of anthropogenic emissions is limited       Black carbon (BC) is one of the key short-lived climate
to the high Arctic as only emissions north of the Polar Front       forcers contributing to the warming of the Arctic by both
can find a direct way to high-Arctic sites, and the front is        absorbing solar radiation and by enhancing snowmelt and
located much further north. Also, wet removal processes re-         ice melt by surface deposition (e.g., Bond et al., 2013). As
duce the buildup of high concentrations. Other transport pro-       part of the atmospheric observations, the ACTRIS and IA-

Atmos. Chem. Phys., 20, 8551–8592, 2020                                              https://doi.org/10.5194/acp-20-8551-2020
T. Petäjä et al.: Integrative and Comprehensive Understanding on Polar Environments                                         8557

Figure 4. Monthly mean accumulation-mode (a) and ultrafine-mode (b) number concentration (no. cm−3 ) measured at VRS from 2010 to
2018. Note the difference in the scale of the y axis for each panel.

SOA networks (Fig. 3) operate a network of aethalometers           term data series we present here makes it possible to derive
to determine the atmospheric concentration of BC in the air        some descriptive statistics. The eBC annual mean value has
(Uttal et al., 2016). Although BC is the common term we            been reduced from an annual mean value of 31 ng m−3 at
use for light-absorbing carbon, it is now more appropriate to      the beginning of the previous decade to 12 ng m−3 during the
report mass concentrations in terms of equivalent black car-       last years, with an average reduction of 7 ng m−3 per decade,
bon (eBC), especially when filter-based optical techniques         which amounts to a reduction 4 % annually or approximately
are employed. The equivalent black carbon mass concentra-          44 % per decade. However, trend analysis for aerosol clima-
tion is considered to be the mass of an equivalent amount          tology records needs to be practiced with caution in order
of light-absorbing carbon with a given mass absorption ef-         to remove the effects of the seasonal cycle. When the ex-
ficiency causing the attenuation of light observed by the in-      tracted absorption coefficient from our data was thoroughly
strument at a given wavelength (Petzold, 2013). The quality        examined for a shorter period (2005–2018) the trend was
assurance of data for eBC and the corresponding aerosol ab-        not found to be statistically significant (Collaud Coen et al.,
sorption coefficient has greatly improved over the last years.     2020). Minimum values over the summer often drop below
Compensation schemes for measurement artifacts and har-            the detection limits of the instrument, while maximum values
monization of data obtained by different instruments have          vary greatly with their occurrence, usually related to large-
been established (Backman et al., 2017) and are continuously       scale biomass burning events across Siberia and Alaska. The
updated (Zanatta et al., 2018).                                    continuous reduction in fossil fuel usage is a reason for this
   The results from long-term observations at Zeppelin have        reduction, but it is well known that emissions are not uni-
been discussed and assessed in several works elaborating           formly changing on a global scale, at least in the Northern
on the climatology of BC in the Arctic (Eleftheriadis et al.,      Hemisphere (Evangeliou et al., 2018).
2009.; Sharma et al., 2013; Breider et al., 2017; Schmeisser          The long-term observations can provide important insight
et al., 2018). The results presented here represent the longest    into how abatement strategies for emission reductions or en-
continuous eBC reported record by a single instrument in           hanced anthropogenic activities in certain areas can be re-
the European high Arctic (Torseth at al., 2019) and globally       sponsible for the observed changes. Reverse air mass trans-
the second-longest after those obtained between 1989 and           port modeling using the FLEXPART model (Stohl et al.,
2009 in Alert (Sharma et al., 2019). As an example of long-        2005) can provide the means to combine eBC observations
term observations of BC, we show the latest eBC concentra-         at a remote station like Zeppelin and source areas globally.
tion time series from Zeppelin Station at Svalbard (Fig. 5).       We simulate the backward transport of a black carbon (BC)
The results show a continued gradual reduction in the annual       and an air tracer at the Arctic station of Zeppelin during a
mean value of observed eBC, while the time series is strongly      period representative of the high measured concentrations
modulated by a seasonal cycle well known in the Arctic with        (spring 2012). The analysis is done using reanalysis meteoro-
minima in the summer and maximum in late winter spring.            logical inputs from the European Centre for Medium-Range
One can observe this long-term decline with a linear trend         Weather Forecasts (ECMWF) at a resolution of 1 ◦ . The po-
line applied only as a crude estimate for these data. The long-    tential source contribution function (PSCF) is applied to both

https://doi.org/10.5194/acp-20-8551-2020                                            Atmos. Chem. Phys., 20, 8551–8592, 2020
8558                                  T. Petäjä et al.: Integrative and Comprehensive Understanding on Polar Environments

Figure 5. Equivalent black carbon concentration time series obtained by a seven-wavelength aethalometer at Zeppelin Station. (Data before
2000 are obtained by an AE-9 aethalometer.)

                                                                        3.3     Results from targeted atmospheric field studies in
                                                                                the Arctic

                                                                        3.3.1    Mass spectrometric measurements for offline
                                                                                 source apportionment based on Arctic organic
                                                                                 aerosols

                                                                        Organic compounds are of high importance because they
                                                                        contribute between one- and two-thirds of the submicron
                                                                        aerosol mass in the Arctic (Willis et al., 2018; Schmale et
                                                                        al., 2018; Popovicheva et al., 2019) and may be co-emitted
                                                                        or interact with other aerosol species, such as black car-
Figure 6. Potential source contribution areas for BC observations       bon (AMAP, 2015), sulfate (Kirpes et al., 2018), and metals
at Zeppelin Station, Svalbard. The color scale represents statistical   (Shaw et al., 2010). If imported from lower latitudes, they
potential (1 : 100 %) for the 80th percentile of observed values to     also act as a vehicle of transport for persistent organic pol-
originate from certain areas of the Northern Hemisphere. (a, b) The     lutants (POPs) to the Arctic (Westgate et al., 2013). Organic
air mass transport calculations using the FLEXPART model with           aerosol (OA) also absorbs (Moschos et al., 2018) and scatters
the BC tracer and air tracer, respectively.                             light, thereby changing the radiative balance (Myhre et al.,
                                                                        2013), and may act as cloud condensation nuclei. OA might
                                                                        become increasingly important in a warming Arctic due to
tracers. Western Siberia appears to be the main source region           anthropogenic activities (Schmale et al., 2018) and natural
in the PSCF analysis (Fig. 6).                                          emissions, e.g., as a result of expanded vegetation (Bhatt et
   Differences in emission sensitivities between the two                al., 2010), intensified wildfires (Warneke et al., 2010), and
tracers stress the importance of deposition mechanisms in               decreasing sea ice extent and thickness, leading to higher re-
aerosol transport. Wet scavenging occurs in the presence of             lease of marine volatile organic compounds (Mungall et al.,
clouds and precipitation. Wet deposition is determined from             2017) and thawing tundra soils (permafrost) along shores and
a scavenging coefficient, which is also dependent on the pre-           rivers (Peñuelas et al., 2014; Kramshøj et al., 2018). The con-
cipitation rate. The sub-grid variability of the precipitation          tinuous monitoring of organic carbon (OC) along with a de-
rate is calculated as an area fraction in each grid that experi-        tailed chemical analysis to determine its natural and anthro-
ences precipitation. Both large-scale and convective precip-            pogenic sources, seasonal variability, and interannual evolu-
itation rates are accounted for. We observed that the differ-           tion in the Arctic is of prime importance for improved cli-
ence in the areal distribution of source areas, the potential           mate simulations and a realistic assessment of the effective-
significance of the key emission areas to contribute to eBC             ness of potential mitigation or adaptation actions.
in the high Arctic, and their estimated climate impact is very
much dependent on the microphysical parameterization of
                                                                        Offline mass spectrometric aerosol analysis
the model since the air tracer result is considered a simplified
representation of the transport, and the metrics above greatly
                                                                        OA chemical composition and the corresponding sources re-
affect the result we observe when the BC tracer parameteri-
                                                                        main largely unknown, partly due to the challenging mea-
zation is applied.
                                                                        surement conditions (Uttal et al., 2016; Kulmala, 2018). For

Atmos. Chem. Phys., 20, 8551–8592, 2020                                                   https://doi.org/10.5194/acp-20-8551-2020
T. Petäjä et al.: Integrative and Comprehensive Understanding on Polar Environments                                              8559

example, tremendous effort is required for the deployment
of online aerosol mass spectrometry in various environments
for long time periods. To overcome this challenge an offline
Aerodyne aerosol mass spectrometer (AMS) technique has
been introduced based on re-aerosolized liquid filter extracts
(Daellenbach et al., 2016). The method is capable of covering
broad spatial and seasonal observations as well as determin-
ing the sources of OA (e.g., primary versus secondary, bio-
genic versus anthropogenic) (Moschos et al., 2018; Bozzetti
et al., 2017). This is achieved with positive matrix factor-
ization, a bilinear unmixing receptor model used to describe
the input mass spectra time series as a linear combination of
static OA source (factor) profiles and their time-dependent
contributions to the total OA loading (Canonaco et al., 2013).
Within iCUPE, we aim to extend the coverage of this tech-
nique to the most climate-change-sensitive region world-
wide. The offline AMS analysis will be combined for the first
time with ultrahigh-resolution mass spectrometry coupled
with liquid chromatography for a two-dimensional molec-
ular identification of primary aerosol tracers and secondary      Figure 7. Offline AMS-based fractional contribution of the different
organic aerosol precursors.                                       organic aerosol families for (a) Cape Baranova (H : C = 1.53, O :
                                                                  C = 0.53) and (b) Alert (H : C = 0.81, O : C = 1.64) during October
Sampling sites                                                    2015. (c) Single organic species family-colored (stacked sticks) dif-
                                                                  ference of the May minus October 2015 normalized mass spectrum.
We have collected quartz-fiber filter samples around the Arc-     The former sample is expected to be influenced by pollution trans-
tic. This unparalleled effort is expected to produce data for     port from mainland Russia. Data were taken and analyzed at high
the chemical and source characterization of OA at nine sites      resolution but are summed to unit mass resolution for display.
within six countries (Pallas, Finland; Zeppelin and Gruve-
badet, Norway; Villum, Greenland; Alert, Canada; Barrow
(now Utqiaġvik), USA; Tiksi and Cape Baranova, Russia)           west, which usually bring clear skies and warmer tempera-
from 68 to 83◦ N (Fig. 3) covering the period 2014–2019.          tures. North winds off the ocean are typically accompanied
These include both coastal and archipelago high-Arctic sta-       by fog and sudden drops in temperature.
tions as well as boreal forest Eurasian sites near the Arctic
Circle with different emission exposure characteristics. Here     Preliminary results from the filter sampling
we show offline AMS data for samples collected at two sta-
tions: Ice Base Cape Baranova (Russia) and Alert (Canada).        In Fig. 7, we show offline AMS-based relative fragment con-
   The research station Cape Baranova was built in 2013. It       tributions of the different organic families in October 2015
is located near Cape Baranova on the coast of the Shokalsky       (transition to polar night) for the station Cape Baranova (a)
Strait, which divides the Bolshevik and October Revolu-           and for Alert (b). Even though only limited conclusions can
tion islands of the archipelago Severnaya Zemlya (79.16◦ N,       be drawn from the analyses of single filter samples, there is
101.45◦ E). The area adjacent to the station is characterized     considerable variability in the composition of organic frag-
by the presence of sea ice, dome-shaped glaciers, and ice-        ments between the two samples. During the same autumn
bergs. Polar night and day at the station Cape Baranova last      period, the 2 d Cape Baranova filter sample contains more
from 22 October to 22 February and from 22 April to 22 Au-        than one-third hydrocarbon-like fragments (family CH) and
gust, respectively. The air temperature in summer (June–          about 50 % oxygenated species (families CHO, CHOgt1).
August) is from 0 to 4 ◦ C. In winter (October–April) tem-        The 2-week Alert filter sample contains more, i.e., roughly
peratures range from −25 to −45 ◦ C. The area of the sta-         90 %, and more strongly oxygenated fragments (especially
tion is characterized by stable winds mainly from the south-      the mass-to-charge ratio m/z 44, family CHOgt1). This can
ern direction with an average speed of 10–15 m s−1 . During       be an indication for the extreme remoteness of the site be-
the transition periods of the year, the wind speed can reach      cause OA has to be advected over long distances before it
50 m s−1 .                                                        reaches Alert and can hence be oxidized during transport.
   Alert was opened in 1986 as Canada’s first research sta-          The difference spectrum for Cape Baranova (Fig. 7c) em-
tion for the continuous monitoring of background concen-          phasizes potential seasonal differences in fragments that have
trations of trace gases and aerosols. It is located at 82.5◦ N,   a relatively high overall contribution to the organic mass.
62.37◦ W (210 m a.s.l.) with prevailing winds from the south-     Specifically, the relative abundance of N-containing frag-

https://doi.org/10.5194/acp-20-8551-2020                                            Atmos. Chem. Phys., 20, 8551–8592, 2020
8560 T. Petäjä et al.: Integrative and Comprehensive Understanding on Polar Environments
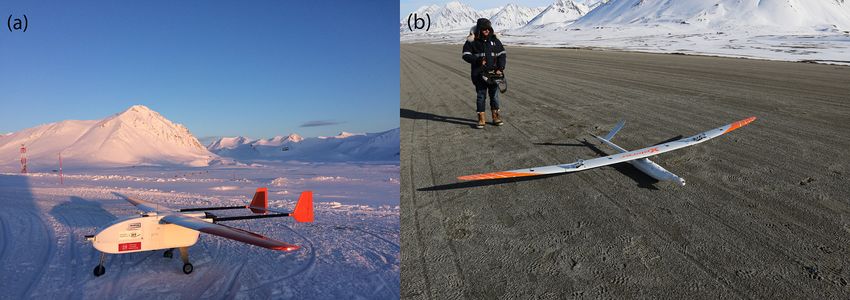
Figure 8. (a) The UAS ALADINA and (b) the UAS MASC3, both
at the airport in Ny-Ålesund.
ments is indicative for May (2 d filter), whereas the Octo-
ber sample contains more oxygenated fragments. The for-
mer might potentially be linked to transported anthropogenic
(e.g., fossil fuel) emissions. No marked significant differ-
ences are observed for the CH fragments. Ongoing analyses
including the other Arctic stations suggest significant vari- Figure 9. Flight path of the UAS ALADINA (start point in the cen-
ability among the different sites and seasons in the relative ter, marked in yellow) in order to study the vertical and horizontal
fraction of fragments that are markers of certain sources, in- distribution of aerosol particles above ice surfaces near glaciers and
dicating largely regionally specific sources of OA across the over open water. Research flights were spatially limited by restricted
areas (hatched in red), like a bird sanctuary near the coast and in-
Arctic land surface.
strument areas south of Ny-Ålesund, and no activity was performed
The data analysis is in its early stages, but we antici-
over inhabited buildings of the village. The TopoSvalbard map©
pate a number of outcomes that are valuable for the up- is obtained from the Norwegian Polar Institute and retrieved from
coming assessment by the Expert Group on Short-Lived Cli- http://toposvalbard.npolar.no, last access: 29 June 2020.
mate Forcers of the Arctic Monitoring and Assessment Pro-
gramme (AMAP), future ultrahigh-resolution mass spectro-
metric measurements of OA in the Arctic, and comparisons
of atmospheric OA with OA in ice cores for historical trends the wind vector and the temperature). The 3D data series
of sources and composition. show the spatial horizontal and vertical variability of the dif-
ferent layers, which enable characterizing the complex flow
3.3.2 Vertical measurements of aerosol particle properties in the fjord around Ny-Ålesund.
number concentrations at Svalbard The resulting data also provide a spatial variability of
turbulent properties (sensible heat, turbulent kinetic energy,
Ground-based measurements are performed continuously at momentum flux). The UAS data improve the understand-
specific sites around the Arctic, but vertical measurements ing of the sources and transport processes of aerosol parti-
are still rare. To investigate the spatial distribution of aerosol cles in the Arctic, link the observations close to the fjord
particles in an Arctic environment a 4-week measurement and at the Zeppelin mountain station (Ström et al., 2009;
campaign was conducted with two different types of un- Tunved et al., 2013), and help to detect regions where new
manned aerial system (UAS) between April and May in 2018 particle formation takes place. Around 200 vertical profiles
in Ny-Ålesund (Spitsbergen, Norway). The UAS ALAD- were captured with the UAS ALADINA between the ground
INA (see Fig. 8a) is equipped with miniaturized aerosol in- and 850 m a.g.l., thus connecting the ground-based measure-
strumentation (two condensation particle counters with dif- ments at Gruvebadet laboratory, located near the village of
ferent lower detection limits, optical particle spectrometer, Ny-Ålesund, and the data sampled at the Zeppelin Obser-
aethalometer) and meteorological sensors (Altstädter et al., vatory at a height of 474 m a.s.l. Further measurement flights
2015; Lampert et al., 2020). A second fixed-wing UAS of were operated horizontally above snow cover and above open
type MASC3 (Fig. 8b) was operated in parallel focusing on water in order to capture the possible impact of biogenic ac-
meteorological measurements. MASC3 probed the lower at- tivity on new particle formation (NPF), as shown along the
mosphere from around 20 to 600 m a.g.l. with flight times of flight path in Fig. 9.
up to 1.5 h. It carried a sensor payload for measuring turbu- Figure 10 shows selected profiles of preliminary data for
lent quantities of pressure, temperature, humidity, and the 3D one selected measurement day. The potential temperature
wind vector, providing 100 Hz data (Rautenberg et al., 2019). and water vapor mixing ratio profiles show that the bound-
ALADINA flights were focusing on aerosol profiles, while ary layer at Svalbard consists of a shallow unstable layer with
MASC3 flew at several fixed altitudes and over a large hori- elevated humidity at the surface. This layer grows higher dur-
zontal extent with high spatial resolution (less than 1 m for ing the day. However, even at 11:17 UTC the mixing reached
Atmos. Chem. Phys., 20, 8551–8592, 2020 https://doi.org/10.5194/acp-20-8551-2020T. Petäjä et al.: Integrative and Comprehensive Understanding on Polar Environments 8561
Figure 10. Selected profiles measured on 23 May 2018 in Ny-Ålesund for (a) 10:22 and (b) 11:17 UTC. The panels show vertical profiles of
the potential temperature, water vapor mixing ratio, and aerosol particle number concentrations between 4 and 12 nm and above 390 nm.
only 150 m; higher than that, the boundary layer remained 3.4 Mercury in the Arctic
stably stratified. The number concentration of accumulation-
mode particles remained rather constant as a function of High concentrations of mercury (Hg) in Arctic biota pose
height. However, nanoparticles between the sizes of 4 and a threat to local populations and wildlife (Douglas et al.,
12 nm varied, and several distinct layers were identified. The 2012; AMAP, 2011). The scarce anthropogenic Hg emission
nanoparticle concentrations were the highest at the elevation sources in the Arctic have left scientists to wonder how mid-
closest to the surface, but high number concentrations were latitude emissions reach the Arctic Ocean marine ecosystem
observed at altitudes up to 500 m. High nanoparticle concen- (e.g., Durnford et al., 2010). The discovery of massive Arctic
trations in the residual layer have been observed in different atmospheric Hg depletion events in 1998 (Schroeder et al.,
environments as well (e.g., Wehner et al., 2010; Altstädter 1998) that are associated with sea-ice-derived reactive halo-
et al., 2018; Leino et al., 2019; Carnerero et al., 2019). Fur- gen oxidants (Skov et al., 2004) has fueled a paradigm in
ther analysis needs to be done to conclude if this is caused which midlatitude urban and industrial Hg emissions reach
by anthropogenic pollution or locally restricted NPF events. the Arctic exclusively via the atmosphere. However, subse-
If NPF events occur on such small scales, vertical measure- quent research has shown that 70 %–80 % of the deposited
ments of aerosol particles are needed to estimate the contri- Hg is photochemically reemitted back to the atmosphere only
bution of such small particles to the regional aerosol balance hours after deposition (Obrist et al., 2017; Brooks et al.,
because many of these layers are not captured by ground- 2006). In iCUPE, we performed observations on the Hg con-
based measurement sites. centrations in the Arctic cryosphere, explored the role of river
systems to the Arctic Ocean mercury load, and explored the
interactions between halogen compounds and Hg.
https://doi.org/10.5194/acp-20-8551-2020 Atmos. Chem. Phys., 20, 8551–8592, 20208562 T. Petäjä et al.: Integrative and Comprehensive Understanding on Polar Environments
3.4.1 Arctic mercury cycle bard region; below this height the snow is completely re-
moved.
In 2012, a coupled 3D ocean–atmosphere model of the Arctic In this study we selected five locations to study the Hg
Hg cycle suggested that a source of Hg to the Arctic Ocean concentration in the snowpack (Fig. 13). The lower snow pit
was missing (Fisher et al., 2012). The missing source was was dug in the Midtre Lovénbreen glacier (MLB) at an al-
suggested to be Arctic rivers, in particular Russian rivers that titude of 401 m a.s.l., the Austre Brøggerbreen (BRG) snow
account for 80 % of river runoff to the Arctic Ocean. We pit at 484 m a.s.l., the snow pit on the Edithbreen (EDB) at
monitored year-round Hg levels in the Yenisei and Sever- 620 m a.s.l., the Kongsvegen (KNG) snow pit at 710 m a.s.l.,
naya Dvina rivers from 2012 to 2016 and confirm that Rus- and the Holthedalfonna (HDF) snow pit at 1100 m a.s.l. The
sian rivers transport large amounts of Hg to the Arctic Ocean sampling was done following a constant sampling step of
(Sonke et al., 2018; Fig. 11b). As part of the iCUPE project 5 cm starting from the top to the bottom of the snowpack
these results were integrated into a 3D Arctic mercury model, (identified as the glacier icy surface or by the snow preserved
developed by coworkers from Harvard University (Sonke et from the previous year; the latter case only for the KNG
al., 2018). We showed that anthropogenic Hg emissions from and HDF sites). The results show that the Hg concentrations
midlatitude industrial sources do not directly reach the Arc- (Fig. 13c) ranged from 0.5 pg g−1 up to 5 pg g−1 with an
tic Ocean ecosystem. Instead, atmospheric elemental Hg0 is average concentration of 1.5 pg g−1 . The higher concentra-
taken up year-round by Arctic tundra vegetation and soils tions were detected at the EDB location (2.00±0.56 pg g−1 ).
(Obrist et al., 2017; Jiskra et al., 2018). Springtime snowmelt The MLB and BRG had a concentration of 1.69 ± 1.04 and
mobilizes the tundra soil mercury, which is bound to plant- 1.72 ± 0.76 pg g−1 , respectively. The lower mean concen-
derived carbon, via rivers to the Arctic Ocean, where it be- tration was found in the HDF and KNG snowpack with a
comes partly available to the marine food web. concentration of 0.80 ± 0.69 and 1.38 ± 0.61 pg g−1 , respec-
As a summary, the 3D model suggests that a large portion tively. The snowpack sampled approximately at or below
of riverine Hg is photochemically reduced in the surface Arc- 600 m a.s.l. had rather constant Hg concentrations ranging
tic Ocean and emitted into the atmosphere. The river Hg bud- from 1.7 to 2.0 pg g−1 , while at higher altitude (from 700
get, together with recent observations on tundra Hg uptake to 1100 m a.s.l.) the concentration decreased in the range be-
and Arctic Ocean Hg dynamics, provides a consistent view tween 1.4 and 0.8 pg g−1 . We found a linear relationship be-
of the Arctic Hg cycle in which continental ecosystems traf- tween altitude and mean Hg concentration with an R 2 of
fic anthropogenic Hg emissions to the Arctic Ocean via rivers 0.78.
and in which the Arctic Ocean exports Hg to the atmosphere, However, the concentration of Hg is not the correct pa-
to the Atlantic Ocean, and to marine sediments (Sonke et al., rameter to evaluate the deposition flux from different sites
2018, Fig. 11). Recent iCUPE research suggests that Arctic since higher snow accumulation might induce a dilution ef-
warming and permafrost thaw risk doubling tundra soil Hg fect. Therefore, the average Hg concentration was converted
runoff to the Arctic Ocean via rivers, thereby potentially in- into Hg flux considering the annual snowpack depth and
creasing health risks to humans (Lim et al., 2019). its density. The estimated flux represents the total Hg load
preserved in the annual snowpack. The results suggest that
the Hg deposition flux is similar at all the sites investi-
3.4.2 Mercury deposition to the Svalbard snowpack gated (BRG 0.54, EDB 0.78, MLB 0.94, KNG 0.70, and
HDF 0.58 µg m−2 yr−1 ), and the elevation gradient is not sta-
To expand knowledge of the role of snowpack in the Hg tistically significant (R 2 = 0.28). In the snow pit, the snow
life cycle, we performed targeted field studies (Spolaor et at the bottom is representative of the fall season, the middle
al., 2018, 2019) to determine the seasonality of Hg depo- of the winter deposition, and the upper part of the snow ac-
sition and the total Hg deposition from the atmosphere to cumulated during the spring. The results show that the Hg
snow preserved in the Arctic environment on the Svalbard concentration in all snow pits tends to increase in the upper,
archipelago, specifically in the Spitsbergen region (Fig. 12). most recent snow layer, in general from 0 to 40 cm depth.
The annual snowpack is defined as the snow that accumulates The upper part of the snowpack (the sampling was done
over a glacier surface during the winter. The snow season in in April 2018) is more representative of the spring deposi-
Svalbard changes year by year, but typically the accumula- tion, potentially influenced by atmospheric mercury deple-
tion of snow starts at the end of September and ends at the tion events (AMDEs). More data analysis is required to ver-
end of May in concomitance with the temperature rise and ify this hypothesis.
the start of snow melting (Spolaor et al., 2016). The snow
season is dependent on altitude, and sites at a higher eleva- 3.4.3 Mercury in air of the Russian Arctic (Amderma)
tion can preserve part of the annual snowpack throughout the
year. The equilibrium line, which is the altitude above which Since June 2001, long-term monitoring of gaseous elemen-
snow accumulated during the snow season, is partially pre- tal Hg0 in the troposphere has been carried out near the
served and located at approximately 600 m a.s.l in the Sval- Amderma settlement (69.45◦ N, 61.39◦ E; 49 m a.s.l.; Nenets
Atmos. Chem. Phys., 20, 8551–8592, 2020 https://doi.org/10.5194/acp-20-8551-2020T. Petäjä et al.: Integrative and Comprehensive Understanding on Polar Environments 8563
Figure 11. (a) Modeled net air–sea exchange of Hg (µg m−2 per month) across the Arctic Ocean basin for the months June–July from
the coupled GEOS-Chem–MITgcm Hg chemistry and transport model. Positive numbers (red) indicate a flux to the atmosphere. (b) The
modern Arctic Hg cycle, showing net fluxes (metric tons per year, in black) between the different terrestrial, marine, and atmospheric
reservoirs (metric tons, in red). The hatched area represents the coastal erosion Hg flux. The large river Hg flux (purple arrow) confirms a
new paradigm in which tundra vegetation and soil uptake midlatitude Hg atmospheric emissions and transfer them to rivers and the Arctic
Ocean. Reproduced from Sonke et al. (2018).
pletion events (AMDEs) and elevated events (AMEEs). Sub-
sequently, we determined Hg fluxes to the atmosphere, evalu-
ated concentration trends, and identified possible long-range
transport cases (with the Hybrid Single-Particle Lagrangian
Integrated Trajectory model, HYSPLIT; Stein et al. 2015)
originating from Icelandic volcanic eruptions (Pankratov et
al., 2015).
During the entire period of operation at this station, the lo-
cation of the analyzer was changed three times at different
distances to the Kara Sea coastline. The results show that the
frequency of AMDE occurrence depends on the distance to
the coastline. From 2001 to 2004 the analyzer was located
at a distance of about 9 km from the coast. The number of
AMDEs for this period was 10 % of the total number (6765)
of measurements. During the 2005–2010 period, the analyzer
was placed at 2.5 km from the coast. As a result, the deple-
tion events were registered more frequently, especially dur-
ing the spring–summer period. In 2006 and 2007 such deple-
Figure 12. Snow sampling locations on the Svalbard archipelago. tion events were recorded in winter with a frequency of 20 %
BRG – Austre Brøggerbreen glacier; MLB – Midtre Lovénbreen of the total number (1898) of measurements. Starting from
glacier; EDB – Edithbreen glacier; KNG – Kongsvegen; HDF 2010 the analyzer was located at a distance of 200 m from
– Holthedalfonna ice field. The TopoSvalbard map© is obtained the coast. As a result of this relocation, more events were
from the Norwegian Polar Institute and retrieved from http:// recorded (30 % of 67 986 measurements) (Fig. 14a). For the
toposvalbard.npolar.no, last access: 29 June 2020.
first time in the Russian Arctic, we identified the intensifica-
tion of the AMDE frequency as a function of distance to the
sea. The results are consistent with observations in other po-
Autonomous District, Russia), which is located on the Yu-
lar stations such as Ny-Ålesund and Andøya (Norway), Alert
gor Peninsula on the shore of the Kara Sea close to the Arc-
(Canada), and Pallas (Finland) (Pankratov, 2015; Nguyen et
tic border between Europe and Asia. A Tekran 2537A Hg0
al., 2009).
vapor analyzer, which is a cold vapor atomic fluorescence
Histograms of the Hg0 concentration at Amderma during
spectrometer, was used. We carried out an analysis of the
the different years are presented in Fig. 14b. The probability
monthly, seasonal, and interannual variability in concentra-
density distribution of the Hg0 concentration was lognormal
tion patterns as well as the occurrence of atmospheric Hg de-
https://doi.org/10.5194/acp-20-8551-2020 Atmos. Chem. Phys., 20, 8551–8592, 2020You can also read