AN OVERVIEW OF THE ORACLES (OBSERVATIONS OF AEROSOLS ABOVE CLOUDS AND THEIR INTERACTIONS) PROJECT: AEROSOL-CLOUD-RADIATION INTERACTIONS IN THE ...
←
→
Page content transcription
If your browser does not render page correctly, please read the page content below
Atmos. Chem. Phys., 21, 1507–1563, 2021
https://doi.org/10.5194/acp-21-1507-2021
© Author(s) 2021. This work is distributed under
the Creative Commons Attribution 4.0 License.

An overview of the ORACLES (ObseRvations of Aerosols above
CLouds and their intEractionS) project: aerosol–cloud–radiation
interactions in the southeast Atlantic basin
Jens Redemann1 , Robert Wood2 , Paquita Zuidema3 , Sarah J. Doherty2 , Bernadette Luna4 , Samuel E. LeBlanc5,4 ,
Michael S. Diamond2 , Yohei Shinozuka7 , Ian Y. Chang1 , Rei Ueyama4 , Leonhard Pfister4 , Ju-Mee Ryoo4,36 ,
Amie N. Dobracki3 , Arlindo M. da Silva6 , Karla M. Longo6,7 , Meloë S. Kacenelenbogen4 , Connor J. Flynn1 ,
Kristina Pistone5,4 , Nichola M. Knox8 , Stuart J. Piketh9 , James M. Haywood10 , Paola Formenti11 , Marc Mallet12 ,
Philip Stier13 , Andrew S. Ackerman14 , Susanne E. Bauer14 , Ann M. Fridlind14 , Gregory R. Carmichael15 ,
Pablo E. Saide16,17 , Gonzalo A. Ferrada15 , Steven G. Howell18 , Steffen Freitag18 , Brian Cairns14 , Brent N. Holben6 ,
Kirk D. Knobelspiesse6 , Simone Tanelli20 , Tristan S. L’Ecuyer20 , Andrew M. Dzambo20 , Ousmane O. Sy19 ,
Greg M. McFarquhar1,39 , Michael R. Poellot21 , Siddhant Gupta1 , Joseph R. O’Brien21 , Athanasios Nenes22,37,38 ,
Mary Kacarab22 , Jenny P. S. Wong22,23 , Jennifer D. Small-Griswold24 , Kenneth L. Thornhill25,34 , David Noone26,35 ,
James R. Podolske4 , K. Sebastian Schmidt27 , Peter Pilewskie27 , Hong Chen27 , Sabrina P. Cochrane27 ,
Arthur J. Sedlacek28 , Timothy J. Lang29 , Eric Stith30 , Michal Segal-Rozenhaimer4,5,31 , Richard A. Ferrare25 ,
Sharon P. Burton25 , Chris A. Hostetler25 , David J. Diner19 , Felix C. Seidel19 , Steven E. Platnick6 , Jeffrey S. Myers32 ,
Kerry G. Meyer6 , Douglas A. Spangenberg34 , Hal Maring33 , and Lan Gao1
1 School  of Meteorology, University of Oklahoma, Norman, OK, USA
2 Department    of Atmospheric Sciences, University of Washington, Seattle, WA, USA
3 Department of Atmospheric Sciences, University of Miami, Miami, FL, USA
4 NASA Ames Research Center, Moffett Field, CA, USA
5 Bay Area Environmental Research Institute, Moffett Field, CA, USA
6 NASA Goddard Space Flight Center, Greenbelt, MD, USA
7 Universities Space Research Association, Columbia, MD, USA
8 Department of Geo-Spatial Sciences and Technology, Namibia University of Science and Technology, Windhoek, Namibia
9 Unit for Environmental Science and Management, North-West University, Potchefstroom, North-West, South Africa
10 College of Engineering, Mathematics and Physical Science, University of Exeter, Exeter, EX4 4QE, UK
11 Laboratoire Interuniversitaire des Systèmes Atmosphériques (LISA), UMR CNRS 7583, Université Paris-Est-Créteil,

Université de Paris, Institut Pierre Simon Laplace, Créteil, France
12 Centre National de Recherches Météorologiques, Météo-France-CNRS, Toulouse, France
13 Atmospheric, Oceanic and Planetary Physics, Department of Physics, University of Oxford, Oxford, UK
14 NASA Goddard Institute for Space Studies, New York, NY, USA
15 Center for Global and Regional Environmental Research, University of Iowa, Iowa City, IA, USA
16 Department of Atmospheric and Oceanic Sciences, University of California, Los Angeles, CA, USA
17 Institute of the Environment and Sustainability, University of California, Los Angeles, CA, USA
18 Department of Oceanography, University of Hawai‘i at Mānoa, Honolulu, HI, USA
19 Jet Propulsion Laboratory, California Institute of Technology, Pasadena, CA, USA
20 Department of Atmospheric and Oceanic Sciences, University of Wisconsin–Madison, Madison, WI, USA
21 Department of Atmospheric Sciences, University of North Dakota, Grand Forks, ND, USA
22 Georgia Institute of Technology, Atlanta, GA, USA
23 Department of Chemistry and Biochemistry, Mount Allison University, Sackville, Canada
24 Department of Atmospheric Sciences, University of Hawai‘i at Mānoa, Honolulu, HI, USA
25 NASA Langley Research Center, Hampton, VA, USA
26 College of Earth, Ocean, and Atmospheric Sciences, Oregon State University, Corvallis, OR, USA

Published by Copernicus Publications on behalf of the European Geosciences Union.
1508                                                              J. Redemann et al.: An overview of the ORACLES project

27 Department  of Atmospheric and Oceanic Sciences, University of Colorado, Boulder, CO, USA
28 Brookhaven   National Laboratory, Upton, NY, USA
29 NASA Marshall Space Flight Center, Huntsville, AL, USA
30 National Suborbital Research Center, Moffett Field, CA, USA
31 Department of Geophysics and Planetary Sciences, Porter School of the Environment and Earth Sciences,

Tel Aviv University, Tel Aviv, Israel
32 University of California Santa Cruz, Santa Cruz, CA, USA
33 NASA Headquarters, Washington, D.C., USA
34 Science Systems and Applications, Inc., Hampton, VA, USA
35 Department of Physics, University of Auckland, Auckland, New Zealand
36 Science and Technology Corporation, Moffett Field, CA, USA
37 Ecole Polytechnique Federale de Lausanne, Lausanne, Switzerland
38 Foundation for Research and Technology – Hellas, Heraklion, Greece
39 Cooperative Institute for Mesoscale Meteorological Studies (CIMMS) and School of Meteorology,

University of Oklahoma, Norman, OK, USA

Correspondence: Jens Redemann (jredemann@ou.edu)

Received: 8 May 2020 – Discussion started: 16 June 2020
Revised: 9 October 2020 – Accepted: 1 November 2020 – Published: 4 February 2021

Abstract. Southern Africa produces almost a third of the           icant new findings on the vertical structure of BB aerosol
Earth’s biomass burning (BB) aerosol particles, yet the fate       physical and chemical properties, chemical aging, cloud con-
of these particles and their influence on regional and global      densation nuclei, rain and precipitation statistics, and aerosol
climate is poorly understood. ORACLES (ObseRvations of             indirect effects are emphasized, but their detailed descrip-
Aerosols above CLouds and their intEractionS) is a 5-year          tions are the subject of separate publications. The main pur-
NASA EVS-2 (Earth Venture Suborbital-2) investigation              pose of this paper is to familiarize the broader scientific com-
with three intensive observation periods designed to study         munity with the ORACLES project and the dataset it pro-
key atmospheric processes that determine the climate im-           duced.
pacts of these aerosols. During the Southern Hemisphere
winter and spring (June–October), aerosol particles reaching
3–5 km in altitude are transported westward over the south-
east Atlantic, where they interact with one of the largest sub-    1   Introduction
tropical stratocumulus (Sc) cloud decks in the world. The
                                                                   The radiative and cloud-altering impacts of anthropogenic
representation of these interactions in climate models re-
                                                                   aerosol particles constitute the largest source of uncertainty
mains highly uncertain in part due to a scarcity of obser-
                                                                   in anthropogenic climate forcing (IPCC, 2013). Aerosol par-
vational constraints on aerosol and cloud properties, as well
                                                                   ticles interact directly with solar radiation through scattering
as due to the parameterized treatment of physical processes.
                                                                   and absorption of radiation, which leads to a direct radiative
Three ORACLES deployments by the NASA P-3 aircraft in
                                                                   forcing whose sign depends on the ratio of the absorption to
September 2016, August 2017, and October 2018 (totaling
                                                                   the total aerosol extinction and on the albedo of the underly-
∼ 350 science flight hours), augmented by the deployment
                                                                   ing surface–atmosphere system (Coakley and Chylek, 1975).
of the NASA ER-2 aircraft for remote sensing in Septem-
                                                                   Heating of the atmosphere by aerosol absorption can induce
ber 2016 (totaling ∼ 100 science flight hours), were intended
                                                                   changes in atmospheric circulation and mixing that can ei-
to help fill this observational gap. ORACLES focuses on
                                                                   ther enhance or decrease cloudiness (Ackerman et al., 2000;
three fundamental science themes centered on the climate ef-
                                                                   Koch and Del Genio, 2010). Aerosol particles also serve as
fects of African BB aerosols: (a) direct aerosol radiative ef-
                                                                   cloud condensation nuclei (CCN), which can enhance cloud
fects, (b) effects of aerosol absorption on atmospheric circu-
                                                                   albedo by increasing the concentration of cloud droplets and
lation and clouds, and (c) aerosol–cloud microphysical inter-
                                                                   reducing their size when aerosol concentrations increase at
actions. This paper summarizes the ORACLES science ob-
                                                                   fixed liquid water content (Twomey, 1974), and also poten-
jectives, describes the project implementation, provides an
                                                                   tially drive changes in cloud condensate or cloud cover by al-
overview of the flights and measurements in each deploy-
                                                                   tering cloud lifetimes (Simpson and Wiggert, 1969; Albrecht,
ment, and highlights the integrative modeling efforts from
                                                                   1989; Ackerman et al., 2004; Wood, 2007). The magnitudes
cloud to global scales to address science objectives. Signif-
                                                                   of all effects and even the sign of the latter two aerosol ef-

Atmos. Chem. Phys., 21, 1507–1563, 2021                                              https://doi.org/10.5194/acp-21-1507-2021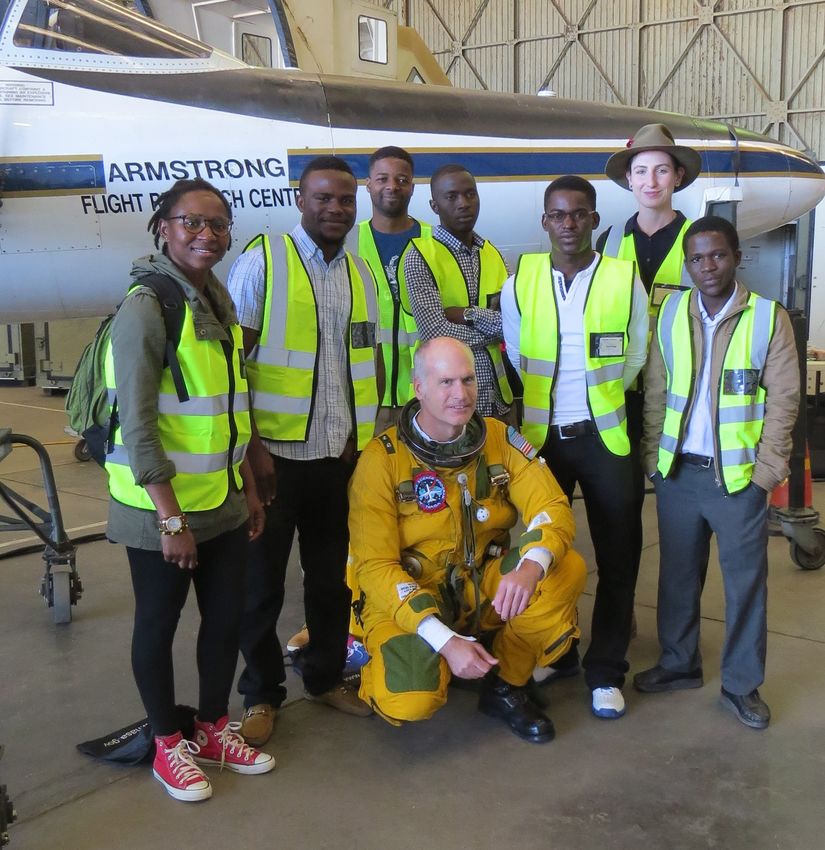
J. Redemann et al.: An overview of the ORACLES project 1509
fects are not well quantified globally (IPCC, 2013) and are cension Island in 2016–2017, all described in more detail in
expected to be geographically and seasonally heterogeneous Sect. 3.4.
because the total aerosol forcing is dependent upon the na- The southern and central African fires producing BB
ture and amount of different aerosol species, cloud type and aerosol occur during the warm, dry season over the conti-
cover, and surface albedo, all of which vary on such scales. nent, so emissions are lofted in the convective boundary layer
Biomass burning (BB) is one of the largest sources of ab- to an altitude of several kilometers. As they advect offshore,
sorbing aerosol globally (Bond et al., 2013). BB aerosol par- the BB aerosol layers form a plume that initially overlays
ticles contain black carbon, the most strongly absorbing of the cloud deck over the Atlantic (Fig. 2; see also Adebiyi
all aerosol constituents found in the atmosphere. The sign of and Zuidema, 2016; Zuidema et al., 2016; Deaconu et al.,
the direct aerosol forcing is highly dependent upon the rel- 2019) and exerts a direct radiative forcing (RF) whose sign
ative vertical locations of aerosol and clouds, with forcing and magnitude depend upon the reflectance and coverage of
changing from negative to positive when BB aerosol layers the clouds below and on the absorptivity of the aerosols (Keil
overlie low clouds rather than a dark ocean surface (Chand et and Haywood, 2003; Chand et al., 2009). Depending on the
al., 2009). BB aerosols also contain oxidized organic carbon relative vertical location of the aerosols and the cloud deck,
and other soluble inorganic species that can act as effective cloud condensate may increase or decrease in response to
CCN if transported into clouds. aerosol absorption and subsequent changes in atmospheric
The southeast Atlantic (SEA) region has some of the high- stability, relative humidity, and subsidence (semi-direct forc-
est optical depths of BB aerosol on the planet. It is also the lo- ing). Cloud optical thickness and areal coverage may also
cation of large inter-model differences in aerosol forcing as- be influenced by aerosol-induced changes in cloud micro-
sessments (Schulz et al., 2006; Stier et al., 2013; Zuidema et physics (forcing from aerosol–cloud interactions) when BB
al., 2016). The neighboring southern African biomass burn- aerosols are mixed into the marine boundary layer (MBL).
ing (BB) source regions account for almost one third of the This is expected to occur more frequently offshore as the
Earth’s BB emissions (550 Tg C yr−1 ; van der Werf et al., MBL deepens in response to warming sea surface temper-
2010), producing optically thick BB aerosol layers that are atures (e.g., Eastman et al., 2017), raising cloud top heights
routinely transported across much of the South Atlantic basin (Zuidema et al., 2009) and easing entrainment of the overly-
(Chand et al., 2009; Zuidema et al., 2016). While burned ar- ing aerosol, and as BB aerosol layers descend in response to
eas are decreasing in size globally, burned areas in Africa are prevailing large-scale subsidence (Fig. 2).
increasing, raising interesting questions about BB aerosol in- Satellite- and model-based assessments of aerosol–cloud–
teractions with climate in that region in the future (Andela et climate interactions in this region (e.g., Chand et al., 2009;
al., 2017). Wilcox, 2012; Stier et al., 2013; De Graaf et al., 2014;
The SE Atlantic is also home to one of the Earth’s largest Zhang et al., 2016; Adebiyi and Zuidema, 2018; Zhang and
subtropical stratocumulus (Sc) cloud decks, which plays a Zuidema, 2019; Kacenelenbogen et al., 2019; Sayer et al.,
key role in the energetic balance of the region. The phys- 2019) indicate that improved observations of aerosol prop-
ical processes governing the feedbacks between sea sur- erties and loading, cloud fraction, albedo, and liquid water
face temperature (SST) and cloud properties in these Sc path (LWP) are needed to constrain the local aerosol ra-
decks are poorly represented in climate models (Bony and diative impacts. Such studies are hampered by problematic
Dufresne, 2005). In the Austral spring (July to October), the aerosol retrievals in regions of extensive low clouds and diffi-
Sc deck interacts with the African BB aerosols that have culties retrieving cloud microphysical properties underneath
been transported westward by prevailing mid-tropospheric dense aerosol layers (Haywood et al., 2004; Coddington et
tropical easterly winds. These aspects of the SE Atlantic at- al., 2010; Deaconu et al., 2017). The observations used in
tracted several international field experiments on aerosol– these studies often have severe limitations and require signif-
cloud–climate interactions in the region. These projects were icant assumptions about aerosol and cloud properties (Yu et
based out of deployment sites distributed throughout the SE al., 2012; Yu and Zhang, 2013; Jethva et al., 2014; Knobel-
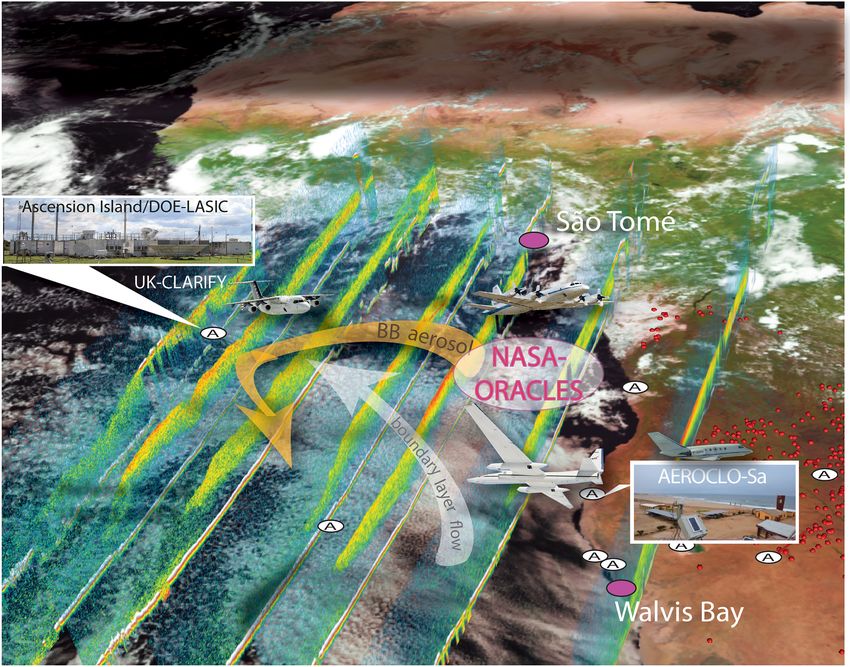
Atlantic (Fig. 1) and were scheduled between 2016 and 2018 spiesse et al., 2015; Meyer et al., 2015; Sayer et al., 2016).
to allow for collaborative science. These experiments include An example of a satellite-based retrieval of both aerosols
the NASA ORACLES project described in this paper, de- and clouds is given in Fig. 2, which shows the altitude of
ploying from Walvis Bay, Namibia, in 2016 and São Tomé aerosol and cloud layers during 3 months as a function of
in 2017 and 2018; the UK CLARIFY (Clouds and Aerosol longitude, as operationally retrieved from the Cloud-Aerosol
Radiative Impacts and Forcing), deploying from Ascension Lidar with Orthogonal Polarization (CALIOP) space-based
Island in 2017; the French AEROCLO-sA (Aerosol, Radia- lidar. Multiple filters have been applied for quality assur-
tion and Clouds in southern Africa) project, deploying from ance of these data. However, the simple message this fig-
Walvis Bay, Namibia, in 2017; and the DOE Atmospheric ure conveys, of an elevated aerosol layer that is typically
Radiation Measurement mobile facility LASIC (Layered At- far above the low cloud, is somewhat misleading because
lantic Smoke Interactions with Clouds) deployment to As- (i) there could be multiple aerosol layers above the upper-
most cloud and (ii) the CALIOP-derived aerosol layer base
https://doi.org/10.5194/acp-21-1507-2021 Atmos. Chem. Phys., 21, 1507–1563, 2021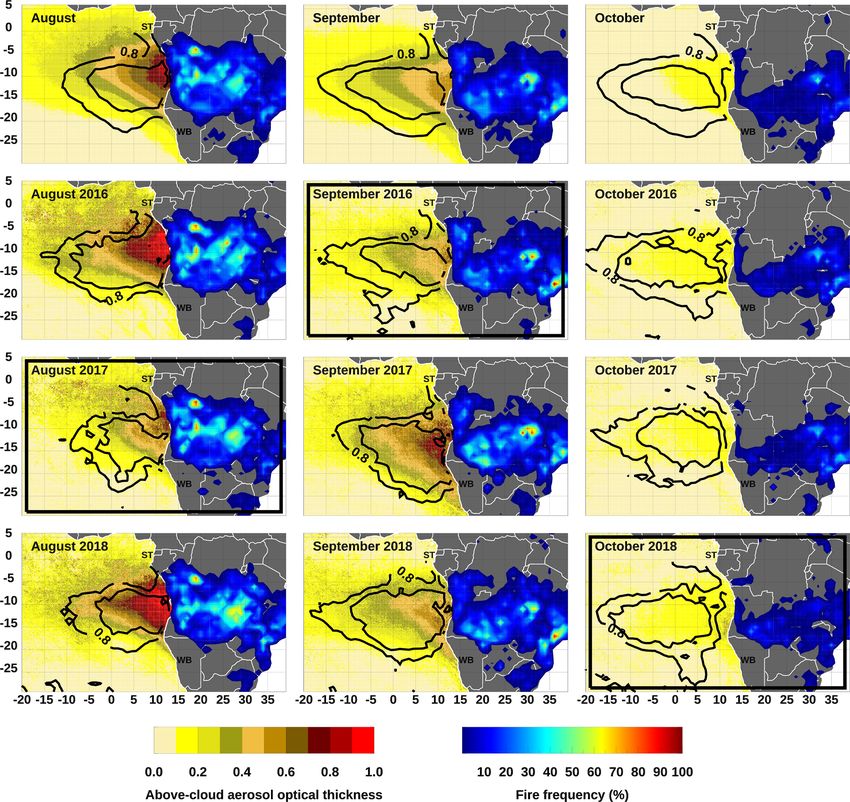
1510                                                                 J. Redemann et al.: An overview of the ORACLES project

Figure 1. Deployment sites for the 2016–2018 ORACLES field experiments and collaborative international deployment activities (see text),
along with CALIOP curtain data visualized by Charles Trepte (NASA Langley), adapted from © Google Maps 2020. The ovals with the
letter A indicate new or refurbished AERONET sites (Holben et al., 2018).

height has been found to be biased high, based on airborne            in the first place and greatly influenced its design (Watson-
measurements made during ORACLES as well as CALIOP                    Parris et al., 2018).
retrievals that have been constrained by above-cloud aerosol             Surface-based measurements also have limitations.
optical thickness derived from the CALIOP data. The latter            AERONET (Aerosol Robotic Network) sky radiance ob-
results from the fact that, especially for the daytime retrievals     servations (Holben et al., 1998) are used frequently to
from CALIOP, there is a significant reduction in the signal-          tune global model estimates of aerosol absorption (Bond
to-noise ratio in the presence of optically thick aerosol layers.     et al., 2013) but can be routinely performed only from
Hence, the separation between clouds and overlying aerosols           land and in the absence of clouds. Although historically
(Fig. 2, yellow bars) is also likely biased high (see also Ra-        a number of AERONET stations existed near the main
japakshe et al., 2017). Such observational uncertainty and the        African BB sources, just prior to ORACLES, there were no
differing conclusions one may draw based on the separation            operational AERONET stations in the main BB region, with
between the BB aerosol layer and the underlying Sc clouds             the exception of Ascension Island far downwind.
in this region were a significant contributing impetus for the           Airborne instruments provide measurements of aerosols
ORACLES project. We include the CALIOP-derived Fig. 2                 and clouds under co-varying meteorological conditions
here to provide the scientific information available at the OR-       that are currently impossible to obtain from space. High-
ACLES proposal stage, which partially motivated the project           resolution airborne observations, over scales that resolve pro-
                                                                      cesses of interest, provide critical constraints for parame-

Atmos. Chem. Phys., 21, 1507–1563, 2021                                                  https://doi.org/10.5194/acp-21-1507-2021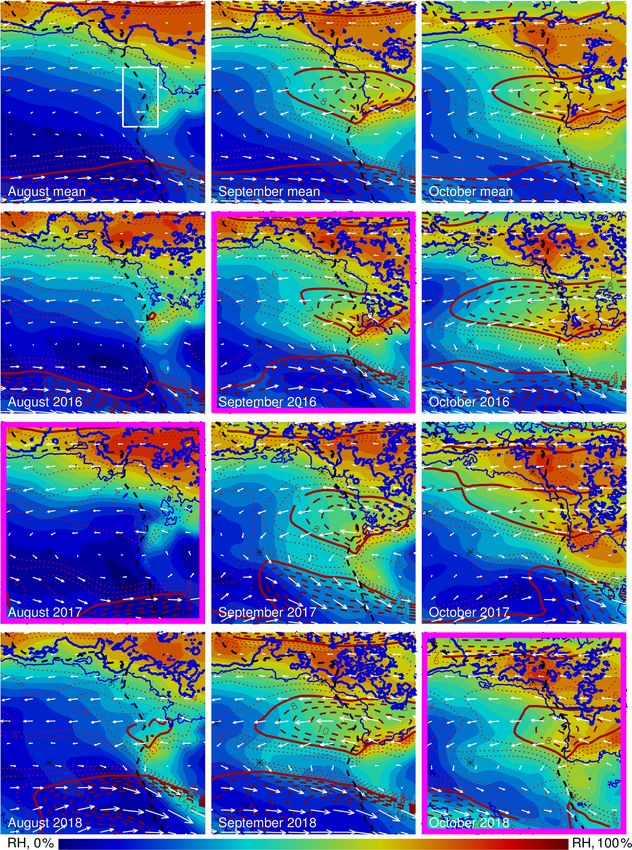
J. Redemann et al.: An overview of the ORACLES project                                                                                1511

Figure 2. Distributions of aerosol top height (red), cloud top height (blue), and the separation between clouds and overlying aerosols (yel-
low) as a function of longitude, between 10–22.5◦ S. Observations are taken from the Cloud-Aerosol Lidar with Orthogonal Polarization
(CALIOP) version 3 aerosol profile product from 2006 to 2012 (7 years).

terizing aerosol–cloud–climate interactions in models. They                    ods, including instrument concepts with potential for
can also be used to enhance satellite-based remote sens-                       deployment to space.
ing, by resolving in situ characteristics and variability within
a particular scene, by providing a direct test of retrieved                 2. Acquire a process-level understanding of aerosol–
properties, and in the long term by guiding the develop-                       cloud–radiation interactions and resulting cloud adjust-
ment of new and improved remote-sensing techniques. Be-                        ments that can be applied in global models.
cause previous efforts to study BB emissions in South Africa            In this paper, we provide an overview of all three OR-
(e.g., SAFARI-2K, Swap et al., 2003; TRACE-A, Fishman                   ACLES deployments, highlighting aerosol absorptive and
et al., 1996) were focused over land or in close proximity to           cloud-nucleating properties, their vertical distribution rela-
the coastal zone (e.g., Haywood et al., 2003), prior to OR-             tive to clouds, the locations and degree of aerosol mixing into
ACLES, there was a dearth of measurements over the SE                   clouds, and cloud changes in response to such mixing. We
Atlantic Ocean, where the major radiative impacts of BB                 make an initial assessment of the differences and similarities
aerosols are taking place.                                              of the BB plume and cloud properties as observed from the
   In response to the need for new measurement constraints,             2016 deployment site (Walvis Bay, Namibia) at the plume’s
in 2014 NASA funded the ORACLES project as one of the                   southern edge and from the 2017 and 2018 deployment site
Earth Venture Suborbital-2 investigations. The goal of ORA-             (São Tomé and Príncipe) near the plume’s northern edge. We
CLES is to provide a process-level understanding of the role            conclude with an outlook for the integrative work we envi-
of aerosols in climate by providing observations of all rele-           sion to address the overarching science questions regarding
vant aerosol effects over the SE Atlantic, a region with some           aerosol–radiation–climate interactions in the SE Atlantic and
of the largest aerosol loadings on the planet that is readily           how these suborbital observations will aid long-term model-
accessible with airborne platforms. The overarching ORA-                ing and satellite remote-sensing efforts.
CLES science goals, which encompass the specific science
themes and questions in the abstract and Table 1 below, are
as follows.                                                             2     Project background

                                                                        2.1    Motivation for 3-year field deployment
  1. Determine the impact of African BB aerosol on cloud
     properties and the radiation balance over the South At-            Prior to the ORACLES implementation stage, an analysis
     lantic, using state-of-the-art in situ and remote-sensing          of satellite data in the study area had revealed pronounced
     instruments to generate datasets that can also be used to          shifts in aerosol altitude, concentration, and optical prop-
     verify and refine current and future observation meth-             erties through the July to October BB season. That com-

https://doi.org/10.5194/acp-21-1507-2021                                                   Atmos. Chem. Phys., 21, 1507–1563, 2021
1512                                                              J. Redemann et al.: An overview of the ORACLES project

bined body of work suggested that aerosol loadings peak in         2.3     Project implementation
September (Fig. 3, see also Adebiyi et al., 2015), whereas
single-scattering albedo (SSA) increases over the season, re-      2.3.1    Logistics and deployment details
flecting either a change in BB aerosol composition (Eck et
al., 2013) or the mix of aerosol types present (Bond et al.,       The Walvis Bay airport in western Namibia was originally
2013). Another striking seasonal change is that, on average,       considered the ideal location for ORACLES due to its prox-
the gap between cloud top and the aerosol layer increases          imity to the ocean and cloud deck, runway length and hangar
dramatically (Fig. 2), primarily due to higher aerosol layers.     size for the ER-2, and due to its use during the SAFARI-2K
   The closer vertical proximity of BB aerosol layers to           campaign by the University of Washington CV-580 aircraft.
clouds early in the season (shown in Fig. 2) suggested that        The runway had been extended to ∼ 3350 m, but certification
studies of aerosol–cloud interactions would be most feasi-         of the extension was still in progress as ORACLES began.
ble then, while larger gaps later in the season would suggest      It was our intention to deploy only one aircraft in the first
weaker indirect effects. Observing and quantifying these sea-      year and grow the activity after acclimating to the locality
sonal changes and the changing importance of the aerosol           and airspace. However, during the ORACLES-2016 deploy-
semi-direct and indirect effects over the BB season required       ment planning, the UK CLARIFY team announced plans to
either an impractically extended deployment or separate de-        fly its airborne assets in 2016 as well. In response, leadership
ployments spread across the season. The ORACLES team               re-ordered ORACLES deployments to bring both aircraft to
decided on separate deployments in September 2016, Au-             Walvis Bay in 2016, so as to maximize their impact in a con-
gust 2017, and October 2018, a decision that was aided             certed effort with the international partners.
by a relative lack of interannual variability in meteorology.         In the event that the facilities were found to be inadequate
This variability was predominantly linked to SST variations        or unready or unavailable, alternate airfields were investi-
known as Benguela Niños that mainly occur in boreal spring,        gated. Specifically, Upington (FAUP), South Africa, and São
not fall, and are much less frequent than the better-known         Tomé (FPST) were pursued with due diligence until coun-
Pacific El Niños (Rouault, 2012). Interannual variability in       try approval was obtained from Namibia. Upington had no
fire emissions was expected to be low as well (van der Werf        usable hangar but an extremely long runway, little compet-
et al., 2010). As a result, aerosol loading in the ORACLES         ing traffic, and the benefit of a long-standing collaborative
region was expected to be repeatable, with Moderate Resolu-        relationship with the USA and NASA. São Tomé’s runway
tion Imaging Spectroradiometer (MODIS) clear-sky aerosol           length and hangars could not accommodate the ER-2 require-
optical depth (AOD) retrievals implying year-to-year vari-         ments, but officials were very enthusiastic about a NASA
ability through the burning season of only 20 % of the mean.       collaboration. Both locations could support a P-3-only de-
In reality, recently developed above-cloud AOD retrievals re-      ployment. A temporary hangar in Upington, South Africa, or
veal a significant interannual variability in the properties of    Windhoek, Namibia, might have supported the ER-2. Ascen-
the above-cloud aerosol plume (see Sect. 4.2–4.3 below); in-       sion Island also had no hangar and posed significant con-
vestigations into the particular reasons are ongoing. Finally,     straints to the commercial import/transport of people and
a practical consideration for the attempt to cover the BB sea-     equipment. In later years, Ascension Island was subject to
sonal cycle with three separate deployments was based on           runway construction, but it did serve as an overnight transit
the fact that airborne instrument performance has a tendency       stop for the P-3 in 2016 and 2017 and as the target for suit-
to significantly decrease as mission durations extend beyond       case (overnight stay) flights in 2017.
4 weeks.                                                              ORACLES experiment requirements dictated deployment
                                                                   of up to 80 people (110 in 2016) for three 5-week periods,
2.2    Science questions and objectives                            centered on the months of September 2016, August 2017,
                                                                   and October 2018.
ORACLES science questions and related objectives are gen-
erally focused on direct, semi-direct, and indirect aerosol        2.3.2    Choice of measurement platforms: envisioned
effects on climate. Table 1 summarizes science questions                    versus realized capabilities
and objectives as originally posed. The general approach
for developing these objectives was to include goals that          The revised ORACLES project implementation plan called
were highly achievable first and to increase the complex-          for the operation of two aircraft in 2016 and the operation
ity of objectives gradually. The objectives related to science     of only one aircraft in 2017 and 2018. The choice to deploy
questions 1 and 2, i.e., direct and semi-direct effects, con-      the ER-2 aircraft in 1 year only was solely based on fund-
stituted the “threshold” (for success) science mission. The        ing considerations, as its operations are considerably more
science objectives associated with question 3, i.e., indirect      complicated and costly.
effect assessments, were part of the “baseline” science mis-          The ORACLES platforms and instruments were selected
sion, which in NASA terminology indicates the full mission         to efficiently and quantitatively address the science questions
scope.                                                             outlined above through measurements of radiative fluxes,

Atmos. Chem. Phys., 21, 1507–1563, 2021                                              https://doi.org/10.5194/acp-21-1507-2021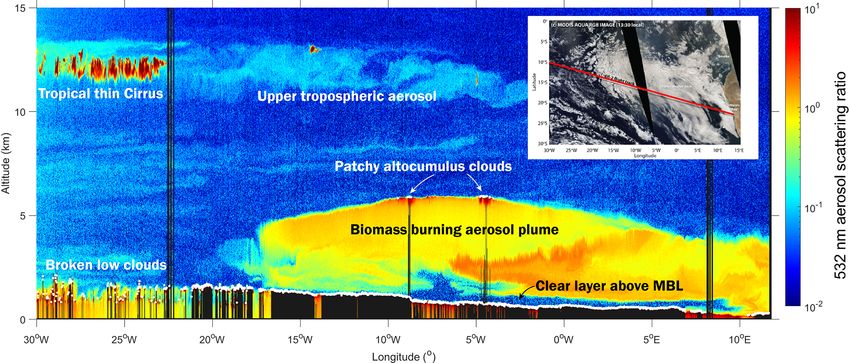
J. Redemann et al.: An overview of the ORACLES project                                                                                    1513

Figure 3. Aerosol optical depth at 440/441 nm (a) from AERONET sites in southern Africa peaks in early September, while SSA at
440/441 nm (b) shows a significant increase between August and November. Red circles in the inset indicate the few stations operating
between 2011 and 2013. Both panels contain data from 1995 to 2013 to represent the state of knowledge prior to the ORACLES deploy-
ments.

Table 1. A summary of ORACLES science questions and related objectives.

        Science questions                            Related science objectives
        Q1: what is the direct radiative effect      O1-1 (aerosol spatial evolution): determine the evolution of the BB aerosol mi-
        of the African biomass burning (BB)          crophysical and spectral radiative properties as the aerosol is transported across
        aerosol layer in clear- and cloudy-sky       the South Atlantic.
        conditions over the SE Atlantic?             O1-2 (aerosol-induced radiative fluxes): measure aerosol-induced spectral ra-
                                                     diative fluxes as a function of cloud albedo and aerosol properties.
                                                     O1-3 (seasonal aerosol variation): assess the key factors that control the sea-
                                                     sonal variation in aerosol direct effects.
        Q2: how does absorption of solar radia-      O2-1 (relative vertical distribution): determine the seasonally varying relative
        tion by African biomass burning (BB)         vertical distributions of aerosol and cloud properties as a function of distance
        aerosol change atmospheric stability,        from shore.
        circulation, and ultimately cloud prop-      O2-2 (aerosol–cloud heating rates): constrain aerosol-induced heating rates for
        erties?                                      aerosol layers above, within, and below cloud.
                                                     O2-3 (cloud changes due to aerosol-induced heating): investigate the sensitivity
                                                     of cloud structure and condensate to aerosol-induced heating rates.
        Q3: how do BB aerosols affect cloud          O3-1 (mixing survey): survey the location and extent of aerosol mixing into the
        droplet size distributions, precipitation,   boundary layer (BL) and its seasonal variation.
        and the persistence of clouds over the       O3-2 (cloud changes due to aerosol mixing): measure changes in cloud micro-
        SE Atlantic?                                 physical properties, albedo, and precipitation as a function of aerosol mixing
                                                     into the BL.
                                                     O3-3 (cloud changes due to aerosol-suppressed precipitation): investigate the
                                                     sensitivity of cloud structure and condensate to aerosol-induced suppression in
                                                     precipitation.

derivation of heating rates, observations of aerosol and cloud            by recent (same-flight or previous-flight) observations. When
microphysical and radiative properties, atmospheric ther-                 the P-3 was the sole NASA aircraft deployed (August 2017
modynamics, and chemistry. The desired flight plans were                  and October 2018), Research Scanning Polarimeter (RSP)
driven by expected aerosol–cloud features and their inter-                and High Spectral Resolution Lidar (HSRL-2) instruments
actions within the region, by regional model forecasts, and               (Table A4) were added to its payload to capture relevant sci-

https://doi.org/10.5194/acp-21-1507-2021                                                     Atmos. Chem. Phys., 21, 1507–1563, 2021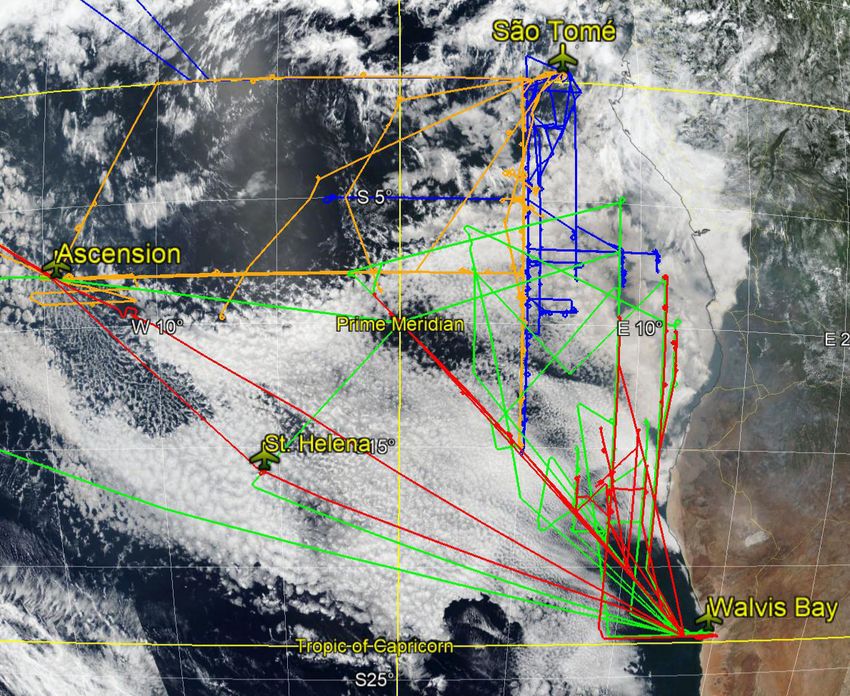
1514                                                              J. Redemann et al.: An overview of the ORACLES project

ence data by flying above, within, and below aerosol lay-          ments: cloud suite (UND/OU); phase Doppler interferom-
ers and clouds. When both the P-3 and ER-2 were present            eter (PDI); Hawaii Group for Environmental Aerosol Re-
(September 2016), the ER-2 served in a remote-sensing role,        search (HiGEAR) in situ measurement suite for aerosols;
obviating the need for the P-3 to fly above both cloud and         SSFR/CG-4 for radiative fluxes; Spectrometer for Sky-
aerosol layers.                                                    Scanning, Sun-Tracking Atmospheric Research (4STAR) for
   It was known from the planning stage that the range of          aerosol optical depth, cloud, and sky radiances; Airborne
the P-3 aircraft was dependent on payload and flight pat-          Third Generation Precipitation Radar (APR-3) for cloud and
tern flown; spirals and low-altitude flight reduce flight time.    precipitation observations; Research Scanning Polarimeter
Based on DISCOVER-AQ’s successful inclusion of spirals             (RSP); CO Measurements and Analysis (COMA) for CO,
from 1000 to 5000 ft (305 to 1525 m) during 8 h flights, OR-       CO2 , and H2 O mixing ratios; CCN spectrometer for cloud
ACLES flights were expected to be similar in duration and          condensation nuclei; and Water Isotope System for Precip-
character. From Walvis Bay, Namibia, this covered the target       itation and Entrainment Research (WISPER) for water iso-
science zone (5 to 35◦ S, westward from the coast to approx-       tope measurements. In certain years there were targeted ad-
imately the prime meridian), transit to Ascension Island for       ditions/deletions, listed as follows.
suitcase flights and for coordination with the UK’s CLAR-
IFY team, and transit to São Tomé Island, located near the           – The HSRL-2 was added to the P-3 payload for deploy-
northern edge of the climatological BB plume, with margins             ments without the ER-2, i.e., 2017 and 2018.
for headwinds, profiles, and low-altitude flight.                    – Advanced Microwave Precipitation Radiometer
   During the 2016 deployment, it became obvious that there            (AMPR) was included in the first deployment year only
was merit in P-3 flights that extended beyond the originally           (2016), when the ER-2 also carried the HSRL-2 and
estimated 8 h duration. The NASA P-3 crew accommodated                 RSP.
this request as far as crew rest considerations permitted; the
average flight duration for local P-3 science flights (exclud-       – The PTI (photothermal interferometer) was included in
ing transits) in 2016 was 8.3 h (see Sect. 4.4). In 2017 and           the 2016 and 2018 deployments only, as it suffered a
2018, while flying from São Tomé, a larger P-3 flight crew             failure before the 2017 deployment.
was able to average 9.1 and 8.3 flight hours respectively for
                                                                     – The counterflow virtual impactor (CVI) was added for
similar flights, with the 2018 average affected by increased
                                                                       2017 and 2018 as part of WISPER to enable cloud resid-
safety margins due to expected inclement weather.
                                                                       ual aerosol and droplet water isotope ratio measure-
   For ORACLES, ER-2 flights were envisioned to be up
                                                                       ments.
to 8 h in duration, similar to the prior Studies of Emissions
and Atmospheric Composition, Clouds and Climate Cou-                 – An aerosol filter system (AFS) for trapping aerosol par-
pling by Regional Surveys (SEAC4RS) campaign. Due to the               ticles for post-flight analysis was added in 2017 and
2 h pre-flight hands-off period and pilot 12 h duty day, there         2018.
were concerns that weather delays (e.g., low ceilings) would
result in flight duration limitations and therefore limita-          – In 2017 and 2018, a duplicate cloud droplet probe
tions in the final geographical coverage. The ER-2 deployed            (CDP) was mounted in a position more forward relative
only once for ORACLES, to Walvis Bay, Namibia, during                  to the leading edge of the wing, in an attempt to de-
September 2016. The payload consisted of the Enhanced                  termine whether proximity to the leading edge affected
MODIS Airborne Simulator (eMAS), Airborne Multiangle                   cloud particle measurements.
SpectroPolarimetric Imager (AirMSPI), RSP, and HSRL-2                – In 2018, two customized versions of the sunshine pyra-
(Table B2) for various aspects of cloud composition, aerosol           nometer (Badosa et al., 2014) were added to the P-3, as
properties, and the overall cloud/aerosol morphology, as well          was a nadir-viewing geo-referenced and radiometrically
as the Solar Spectral Flux Radiometer (SSFR) for radiative             calibrated fish-eye camera.
flux measurements. The aircraft operated as expected, and
the average flight duration from Walvis Bay was 8.1 h. Es-         As part of ORACLES, two new AERONET stations were
pecially during the second half of the campaign, the ER-2          established, i.e., the “Namibe” site in Namibe, Angola,
pilots were extremely accommodating, frequently extending          and the “SEGC_Lope_ Gabon” site near Libreville, Gabon.
individual flight duration to 9 h.                                 Many other sites in the region were revamped or established
                                                                   with separate funding and are shown in Fig. 1 (see https:
2.3.3   Choice of instrumentation                                  //aeronet.gsfc.nasa.gov/cgi-bin/site_info_v3, last access: De-
                                                                   cember 2019, for a list of sites).
In this section, we discuss the choice of instrumentation for         Tables B1 to B3 in Appendix B provide full payload ta-
each platform and deployment. Depending on ORACLES                 bles, including instrument names, instrument descriptions,
deployment year, the P-3 carried 8 to 11 instruments or in-        primary measurements, and derived geophysical observables
strument suites, with the following included for all deploy-       for each instrument.

Atmos. Chem. Phys., 21, 1507–1563, 2021                                             https://doi.org/10.5194/acp-21-1507-2021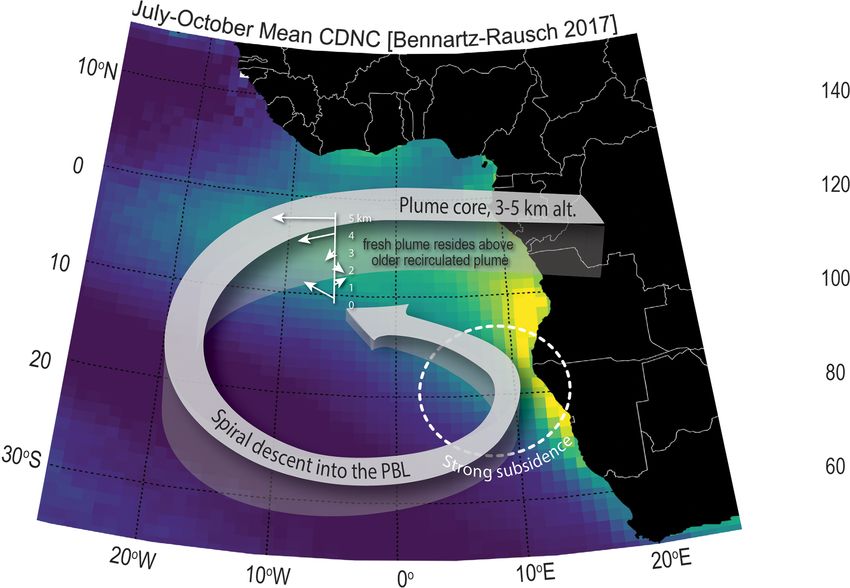
J. Redemann et al.: An overview of the ORACLES project                                                                        1515

2.3.4   Experiment strategy: dry-run exercise                       plume. However, middle and high clouds were also impor-
                                                                    tant since the presence of these clouds complicated the ra-
ORACLES conducted a 2-week “dry-run” activity from 14–              diation measurements of some instruments (e.g., 4STAR,
28 September 2015, prior to its first deployment in 2016.           SSFR). Verification studies prior to the ORACLES deploy-
Project meteorologists, platform scientists, pilots, and the        ments showed that the European Centre for Medium Range
leadership team met by phone and Cisco Webex to exam-               Weather Forecasts (ECMWF; Pappenberger et al., 2008;
ine daily weather forecasts, chemical weather predictions,          ECMWF Newsletter, 2012; Ye et al., 2014) and United King-
and flight conditions. In response to these forecasts, de-          dom Meteorological Office (UKMO; Ran et al., 2018) global
tailed flight plans were developed for the upcoming 1 or            forecast models provided the best performance for cloud
2 possible flight days, using a flight planning tool that           forecasts. ECMWF digital data were available at 0.125◦ lon-
was specifically designed for multi-aircraft flight operations      gitude × latitude resolution and included the primary meteo-
(LeBlanc, 2018). Longer-range forecasts up to 5 d were used         rological variables (relative humidity and horizontal winds at
to plan for extended flight strategies relative to overarching      925, 850, 800, 700, 600, 500, 400, 300, 150, and 100 hPa lev-
flight objectives. Satellite data, primarily Meteosat-10 Spin-      els; 1000–500 hPa layer thickness; surface wind speed; mean
ning Enhanced Visible and Infrared Imager (SEVIRI) visible          sea level pressure; boundary layer height; precipitation; con-
imagery and Cloud-Aerosol-Transport System (CATS) and               vective available potential energy) as well as 3-D ice and liq-
CALIPSO vertical feature mask and attenuated backscatter            uid water mass. We also used the 2-D ECMWF products of
profiles, were used to evaluate the likely success of a given       cloud fraction and cloud base for the low, middle, and high
flight plan for a given day. The process familiarized the sci-      clouds, which were found to be adequate for our forecast-
ence team with items that impacted real flight planning: air-       ing requirements. The ECMWF cloud forecasts were supple-
craft limitations, staff fatigue limits (e.g., down days, crew      mented by low, middle, and high cloud distribution forecasts
rest), aviation authority coordination timelines, the availabil-    from the UKMO global forecast model. In order to forecast
ity and latency of meteorological forecasts, and the use of         the overall circulation over the southeast Atlantic, with an
the flight planning tool. This practice time made ORACLES           emphasis on wind and relative humidity distributions from
actual deployments more efficient, although the complexity          the surface to 500 hPa, we used a suite of forecast products
and scope of actual chemical and meteorological forecasts in        from ECMWF, UKMO, Global Forecasting System (GFS)
the field ended up being well beyond the scope of the dry-          from the National Centers for Environmental Prediction (En-
run exercise. This increased complexity was undoubtedly the         vironmental Modeling Center, 2003), and the NASA God-
result of lessons learned during the dry-run exercise itself.       dard Earth Observing System, Version 5 (GEOS-5) model
                                                                    (Molod et al., 2012).
2.3.5   Experiment strategy: forecasting and flight                    Our primary nowcasting tool during the flights was the
        planning                                                    geostationary satellite imagery from the SEVIRI instrument
                                                                    aboard Meteosat-10 and Meteosat-11. Raw imagery from the
The forecasting effort for ORACLES deployments in the               infrared and visible channels was useful for establishing the
field entailed both meteorological and chemical weather pre-        evolution and distribution of clouds during flight. Satellite
dictions. The meteorological forecasting effort for the OR-         cloud properties described by Minnis et al. (2008, 2020) were
ACLES mission consisted of three components: (i) forecast-          calculated from SEVIRI raw radiances by NASA Langley,
ing for flight planning, (ii) nowcasting during flights for real-   including cloud altitude, water path, and effective radius, and
time flight direction, and (iii) forecasting local weather for      were also used in real-time flight direction. For forecasting
flight operations. Each of the three ORACLES deployments            local weather for flight operations, particularly during the
featured daily planning meetings. On non-flight days, the           October 2018 deployment in São Tomé, we primarily relied
flight planning team met at 08:00 local time to discuss the         on satellite imagery over the past 12–24 h for a short-term
weather and chemical weather forecasts for a period of up to        (i.e., a day or less) outlook of heavy precipitation at the air-
5 d, with special emphasis on the upcoming 1 or 2 flight days.      port, as precipitation forecasts from the models were largely
On flight days, the team would assemble at 05:00 local time         unreliable.
to assess whether the latest forecasts warranted any changes           Chemical forecasts were done using both global and re-
to flight plans made the day prior. Also on flight days, the        gional models, with the regional models providing a lot of the
forecast team would provide in-flight nowcasting that often         detail required for flight planning on a daily basis. We used
led to significant adjustments of flight plans, usually to re-      three global systems: GEOS5 (https://gmao.gsfc.nasa.gov/
spond to actual cloud conditions that materialized on a given       GEOS/, last access: May 2020), the Copernicus Atmosphere
flight day or in response to changing local conditions.             Monitoring Service (CAMS, https://atmosphere.copernicus.
   Clouds were the primary focus of the meteorological fore-        eu/, last access: May 2020), and a bespoke three-component
casting effort for both flight planning and nowcasting. Low         aerosol (carbonaceous, mineral dust, and industrial pollu-
clouds (i.e., stratocumulus at the inversion) were of primary       tion) modeling system developed by the UK Met Office for
scientific interest for their interaction with the African smoke    their CLARIFY deployment in 2017. Five-day aerosol fore-

https://doi.org/10.5194/acp-21-1507-2021                                             Atmos. Chem. Phys., 21, 1507–1563, 2021
1516                                                              J. Redemann et al.: An overview of the ORACLES project

casts provided the expected spatial and vertical location of       the routine flight track was along a diagonal with endpoints
the main smoke coming from the African continent. These            of 20◦ S/10◦ E and 10◦ S/0◦ E; in 2017 and 2018 the routine
models were also useful in identifying times when the smoke        flight track extended from the Equator to ∼ 15◦ S along 5◦ E.
was expected to be mixed with dust aerosols, especially dur-       See Fig. 11 in Sect. 4.4 for a complete set of flight tracks.
ing the 2016 deployment from Walvis Bay.                              In situ observations of aerosol microphysical and opti-
   For regional model forecasts, two configurations of the         cal properties during the routine flights were envisioned to
Weather Research and Forecasting Model (WRF; Skamarock             map the evolution of BB aerosol radiative properties during
et al., 2008) were employed. One of them used WRF cou-             transport. HSRL-2 (High Spectral Resolution Lidar) obser-
pled to chemistry (WRF-Chem, Grell et al., 2005) using the         vations from the P-3 or ER-2 helped map the spatial extent
physics package from the Community Atmosphere Model                of the layers, while SSFR (Solar Spectral Flux Radiometer)
version 5 (CAM5, Ma et al., 2014), run by a team from the          and 4STAR (Spectrometer for Sky-Scanning, Sun-Tracking
University of Iowa (WRF-CAM5, PI: Gregory Carmichael).             Atmospheric Research) observations provided additional in-
This model provided daily 72 h aerosol forecasts for similar       sights into the in situ-derived aerosol properties via opti-
purposes as for the global models by using a full chemistry        cal and radiative closure experiments. Measurements to ad-
suite with hundreds of chemical species considered. WRF            dress seasonal variations in direct aerosol radiative effects
was also configured using an aerosol-aware microphysics            and their controlling factors were derived from the routine
(AAM) scheme (Saide et al., 2016) maintained by a team             flights. The routine flight requirements were derived based
from NCAR/UCLA (PI: Pablo E. Saide). The Weather Re-               on the assumption that the statistics of important observed
search and Forecasting aerosol-aware microphysics (WRF-            aerosol and cloud properties, given sampling and measure-
AAM) model provided forecasts for lead times of up to 4 d at       ment uncertainties, are sufficiently constrained to distinguish
12 km resolution. The system included a near-real-time emis-       between climate model estimates. For this, we assumed that
sion constraint using satellite-based aerosol optical depth        the variability in aerosol properties at model-relevant scales
(Saide et al., 2016), which to our knowledge corresponds to        (100 km2 ) can be extrapolated from the analysis of Shi-
the first near-real-time system to perform such tasks. Two         nozuka and Redemann (2011) to be less than 20 % and that
simulations were performed per forecasting cycle turning           such variability is well below the inter-model differences on
smoke emissions on and off in the model. Since WRF-AAM             such scales.
resolves aerosol–cloud–radiation interactions, these simula-          Another motivation for the routine flights was to ensure
tions allowed assessment of the effects of smoke on weather        sampling of a wide range of aerosol loadings and cloud con-
in forecasting mode by taking the difference between the two       ditions. The five to six envisioned routine flights (equaling
forecasts. The forecasts also included tracers tagged to each      ∼ 40–50 flight hours per deployment) that comprise the OR-
day of smoke emissions from the African continent, which           ACLES threshold science objectives were intended to yield
were used to provide a distribution of smoke age based on          aerosol and cloud data in about 200 100 km2 climate model
the tracer concentrations and the days since emissions. Statis-    grid boxes. Prior to the start of the campaign, we investi-
tics such as mean and mode were extracted from the age dis-        gated probability density functions (PDFs) of MODIS daily
tribution and used for flight planning to target plumes with       1 × 1◦ averaged AOD between 10–20◦ S and 5◦ W–5◦ E for
different ages to explore the temporal evolution of aerosol        September 2001 derived from the then-available dark target
properties.                                                        algorithm. We randomly subsampled the roughly 3000 1×1◦
   Another task performed during the planning meetings was         MODIS AOD boxes with the planned 200 airborne observa-
near-real-time evaluation of the forecasts. These were fo-         tions and found that the resulting PDFs were a good repre-
cused on assessing forecast performance in predicting clouds       sentation of the parent population of MODIS AOD. We con-
and the aerosol plume location, and relied mostly on the lat-      cluded that the number of threshold science flight hours was
est SEVIRI cloud retrievals, and clear-sky and above-cloud         adequate to compile probability density functions of aerosol
AOD from MODIS. This exercise allowed the team to track            properties that allow assessments of climate model differ-
forecast failures and successes and provided a sense of relia-     ences at these spatial scales. This was confirmed by analysis
bility when making decisions based on forecasts.                   after the first deployment (Shinozuka et al., 2020).
                                                                      About half of the flight hours in each campaign focused
2.3.6   Routine flights vs. target-of-opportunity flights          on targets of opportunity, as detailed in Tables A1–A3 in Ap-
                                                                   pendix A. These flights targeted specific science goals (e.g.,
The ORACLES investigation concept featured a combina-              capturing a range of aerosol ages, or contrasting conditions
tion of routine flights to facilitate comparisons with climate     in terms of aerosol–cloud interactions). Flight patterns (e.g.,
models and to ensure sampling of a wide range of aerosol           “radiation walls”, square spirals) were optimized to leverage
loadings and cloud conditions, with other flights addressing       the measurement capabilities of the range of instruments on
“targets of opportunity”. The “routine” flights all took place     board the P-3 and to allow for later comparison of differ-
along a fixed latitude–longitude line with sampling at a range     ent methods of measuring a common parameter (e.g., aerosol
of altitudes and remote sensing of the full column. In 2016,       SSA). During the 2017 and 2018 deployments, the target-of-

Atmos. Chem. Phys., 21, 1507–1563, 2021                                             https://doi.org/10.5194/acp-21-1507-2021
J. Redemann et al.: An overview of the ORACLES project 1517
opportunity flights were planned to be near the routine flight Island from June 2016 through October 2017 for the LA-
track whenever possible to improve sampling statistics. SIC project (Zuidema et al., 2015). All four campaigns were
active in August–September 2017, and a “suitcase” flight to
2.3.7 Considerations for 2016 deployment with ER-2 Ascension Island by the NASA P-3 plane included a direct
and P-3 instrument intercomparison flight with the CLARIFY BAe-
146 on 18 August 2017. Collaboration between all four cam-
The planning for the 2016 field deployment in Namibia paigns continued through a joint data workshop held in Paris
started in early 2015, with multiple site visits to the Walvis in April 2019, prior to a joint session at the annual meeting
Bay airport, logistics and hotel providers, Namibian science of the European Geophysical Union. The excitement gener-
partners, and representatives of various Namibian govern- ated from sharing insights and points of view, some similar
ment organizations. This planning started early because the and some not, from the individual campaigns led to a deci-
unexpected change to deploy both ORACLES aircraft in sion to hold another joint workshop in May 2020, planned
2016 brought along a significant set of challenges due to for the United States but held virtually due to the COVID-
the large contingency of scientific and aircraft support equip- 19 pandemic. In one example, a different view of the rela-
ment needed, with this being the first of the three ORACLES tionship of the single-scattering albedo to aerosol aging was
deployments. The ORACLES team gratefully acknowledges noted, with ORACLES scientists focusing more on the verti-
the help provided by the Honorable Thomas F. Daughton, cal structure (Fig. 12) and CLARIFY scientists interested in
US Ambassador to Namibia from 2014 to 2017, and the sup- investigating the change in SSA with distance from the con-
port by the US embassy staff led by John Kowalski. The US tinent. The latter is an excellent example of the synergism
embassy proved instrumental in receiving flight permissions afforded between the two campaigns, with ORACLES sam-
and in arranging the student program in August 2016. The pling air closer to the continent and the CLARIFY campaign
ORACLES team also received invaluable feedback and sup- sampling ∼ 1700 km offshore.
port from the Namibia University of Science and Technology
(NUST), led by its rector, Tjama Tjivikua, and Dean Lameck 2.5 Outreach efforts
Mwewa. In addition to NUST, the Gobabeb Training and
Research Center led by Gillian Maggs-Kolling, the Uni- 2.5.1 Namibia – 2016
versity of Namibia represented by Martin Hipondoka and
Michael Backes as well as North-West University (South During the field campaign held in Namibia in 2016, the gath-
Africa) represented by Stuart Piketh provided information ering of science data not only benefited the scientists directly
and logistics support throughout the 2016 campaign. As we involved in the project; through an outreach program the sci-
describe in Sect. 3.5 below, these contacts were the spring- ence was extended to the Namibian population (and to some
board for the outreach efforts that led to the deployment of extent the broader southern African region). The outreach ef-
seven graduate students in the 2016 field campaign, includ- fort was multi-tiered and aimed to inform the public, develop
ing five students from NUST and the University of Namibia. young scientists, and encourage children to enter into STEM
In their totality, we hope that the efforts expended by the fields of study. Outreach activities included public lectures,
Namibian government and the Namibian and South African interviews with local radio and newspapers, and open days
science community, as well as the reciprocating efforts by the at the airfield. In addition, ORACLES scientists traveled to
ORACLES science team, can be considered a transforma- northern Namibia for several days to participate in the Ong-
tional effort in the context of science diplomacy (Annegarn wediva Annual Trade Fair (OATF) together with students,
and Swap, 2012), at least in so far as the experience for the staff, and faculty from the University of Namibia (UNAM),
individual students that participated in the outreach efforts the Namibia University of Science and Technology (NUST),
are concerned. and the Gobabeb Research and Training Center. The OATF
showcased collaborative environmental research from partic-
2.4 Linkage with international deployment efforts ipating research institutes and was attended by Ongwediva-
(LASIC, CLARIFY, AEROCLO-sA) area students, business leaders, and local dignitaries.
In addition to these broader public engagement outreach
ORACLES was not the only recent experimental investiga- activities, a targeted science development program was ini-
tion in the southeast Atlantic (see Fig. 1). The UK CLAR- tiated with support from the US Embassy in Namibia and
IFY project, which deployed their BAe-146 plane from As- NUST. This 3-week full immersion outreach program was
cension Island in August–September 2017 (Haywood et al., developed to provide promising local and regional young sci-
2020), and the French AEROCLO-sA project, which de- entists with an opportunity to experience different compo-
ployed a Falcon-20 plane from Walvis Bay, Namibia, in Au- nents of a large complex airborne research field campaign. In
gust 2017 (Formenti et al., 2019), shared similar science ob- total, seven post-graduate students (master’s and PhD level),
jectives with ORACLES, as did the DOE Atmospheric Radi- from Namibia (five students) and South Africa (two stu-
ation Measurement mobile facility deployment to Ascension dents), participated in the student guest program (Fig. 4).
https://doi.org/10.5194/acp-21-1507-2021 Atmos. Chem. Phys., 21, 1507–1563, 20211518 J. Redemann et al.: An overview of the ORACLES project
Student guests were exposed to the planning, modeling, and global networks of spectrometers designed to retrieve, re-
instrumentation used within the ORACLES field campaign. spectively, aerosol optical depth and microphysical param-
In addition to these broad field campaign skills, they received eters (Holben et al., 1998; Dubovik and King, 2000), and
a solid foundation in basic atmospheric science through tuto- total columns of ozone and other trace gases in the atmo-
rials from the participating campaign scientists, some intro- sphere from direct-Sun measurements (Herman et al., 2009,
ductory programming tutorials, and an opportunity to inter- 2015; Tzortziou et al., 2012). All lectures were presented by
act with scientists aligned with their field of research. Within ORACLES science team members in Portuguese to address
the duration of the program they also all had an opportu- potential language barriers.
nity to join a science flight. Further regional expansion of A Pandora Spectrometer Instrument (PSI) and an
this student guest program was planned for the 2017 and AERONET instrument were brought to STP as part of the
2018 field campaigns in collaboration with the CLARIFY ORACLES deployment. The main goal, especially for the
and AEROCLO-sA campaigns, but with the move of the OR- PSI deployment, was to assess whether mutual goodwill, in-
ACLES field campaigns to São Tomé this expansion outreach terest, and capabilities exist for NASA, USTP, and INM to
effort could not be implemented. collaborate scientifically long term. The team was successful
in training professors of the USTP to operate the PSI and the
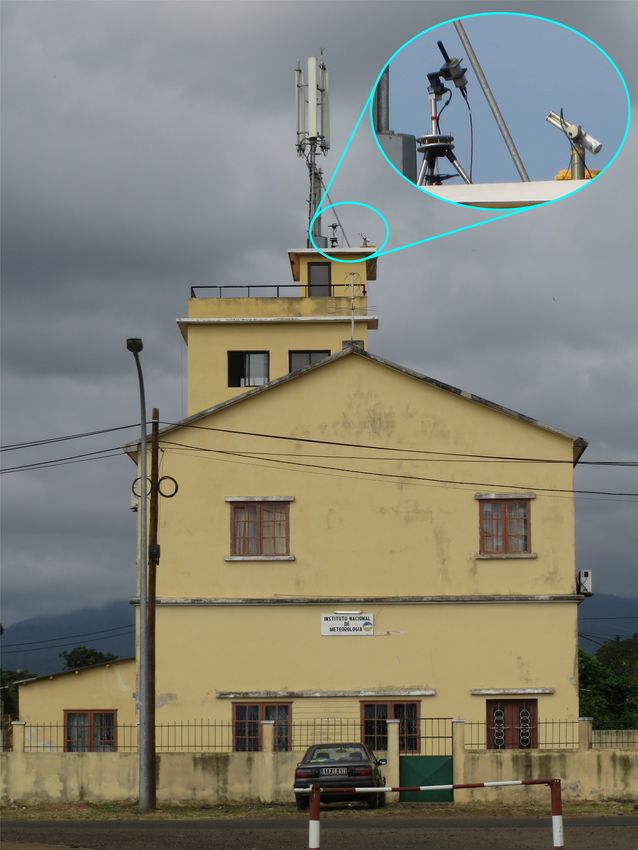
2.5.2 São Tomé and Príncipe (STP) – 2017 and 2018 AERONET instruments (Fig. 5), and this resulted in addi-
tional aerosol measurements beyond the campaign periods.
To understand the challenges of implementing an outreach Moreover, it laid the foundation to have STP as one of the
program as part of a scientific project like ORACLES in São sites of the Pandora network, with an official agreement be-
Tomé and Príncipe (STP), one needs to know a little about the tween NASA and the USTP signed in 2018.
history of this young country of just over 200 000 inhabitants. The ORACLES team found in STP a community open to
Previously uninhabited, the STP Archipelago was colonized and eager for the establishment of a fruitful scientific coop-
by Portugal throughout the 16th century, when it served as eration. Our experience points out that involvement with the
a warehouse for the slave trade and established itself as a local community is of extreme importance, not only for the
producer of sugarcane, coffee, and cocoa. STP independence dissemination of scientific knowledge but also to facilitate
from Portugal came in 1975, keeping Portuguese as its offi- engagement between the young scientists from both commu-
cial language, although minority groups also speak at least nities. Collaboration with local scientific communities during
four other dialects. field deployments such as ORACLES has the dual benefits of
During an initial exploratory visit in 2015, built on a previ- enhancing local scientific capabilities in under-resourced ar-
ous NSF-sponsored site visit, the ORACLES team contacted eas of the world and producing tangible benefits for this and
the Instituto Nacional de Meteorologia (INM) to establish future missions in the region.
collaborations. The INM operates at STP airport facilities
and showed great initial enthusiasm for ORACLES deploy-
ments from STP. During the 2 years of ORACLES opera- 3 Description of deployments
tions in 2017 and 2018, INM kindly issued daily weather re-
ports tailored to ORACLES needs. There were several visits 3.1 Meteorological context
from the ORACLES team to INM, and Aristómenes Amadeu
do Nascimento of INM attended various ORACLES weather The key feature of the circulation that transports fire emis-
briefings. sions from the African continent over the southeast At-
The only public university in STP and the most impor- lantic is the easterly flow above about 2 km. Figure 6 shows
tant one, the University of STP (USTP), was established the 4 km flow and relative humidity (RH) from the ERA-
only in 2014. The creation of USTP came to address fun- Interim reanalysis, along with the southerly limit of signif-
damental and emergency problems of the country, which in- icant rainfall from the monthly 0.25◦ satellite-based 3B43
cluded training of personnel for the health and education dataset (Huffman et al., 2007) for the 19-year September
sectors, agriculture, and food production. When the ORA- mean (2000–2018). The easterly flow maximizes around
CLES team deployed to STP in 2017, USTP had, in its cur- 8◦ S, reaching minima near 4◦ N and 18◦ S. This flow is
rent format, only 2 years of existence, still consolidating its maintained by the thermally direct circulation over the con-
vocations and priorities. Nevertheless, the institution repre- tinent, which is driven by heating of the elevated African
sented by Aires Bruzaca (dean), João Pontífice (vice dean), plateau south of 10◦ S (Adebiyi and Zuidema, 2016). The
and Manuel do Sacramento Ramos Penhor was enthusiastic moister regions to the north are cooler, consistent with the
about establishing scientific collaborations with NASA. thermal wind relation and the easterly shear below the jet.
The ORACLES team organized a series of seminars about The jet is similar in character to the northern African East-
ORACLES scientific objectives for the USTP and INM com- erly Jet (NAEJ; consistent with the temperature gradient be-
munities. The seminar themes also included the AERONET tween the hot Sahara desert and the cooler equatorial region),
(Aerosol Robotic Network) and Pandora NASA projects, if not as pronounced. Since there is no heating source over
Atmos. Chem. Phys., 21, 1507–1563, 2021 https://doi.org/10.5194/acp-21-1507-2021You can also read