The Dealership of Tomorrow 2.0: America's Car Dealers Prepare for Change - February 2020 - National Automobile ...
←
→
Page content transcription
If your browser does not render page correctly, please read the page content below
The Dealership of Tomorrow 2.0:
       America’s Car Dealers Prepare for Change

                                                          February 2020

                                       An independent study by Glenn Mercer
                    Prepared for the National Automobile Dealers Association
The Dealership of Tomorrow 2.0
America’s Car Dealers Prepare for Change
by Glenn Mercer

Introduction
This report is a sequel to the original Dealership of Tomorrow: 2025 (DOT) report, issued by NADA in
January 2017. The original report was commissioned by NADA in order to provide its dealer members (the
franchised new-car dealers of America) perspectives on the changing automotive retailing environment.
The 2017 report was intended to offer “thought starters” to assist dealers in engaging in strategic
planning, looking ahead to roughly 2025.1

In early 2019 NADA determined it was time to update the report, as the environment was continuing to
shift. The present document is that update: It represents the findings of new work conducted between May
and December of 2019.

As about two and a half years have passed since the original DOT, focused on 2025, was issued, this
update looks somewhat further out, to the late 2020s.

Disclaimers
As before, we need to make a few things clear at the outset:

     1. In every case we have tried to link our forecast to specific implications for dealers. There is
        much to be said about the impact of things like electric vehicles and connected cars on society,
        congestion, the economy, etc. But these impacts lie far beyond the scope of this report, which in
        its focus on dealerships is already significant in size. Readers are encouraged to turn to academic,
        consulting, governmental and NGO reports for discussion of these broader issues.

     2. Secondly, while this report was commissioned by NADA, this report is not an NADA position
        paper. The views and opinions expressed in this report are those of the author’s sources, as
        interpreted by the author, and accordingly in various cases do not align with NADA’s own views or
        perspectives. The goal of the report is to project the most likely future dealers might face—not the
        future that dealers might want to face. The author attests that NADA personnel, beyond specifying
        the general scope of the report, made no substantive changes to any of the content of the report.
        There were only two exceptions to this general rule of complete editorial independence. First,
        the author did consult NADA attorneys for their review of any comments made on any legal or
        regulatory matters, as the author is not an attorney and sought to avoid errors of interpretation of
        laws or regulations. Second, the author solicited input from NADA subject matter experts for the
        “Data Challenge” appendix.

1
 The 2017 DOT is incorporated by reference into this update, as it contains useful material not repeated here, such as a discussion of the history of the
U.S. dealer system.

The Dealership of Tomorrow 2.0                                                                                                                          i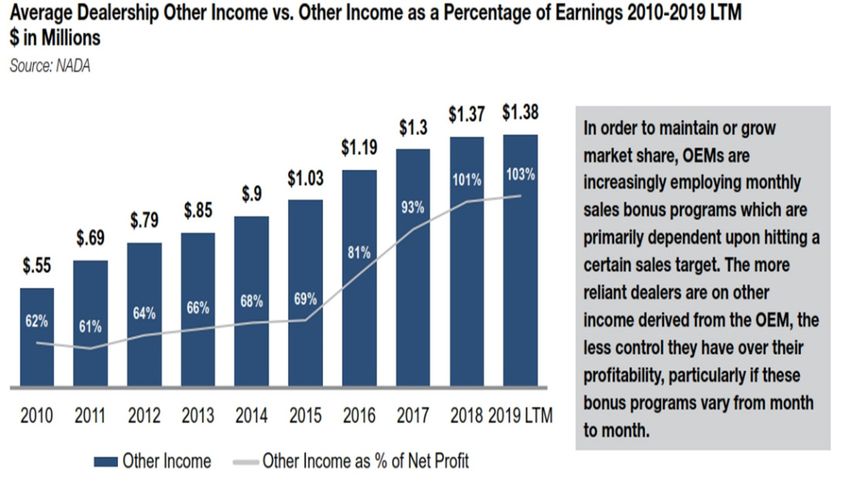
3. The view of the author, developed over the course of three decades of automotive industry work,
        is that change takes place at a slower rate than most of the pundit class would prefer, and that
        change moves toward new periods of equilibrium, versus toward endless upward extrapolation.
        Many changes forecasted years ago never occurred at all (e.g., the rise to dominance of “build
        to order” [versus “buy from stock”], multi-branding of stores). Other changes have occurred, but
        more slowly than most expected (e.g., penetration of electric vehicles, aluminum displacement
        of steel in cars). And other changes have resulted in new equilibria (e.g., online services that
        once aspired to be disintermediators, are now mostly lead generators). There is in our industry
        such an enormous legacy of history, processes and institutions—the sum total of over a century
        of formation and dissolution of OEMs, suppliers, dealers, garages, rules, regulations, inventions,
        habits, traditions and more—that rapid change faces massive frictional drag. So you will see
        in this report, in many cases, agreement with the direction of various forecasts of change, but
        disagreement with the pace of change projected.

     4. It is important to be clear that each dealership should decide itself the extent to which it agrees,
        if at all, with the matters set forth in this report and the extent to which, if at all, it will operate
        in response to any of the matters set forth in this report. Nearly every dealership that receives
        this report competes with another that receives this report, and each needs to make its own
        independent decisions regarding how it will operate its dealership—and not by communicating
        with any competing dealership regarding this report or regarding any matter that might concern
        competition between dealerships.

Report Summary
Our research convinces us of a positive outlook for the American franchised new-car dealership system.
This is the same conclusion we reached in 2017, and we stand by it. While we do foresee much change
to the dealership over the next decade, and probably some compression of profitability, we do not project
revolutionary change or, as it is popularly put, “disruption.” But below this top-line conclusion some of our
perspectives have shifted.

For one thing, it is clear that we are moving from a Recession Recovery era (in which rising sales lifted all
boats) to the Age of the Operator, where better-managed stores are likely to open a clear lead. The steady
recovery in sales since The Great Recession seems to have plateaued, if at a very satisfactory level, thus
necessitating this shift in focus.

For another, there has been an inversion of the relative threat to the dealership system, to “inside”
from “outside” trends. There had been worry that outside threats (e.g., EVs, AVs) would overwhelm the
industry—while current operations stayed strong. Now that the hype around these outside issues has
cooled, they’re seen as less worrisome—but conversely, dealers are more concerned about inside issues,
such as erosion of near-term financial performance, and the impact of an (eventual) recession.

This is not to say that we dismiss “outside” issues: In particular we do recognize that if mobility services
continue to grow, they may break the century-old linkage between being an adult American and owning a
car, and that of course would have significant implications for the auto retailing industry.

ii                                                                                                FEBRUARY 2020
Research Process
For both the original DOT and this update, the research process is the same. The author conducted
dozens of interviews of industry participants (low- and high-volume dealers, public and private stores,
OEMs, regulators, CPAs, specialist attorneys, investor groups (PE and family office), vendors to the
industry and more). The automotive press was followed in depth, and, especially for ACES,2 numerous
academic and industry studies were analyzed. In order to learn from related industries, we also consulted
with heavy-duty truck dealers and with dealer groups covering China, Canada and Europe. In order to
ensure the greatest candor among interviewees, all were promised anonymity: No quote is tied to an
identified person or company.

Report Structure
Because the automotive retailing industry is so complex (involving the sale, financing and repair of new
and used cars) and is impacted by so many broader trends (such as the rise of electric cars, autonomous
cars and mobility services such as Lyft), we have divided this report into two sections, in an attempt to
simplify the story. The first section, “Inside the Store,” deals with issues dealers are facing apart from
the so-called ACES trends. In effect, in this section we hold ACES off to the side. In the second section,
“Outside the Store,” we bring the ACES trends back into the story.

2
    Automated vehicles, connected cars, electric vehicles and (shared) mobility services

The Dealership of Tomorrow 2.0                                                                               iii
iv FEBRUARY 2020
Table of Contents
     Introduction. . . . . . . . . . . . . . . . . . . . . . . . . . . . . . . . . . . . . . . . . . . . . . . . . . . . . . . . . . . . . . .  i
     Disclaimers . . . . . . . . . . . . . . . . . . . . . . . . . . . . . . . . . . . . . . . . . . . . . . . . . . . . . . . . . . . . . . .  i
     Report Summary. . . . . . . . . . . . . . . . . . . . . . . . . . . . . . . . . . . . . . . . . . . . . . . . . . . . . . . . . . . . ii
     Research Process. . . . . . . . . . . . . . . . . . . . . . . . . . . . . . . . . . . . . . . . . . . . . . . . . . . . . . . . . .  iii
     Report Structure. . . . . . . . . . . . . . . . . . . . . . . . . . . . . . . . . . . . . . . . . . . . . . . . . . . . . . . . . . .  iii
Section I: Inside the Store. . . . . . . . . . . . . . . . . . . . . . . . . . . . . . . . . . . . . . . . . . . . . . . . . . . . . . . . . 1
     Before We Begin: The Customer. . . . . . . . . . . . . . . . . . . . . . . . . . . . . . . . . . . . . . . . . . . . . . . . . 1
     “Inside” Topic 1: The Outlook for New-Car Sales. . . . . . . . . . . . . . . . . . . . . . . . . . . . . . . . . . . . . 2
     Is There an “Affordability Crisis?”. . . . . . . . . . . . . . . . . . . . . . . . . . . . . . . . . . . . . . . . . . . . . . . . 7
     “Inside” Topic 2: The Nature of the Store. . . . . . . . . . . . . . . . . . . . . . . . . . . . . . . . . . . . . . . . . . 7
     “Inside” Topic 3: Ownership of Stores . . . . . . . . . . . . . . . . . . . . . . . . . . . . . . . . . . . . . . . . . . . . 9
     “Inside” Topic 4: Structure of the Store Network. . . . . . . . . . . . . . . . . . . . . . . . . . . . . . . . . . . . 10
     “Inside” Topic 5: Dealer Profit Trends (by Shop and Overall). . . . . . . . . . . . . . . . . . . . . . . . . . . . 12
     Will Subscriptions Alter the Very Nature of New-Car Sales?. . . . . . . . . . . . . . . . . . . . . . . . . . . . . 14
     So … What to Do? . . . . . . . . . . . . . . . . . . . . . . . . . . . . . . . . . . . . . . . . . . . . . . . . . . . . . . . . . 24
     Summary of “Inside the Store” . . . . . . . . . . . . . . . . . . . . . . . . . . . . . . . . . . . . . . . . . . . . . . . . 26
Intermission: External Learnings. . . . . . . . . . . . . . . . . . . . . . . . . . . . . . . . . . . . . . . . . . . . . . . . . . . . 26
     External Learnings Summary. . . . . . . . . . . . . . . . . . . . . . . . . . . . . . . . . . . . . . . . . . . . . . . . . . 31
Section II: Outside the Store. . . . . . . . . . . . . . . . . . . . . . . . . . . . . . . . . . . . . . . . . . . . . . . . . . . . . . . 32
     Connected Car. . . . . . . . . . . . . . . . . . . . . . . . . . . . . . . . . . . . . . . . . . . . . . . . . . . . . . . . . . . . 32
     Electric Vehicles. . . . . . . . . . . . . . . . . . . . . . . . . . . . . . . . . . . . . . . . . . . . . . . . . . . . . . . . . . . 35
     Autonomous Vehicles . . . . . . . . . . . . . . . . . . . . . . . . . . . . . . . . . . . . . . . . . . . . . . . . . . . . . . . 40
     Mobility Services . . . . . . . . . . . . . . . . . . . . . . . . . . . . . . . . . . . . . . . . . . . . . . . . . . . . . . . . . . 45
Conclusion. . . . . . . . . . . . . . . . . . . . . . . . . . . . . . . . . . . . . . . . . . . . . . . . . . . . . . . . . . . . . . . . . . 60
Acknowledgments . . . . . . . . . . . . . . . . . . . . . . . . . . . . . . . . . . . . . . . . . . . . . . . . . . . . . . . . . . . . . 61
Appendix: The Customer Interface and the Data Challenge. . . . . . . . . . . . . . . . . . . . . . . . . . . . . . . . . . . 63
     History and Outlook . . . . . . . . . . . . . . . . . . . . . . . . . . . . . . . . . . . . . . . . . . . . . . . . . . . . . . . . 63
     The Path We Are On. . . . . . . . . . . . . . . . . . . . . . . . . . . . . . . . . . . . . . . . . . . . . . . . . . . . . . . . 65
     Multiple Issues to Address. . . . . . . . . . . . . . . . . . . . . . . . . . . . . . . . . . . . . . . . . . . . . . . . . . . . 66
     Where Do We End Up? . . . . . . . . . . . . . . . . . . . . . . . . . . . . . . . . . . . . . . . . . . . . . . . . . . . . . . 68
     One More Thing: The Battle Over Data Access. . . . . . . . . . . . . . . . . . . . . . . . . . . . . . . . . . . . . . 69

The Dealership of Tomorrow 2.0                                                                                                                      v
vi FEBRUARY 2020
Section I: Inside the Store
As noted, this section assumes non-disruptive technological evolution, in order to generate a forecast
baseline, with ACES impact to be added later.

Topics addressed in this section include, in sequence from a “macro” to a “micro” perspective:

     •     New-car sales outlook
     •     The nature of the store
     •     Ownership of dealerships
     •     Structure of the store network
     •     Dealer profit trends, by shop and overall (and how profits may be improved)

Along the way we will introduce sidebars on two special topics (the “affordability crisis” and the
subscription model of vehicle usage). Finally, we are including a separate Appendix on “The Customer
Interface and the Data Challenge,” focused on the increasingly important topic of how data is handled in
the automotive retailing world. We have placed this in an appendix not because this is not a crucial issue,
but because it presents a set of challenges that deserve special, deeper treatment.

Before We Begin: The Customer
Obviously, no retail industry exists without its customers. Therefore, no projection of industry trends can
exist in the absence of a perspective about the evolution of the customer base. Despite this reality, no
primary customer research was done for this report. This is because there is an abundance of pre-existing
good research on customers already available (e.g., from Cox, from OEMs and from any number of market
research firms).3 We saw no way, within the limited scope of this effort, to discover something new that
has not already been said about the American car customer, and his or her evolution. However, we do have
a point of view. We have drawn on many of the research sources mentioned to conclude that the retail
customer of the future (fleet customers are different) on average will look like this:

     •     A bit older than today (as our population adds a year to the median age by 2030, to 39);
     •     Somewhat richer than today (we’re assuming GDP grows at 2%, but population at 1%);
     •     Even more comfortable online, but, as the offline experience continues to improve…
     •     … seeking equilibrium: from “bricks versus clicks” to “bricks and clicks” (the distinction may in
           fact be meaningless by 2030);4
     •     Probably 5 more open to different ownership models;

3
  We caution readers to treat skeptically a large portion of publicly available research on American customer needs and wants. Recall, for example, that a
vendor of IT systems aimed at improving customer satisfaction will always try to show research proving that customers are dissatisfied; otherwise, what is
the value in their product?
4
 Early signs of this trend are found among “digital native” new firms such as Warby Parker and Bonobos, whose roots are online, but which have been
adding physical retail outlets rapidly.
5
  Research on this topic is so far inconclusive, based as it is on solicitation of stated desires versus surveys of actual usage. For example, almost any
person might answer “yes” to the question “Would you like to be able to subscribe to a car, the way you do for phone service?”—but how this approval
translates into actually paying for a vehicle subscription is by no means yet clear.

The Dealership of Tomorrow 2.0                                                                                                                              1
•   Ever more likely to default to used rather than new (already, about 40 million used cars are sold
        each year, versus about 14 million new units retailed); and
    •   Consistently insistent on more and more convenience (as “trained” by Amazon, Uber Eats, Spotify
        and other instant-gratification services).

And finally, but crucially, and in the face of a constant stream of reports asserting the otherwise (see again
footnote 3), we believe that the American new-car dealership customer is actually relatively satisfied with
the dealership experience (cars sales, financing and service). Where you stand on this point is crucial to
how you will see the future, since many of the “disruptors” who are moving into the industry assert they are
given an opening by high levels of customer unhappiness. We would beg to differ, and assert that the reality
is brighter than the tired and poorly supported “car retailing is broken” trope. Let’s cite some evidence:

    •   DealerRater survey 1: “What part of the dealership sales experience could be improved the most?”
        Price negotiation 8%; salespeople 5%; delivery process 3%; F&I 3%; online responsiveness 2%;
        test drive 1%; none of the above 79%
    •   DealerRater survey 2: “What part of the dealership service experience could be improved the
        most?” Service advisor 8%; online responsiveness 5%; price negotiation 4%; service explanation
        3%; F&I 1%; none of the above 79%
    •   Reputation.com survey of online reputation and responsiveness score (higher is better): banks
        367, health care 401, retail 552, real estate 571, restaurants 584, hotels 605, car dealers 607
    •   Autotrader survey of new-car customers of dealers, percent satisfied with: length of process (time)
        56%; F&I 69%; salespeople 81%; test drive 82%; dealership overall 79%
    •   ACSI (American Customer Satisfaction Index) survey: industries (manufacturers and channels
        taken together) that rank higher than automotive (OEM and dealer): credit unions, pet food,
        breweries, electronics; industries that rank lower than automotive in customer satisfaction:
        insurance, apparel, restaurants, appliances, athletic shoes, health stores, supermarkets, banks,
        hospitals, hotels, utilities, gas stations, phone service, cable TV, airlines.
A dealer—any retailer, in fact—can always improve customer service. There is no doubt that virtually every
new-car dealer can further improve how customers are handled. But it may be more useful (and accurate)
to place the dealer industry in context: Most of its customers are pretty satisfied, and most Americans are
more satisfied with car dealers than they are with many other types of retailers. This perspective suggests
that steady ongoing incremental improvements must be made—but that there is not much case for any
kind of panicked raze-and-rebuild. Assertions that “the system is broken” are just that, assertions—and
are not made more accurate either by being repeated or by being shouted more loudly.

“Inside” Topic 1: The Outlook for New-Car Sales
Before we can talk about the nature of the new-car dealerships of the future, we have to have a point of
view on how many cars they might be selling. In the original DOT we forecast a steady-state sales rate
of 17 million units through 2025, with peaks and valleys around that level (i.e., lower than that during
a recession, higher afterward). We also forecast a slow but steady trend to higher prices, as the new-car
industry shifted upmarket. We’ve been right on both counts, though it is in the early days, of course; and
we are reiterating this same forecast today for the late 2020s.

2                                                                                             FEBRUARY 2020
In terms of the unit volume projection, our number is similar to numbers published by forecasters such as
LMC/J.D. Power, IHS and CAR (the Center for Automotive Research). The drivers of our number include
population growth (from about 330 million today to 360 million by 2030, according to the U.S. Census),
VMT (vehicle miles traveled) growth (3.2 trillion today to 3.7 trillion in 2030, on current trend), and
economic growth (using a widely accepted number for GDP gains of ~2% per year). More people driving
more miles and having more money to spend supports a strong sales rate.
But the glass here is certainly half empty: In other decades these factors would generate volume growth,
not just stability. We are thus being conservative by holding new-car volume down to 17 million. This is
in part because we see used cars becoming ever more satisfactory substitutes for new cars, as used-car
quality continues to improve (as demonstrated by the increasing age of the U.S. fleet, now pushing 12
years, up from about eight in the 1990s, per IHS Markit).
We should also discuss two other inputs into car sales forecasts that have gotten a lot of play recently:
urbanization and millennials. Both are held forth as likely to suppress new-car sales; we disagree.
The urbanization story has been that “Americans are moving back to the cities in record numbers, and in
cities there is less need to own a car, and so sales should decline.” This story is not quite true. Census
data tends to lump together urban and suburban residences into one broad “urban” category, leaving
everything else as “rural.” And by this metric indeed the “urban” fraction of the population is projected
to increase, from about 75% in 1980 to about 90% in 2040. But if we look deeper into the numbers,
as shown below, we see that the suburban population is gaining ground even faster than the true urban
population, the former adding nine points of share while the latter picks up seven. Americans may be
moving to the cities again, but they are moving to the suburbs faster, and the suburbs (and rural areas,
too) are the natural homes for the personally owned automobile, given their far-flung sprawl and abundant
free parking.
USA Population Growth by Location: Actual Past and Census Projections
Source: Department of Transportation, from Census Bureau projections
The Dealership of Tomorrow 2.0 3The millennial story was that “young people are more averse to home and car ownership than prior
generations, and so as they grow as a share of the population, car sales will decline.” This story has also
proven to be false, as millennials now represent the second-largest segment of the car-buying public, with
a trajectory that has them becoming the largest segment in a couple of years, as this chart shows:
Share of New-Vehicle Registrations by Generation
40 %
34.8 %
35
32.3 %
30
28.7 %
27.2 %
26.8 % Generation
25
24.9 % Baby Boomers
20 Millennials
Gen X
15 Matures
10.6 % Gen Z
10
8.4 %
5
3.9 %
0.5 %
0
2015 2016 2017 2018 2019
More support for the concept of millennials as robust buyers of cars comes from recent Federal Reserve
Bank research on the topic. While their analysis is complex, the key finding is clear: “Conditional on their
age and other factors, millennials do not appear to have preferences for consumption that differ significantly
from those of earlier generations.” In specifically automotive terms, this chart reinforces the point:
Real Average Annual Household Expenditures on Vehicles by Age and Generation
Source: “Are Millennials Different?,” Kurz, Li and Vine, FRB, 2018
4 FEBRUARY 2020Part of the evidence some presented in support of this story was the fact that very young people were
not acquiring driver’s licenses at the same rate as in the past. Thus if one extrapolated from a decline in
licenses among 16-year-olds to 35-year-olds, for example, one would expect a vehicle sales decline. But
more complete data show that young people are mostly deferring driver’s licenses, not abandoning them
(partly because the minimum driving age has risen in many states). As the chart below shows, the decline
in license penetration is greatest for 16-year-olds, then less for less for 18-year-olds, and so on. By their
20s, millennials have license rates roughly as high as their forebearers had at the same age. The deferral
may simply be due to younger people suffering the greatest employment shock during and after the Great
Recession: If you have no money it is indeed hard to buy a car, so why get a license? As millennials have
entered the workforce, however, this has changed.
Share of Each Age Cohort Holding a Driver’s License (percentage)
Source: FWAH
By the way, this focus on the youngest drivers misses a significant point: Older Americans are keeping their
licenses longer. Licenses for those 65 and older climbed from 32 million in 2008 to 44 million in 2017
(see Hedges & Company data). Thus, over the last decade or so, America did indeed lose about a million
drivers 19 and under, but gained about 2.5 million drivers in their 20s, and 12 million 65 or over (as per
NADA data). In 2000, America had some 190 million licenses in effect, and the number has grown to over
225 million today.
Thus we see no drag on new-vehicle sales from either the urbanization story or the millennial story.
The Dealership of Tomorrow 2.0 5(Of course, more considerations go into the sales forecast than just these: We called out these two since
they have been so much in the press lately. But we cannot ignore the fact the while total VMT has been
and looks set to continue [slowly] growing, per-capita VMT is flat or down. Factors driving this shift include
the rise in working from home or otherwise remotely, and a reduction in shopping trips as goods delivery
soars thanks to online ordering [discussed further in the “Mobility Services” section]. However, we do not
see enough pressure from these trends to alter our flat-at-17-million forecast.)
Next: If Americans will not be buying more new cars in the coming years, they will be buying more
expensive ones, such that industry revenue will grow, even if units do not. With new units stable even as
the population and economy grow, one can see that dealers are selling to a shrinking but more affluent part
of the public. New cars are becoming the province of the better off. To illustrate this, note that in 2000
we sold 17.4 million units to a population of 282 million: 6% of Americans were car buyers in that year,
more or less. In 2018 the industry sold 17.3 million units to a population of 325 million: Now only 5% are
buyers. And indeed, income data supports the hypothesis: The average household income in the U.S. today
is about $60,000, but the average income of a household buying a new car is in the range of $100,000
or higher (see Michael Sivak, Cox and Urban Science calculations). It is no wonder, therefore, that the
average age of a new-car buyer today is at least 54 (and in 1990 was 44; see IHS, University of Michigan
TRI, J.D. Power and Hedges data). The trend is visible in recent J.D. Power surveys of transaction price
trends (“Industry Health Report: November 2019”):6
Customer-Facing Transaction Price
$39k
2016 2017 2018 2019
$36k
$33k
$30k
$27k
Jan Feb Mar Apr May Jun Jul Aug Sep Oct Nov Dec
Of course, we are not projecting this trend to continue at such a rate indefinitely, but as the chart shows,
we have been adding some $750 to price (net of all discounts) each year, for several years now.
6
TrueCar’s ALG division reported an even higher average price: for December 2019, $35,900.
-
6 FEBRUARY 2020Is There an “Affordability Crisis?”
Media coverage asserts that such price increases represent an “affordability crisis,” but evidence
for this is mixed at best. Arguments for and against such a crisis existing include:
• “It’s because of low interest rates.” Undoubtedly, if rates climb demand will fall, but rates
have been flat (at low levels) for years, and so do not explain the price rise.
• “Customers’ ability to borrow is being stretched.” Unclear. In 2014 (using Experian data),
the share of open loans that were subprime or deep subprime was 19.7%—but in 2019
this has dropped, to 18.9%. Similarly, the 30-day delinquency share in 2014 was 2.4%,
and today is 2.1%. Credit does not seem stressed.
• “It’s subsidized by extending loan terms to historic durations.” True, to a point: The average
new-car loan term in 2014 was 66 months, and in 2019 was 69. But isn’t this in part
a response to longer new-car life, thanks to quality improvements? Do we think 30-year
house mortgages are excessively long, or just appropriate to the life of the asset?
• “Consumers have to spend more, as there are no entry-level models anymore.” Not true:
Low-cost subcompact cars are on the market, but customers are simply turning away from
lower-cost new cars. Used cars are the new entry-level cars, and dealers are indeed selling
used cars at a record pace. This view was supported by remarks made by J.D. Power
personnel at a recent conference, paraphrased as “It isn’t so much that everyone is paying
more; it is that low-income buyers are leaving the new-car market for the used market,
while high-income buyers stay with new, as products have gotten so much better (e.g., via
added ADAS features and CUV offerings).”
It is thus somewhat unclear to us that we are facing a “crisis” in affordability.
“Inside” Topic 2: The Nature of the Store
Now that we’ve established dealers will have vehicles to sell, the next question is how they will be sold—
specifically, whether they will be sold “online” or not. We are investigating this question due to widespread
assertions that car buying will move wholly online, just as have most purchases of books, music, plane
tickets and much more. What this might mean for dealers is a complex question, but it certainly is a trend
to be monitored and understood.7 However, to date, contentions that the physical store would soon be
replaced by purely online sales have not been proven.
Before we go on, we have to point out that one of the challenges in discussing this topic is that we have no
clear definition of what “buying online” means. If we mean purely online (I type on my keyboard and then
a car appears in my driveway), then virtually no cars are sold like that today in the U.S.: There is inevitably
some physical paperwork, some phone calls to be made, some visits to a physical location (if only to pick
7
Some pundits erroneously equate “buying a car online” with “eliminating the need for a dealer.” The two concepts are related but not identical. A car
can be bought online via a dealer, or not. And whether the car is bought online or offline, the dealer still has other roles to play, in the fields of service,
financing, collision repair, trade-in remarketing, etc.
The Dealership of Tomorrow 2.0 7up the vehicle). But once we relax that purest of definitions, things get complex quickly, as shown in this
DealerRater survey of car buyers in 2018, by percentage, who said:
• I bought online except for some paperwork: 8%.
• I did it mostly online except for some details in store: 7%.
• I did much online, but had to discuss F&I and other substantive matters at the dealership: 8%.
• I found my car online but did essentially the entire transaction at the dealership: 77%.
To take another source, Cox reports less than 5% of new-car transactions as “consummated online” (all
paperwork executed)—and with the great majority of even those transactions still involving interaction with
the physical dealership. As they put it: “Even customers who say they want to go entirely online, still ask to
see the physical facility, the documents they are signing, and the real people backing up their transaction.”
As one dealer we talked to put it, “Certainly customers like the ease of doing things online, but when
it comes time to click that last button, and watch $40,000 leave the bank account, caution enters in.”
Nevertheless, it is hard to see how more and more transactions wouldn’t move in part or in whole online,
especially for that segment of the buying public that views itself as time-constrained.8
It is not only customer conservatism that slows this trend: The transaction is highly complex (e.g., with
trade-ins to manage) and highly regulated (e.g., with odometer statements to sign). All this will be
streamlined over time, of course.
If readers feel it is only in America that the online movement is sluggish, they need only look at similar
experiences in China and Europe. Expectations that China would crack the code on online sales haven’t
been met (as we will see in the China section below). In Europe OEMs have launched numerous online-
direct pilot projects, but they all seem either stalled or stunted, in part because (as Steve Young of
ICDP put it to us) customers know “there is a deal to be had” at the physical store. Why click the online
purchase button if a trip to the nearby dealer will probably get another $300 knocked off the price?
And even in the U.S., Tesla, the pioneer in novel car-retailing methods, backtracked from an
announcement that most of its stores would close, and seems now to be keeping most of them open (and,
of course, all of the service facilities). The online trend is real, but it is slow.9
And there is one more subtle point to make (and thanks to Jeremy Alicandri for pointing this out to me).
Suppose all OEMs offer all cars for sale fully online, just like airlines offer tickets. It would then be an easy
step for a multi-brand online aggregator to emerge, like an Expedia or an Amazon, where customers could
shop all brands at once. This not only would be destructive to brand values (as 99% of all cars around the
world are sold in stand-alone single-brand boutiques), but the aggregator would certainly demand a cut of
the profits. Is this really what OEMs would like to see?
8
Though even here we have to be cautious. In “the old days” a customer might indeed spend six hours shopping and negotiating at two dealerships,
whereas nowadays they might spend only an hour at one. But often they have spent 10 more hours researching cars online. Have they actually saved
time? And have they swapped salesperson time, which is paid for, for their own labor, which they give away for free?
9
But not slow for everyone: Pioneering online seller Dave Smith Motors, in Idaho, sells “about 99%” of its unit to online buyers, reports Rick Ford, the
CEO of DSM’s owner, RFJ Auto Group (Automotive News, November 11, 2019). Of course, this is not online direct from the manufacturer. DSM sells its
own cars. And a vast number of DSM buyers come to Idaho to pick up their vehicle themselves.
8 FEBRUARY 2020There is a second issue related to the online/offline topic: the nature of the physical store. Assume that the
physical store does persist for years: Will it look the same as it does today? In theory, an OEM convinced
that more of the customer interface is moving online should require of dealers less elaborate offline
(physical) facilities. This shift in emphasis should be welcomed by dealers, since (as we demonstrated in
earlier reports to NADA10) the return on investment to dealers of lavish store upgrades is essentially zero. In
our work this year we did detect some signs of movement by OEMs away from requiring expensive “Garage
Mahals,” but as dealers know, a change in any factory’s senior management can at any time unleash a
new wave of costly design proposals. (And when other retailers, such as clothing stores, change their
image, they mostly swap the mannequins and some posters; car makers like to pour concrete and erect
glass walls!) We do encourage OEMs to take a more balanced online/offline approach (aka “omnichannel”
marketing), wherein advanced websites are paired with appropriately cost-effective physical channels.
We would advise watching carefully the “digitally native” retailers we mentioned earlier, such as Casper
(mattresses), Bonobos (clothing), Warby Parker (eyewear), et al., all of which started life online but now
are building physical presences (almost 500 across just these three). These tend to be appropriately small,
simple and low-cost facilities.
In the automotive world, Geely/Volvo’s Polestar brand perhaps represents this concept (at least in intent if
not in actuality yet), with its plans to require dealers to build only small, modest stores (called “spaces”)
of 2,000-2,500 square feet in size and about $750,000 in cost. Polestar dealers would indeed take most
orders online, and hold minimal or no inventory on-site.11 But even Polestar is moving cautiously, with no
more than 5-15 “spaces” planned for the U.S. by the end of 2021.12
“Inside” Topic 3: Ownership of Stores
So dealers will have cars to sell, and physical facilities to sell them from (increasingly augmented by
online sales). The question now is who owns the stores? Various options exist, but we’ll discuss just two:
ownership by franchised dealers or by car companies (either directly or via sales subsidiaries).
Our original forecast was that dealers, then holding a 95%-plus share of new-car unit sales, would remain
the dominant channel, with market share perhaps falling to 90% or so by 2025. The reason for the decline
was an expectation that new entrants, especially at the premium end and especially in EVs, would enter in
some strength by 2025 and (inspired by Tesla) opt for factory-direct sales.
Our revised forecast is for dealers to stay at that 95%-plus level through 2025, with a chance of a small
decline thereafter (again, primarily in the premium segment).
The factors we’ve considered in this forecast include the facts that:
• The dealership model (with many variants) dominates globally. Japan and Korea represent major
exceptions to the rule, but they have not exported their OEM-direct model elsewhere.
10
Factory Image Programs, phase 1 2012 and phase 2 2013
11
All this being said, it is unclear that Americans, beyond a high-income time-constrained niche segment, are willing to move to a BTO (build-to-order)
world from a BFS (buy-from-stock) environment. After all, Amazon and others have trained us to expect instant delivery! It is also unclear that car
factories designed to run flat-out will be willing to accept the volume fluctuations BTO generates.
12
Automotive News, December 23, 2019
The Dealership of Tomorrow 2.0 9• Superior economics of direct sales have never been demonstrated. Asserted, yes, but never proven.
In fact, the limited research in this area shows inferior economics of “going direct.”13
• Incumbent OEMs lack the funds to buy out their networks’ massive investments in PP&E.14
• OEMs already have very effective control of dealership behavior anyway.
• If customers want what looks like “factory direct,” dealers can offer it (e.g., via mall stores).
• Conversely, new entrants can decide to own their own stores (as we might expect Apple to do, if it
does launch its own car).
These factors were all in place in 2017, so we should point out the three reasons for revising our current
forecast to show slower penetration of the factory-direct model in the U.S.:
• First, our conversations with new and incumbent OEMs have revealed that Tesla’s issues with
delivery and service have cooled such OEMs’ interests in a direct model. (This is not new news:
Prior attempts—e.g., Daewoo, Ford Retail Network—also collapsed, for various reasons.)
• Second, most if not all of the wave of high-end EV start-ups making news in 2016 and 2017 have
at best experienced delays in launching here, and at worst have abandoned the intent.
• And finally, we continue to look to Canada for insights in this area, and the news from our northern
neighbor is not positive for factory ownership. This is because in Canada, where OEM direct
ownership of stores is broadly permitted, OEMs have actually reduced their store holdings, such
that less than 1% of vehicle sales in Canada are via factory stores. (We thank Chuck Seguin for
this insight.) Because of the absence of strong regulatory bans against direct ownership in Canada,
we would have expected by now more experimentation with the direct model there. There has been
some movement (see Hyundai Genesis), but no real momentum.
Accordingly, we’ll forecast the dealership model of store ownership remaining very dominant in the U.S.
through the 2020s.
“Inside” Topic 4: Structure of the Store Network
In our 2017 report we projected a decline in the number of stores, based on strong consensus among
interviewees that “scale mattered,” that “smaller stores are doomed” and that “the internet is killing
geography” (since any customer can now buy from any dealer anywhere, skipping past local stores). We
were wrong. Store count has not at all declined (since the sharp reduction, of about 2,000 stores, linked
to the Great Recession over a decade ago), and by at least one metric (e.g., Urban Science’s index), has
slightly risen.15
We did see factors that argued for a rise in store count (population growth, growth in suburban sprawl,
customer preference for buying and servicing locally, maybe new OEM entrants), but on balance we
thought the factors pushing for a decline were stronger. The source of our mistake, in retrospect, was a
focus on economic and demographic causes, at the expense of paying attention to commercial realities:
Specifically that (since the Great Recession anyway) no OEM wants to be the one to trim its network.
Every rooftop represents incremental sales, and OEMs for a decade now seem to be willing to ignore the
13
See for example the work of Benito Arruñada.
14
Property, plant and equipment
15
NADA and Urban Science produce slightly different dealership rooftop counts, but their trendlines broadly agree on “flat,” plus or minus a few stores.
10 FEBRUARY 2020risks of over-dealering in favor of the benefit of more unit volume. We don’t see this behavior changing
and so, learning from our mistake, are going with a flat store count for the next five to 10 years (at roughly
18,000). However, this view assumes a steady-state economy; if we encounter a sharp recession, it is
likely that the industry will lose hundreds of rooftops (see the “Dealer Profit Trends” section, below).
Moving on from rooftop count, we come to owner count. In our original forecast we expected a decline in
the number of owners, as smaller chains or single-point stores sold out to larger chains. In this we were
correct. Before the Great Recession there were about 10,000 owners for some 20,000 stores; by 2018
we were down to some 7,700 owners (NADA data) and 18,000 stores (Urban Science data). We’ve thus
moved from roughly two stores per owner to closer to 2.5. We expect this trend to continue, to perhaps
6,250 owners by the late 2020s, where we would reach almost three stores per owner. (And again, we
may see lower numbers if we have a sharp recession.) Drivers of this consolidation in ownership include
succession issues (how to share the store among heirs), aversion to ongoing investment (e.g., “I don’t
want to bet my family’s wealth on yet another $4 million facility upgrade!”), exhaustion from battling
encroaching OEM and regulatory control, and erosion of the entrepreneurial opportunity.16 Even so, despite
all the talk about it, ownership consolidation has been glacially slow (2% annual contraction since 2010):
More dealers talk about “throwing in the towel” than actually do it.
Rooftop Count vs. Owner Count (Line)
Source: Urban Science for rooftop count. NADA for ownership count.
Finally, we reiterate our prior prediction that public ownership will remain a minority of total dealership
ownership. Various factors enter into our thinking: that economies of scale are probably elusive beyond
chains of 50-100 stores, that OEM preferences for owner “skin in the game” remain strong (and that OEM
framework agreements keep a lid on public chains’ growth), and that the public chains’ P/E ratios are not
generally high enough to make buying private chains accretive. And indeed the publics have in recent
years sold stores as often as bought them. We do not in any way mean to imply that these are not well-run
16
Dealerships are fast evolving towards templated franchises such as found in fast-food chains. In the past dealers were truly dealers (buying inventory
at wholesale and marking it up as best as they could), with great freedom to alter store processes and facilities as they saw fit. Over time they have
become more typical retailers, with OEMs enforcing more standardization across stores—arguably beginning with the launch of Saturn in the 1980s. At
present they more closely resemble chain franchisees, where the franchisor (e.g., McDonald’s) establishes standardized processes for every aspect of the
store (and where retail price negotiation has essentially disappeared). This evolution gives the dealer principal less and less room to innovate or deviate,
so more entrepreneurial types may be leaving the business (even as it remains financially attractive for those who remain).
The Dealership of Tomorrow 2.0 11businesses—only that they have no inherent, built-in advantage over private ownership. This is contrary
to very inflated claims about the publics’ advantages when they first launched; see, for example, this
quote from a 1997 article: “It’s only a matter of time, experts agree, before AutoNation kills off traditional
dealers the way Blockbuster squashed the mom-and-pop video stores.”17
A look at the facts shows how little movement has been made toward this “killing off” or “squashing:”
• In 2000, total U.S. new light vehicle sales were 17.3 million, of which approximately 2.8 million
were fleet, leaving 14.5 million as retail. Of those 14.5 million, the six public chains sold just
under 1 million, or about 7%.
• In 2018, once again total U.S. light vehicle sales were 17.3 million, of which approximately 3.6
million were fleet, leaving 13.7 million retail. Of those 13.7 million, the public chains sold about
1.1 million, or about 8%.18
Thus, in 18 years, the public chains’ share (measured in retail units sold) has moved only from 7% to 8%,
hardly a scorching pace of consolidation.
“Inside” Topic 5: Dealer Profit Trends (by Shop and Overall)
Having established our perspective that we have cars to sell and that we still have thousands of
independently owned physical stores to sell them from (whether online or offline), the next question is
how the profitability of these stores will evolve over the next decade. Our view is that total profitability may
decline somewhat, and that the sources of profits will shift somewhat (increasingly to service, aka fixed
operations). This was our view in 2017 and remains unchanged today.
The total profit picture is built up from our individual shop forecasts, summarized as:
• New car: Margins flattened by internet, but partly offset by OEM bonuses and F&I gains
• Used car: Higher percentage margins than new car, but under some pressure
• Service: Good margins, large revenue upside, but dealers will have to work hard to capture it
• F&I: At historic highs, major profit driver, regulatory risk significant
Net, overall, we see some regression to prior “normal” levels of profitability, closer to NPBT (net profit
before tax) of 2%, rather than the 3% average of recent years. As always, the natural diversification of
dealers’ lines of business (e.g., typically when new is down, used is up) helps shield total profitability.
However, especially if we have a sharp recession, many dealers remain at risk. We are especially concerned
about midsized, undifferentiated, suburban stores (which may have over-leveraged in order to fund facility
upgrades): Larger groups are well-capitalized, and smaller stores often benefit from low- cost positions.
17
“A Cream Puff or a Lemon?,” Daniel McGinn, Newsweek, March 9, 1997
18
Notes on these calculations: (1) Berkshire Hathaway qualifies as “public,” but is excluded from this analysis due to limited data disclosure; (2) for
2000 UAG and Penske were not fully merged, but for this analysis were combined into one firm; (3) fleet sale figures are not as reliable as total sales
figures, due to definition issues (e.g., what is the lower limit of vehicles bought together to be considered a “fleet”?). We used Automotive News data for
total sales, and Automotive Fleet and J.D. Power data for fleet sales.
12 FEBRUARY 2020This outlook implies a shift in dealer management priorities from managing growth (across the past
decade) to controlling the costs of operation. If the 2010s were the Decade of Sales Growth, thriving in a
boom, the 2020s will be a Decade of Cost Control, working on a sales plateau.
New Car: More Fragile Earnings, with the Ongoing Shift from Margin to Incentives
The strong bottom line of the average dealership today conceals some fragility, especially in the new-car
shop, since there, margins (which a dealer can somewhat control) have been partly replaced by below-the-
line/back-end OEM payments (which are paid out almost entirely at the whim of the factory). The average
store has therefore become wholly dependent on such payments for its bottom line, as Kerrigan Advisors
eloquently argue (“The Blue Sky Report,” June 2019):
Average Dealership Other Income vs. Other Income
as a Percentage of Earnings 2010–2019 LMT
(in millions of dollars)
Source: Kerrigan Advisors, from NADA data
We see no reversal in this trend. Essentially, the market (enabled by the internet) sets both the price
and the (minimal) margin on new cars, with OEMs providing bonus payments, both to keep dealers
motivated to sell new cars and to induce preferred behavior (e.g., invest in specific training programs,
hit specific customer satisfaction scores). Thus, in new cars, while total profitability may be acceptable
(especially when F&I revenue is considered; see below), it is fragile. If we suffer a sharp recession or if an
OEM changes its plans, dealers can see the payments on which they have become dependent evaporate
overnight. It is therefore as critical as ever for dealers to maintain other profitable revenue streams to
backstop the new-car department.
The Dealership of Tomorrow 2.0 13Will Subscriptions Alter the Very Nature of New-Car Sales?
Talk about subscriptions has flooded the automotive media in the recent past. And this is a fairly
recent development: We didn’t pick up on this topic at all in 2017, and so will address it here.
But despite all the chatter about this model of (quasi)ownership, it has not taken off yet, and
remains problematic.
We’ll define a car subscription as a sort of car ownership, provided via a single monthly fee, and
that covers most costs (e.g., insurance, finance, maintenance), excluding only gasoline. Typically
there is no long-term commitment on the part of the consumer, and often the contract allows
swapping one’s vehicle for another (e.g., a sedan for an SUV), at specified intervals. Subscriptions
can be provided by the OEM (e.g., Porsche Passport), by a dealer (via, e.g., Mobiliti), or by a third
party (e.g., Inride). Motivations for offering subscriptions are varied:
• An OEM may use subscriptions as a marketing tool, encouraging trial.
• Marketers may see them as appealing to supposedly “ownership-averse” millennials.19
• Dealers and OEMs may see these as essentially a kind of lease.
• For premium OEMs, wealthy variety-seeking customers may be attracted to the
swap feature.20
So far (and it is indeed the early days) the record on subscriptions is mixed. We don’t have solid
numbers on how many subscriptions have been issued. Their regulatory status varies state by
state, and in some cases there have been legal challenges to them (e.g., for violating OEM/dealer
sales agreements). No one seems to be making money on them yet, but this may change. And in
fact, the whole subscription question may become moot, because in a way we are already there: If
a dealer is offering a leased vehicle, and the customer has added to it prepaid maintenance and
various other voluntary protection products attached, is the dealer already providing a de facto
subscription? (Although without any built-in swap feature.)
In the meantime, various experiments come and go:
• Some observers felt the new Polestar brand would focus entirely on subscriptions,
in keeping with its modernist image, but it has since adjusted expectations: Gregor
Hembrough, head of Polestar in the Americas, expects Polestar 2 sales to have a 70-30
split between leasing/subscriptions and sales. Subscription volume “will be based on
consumer demand. There is absolutely no target for subscription.”21
• Ford (actually, Ford Motor Credit) acquired, developed and then this year sold its
subscription start-up Canvas. But of course, Ford may reenter the market.
• Conversely, Porsche has been expanding its Passport service in the U.S. (possibly primarily
to introduce trial by customers new to Porsche, as the company’s current customer base is
almost too loyal, and so may need an infusion of entirely new drivers).
19
Though as we saw earlier, millennials are now buying cars at a high rate.
20
Many of these customers are already effectively “subscribing” to cars, changing out one model for another in a series of short two- or three-year
leases. If a wealthy family has three cars in the driveway, all on short-term leases, it may already be seeing a new car every year.
21
Automotive News, February 25, 2019
14 FEBRUARY 2020• GM’s Cadillac launched and then pulled back its service, Book by Cadillac, but has
announced a relaunch in early 2020. GM CMO Deborah Wahl noted that the service was
excellent in inducing trial: “…we learned that the Book model is enormously effective as a
conquest mechanism: 70% of Book subscribers were new to Cadillac.”22
We would expect future growth in subscriptions to be modest, and focused almost entirely on
upscale or premium vehicles. This is because of what we would call a “sticker shock” problem.
That is, the typical new-car buyer may not completely grasp the all-in monthly cost of owning
a car. The fuel bill is clear, and the cost of maintenance and repair—but it is a rare driver who
knows her or his monthly insurance cost per car (especially if that person has multiple vehicles in
the driveway), and we suspect almost no one knows the monthly depreciation cost. Thus customers
who perceive their car to cost $350 a month (say, $100 in gas, $200 for the car’s loan and $50
in maintenance) may be shocked to see a subscription to that car running at $700 or more (as the
subscription will include depreciation at perhaps $250 and insurance at possibly $100). Indeed,
a market research study released by General Motors showed this to be the case. Pricing was the
biggest obstacle to customer consideration of a subscription:
Source: Graph from General Motors, “Consumer View of Future Automotive Market Trends” (presented at SAA, 2019); words are the author’s
Given this, we’d estimate that the perceived high cost of a subscription (and other negative factors)
may offset the major benefit of the swap feature, for the average customer. It’s popular to assert
that younger people “don’t want to own things,” but this preference (if it exists at all) may fade
away if the perceived cost of ownership avoidance is so high. If our view holds true, variety-seeking
wealthy drivers may be the primary segment for subscriptions. In which case subscriptions simply
enter the dealer’s inventory of financing options, along with outright purchase, loan financing and
leasing. An interesting development, but unlikely to be a dominant or revolutionary one.
22
TechCrunch, December 2, 2019
The Dealership of Tomorrow 2.0 15Used Car: Solid Volumes but Some Profit Compression
As dealers saw new-car margins erode over the past years, they sensibly did what they have done before:
rebalanced their portfolio of business lines to recover lost profits. One area they went after aggressively
was used cars. Previously thought of as a sideline (mostly to support new-car sales by accepting used
cars in trade), the used shop is now a major focus for active dealers. Many dealers sought to boost used
volumes, aiming for a 1:1 ratio with new-unit sales. And indeed chains such as Penske and McLarty are
above 1:1; others have gone further and bolted onto their core business lines modern used-car operations,
including Sonic with its Echo Park stores, Lithia with its partnership with used-car online retailer Shift,
and AutoNation with its stand-alone AutoNation USA used-car stores.
All this has become possible of because car quality has climbed and retailing a late-model used unit
is no longer a high-risk transaction for both seller and buyer (as CarMax showed us all, starting back in
1993). Used-car volumes increased their lead over new-car volumes. The former are 2.5 times the latter
today (but only 1.5 times greater back in 1965). And used sales tend to be less cyclical than new sales,
growing at a slow but steady pace of about 1% annually since 1975 (see chart below). Finally, a used car
is increasingly the first choice of most Americans, as the average age of a new-car buyer is well over 50.
Many, if not most, 20-, 30- and 40-year-olds are buying used.
Used Cars Sold (in millions)
Source: US Bureau of Transportation Statistics, Cox Market Insights
It doesn’t hurt that used-car profits are strong. They offer higher percentage grosses than new, though
lower prices mean lower dollar grosses. Overall, the used-car department kicked in on average about 15%
of the store’s total profits in the 1980s, but about 25% today.
16 FEBRUARY 2020However, the sky is not entirely clear: Increasing price transparency, competition from inside the auto
retail industry and from without (not just CarMax but Carvana and others23), as well as “velocity” pricing
(which trades margin per car for higher total profits over time, across multiple cars), are all acting to push
margins down:
Used Vehicle Retail Gross Margin – Quarterly
Source: Manheim Consulting/Cox
And a major challenge for growing this business is sourcing, as everyone is trying to buy the same good
used cars. Increasingly, to acquire inventory dealers must go beyond dealer swaps, trade-ins and auctions,
to buying directly from owners. CarMax pioneered this practice years back, and now in some years will
source as much as 40%-50% of its inventory from individuals.
Service: Sales and Profits Steady, with Significant Revenue Upside Possible
The American maintenance and repair market is at least $400 billion in size, and grows at a slow but
stable rate, essentially having gained 3%-4% annually for a very long time now, fueled by the some 275
million light-duty vehicles on the road today. And over time, this service business has become more
important to dealers (especially as new-car margins shrank): In the 1980s “fixed operations” contributed
about 15% of total store gross, in the 1990s some 25%, and today over 45% (based on NADA data). But
even with this growing contribution to the P&L of any one store, dealers as a group have lost market share
in service to the independent aftermarket. The share that dealers take today is about 30%, down from the
“glory days” of 1960s, when it was about 45%, though the share has been stable in recent years.
23
We do not want to overstate the impact of new entrants in this market, despite the amount of press attention they garner. New entrants’ share is not
yet major; even CarMax asserts it has only 4.5% market share of one- to 10-year-old vehicles in the markets it is in. And many of the new kids on the
block have underwhelmed: Beepi and Carlypso were bought out, and Carvana is both not yet profitable and well below 1% of the national market. But
these companies do serve to raise customer expectations across the board, so dealers need to up their game today or lose business tomorrow. Finally, one
cannot ever count out independent used-car dealerships, which collectively sell about as many used units as do franchised stores. Depending on how you
count them, there are between 35,000 and 70,000 of these stores, and even if they do not generate sexy headlines, they are determined and persistent
and are found in virtually every community in America.
The Dealership of Tomorrow 2.0 17You can also read