LI INFORMATICS (1522-1590) - Nature
←
→
Page content transcription
If your browser does not render page correctly, please read the page content below
LI
           LABORATORY INVESTIGATION
           THE BASIC AND TRANSLATIONAL PATHOLOGY RESEARCH JOURNAL

             VOLUME 100     |   SUPPLEMENT 1    |   MARCH 2020

ABSTRACTS
INFORMATICS
(1522-1590)

FEBRUARY 29-MARCH 5, 2020             LOS ANGELES CONVENTION CENTER
                                          LOS ANGELES, CALIFORNIA
2020                     ABSTRACTS | PLATFORM & POSTER PRESENTATIONS

                                              EDUCATION COMMITTEE
                  Jason L. Hornick, Chair                                      William C. Faquin
      Rhonda K. Yantiss, Chair, Abstract Review Board                              Yuri Fedoriw
               and Assignment Committee                                          Karen Fritchie
        Laura W. Lamps, Chair, CME Subcommittee                               Lakshmi Priya Kunju
                                                                             Anna Marie Mulligan
  Steven D. Billings, Interactive Microscopy Subcommittee
                                                                                    Rish K. Pai
        Raja R. Seethala, Short Course Coordinator
                                                                      David Papke, Pathologist-in-Training
Ilan Weinreb, Subcommittee for Unique Live Course Offerings
                                                                                Vinita Parkash
              David B. Kaminsky (Ex-Officio)                                   Carlos Parra-Herran
                                                                                Anil V. Parwani
                      Zubair Baloch
                                                                                 Rajiv M. Patel
                        Daniel Brat
                                                                                 Deepa T. Patil
                Ashley M. Cimino-Mathews
                                                                               Lynette M. Sholl
                      James R. Cook
                                                                 Nicholas A. Zoumberos, Pathologist-in-Training
                        Sarah Dry

                                            ABSTRACT REVIEW BOARD
     Benjamin Adam                    Billie Fyfe-Kirschner        Michael Lee                  Natasha Rekhtman
   Narasimhan Agaram                   Giovanna Giannico         Cheng-Han Lee                    Jordan Reynolds
     Rouba Ali-Fehmi                       Anthony Gill           Madelyn Lew                      Michael Rivera
       Ghassan Allo                        Paula Ginter               Zaibo Li                      Andres Roma
 Isabel Alvarado-Cabrero               Tamara Giorgadze              Faqian Li                     Avi Rosenberg
     Catalina Amador                       Purva Gopal                Ying Li                        Esther Rossi
     Roberto Barrios                   Anuradha Gopalan             Haiyan Liu                      Peter Sadow
      Rohit Bhargava                       Abha Goyal                 Xiuli Liu                  Steven Salvatore
     Jennifer Boland                    Rondell Graham            Yen-Chun Liu                     Souzan Sanati
       Alain Borczuk                      Alejandro Gru            Lesley Lomo                        Anjali Saqi
      Elena Brachtel                      Nilesh Gupta            Tamara Lotan                      Jeanne Shen
        Marilyn Bui                       Mamta Gupta          Anthony Magliocco                       Jiaqi Shi
         Eric Burks                        Gillian Hale            Kruti Maniar                      Gabriel Sica
     Shelley Caltharp                   Suntrea Hammer            Emily Mason                       Alexa Siddon
     Barbara Centeno                    Malini Harigopal        David McClintock                   Deepika Sirohi
       Joanna Chan                     Douglas Hartman          Bruce McManus                    Kalliopi Siziopikou
    Jennifer Chapman                      John Higgins           David Meredith                      Sara Szabo
         Hui Chen                           Mai Hoang               Anne Mills                 Julie Teruya-Feldstein
        Beth Clark                      Mojgan Hosseini         Neda Moatamed                        Khin Thway
      James Conner                         Aaron Huber            Sara Monaco                      Rashmi Tondon
   Alejandro Contreras                       Peter Illei       Atis Muehlenbachs                   Jose Torrealba
       Claudiu Cotta                        Doina Ivan              Bita Naini                      Andrew Turk
      Jennifer Cotter                       Wei Jiang               Dianna Ng                         Evi Vakiani
      Sonika Dahiya                          Vickie Jo               Tony Ng                Christopher VandenBussche
    Farbod Darvishian                       Kirk Jones          Michiya Nishino                   Paul VanderLaan
       Jessica Davis                    Neerja Kambham            Scott Owens                      Olga Weinberg
     Heather Dawson                       Chiah Sui Kao         Jacqueline Parai                    Sara Wobker
    Elizabeth Demicco                 Dipti Karamchandani            Yan Peng                       Shaofeng Yan
       Katie Dennis                         Darcy Kerr            Manju Prasad                    Anjana Yeldandi
       Anand Dighe                         Ashraf Khan              Peter Pytel                   Akihiko Yoshida
     Suzanne Dintzis                    Francesca Khani           Stephen Raab                      Gloria Young
     Michelle Downes                      Rebecca King           Joseph Rabban                    Minghao Zhong
      Andrew Evans                      Veronica Klepeis          Stanley Radio                      Yaolin Zhou
       Michael Feely                      Gregor Krings            Emad Rakha                        Hongfa Zhu
      Dennis Firchau                   Asangi Kumarapeli      Preetha Ramalingam                    Debra Zynger
     Gregory Fishbein                      Alvaro Laga               Priya Rao
       Andrew Folpe                      Steven Lagana             Robyn Reed
      Larissa Furtado                        Keith Lai            Michelle Reid

      To cite abstracts in this publication, please use the following format: Author A, Author B,
Author C, et al. Abstract title (abs#). In “File Title.” Laboratory Investigation 2020; 100 (suppl 1): page#
1522     Are Medical Grade Monitors a Necessity for Digital Pathology? Initial Insights between Commercial
         Grade and Medical Grade Displays
         Jacob Abel1, Peter Ouillette2, Lloyd Stoolman2, Ulysses Balis2, David McClintock2
         1
           Michigan Medicine, University of Michigan, Ann Arbor, MI, 2University of Michigan, Ann Arbor, MI

Disclosures: Jacob Abel: None; Peter Ouillette: None; Lloyd Stoolman: None; Ulysses Balis: None; David McClintock: None; David
McClintock: None

Background: The display (monitor) is an integral part of the digital pathology (DP) workflow, with DP vendors required to include a specific
display as part of FDA validation studies. Following radiology’s footsteps, DP vendors are choosing medical grade (MG) displays
advertising greater quality as compared to commercial grade (CG) displays, but at a much higher cost. MG displays are reputed to achieve
greater luminance (light emitted per square area) and allow more precise control of luminance relative to CG monitors. Here, we present a
pilot study comparing the luminance characteristics of two FDA-cleared DP displays (Dell MR2416 and Philips PP27QHD) to a high-end
CG display (ASUS PG279Q) and typical laptop CG display (HP G5 ZBook) (Table 1).

Design: Luminance and contrast measurements were taken with an X-Rite PANTONE i1Basic Pro 2 spectrophotometer using i1 Display
Pro software in a photography dark room. The displays were calibrated to 250 cd/m^2, with the exception of the laptop display, which was
set to its max luminance due to setting limitations. Three sets of measurements were taken daily over a period of 5 days, performed
approximately three hours apart (10AM, 1PM, and 4PM). Luminance was measured across 9 “zones” of each display, each time with the
lights on and then off. Statistical analysis was performed in Microsoft Excel. Additionally, delta E-2000 values measuring the difference in
relative luminance between the 8 outer zones and the central zone were calculated to assess lighting uniformity across the panel.

Results: All displays deviated significantly from the set point of 250 cd/m^2 (p-value
Results: Our data shows that breast pathologists read similar amounts slide levels per RVU as thyroid pathologists (p = 0.24), but
significantly more slides and levels to generate one RVU than most other surgical pathology subspecialties including GI (p =
0.000000007) (Table 1). Conversely, neuropathologists read the lowest number of blocks, slides and levels per RVU.

                                                                 Blocks/     Slides/       Levels/
                                           Subspecialty
                                                                 RVU         RVU           RVU
                                           Breast                       1.74        4.61         4.62
                                           Thyroid                      3.34        4.55         4.56
                                           GI                           1.15        1.90         3.91
                                           Derm                         1.54        3.00         3.77
                                           Urologic                     0.98        2.18         3.57
                                           Gyne                         2.29        2.94         3.23
                                           Liver                        1.08        2.90         3.04
                                           Thoracic                     0.98        2.66         2.73
                                           ENT                          1.28        2.18         2.32
                                           Soft Tissue/Bone             1.82        2.08         2.20
                                           Neuro                        0.63        2.04         1.97
                                           Grand Total                  1.44        2.60         3.65

Conclusions: Our results show that there are statistically significant differences in the number of slides levels read by different
subspecialties for each RVU generated. We are proposing the slide levels can be used as an alternative and independent metric of surgical
pathology workload.

1524     Detection and Classification of Organism and Organism-like Profiles in Gastric Biopsy
         Helicobacter Immunohistochemistry by Digital Image Analysis (DIA)
         Ibrahim Abukhiran1, Andrew Bellizzi1, Anand Rajan KD1
         1
           University of Iowa Hospitals and Clinics, Iowa City, IA

Disclosures: Ibrahim Abukhiran: None; Andrew Bellizzi: None; Anand Rajan KD: Advisory Board Member, Roche Diagnostics Corporation

Background: Helicobacter pylori (H.pylori) immunohistochemistry (IHC) is a commonly ordered test in gastrointestinal pathology.
Screening HP-IHC slides can be time-consuming, particularly in treated cases and in target patient populations with a low incidence rate. In
these scenarios, large volumes of gastric biopsy tissue needs to be examined and the clinical impact of positive organism detection is
abruptly high. We sought to utilize whole slide quantitative image analysis (QIA) by HALO (Indica Labs, New Mexico, USA) to develop a
screening protocol for organism detection with high sensitivity and negative predictive value.

Design: We assembled H.pylori negative (n=115) and non-random positive cases (n=65) into a cohort (n=180) with organism incidence
well above baseline population positivity rate (~5%). Whole slides were scanned at 20x (0.24µm/pixel) and presence of organisms in
positive cases was confirmed by glass slide review. A HALO area quantitation (AQ) protocol was calibrated to detect IHC di-
aminobenzidene (DAB) brown organism signals in a 3+ bracket and nucleocytoplasmic counterstain thresholding was set to blank.
Receiver operator characteristic (ROC) analysis was performed to identify the optimal area value cutoffs.

Results: HALO QIA was able to detect organisms in 100% (65/65) of positive cases. It did not detect any organisms in the negative cases.
However, it identified signal positivity (artifacts) in all cases. In positive cases, organisms tend to cover more surface area than the area of
artifacts. The most common encountered artifacts were: acellular debris/mucin (29%), dark stained lymphocytes (23%) stain
artifact/precipitate (23%). With ROC analysis, the area under the curve (AUC) was 0.863 (CI: 0.80-0.91, p
Figure 1 - 1524

Conclusions: Whole slide QIA was 100% sensitive in detecting H.pylori organisms in gastric biopsies. With ROC analysis, we identified
cutoffs that exhibiting high sensitivity (98.4%), and high negative predictive value (99.8%) with low cost (2.8 units relative to cost of false
negative set at 100). In signal-positive organism-negative cases the detected artifacts were of a very small area (less than 0.1% of total
tissue) and could be quickly reviewed and excluded by morphologic review. The high negative predictive value strongly supports the use of
a simple QIA protocol in screening gastric biopsy IHC in routine practice.

1525     Medicare Trends in Pathologist Participation, Service Utilization and Payments
         Simone Arvisais-Anhalt1, Ellen Araj1, Jason Park1
         1
           University of Texas Southwestern Medical Center, Dallas, TX

Disclosures: Simone Arvisais-Anhalt: None; Ellen Araj: None; Jason Park: None

Background: The utilization and payment for pathology and laboratory services has not been previously reported at a national scale.
Quantifying pathologist participation in Medicare services may be informative for the prediction of future utilization and payments.

Design: The Medicare Provider Utilization and Payment Data: Physician and Other Supplier Public Use File (POSPUF) from years 2012 to
2017 was aggregated. This dataset contains information on Part B services and procedures provided to Medicare beneficiaries; the data
includes NPI, CPT codes, payments and place of service. Data aggregation and analysis were performed using the business intelligence
software Tableau 2019.2. Physicians examined were limited to those who self-identified their specialty as “Pathology”. Services and
payments were examined by facility (e.g., hospital, ambulatory surgery center) and non-facility (e.g., independent laboratory, medical
office) place of service.

Results: In 2017, 11,191 pathologists (female=4,533, 40.5%) provided Medicare Part B services. This is a 2.9% overall increase in
pathologists from 2012; a 15.4% increase in females and a 4.2% decrease in males was observed. From 2012 to 2017, the Medicare
beneficiaries receiving pathology services increased from 15,078,433 to 16,866,980. Normalized per pathologist, this is an increase from
1,386 up to 1,507. In the same period, pathology services increased from 26,634,848 to 28,791,595. Normalized per pathologist, this is an
increase from 2,448 up to 2,572 services. Medicare Part B payments for all medical specialties was $68,889,358,763 in 2017; a 7.8 percent
increase from 2012. In 2017, payment for pathology services was $936,201,035; a 3% percent decrease from 2012. The top ten pathology
services performed in a facility were all surgical pathology. In all years surveyed, the 88305 CPT code was the most common service
provided. From 2012 to 2017, the facility payment for 88305 increased from $28.70 to $30.60; in contrast the 88305 non-facility payment
decreased from $55.00 to $39.00. Declines in non-facility payments were observed for other surgical pathology services.

Conclusions: From 2012 to 2017, the number of pathologists providing Medicare services increased by 2.9%. However, both the
beneficiaries as well as total services increased per pathologist. Medicare payments decreased for the highest volume non-facility surgical
pathology services.

                                                                                                                                            1436
1526     Automated Analysis of Plasma Cell Percentage and Light Chain Clonality in Bone Marrow Biopsy
         Whole Slide Images
         Vahid Azimi1, Ngoc Tran2, Young Hwan Chang2, Guillaume Thibualt2, Eva Medvedova2, Kevin Turner2, Robert Christian2, Phil
         Raess2
         1
           Oregon Health & Science University, Portland, Multnomah, 2Oregon Health & Science University, Portland, OR

Disclosures: Vahid Azimi: None; Ngoc Tran: None; Young Hwan Chang: None; Eva Medvedova: None; Robert Christian: None; Phil
Raess: None

Background: Plasma cell myeloma (PCM) is diagnosed by visual estimation of plasma cell percentage (PC%) using CD138
immunohistochemistry (IHC) and kappa/lambda (K/L) light chain ratio using K/L in-situ hybridization (ISH) in bone marrow biopsies (BMBx)
by pathologists; the cutoff for differentiating PCM from monoclonal gammopathy of undetermined significance (MGUS) is a PC% estimation
of 10%. These estimations may be prone to intra- and interobserver variability; thus, development of an automated WSI-based method to
standardize quantitation of PC% and clonality from BMBx could lead to more accurate prognostication and diagnosis. To our knowledge,
this is the first study implementing a completely automated computer-assisted imaging analysis (CIA) method of quantifying PC% as well
as K/L ISH in BMBx.

Design: H&E, CD138, and K/L ISH of BMBx were retrospectively collected and scanned from 42 patients at day +100 following autologous
stem cell transplantation. Pathologist-estimated PC% and light chain clonality was extracted from pathology reports. A previously described
nucleus segmentation algorithm was modified to identify PCs on CD138 IHC and K/L ISH stains. K/L ratio was calculated by # K+ cells/#
L+ cells on K/L ISH, respectively. Cutoffs of >3.5 and  3.5       0.5< K/L < 3.5
                            analysis
                            K/L > 3.5                         4               4
                            0.5< K/L < 3.5                    0               35
                            Monoclonal LAMBDA by ISH          Visual estimation by pathologists
                            Computer-assisted image           K/L < 0.5       0.5< K/L < 3.5
                            analysis
                            K/L < 0.5                         4               8
                            0.5< K/L < 3.5                    1               30
                             Figure 1 - 1526                                                  Figure 2 - 1526

Conclusions: PC% and K/L clonality CIA algorithms show good concordance with pathologists. Differences in concordance between the
two PC% methods could be due to H&E cell oversegmentation, CD138+ cell undersegmentation, or overestimation of PC% by

                                                                                                                                        1437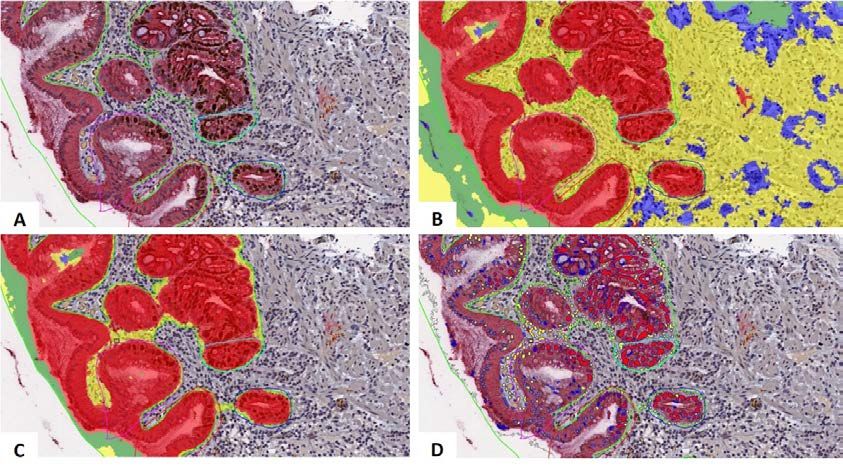
pathologists. Future work will further investigate reasons for CIA and pathologist discordance and assess the relative prognostic values of
CIA and pathologist PC% estimations.

1527     Detecting Specimen Contamination in Whole Slide Imaging Using Artificial Intelligence
         Morteza Babaie1, Abtin Riasatian2, Sobhan Hemati2, Mahjabin Sajadi2, Adrian Batten3, Soma Sikdar3, Liron Pantanowitz4, Hamid
         Tizhoosh1
         1
           University of Waterloo, Waterloo, ON, 2KimiaLab, University of Waterloo, Waterloo, ON, 3Grand River Hospital, Kitchener,
         ON, 4University of Pittsburgh, Wexford, PA

Disclosures: Morteza Babaie: None; Abtin Riasatian: None; Sobhan Hemati: None; Mahjabin Sajadi: None; Adrian Batten: None; Soma
Sikdar: None; Liron Pantanowitz: Consultant, Leica; Consultant, Hamamatsu; Consultant, Ibex; Grant or Research Support, Lunit; Grant or
Research Support, Huron; Hamid Tizhoosh: Consultant, Huron Digital Pathology; Primary Investigator, Huron Digital Pathology

Background: Recent developments in digital pathology have opened new horizons for research and diagnostic purposes. Besides obvious
advantages of digitization (e.g., telepathology), many components of pathology workflow could be improved by applying artificial
intelligence (AI) techniques. The presence of artifacts from various sources during slide preparation could potentially render a slide useless
or difficult to read for diagnosis. Among others, specimen contamination is considered a serious artifact. The finding of suspected
contaminating tissues could be a challenging obstacle in diagnosis; detecting a dissimilar (foreign) tissue fragment could take a
considerable time for the pathologist to resolve. We demonstrate the use of an AI-based system to detect tissue contaminations (“floaters”)
in digitized slides.

Design: We collected 12 clinically confirmed tissue contamination cases (6 cases confirmed by DNA testing) from the Grand River Hospital
pathology archive. After scanning slides at 40x magnification (by Huron’s TissueScope LE), each fragment was split into several 400x400
pixel patches. All patches were fed into the DenseNet 121 (a pre-trained deep network) that provided a descriptor vector with a length of
1024. The most similar retrieved patches were selected based on the descriptors’ distances (pattern dissimilarity) between all other
patches of each fragment. By taking the average among distances of each fragment, we constructed a complete bidirectional graph for
each slide. Distances from fragment A to B is not equal to the distance from B to A because of a different number of patches in each
fragment.

Results: We applied a linear SVM algorithm to classify the scaled average distances from and to each fragment (two features for each
fragment). All experiments have been conducted using the leave-one-patient-out validation. An accuracy of 87% was achieved for
contamination detection. The sensitivity of the proposed approach was 100% whereas the specificity was observed at 83%. The false-
positive cases were sometimes blurry fragments. This means our approach may also detect other artifacts.

                            Figure 1 - 1527                                                        Figure 2 - 1527

Conclusions: Manual detection and clarification of contaminations such as floaters present in pathology slides can be a laborious task
which is generally accompanied by ambiguity. Automated contamination detection for whole slide imaging in digital pathology can assist
pathologists and lab technicians with this task, thereby facilitating high-quality slide processing as well as reliable diagnoses.

                                                                                                                                           1438
1528     Subpar Scanning Fidelity of Mastectomy Specimens Poses Challenges for the Adoption of Digital
         Pathology for Primary Diagnosis
         Sarah Bowman1, G. Zoltan Laszik1
         1
           University of California San Francisco, San Francisco, CA

Disclosures: Sarah Bowman: None; G. Zoltan Laszik: None

Background: High fidelity scanning of histology glass slides is one of the prerequisites for successful adoption of digital pathology for
primary diagnosis. Fat-rich and faintly-stained tissues are known to pose potential problems for whole slide scanning. To assess the scope
of the problem we evaluated scanning fidelity on a select set of mastectomy cases.

Design: Six randomly selected mastectomy cases from the routine surgical pathology files at UCSF from 2018 with a total of 457 slides
were enrolled into the study. All slides were scanned in on Philips Ulta Fast Scanners at UCSF before and post-calibration to factory
specifications. The images were reviewed by a trained image specialist (SB) and also by a pathologist (ZL) to determine the incidence of
suboptimal scanning. Of the 163 slides with suboptimal scanning fidelity at UCSF, 161 slides were rescanned at Philips, Best, NL and
again evaluated for the incidence of suboptimal scanning. Images with less than 100% scanning fidelity were further classified based on
how much tissue was missing from the scans as follows: 1) 30mm (large area).

Results: The incidence of suboptimal scanning fidelity was comparable at UCSF before (152/429 [35%]) and post-calibration (163/429
[38%]) of the scanners. Of the161 slides with subpar scanning fidelity at UCSF, 81% were also suboptimal upon rescanning at Best, NL.
The incidence of various classes of subpar scans at UCSF and at Best, NL is shown in Table 1. The tissues missed by the scanner were
exclusively those of fat-rich portions of the sections.

                Table 1. The incidence of various classes of subpar scans at UCSF and at Philips, Best, NL
                                                        UCSF (n=163)              Philips, Best, NL (n=161)
                100% of Tissue Scanned                  0/163 (0%)                31/161 (19%)
                Category 1                              62/163 (38%)              57/161 (35%)
                Category 2                              48/163 (29%)              24/161 (15%)
                Category 3                              53/163 (33%)              49/161 (30%)

Conclusions: High incidence of suboptimal scanning fidelity might hamper adoption of digital pathology for primary diagnosis for
mastectomy specimens. Improvements in scanning fidelity for fat-rich tissues is warranted.

1529     Establishing a Radiology-Pathology Division – A Novel Approach Integrating Three Diagnostic
         Digital Imaging Modalities to Resolve Uncertain Diagnosis
         Andrey Bychkov1, Takashi Hori2, Akira Yoshikawa3, Yoko Masuzawa2, Akiko Shimauchi2, Wataru Yamashita2, Youichi Machida2,
         Junya Fukuoka4
         1
           Kameda Medical Center, Kamogawa, Japan, 2Kameda Medical Center, Kamogawa, Chiba, Japan, 3Kamogawa,
         Japan, 4Nagasaki University, Nagasaki, Japan

Disclosures: Andrey Bychkov: None; Takashi Hori: None; Akira Yoshikawa: None; Yoko Masuzawa: None; Akiko Shimauchi: None;
Wataru Yamashita: None; Youichi Machida: None; Junya Fukuoka: None

Background: Pathology and radiology are core disciplines of so-called medical imaging. There is a growing voice from the leading
authorities that medical imaging can be a single specialty soon, combining expertise and advances of both disciplines. Digital technology is
a medium greatly facilitating this potential switch. Radiology was universally digitized in the early 2000s. Now pathology follows the same
path. While pathological diagnosis remains the gold standard, radiological findings can be essential clues to reach a correct diagnosis.
Direct communication between both specialties in the frame of the radiological-pathological conference (RPC) provides an invaluable
solution for challenging cases in clinical practice.

Design: Our department serves as a model facility for the primary diagnosis through digital pathology. In 2018 we achieved 100% digital
workflow for biopsies, surgicals, and frozen service. In August 2018 we established a Radiology-Pathology Division, which integrated three
digital imaging tools (radiology, pathology, and cytology) in a single group discussion via secure WebEx channel. The Philips IntelliSite
Pathology Solution and Panoptiq platform were used for digital pathology and digital cytology, respectively.

Results: A total of 130 cases were discussed at the RPC by 09/2019, including 47 cases recorded in the standard protocol (introduced in
April 2019). Baseline numbers were as follows: 2 cases/week, 20–40 min./case. Regular participants from 2–3 locations included
radiologists, pathologists, senior cytotechnologist, and residents (average 5–6 people). Two-thirds of cases were referred by pathologists,
and one third by radiologists. Clinical diagnosis concerned cancer in 94%. Histology and radiology digital images were provided for all
cases, added by cytology in 72% cases. The vast majority of tissue samples were biopsies (85%). Main locations were thoracic (49%),
abdominal (26%), and GU (15%). The final diagnosis of malignancy was rendered in 81% and excluded in 19% of cases. Histology and

                                                                                                                                         1439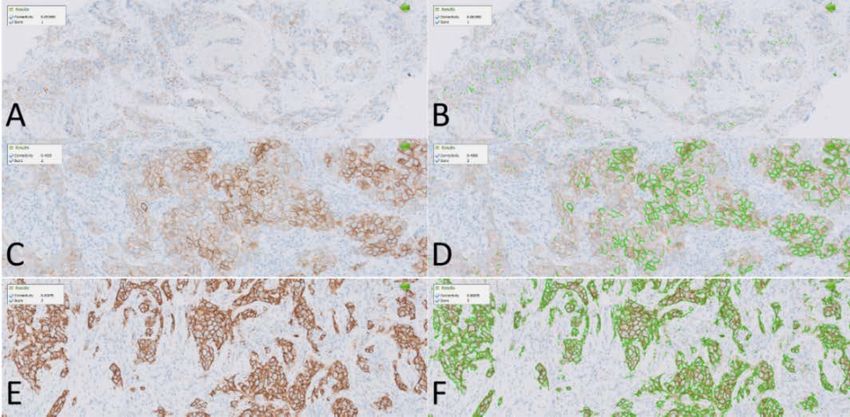
cytology were initially discordant in 15% of cases. The most common decisions made at RPC were arriving at the definite diagnosis, and
expanding/narrowing the differential diagnosis. Additional IHC workup was a common solution to render the final diagnosis.
Conclusions: RPC proved useful in diagnostically challenging cases. Its clinical utility was added by the educational impact since both
pathologists and radiologists gained knowledge about basic diagnostic clues of each specialty.
1530 Loss of Fidelity in Whole-Slide Images Compared to Glass Slides of Brain Tumors Resected Using
Cavitron Ultrasonic Surgical Aspirator
Cathryn Cadwell1, Sarah Bowman1, G. Zoltan Laszik1, Melike Pekmezci1
1
University of California San Francisco, San Francisco, CA
Disclosures: Cathryn Cadwell: None; Sarah Bowman: None; G. Zoltan Laszik: None; Melike Pekmezci: None
Background: Whole-slide images (WSI) hold tremendous potential for improving clinical care, research, and medical education. However,
due to restrictions in the scannable area and selective scanning of regions of interest, highly fragmented and/or faintly stained tissue may
not be scanned at high resolution leading to loss of fidelity in WSI compared to glass slides. Cavitron Ultrasonic Surgical Aspirator (CUSA)
is often used in brain tumor resections, resulting in highly fragmented specimens. This study evaluated the extent and significance of loss
of fidelity in WSI from CUSA-resected brain tumor specimens.
Design: We reviewed 296 slides from 40 CUSA-resected brain tumor cases scanned using a Philips Ultra Fast Scanner. Twenty each
were selected from 2016 and 2018, between which our institution made extensive tissue processing modifications to optimize for WSI. The
WSI and glass slides were reviewed by two pathologists and classified into one of three categories: 1) no loss of fidelity, 2) unscanned
fragments only beyond the coverslipped area, or 3) unscanned fragments within the coverslipped area. The size of the missing fragments
and potential diagnostic impact were also examined.
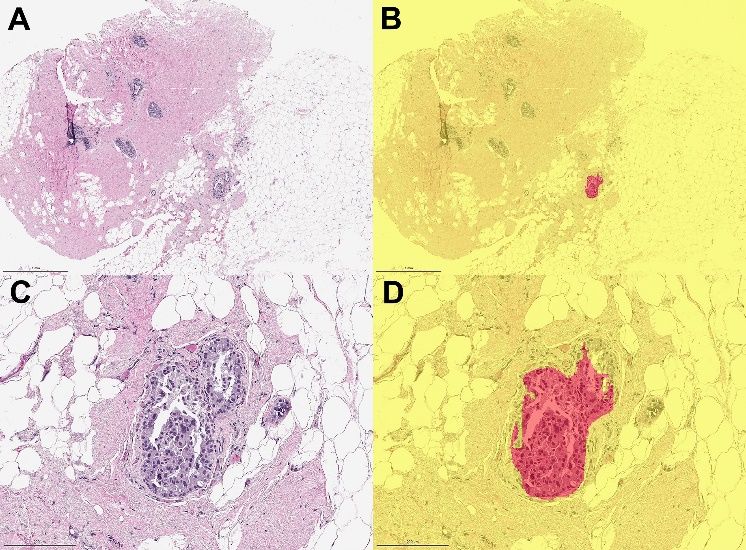
Results: Overall, 38% of the examined WSI showed no loss of fidelity, 8% were missing tissue only beyond the coverslipped area, and
54% were missing tissue within coverslipped area (Table 1). The largest size of unscanned tissue fragments in the coverslipped area was
5 mm in 1%. Of the slides with unscanned tissue in the coverslipped area, 19% showed
no indication of loss of fidelity in the WSI and could only be identified on review of the glass slides. There was no difference in fidelity
between the 2016 and 2018 cases. All cases had at least one slide with unscanned tissue, but none of the missing fragments would have
altered the final diagnosis.
Total (n=296 slides)
No Tissue Small Intermediate Large fragment All missed
missing beyond fragment fragment missed fragments
tissue cover slip missed missed
(≥ 5 mm)
(
1531     Validation & Multiple Use Case Applications of Whole Slide Imaging in a High-Volume Anatomic
         Pathology Global Reference Laboratory
         Kirti Chadha1, Kunjal Lila1, Ashwini Patkar2, Shaikhali Barodawala1, Mukul Vij3, Anuradha Murthy2, Vikas Kavishwar1, Pranav
         Desai4, Krishna Prasad1, Shital Munde5, Tejal Shah6, Metropolis Healthcare LTD at SSRM Pathology Clinic LTD7, Krishna
         Detroja8, Ameya Khadilkar1, Ramrao Nilkanthe2, Dhaval Doshi1
         1
           Global Reference Laboratory, Metropolis Healthcare Ltd, Mumbai, Maharashtra, India, 2Integrated Oncopathology Department,
         Metropolis Healthcare Ltd, Mumbai, Maharashtra, India, 3Global Reference Laboratory, Metropolis Healthcare Ltd, Chennai, Tamil
         Nadu, India, 4Desai Metropolis, Surat, Gujarat, India, 5Global Reference Laboratory, Metropolis Healthcare Ltd, Nashik,
         Maharashtra, India, 6Global Reference Laboratory, Metropolis Healthcare Ltd, Vadodara, Gujarat, India, 7Kolkata Metropolis,
         Kolkata, West Bengal, India, 8Sanjeevni Metropolis, Rajkot, Gujarat, India

Disclosures: Kirti Chadha: None; Kunjal Lila: None; Ashwini Patkar: None; Shaikhali Barodawala: None; Mukul Vij: None; Anuradha
Murthy: None; Vikas Kavishwar: None; Pranav Desai: None; Krishna Prasad: None; Shital Munde: None; Tejal Shah: None; Metropolis
Healthcare LTD at SSRM Pathology Clinic LTD: None; Krishna Detroja: None; Ameya Khadilkar: None; Ramrao Nilkanthe: None; Dhaval
Doshi: None

Background: Whole slide imaging or Digital pathology as is commonly referred to represents a substrate from which glass slides can enter
the digital domain. This technology was validated by Histopathologists & received accreditation. Thereafter multiple applications were
analysed & executed that enhanced the traditional workflow in anatomic pathology practice. It encouraged sub-specialty expert
consultation, Intradepartmental consensus, quality assurance and medical education.

Design: Intra-observer validation for WSI on Intellisite Philips Solution was carried out for 15 Consultant Pathologists as per CAP
guidelines, minimum of 60 histopathology cases with 20 slides per additional modality per Consultant with a wash out period of 2-4 weeks.
A total of 1494 case cohort was included for validation including H&E (3135 slide reads), special stains (240 slide reads) & IHC (1254 slide
reads). Cytology & Frozen were excluded from the scope.

The pre-existing Glass Slide Library was digitised & students had access to glass & digitized version increasing the geographical scope.
The institute launched Proficiency Testing for Anatomic Pathology using WSI. Intra-departmental consensus and expert sub-specialty
access was available improving accuracy and reducing TAT. Faculty were able to attend Tumour Boards and Clinical Path meetings across
7 countries.

Results: Overall concordance between WSI and conventional glass slides: 95.52%. Major discordance was 0.27% and minor discordance
was 4.22%. WSI was preferable over conventional glass slides in 7.90% & conventional glass slides were preferable over WSI in 3.75% of
the cases.

A total of 450 slides were digitized for Medical Education. TAT for off-site secondary expert consultation reduced by 4 - 7 days and on site
by 1-2 days. Accuracy improved by 12% by consulting a sub-specialty co-faculty. 60 Clinical path meetings were attended across
specialties using WSI. Proficiency testing (EQAS) Cycle time of Anatomic Pathology reduced by 20 days.

                    Table 1: Case cohort of 1494 cases (4629 slide reads) - Intra-observer validation of 15 pathologists

            S.No    H&E       Special    IHC     Total    %Major           % Minor         %Concordance        %WSI     %Glass
                              stain                       Discordance      Discordance                         better   slide
                                                                                                                        better
            A       62        20         20      102      0                1.96            98.03               8.8      3.9
            B       61        20         20      101      0                4.95            95.04               5.9      4.9
            C       65        20         20      105      0                2.86            97.14               6.6      4.7
            D       60        20         22      102      0                4.9             95.09               5.8      3.9
            E       60        20         22      102      0                3.92            96.07               4.9      3.9
            F       60        20         23      103      0                4.85            94.14               4.8      2.9
            G       65        20         20      105      0.95             3.81            95.24               8.6      4.77
            H       60        20         20      100      1                7               93                  8        4
            I       60        20         0       80       1.25             3.75            95                  11.3     6.25
            J       63        20         21      104      0                6.73            93.27               7.69     3.85
            K       60        20         0       80       1.25             6.25            92.5                8.75     6.25
            L       100       0          0       100      0                2               98                  7        5
            M       69        20         21      110      0                5               95                  15       3.64
            N       100       0          0       100      0                5               95                  9        6
            O       100       0          0       100      0                0               100                 0        0
                    1045      240        209     1494     0.27             4.22            95.52               7.9      3.75

                                                                                                                                          1441
Figure 1 - 1531 Figure 2 - 1531
Conclusions: The results of the validation showed that interpretation of whole slide images was concordant to the microscope and
acceptable. WSI revolutionized histopathology education for pathologists in training with access to curated and organized cases. Intra-
departmental meetings & sub-specialty expert access improved accuracy and reduced turn-around time. Proficiency testing process
evolved & shortened.
1532 Automated Collection of RVU Data for Subspecialized Pathology Practice
Jennifer Chapman1, Anton Morenko2, Merce Jorda3, Monica Garcia-Buitrago4
1
University of Miami, Miller School of Medicine, North Miami, FL, 2University of Miami, Miami, FL, 3University of Miami Miller
School of Medicine, Miami, FL, 4University of Miami Miller School of Medicine/Jackson Health System, Miami, FL
Disclosures: Jennifer Chapman: None; Merce Jorda: None; Monica Garcia-Buitrago: None
Background: Due to restructuring of healthcare reimbursement, Pathologist’s salary has increasingly shifted from being fixed to having a
fixed component, plus added variable components provided as incentives. Variable components are used by administrators to incentivize
physician behavior or productivity, the latter requiring a reliable system for measuring work. Workload has traditionally been measured by
relative value units (RVU), a system that assigns points to each billable clinical activity according to reimbursement amount by current
procedural terminology (CPT) code. This system is imperfect and widely criticized. While other methods for measuring workload have
been developed, they are laborious to calculate in real time and have not been widely adopted.
Design: In subspecialty based practice, equal work allocation has been difficult to achieve. One reason is the lack real time visibility of
number of cases and RVU assigned to each subspecialty and Pathologist. As our Department shifted from general to subspecialty practice,
we sought to develop a method to electronically track the number of cases and RVUs assigned to each subspecialty and Pathologist.
Results: Within our Laboratory Information System (LIS) system database there is a subspecialty field (Sunquest CopathPlus v 6). Use of
this field allowed us to create case level subspecialty assignments according to the part types submitted, and identify individual outreach
consultation cases (Figure 1). We have developed a method to use the fee schedule functionality within the LIS, which would normally
store pricing information, to instead define RVU values according to each CPT code. Using a query from any database browser, the criteria
looking specifically at the RVU fee schedule is set along with Pathologist and subspecialty assignment. Data reports show each part type
as a CPT row with a one to one association with the RVU, Subspecialty, Pathologist, and a calculation of CPT units multiplied by RVU
value. Data is extracted into Excel, where data manipulation is applied (Figure 2).
1442Figure 1 - 1532
Conclusions: We have created visibility of RVU data per pathologist and per subspecialty in real time by setting frequent uploads of data
from our LIS into tools such as Power BI dashboards, allowing Pathologists and Departmental leadership to understand and monitor RVUs
by viewing data from individual desktops.
1533 Deep Learning-Based Pathomic Fusion for Glioma Outcome Prediction
Richard Chen1, Ming Lu1, Jingwen Wang2, Faisal Mahmood1
1
Brigham and Women's Hospital, Harvard Medical School, Boston, MA, 2Brigham and Women's Hospital, Boston, MA
Disclosures: Richard Chen: None; Ming Lu: None; Jingwen Wang: None; Faisal Mahmood: None
Background: The current standard-of-care for cancer diagnosis and prognosis is the subjective analysis of histopathology slides and
molecular profiles. Subjective diagnosis has shown to have a large interobserver and intraobserver variability among pathologists.
Recently, there has been an increased interest in using deep learning for automated and objective grading of histology slides. However,
most deep learning-based objective outcome prediction paradigms do not make use of the wealth of multimodal diagnostic data in an
intuitive manner and usually rely on histology ROIs. Existing work on combining histology and molecular profiles relies on concatenation
which does not make use of the most relevant features across the two modalities.
Design: In this work, we propose a unique approach for integrating histopathology and genomic data for glioma, in which we use deep
learning to learn a coordinated representation of the two modalities using tensor fusion. We train two independent deep neural networks on
histopathology image and genomic data respectively. Due to the lack of training samples, our network architectures for processing genomic
and histopathology data are the Self Normalizing Network (SNN) and VGG16 respectively. Afterwards, we implement a multimodal deep
neural network that fuses both histopathology image and genomic data. Fusion was performed by taking the outer product of the last
hidden layers from the two unimodal networks. Each deep neural network was trained using the Cox partial likelihood loss, which has been
demonstrated to be the same as maximizing the Concordance Index. We implemented all of our data and preprocessing code in PyTorch.
Results: Our approach is validated on glioma data from the Cancer Genome Atlas (TCGA) Pan Cancer Atlas dataset, which contains 769
samples of paired whole-slide image, genotyping and transcriptome data with ground truth survival time labels for glioma. Our results
demonstrate that multimodal learning with our proposed architecture for integrating histopathology image and genomic data is able to
outperform traditional approaches, with an increase in C-Index performance of 4.2%, 4.3%, and 34.2% over concatenative fusion,
histopathology data, and genomic data.
1443Model C-Index
Tensor Fusion 0.7496
Concatenative Fusion 0.7148
Histopathology 0.7177
Omic 0.4930
Figure 1 - 1533
Conclusions: We propose a learning strategy for fusing genomic and histology data, which we validate on the TCGA-glioma dataset.
Future work would extend this approach for other cancer types in TCGA.
1534 An Objective Deep Learning-Based Paradigm for Establishing Correspondences between Genomic
and Histopathology Data
Richard Chen1, Faisal Mahmood1
1
Brigham and Women's Hospital, Harvard Medical School, Boston, MA
Disclosures: Richard Chen: None; Faisal Mahmood: None
Background: Cancer cells exhibit enormous phenotypic and genotypic intratumoral heterogeneity in histopathology tissue and molecular
profiles respectively. The spatial organization of cellular density and microvascular patterns in histopathology diagnostic slides has the
potential to elucidate correspondences with molecular biomarkers, which can be targeted at the cellular level. However, such correlations
between histopathological image and molecular profile features have been performed using either subjective techniques or non-learning
based approaches.
Design: In this work, we design a novel deep learning approach that learns to translate molecular profiles to morphological patterns using
a generative adversarial network (GAN), which we call Cycle-Aware Conditional GAN (CACGAN), illustrated in Figure 1. In this work, our
generator is a mapping function that seeks to synthesize histopathology image data conditioned on the molecular profile data, and the
discriminator is a convolutional neural network aims to distinguish between real and synthesized pairs of genomic and histopathology
samples. We use three loss functions: an adversarial loss, a feature-matching loss and a cycle-consistency loss, which are used together
to learn a mapping function that is able to synthesize realistic histopathology image data that correspond with molecular profiles.
Results: Our approach is trained and validated on glioma data from the Cancer Genome Atlas (TCGA) Pan Cancer Atlas dataset, which
contains 769 samples of paired whole-slide image, genotyping and transcriptome data for glioma, with annotation for glioma histologic
subtypes. Figure 2 shows synthesized histopathology tissue image results for Astrocytoma and Oligodendroglioma. The top row shows
histopathology image results generated from existing methods, with the second-to-last result being CACGAN. In the bottom row, we test
whether CACGAN would be able to synthesize histopathology tissue patterns corresponding to Oligodendroglioma and Astrocytoma from
genomic vectors containing 1DH mutation + 1p19q codeletion and no 1DH mutation + 1p19q codeletion respectively. In an interesting
result, we were able to generate varying amounts of nuclei in the histopathology image by adjusting the mutation and codeletion status of
these features.
1444Figure 1 - 1534
Figure 2 - 1534
Conclusions: We propose a novel deep learning approach for developing correspondences between morphological patterns and
molecular profiles. Future work would extend this approach to include other cancer subtypes.
1535 Unsupervised Pathology Report Classification Through Document and Word Embeddings
Jerome Cheng, University of Michigan, Ann Arbor, MI
Disclosures: Jerome Cheng: None
Background: In recent years, word embedding approaches have emerged as a versatile and powerful tool for encoding words with their
contextual meaning in a numerical representation, commonly referred to as word vectors. One such method is Word2vec, developed by a
team of researchers led by Tomas Mikolov at Google; it relies on a neural network to derive vectors (a series of numbers) for words in a
large body of text. Heavily based on Word2vec, Doc2vec (developed by Quoc Le and Tomas Mikolov) is a similar method that encodes
paragraphs as a series of numbers, in addition to the word vectors derived from each word making up the paragraphs. Applied to pathology
reports, which are still commonly text based, paragraph vectors may be used to classify these reports through supervised and
unsupervised methods. Supervised methods involve labelling each report as belonging to one class (e.g. benign vs. malignant), and
training a machine learning model with them that can classify other reports into the appropriate category. Doc2vec may also be used in an
unsupervised manner on unlabeled pathology reports to find reports that are similar to a given report, which will be the focus of this study.
Design: Diagnosis sections of 520,546 Pathology reports were extracted from our laboratory information system database using a
Structured Query Language (SQL) based query. A Doc2vec model was trained with the report data for 500 epochs (iterations) using a
1445vector size of 300, generating unique paragraph embeddings for each report. Using the model, the top 3 most similar cases were retrieved
for 100 separate cases and the predicted results were evaluated by a Pathologist for relevance.
Results: 297 out of 300 (99%) of the predicted results were contextually relevant in terms of either the lesion type or specimen location;
281 out of 300 (93.67%) of the predicted results were contextually relevant in terms of both the lesion type and specimen location. As an
example, Table 1 enumerates the top 3 most similar diagnoses predicted by the trained Doc2vec model for a selected case.
Table 1 Top-3 most similar diagnoses retrieved by the Doc2vec model for a selected case
Diagnosis: Skin, left chin, shave: Squamous cell carcinoma, invasive, well to moderately differentiated, extending
to the deep margin.
Most similar cases:
1. Skin of right chin, shave: Invasive well differentiated squamous cell carcinoma, extending to deep margin.
2. Skin of chin, shave: Invasive, moderately to well-differentiated squamous cell carcinoma, extending to all
margins.
3. Skin of left chin, shave: Invasive, well-differentiated squamous cell carcinoma, extending to deep margin.
Conclusions: Document embedding methods like Doc2vec are effective at encoding contextual information from free-text documents such
as pathology reports, which has applications in research, education, and retrieval of similar cases during case sign-out. A search feature
based on word and document embeddings may be built as a stand-alone program or incorporated as a feature in a laboratory information
system.
1536 Improving Pathology Case Search Accuracy Using Convolutional Neural Networks
Jerome Cheng, University of Michigan, Ann Arbor, MI
Disclosures: Jerome Cheng: None
Background: In most institutions, pathology reports are stored as unstructured free-text within the laboratory information system, often
leading to challenges in data retrieval. Conventional case searches for specific diagnostic entities involve querying the database for
keywords associated with the diagnosis of interest, and these queries can return results less specific than intended. In this study, a
convolutional neural network was applied to reports extracted with the keywords "colon" and "carcinoma", with the aim of increasing search
accuracy in identifying reports containing primary colonic adenocarcinomas.
Design: The diagnosis section of 1000 pathology reports with the terms “colon” and “carcinoma” were retrieved from our laboratory
information system through an SQL (Structured Query Language) Query. Each of the reports were labeled by a pathologist as either
positive or negative, where cases are considered positive if the case was a primary adenocarcinoma of the colon. Negative cases
comprised adenocarcinoma from other sites, metastatic adenocarcinomas, benign conditions, rectal cancers, and other cases that do not fit
in the primary colonic adenocarcinoma category. The 1000 cases were separated into 2 sets – 500 each for training and testing. The
training set contained 371 positive cases, and the test set had 351 positive cases. A Convolutional Neural Network model built using Keras
(a neural network library) was trained to identify positive cases, and the model was applied to the test set to predict the category for each
case.
Results: The CNN model classified 344 out of 351 primary colonic adenocarcinoma cases, and 126 out of 149 negative cases correctly
(see confusion matrix in Figure 1), achieving an accuracy of 94% and area under the ROC Curve (AUC) of 0.98 (Figure 2).
1446Figure 1 - 1536 Figure 2 - 1536
Conclusions: Trained CNN models by itself, or as an adjunct to keyword and pattern-based text extraction methods may be used to
search for pathology cases of interest with high accuracy. Since manually labelling cases is a time-consuming endeavor, CNN assisted
report identification is only recommended for large datasets, where the benefits may exceed the effort spent labelling a training set.
1537 High-Throughput WSI Scanning in the Histology Workflow of a Large Academic Lab
Thomas Chong1, William Wallace2
1
Los Angeles, CA, 2Keck School of Medicine of University of Southern California, Los Angeles, CA
Disclosures: Thomas Chong: Stock Ownership, Danaher Corp.; William Wallace: Advisory Board Member, Leica Biosystems
Background: The advantages of whole slide image (WSI) scanning in the anatomic pathology workflow has been well-documented. Some
facilities have already proceeded to all-digital workflows and have overcome the challenges with implementation of costly equipment. But
for most medium to large facilities, the digital slide scanner role has been relegated to lower-volume workflows. Newer high-throughput
whole slide scanners (80-100 slides/h at 40x power) is a promising step towards achieving an all-digital diagnostic workflow.
Design: Two Leica Biosystems GT450 scanners were stationed in the UCLA histology lab to receive a subset of non-time-critical cases.
QA was performed on digital WSI’s produced from GT450 using archival slides scanned at 40x. Three pathologists scored the quality of
180 total images from 1 unacceptable to 4 excellent, over three different sessions. The workflow was first evaluated to identify the time
intervals for peak slide output and to assess the manual sort and collation times. A slide adapter was used to expedite the transfer of dried
glass slides from the slide stainer/coverslipper slide racks to Leica slide racks. For each slide, we logged the scan time, region of interest
size, and image file size, and manually recorded slide scan issues.
Results: Three pathologists assessed image quality of all test slides to be excellent and sufficient for diagnosis. Slide transfer time from
cover-slipper racks to scanner racks using an adapter averaged 58s. Over 3 days, total scan time was 4h 40m, number of slides scanned
220, and avg scan time per slide 66s which includes rescan time. The types of errors encountered were barcode errors (16), image quality
errors (18), and “no tissue” errors (3). 34 slides were rescanned, almost entirely due to spurious mounting medium from the automated
coverslipper on the slide resulting in an expanded scan area.
Conclusions: In-line workflow trials of equipment is necessary to elucidate details and unforeseen issues in local implementation. In doing
so, we identified pre-scan factors (e.g. mounting medium errors and possible slide label barcode quality) that can be managed, leading to
more efficient scanning. Even including re-scanning due to mounting medium errors, scanning slides at 40x was faster than scan times that
were previously possible at 20x. The slide throughput of the GT450 is effectively 2-3x that of the prior generation scanner (AT2) at 40x,
allowing for fewer scanners for the same case volume, with no loss in image quality.
14471538 Development and Online Release of “ImmunoGenius”, a New Machine Learning Based Mobile
Application for Immunohistochemistry Interpretation
Yosep Chong1, Gyeongsin Park2
1
Seoul, Korea, Republic of South Korea, 2The Catholic University of Korea College of Medicine, Seoul, Korea, Republic of South
Korea
Disclosures: Yosep Chong: None
Background: Immunohistochemistry (IHC) has been playing a great role in the pathologic diagnosis for the determination of the tumor
origin by visualizing the protein expression. However, the IHC data is increasing exponentially and it is a huge challenge for the
pathologists to correctly interpret IHC results according to the up-to-date knowledge. We designed this project to develop an expert
supporting system that can quickly provide accurate IHC data and accelerate more efficient diagnosis process on the mobile platform.
Design: We developed a mobile application for iOS and Android using a probabilistic decision tree algorithm. Using over a dozen of the
major textbook including the WHO classification of tumours series and open literature data, the IHC expression database for the most
neoplasm in the textbook was built. The algorithm was trained with the real IHC profile data of 639 lymphomas and 634 tumors of unknown
origin (TUO) and validated with 392 lymphomas and 382 TUOs to compare the presumption accuracy.
Results: The IHC expression data of over 2009 neoplasms and 584 antibodies was built. The major features include IHC expression data
search by disease and antibody name and the generation of IHC profile table and diagnosis presumption with antibody test results. The
mobile application has been released on the Apple Store and Google Playstore. It can be downloaded by the searching query
“ImmunoGenius” or with the QR code. The presumption accuracy using training dataset was 94.7% for lymphomas and 78.5% for TUOs.
The presumption accuracy using validation dataset was 95.7% for lymphomas and 78.0% for TUOs, which is not significantly different from
that of the training dataset. The major cause of inaccurate presumption was due to atypical IHC profiles of a few cases, overlapping IHC
profiles between differential diagnoses, and the absence of disease-specific markers in some neoplasms.
Figure 1 - 1538
Conclusions: Better usage of IHC expression data in perspective of precision medicine can be achieved by the aids of computer expert
systems. This application can be a good supportive tool for a more comprehensive and integrated interpretation of IHC results.
14481539 Machine Learning as an Ancillary Tool in the Assessment of Shaved Margins for Breast Carcinoma
Excision Specimens
Timothy D'Alfonso1, David Ho1, Matthew Hanna1, Anne Grabenstetter1, Dig Vijay Kumar Yarlagadda1, Luke Geneslaw2, Peter
Ntiamoah3, Lee Tan1
1
Memorial Sloan Kettering Cancer Center, New York, NY, 2Memorial Sloan Kettering Cancer Center, Brooklyn, NY,
3
New York, NY
Disclosures: Timothy D'Alfonso: None; David Ho: None; Matthew Hanna: None; Anne Grabenstetter: None; Dig Vijay Kumar Yarlagadda:
None; Luke Geneslaw: None; Peter Ntiamoah: None; Lee Tan: None
Background: Breast conserving surgery for carcinoma includes excision of the primary lumpectomy specimen and separate oriented
specimens taken from margins of the lumpectomy cavity. This “cavity shave” method is associated with lower rates of positive margins and
fewer re-excisions. Pathologic assessment of these specimens, which are usually benign, can be time-consuming and require examination
of multiple (15-40) H&E slides per case. With the increasing capabilities of digital slide scanning, computational pathology approaches
could potentially improve the efficiency of this process by evaluating whole slide images (WSIs) of margins. We undertook a pilot study to
determine the utility of machine learning as a screening tool for assessment of margin specimens.
Design: Lumpectomy specimens for invasive ductal carcinoma (IDC) and ductal carcinoma in situ (DCIS) for which all slides were digitally
scanned were identified. Cases with positive and negative margins were randomly selected for analysis. A multi-class machine learning
model was trained by WSIs to automatically segment carcinoma, benign epithelium, stroma, necrosis, adipose tissue, and background. The
model utilized patches from multiple magnifications to predict tissue types. An image was classified as positive if >1 million pixels were
segmented as carcinoma.
Results: 98 margin specimens were evaluated from 20 patients, consisting of 425 WSIs (mean: 4.3 slides/specimen; range: 1-10). 25
specimens (60 WSIs) contained carcinoma (18 DCIS, 7 IDC +/- DCIS). 73 specimens (365 WSIs) were benign. At the individual slide level,
the model showed a sensitivity of 81% (49/60) and specificity of 85% (310/365) for identifying carcinoma. At the specimen level, sensitivity
was 96% (24/25) and specificity was 60% (44/73). Figure 1 shows a margin specimen with DCIS (A, C) with cancer segmentation in red (B,
D). Review of segmentation images revealed all 11 false negatives resulted from accurate segmentation, but of less than the
predetermined pixel cutoff (Figure 2). The main sources of false positive classification were reactive changes (biopsy site, elastosis,
cautery), fibrocystic changes, and lobular neoplasia.
Figure 1 - 1539 Figure 2 - 1539
Conclusions: Our initial model showed good sensitivity and fair specificity for detecting carcinoma in WSIs of margins and represents a
potential tool for increasing efficiency in their assessment. Further calibration of the machine learning algorithm to improve its accuracy via
additional manual annotation and analysis of additional margins is ongoing.
14491540 Development of Artificial Intelligence Algorithms to Quantify Nuclear Ki67 in Glandular Epithelial
Cells in Barrett’s Esophagus
Armando Del Portillo1, Caitlin Hills2, Elena Komissarova2, Jorge Sepulveda2, Julian Abrams2, Antonia Sepulveda3
1
New York, NY, 2Columbia University Medical Center, New York, NY, 3George Washington University, New York, NY
Disclosures: Armando Del Portillo: None; Caitlin Hills: None; Elena Komissarova: None; Jorge Sepulveda: None; Julian Abrams: None;
Antonia Sepulveda: None
Background: Digital pathology (DP) has the potential to efficiently analyze many images with less subjectivity and bias compared to
manual analysis. Barrett’s esophagus (BE) is a pre-cancerous lesion, and the proliferation index of BE epithelium may serve as a
biomarker of progression. To evaluate Ki67 proliferation index in the context of a BE clinical trial, we developed artificial intelligence (AI)
algorithms in a DP platform.
Design: Forty-six formalin-fixed, paraffin embedded biopsy samples from 23 patients from two different institutions participating in a clinical
trial for a new medical therapy for BE were studied. Sections were stained with hematoxylin, and co-immunostained with Ki67 (brown
chromogen), and pan-cytokeratin (CK, red chromogen). Slides were scanned at 400x using Aperio AT-2 whole slide scanner (Leica). We
manually annotated each image to include BE/gastric cardia-type epithelium, and eliminated squamous epithelium, oxyntic epithelium, and
excess stroma. We developed AI algorithms using HALO-AI (v2.3.2089.30, Indica Labs) to classify tissues into CK-strong epithelium, CK-
weak epithelium, stroma, and glass on the annotated images (Fig 1A-C). We then performed nuclear segmentation and determined
thresholds for nuclear Ki67 positivity (nuclear counting algorithm) (Fig 1D). We used an iterative approach to evaluate false positive and
false negative tissue classification and Ki67 quantification. For each image, representative glands were manually counted and compared to
AI nuclear counting algorithm. We also compared manual BE area to AI BE area.
Results: We generated 11 classifier algorithms, 15 nuclear counting algorithms, and 26 unique combinations of these algorithms in order
to analyze 46 stained sections. Nuclear counting algorithms were within 5% of manual count per image, and AI showed no significant
difference overall compared to manual (Table 1). Classifier algorithms increased BE area by an average 55% per image (SE=19%), and
significantly increased overall BE area (Table 1), requiring more precise annotations.
Manual (mean, SE) Optimal AI algorithm P value
(mean, SE)
BE area (mm2) 3.92, 0.37 5.24, 0.46 0.028
Ki67 count 121.2, 9.6 120.9, 9.52 0.98
Figure 1 - 1540
Conclusions: A combination of classification algorithms, nuclear segmentation and positivity algorithms, and precise annotations are
required for accurate Ki67 quantification in BE. Tissue artifacts or variability in staining requires a labor intensive custom algorithm
development per image in order to ensure accuracy using a chromogen method. Other methods with better dynamic
range (e.g. fluorescence-based stains) may be less sensitive to some of these variables.
14501541 The Enhancement of the Diagnostic Yield of Breast Core Needle Biopsies Using Optical Sectioning
Microscopy
Sapna Desai1, Jennifer Campbell1, Ramapriya Vidhun2, Richard Torres3, Eben Olson3, Michael Levene4, Theresa Profeta1, Paul
Fiedler1
1
Danbury Hospital, Danbury, CT, 2Western Connecticut Health Network, Danbury Hospital, Danbury, CT, 3Yale School of
Medicine, New Haven, CT, 4Applikate Technologies, Weston, CT
Disclosures: Sapna Desai: None; Jennifer Campbell: None; Ramapriya Vidhun: None; Richard Torres: Stock Ownership, Applikate
Technologies, LLC; Eben Olson: Stock Ownership, Applikate Technologies; Michael Levene: Stock Ownership, Applikate Technologies;
Theresa Profeta: None; Paul Fiedler: None
Background: Multiphoton microscopy is a 3-dimensional imaging technique in which two photons are used to excite fluorescence
emission. This process allows for the enhanced visualization of cells, organs and tissues at a more in-depth level than single-photon
microscopy, and results in improved color and nuclear clarity. Additionally, issues arising from the current process of embedding of tissues,
such as tearing and folding during embedding as well as damage to the specimens, can be avoided. Published literature comparing the
quality of images produced by multiphoton microscopy to single-photon microscopy is limited. Findings which determine that these images
have improved diagnostic potential could be of benefit to clinicians. This study aims to demonstrate the benefits and expanded diagnostic
potential of optical sectioning microscopy.
Design: Breast core needle biopsies were obtained through the Danbury Hospital Department of Pathology and the Yale University
Department of Research from tissue left over after sufficient tissue for clinical diagnosis had already been collected and processed.
Samples were selected by pathology tissue procurement personnel based on criteria of tissue type and cancer diagnosis, of which only
‘tissue type’ was recorded. Specimens were collected in cassettes labeled only with tissue type. A small portion of the sample was
chemically processed in the lab to achieve optical clearing and appropriate fluorescent staining. Three dimensional scanning was
performed using the multiphoton microscope in the laboratory. The image sampled was further processed using traditional embedding,
sectioning, and staining. Immunohistochemical stains were performed on the cleared and traditionally processed samples for comparison.
Results: A comparison of the images of the multiphoton and traditionally processed breast core biopsies revealed that image quality is at
the least comparable, if not superior using multiphoton processing. This was true for H&E stained slides as well as for the
immunohistochemical stains that were performed on each core, including E-cadherin, GATA-3, CK AE1/3, HER-2, ER, PR and p63.
Figure 1 - 1541 Figure 2 - 1541
Conclusions: The results demonstrate that multiphoton microscopy is an extremely valuable advancement in the processing and
diagnostic potential of breast core biopsies. While this abstract reviews the comparison of multiphoton microscopy to traditional processing,
further evaluation will consist of comparing additional tissue types and immunohistochemical staining.
1451You can also read