Navigating Weather, Water, Ice and Climate Information for Safe Polar Mobilities - WWRP/PPP No. 5 2017 - AWI
←
→
Page content transcription
If your browser does not render page correctly, please read the page content below
WWRP/PPP No. 5 - 2017

                        Navigating Weather, Water,
                        Ice and Climate Information for
                        Safe Polar Mobilities
WEATHER CLIMATE WATER
WWRP/PPP No. 5 - 2017

NAVIGATING WEATHER, WATER,
ICE AND CLIMATE INFORMATION FOR
SAFE POLAR MOBILITIES

Lead Authors (alphabetical)
Jackie Dawson (PPP-SERA co-chair, University of Ottawa, Canada), Winfried Hoke
(Alfred Wegener Institute, Germany), Machiel Lamers (PPP-SERA co-chair, Wageningen
University, Netherlands), Daniela Liggett (co-chair, University of Canterbury, New Zealand),
Gita Ljubicic (Carleton University, Canada), Brian Mills (Environment and Climate Change
Canada), Emma Stewart (Lincoln University, New Zealand), Rick Thoman (National
Atmospheric and Oceanic Administration, USA)

Contributing Authors (alphabetical)
David Atkinson (University of Victoria, Canada), Kevin Hughes (British Antarctic Survey,
United Kingdom), Maaike Knol (University of Tromsø, Norway), Katherine Wilson (Canadian Ice
Service, Canada)
EDITORIAL NOTE

METEOTERM, the WMO terminology database, may be consulted at:
http://www.wmo.int/pages/prog/lsp/meteoterm_wmo_en.html.
Acronyms may also be found at: http://www.wmo.int/pages/themes/acronyms/index_en.html.

WWRP Polar Prediction Project
For related documents refer to http://polarprediction.net

Cover page photos kindly provided by J. Dawson, E.J. Stewart and Meet the North

World Meteorological Organization, 2017

The right of publication in print, electronic and any other form and in any language is reserved
by WMO. Short extracts from WMO publications may be reproduced without authorization,
provided that the complete source is clearly indicated. Editorial correspondence and requests
to publish, reproduce or translate this publication in part or in whole should be addressed to:

Chairperson, Publications Board
World Meteorological Organization (WMO)
7 bis, avenue de la Paix                                   Tel.: +41 (0) 22 730 84 03
P.O. Box 2300                                              Fax: +41 (0) 22 730 80 40
CH-1211 Geneva 2, Switzerland                              E-mail: publications@wmo.int

NOTE

The designations employed in WMO publications and the presentation of material in this publication do
not imply the expression of any opinion whatsoever on the part of WMO concerning the legal status of
any country, territory, city or area, or of its authorities, or concerning the delimitation of its frontiers or
boundaries.

The mention of specific companies or products does not imply that they are endorsed or recommended
by WMO in preference to others of a similar nature which are not mentioned or advertised.

The findings, interpretations and conclusions expressed in WMO publications with named authors are
those of the authors alone and do not necessarily reflect those of WMO or its Members.

This publication has been issued without formal editing.

TABLE OF CONTENTS
Executive Summary
1. INTRODUCTION ................................................................................................. 1
1.1 Polar Prediction Project – Societal and Economic Research and
Applications (PPP-SERA) Working Group .................................................................. 3
1.2 Purpose and Framing of the Report ......................................................................... 4
1.3 Defining Value Chain............................................................................................. 5
1.4 Defining Mobilities ................................................................................................ 5
1.5 Navigating this Report .......................................................................................... 6
2. WEATHER, WATER, ICE AND CLIMATE INFORMATION PROVIDERS .................... 7
2.1 Introduction ........................................................................................................ 7
2.2 Overview of Information Providers .......................................................................... 7
2.2.1 Government agencies .................................................................................. 8
2.2.2 Private sector enterprises ............................................................................ 9
2.2.3 Academic or scientific institutions .................................................................. 9
2.2.4 Non-profit or community-based organizations ................................................. 11
2.2.5 The role of Indigenous and local knowledge .................................................... 13
2.3 Information Provision via the Value Chain ................................................................ 13
2.4 Examples of Current WWIC Products and Services .................................................... 14
2.5 Conclusion .......................................................................................................... 18
3. WEATHER, WATER, ICE, AND CLIMATE INFORMATION USERS ............................ 20
3.1 Commercial Transportation (Aviation and Shipping) .................................................. 21
3.1.1 Aviation ..................................................................................................... 21
3.1.2 Shipping .................................................................................................... 21
3.1.3 Expected future trends ................................................................................ 22
3.2 Community Activities ............................................................................................ 24
3.2.1 Expected future trends ................................................................................ 27
3.3 Tourism .............................................................................................................. 28
3.3.1 Expected future trends ................................................................................ 31
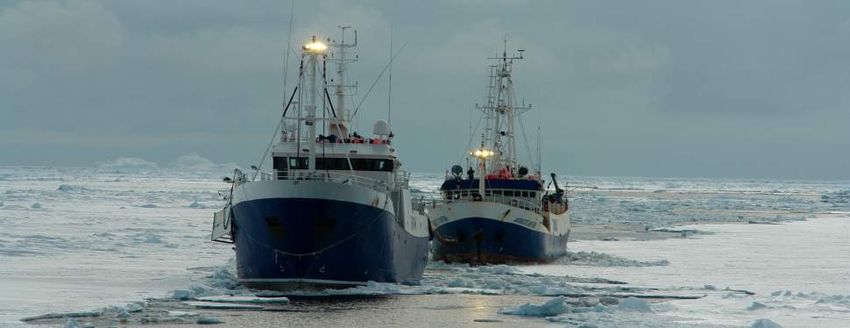
3.4 Fisheries ............................................................................................................. 33
3.4.1 Expected future trends ................................................................................ 35
3.5 Resource Extraction and Development .................................................................... 36
3.5.1 Expected future trends ................................................................................ 37
3.6 Government and Research Operations ..................................................................... 38
3.6.1 Expected future trends ................................................................................ 40
3.7 WWIC Information Needs ...................................................................................... 40
3.8 Conclusion .......................................................................................................... 41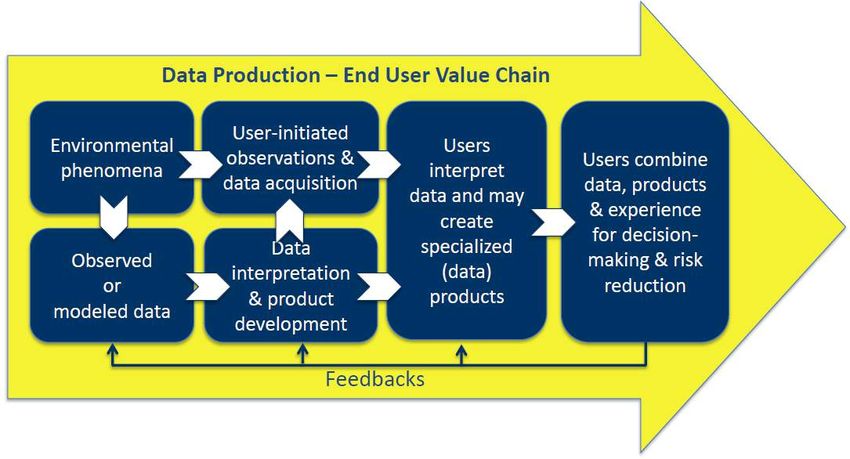
4.       THE PROVIDER-USER INTERFACE: GAPS, PRIORITIES AND A
         RESEARCH AGENDA ............................................................................................ 44
4.1      Introduction ........................................................................................................ 44
4.2      Mobility Patterns and Trends .................................................................................. 44
4.3      Risks, Risk Perceptions and Challenges .................................................................... 45
4.4      WWIC Information Use.......................................................................................... 45
4.5      WWIC Information Value Chain .............................................................................. 46
4.6      Research Agenda ................................................................................................. 47
         4.6.1 Understanding WWIC use in various human activities in the Polar Regions .......... 47
         4.6.2 Providers and the coproduction of WWIC services ........................................... 48
         4.6.3 The Provider-User Interface: The salience and effectiveness
               of WWIC services........................................................................................ 49

CONCLUSION ............................................................................................................... 50

REFERENCES ................................................................................................................ 51

Annex I: List of providers ................................................................................................ 65
EXECUTIVE SUMMARY

The Polar Prediction Project (PPP) was conceived and initiated in 2012 by the World
Meteorological Organization (WMO), through its World Weather Research Programme (WWRP),
in response to rapid environmental change in the Polar Regions. The primary goal of the PPP is
to advance scientific knowledge such that society, both within and outside of the Arctic and
Antarctic, may benefit through applications of improved weather and climate services. This
includes improved understanding and prediction of physical parameters and the ways people
use the available information. To this end, the Polar Prediction Project Societal and Economic
Research and Applications (PPP-SERA) working group was established in 2015.

This report represents the foundational work of PPP-SERA and aims to explore how weather,
water, ice and climate (WWIC) information is currently being used and produced in the Polar
Regions, by whom, and for what reasons. The report also identifies, frames and articulates
important areas of research related to the use and provision of environmental prediction
services that should be prioritized and further developed during, and beyond, the Year of Polar
Prediction (YOPP, 2017-19).

The concepts of information value chains and human mobilities are used in this document to
conceptualize the complex interaction between the production and use of environmental
prediction information. This approach facilitates: (a) the exploration of WWIC-related risks that
affect physical movement of people, goods and services between places (i.e. mobilities);
(b) an examination of the demand for, and production and mobilization of, WWIC knowledge
and information that can inform user decisions (i.e. value chain).

We identify that WWIC information provision occurs through a variety of actors, from formal
state institutions, to private and community-based organizations, to Indigenous and local
knowledge obtained by a range of individual actors or groups, positioned in an increasingly
complex value chain of information provision and use. The constitution, functioning and
implications of these increasingly complex WWIC information value chains are currently not
fully understood. Value chains used to describe linear processes whereby WWIC information
was transferred directly from providers to users. Today, users not only consume WWIC
information but they also co-produce data, information, and decisionmaking products. This has
largely been facilitated by technological advancement and improved communications via the
Internet, which promotes a decentralization of WWIC information services. Consequently, it is
difficult to discern whether or not user needs are being adequately identified and addressed by
providers and whether WWIC services are adding value to users.

Our analysis indicates that human activities and mobility sectors operating in the Polar Regions
vary widely in size and scope, and are diverse in terms of operational contexts and practices.
Despite the challenge of mapping the temporal and spatial dimensions of human activities in
the Polar Regions, due to a paucity of consistent information, we discuss relevant
characteristics and future prospects of a range of distinct mobility sectors including: (a)
commercial transportation (shipping and aviation); (b) tourism: (c) fishing; (d) resource
extraction and development; (e) community activities; (f) government activities and scientific
research. Most activities are on the rise and human activities in the Polar Regions are
becoming increasingly diversified. Users appear to be increasingly dependent on specialised
WWIC information services and technology needed to access these. More detailed, specialized
and near-real-time weather and climate services are required to provide relevant information
for a diversity of contexts and practices. While higher-quality WWIC information and greater
resolution of data is necessary for some, it is insufficient for all. There is no ‘one-size-fits-all’
data product needed to assist the variety of users. Furthermore, the existence of more and
improved WWIC information does not necessarily mean that it will be used. For WWIC data to
be valuable and used, they must be trusted, easily understood, accessible, and packaged for
easy transmission to remote areas with limited Internet bandwidth.

There is also a need for systematic documentation regarding particular uses of existing WWIC
information services, and thus more work is needed to collect data necessary to situate human
activities and their mobilities within their spatial-temporal contexts and decisionmaking
practices.

To respond to these knowledge gaps, we identify that in-depth qualitative and quantitative
research is needed which explores: (a) user information needs, behaviours and preferences;
(b) the relationship between users and providers of WWIC information, including the
co-production of services; (c) factors that enable or constrain access to, or provision of, WWIC
information services; (d) infrastructure and communication needs.

PPP-SERA, and social scientists involved in research that focuses on the Polar Regions more
broadly, can contribute to addressing some of the knowledge gaps outlined in this document.
We have compiled an initial database of sources for WWIC information that is of relevance for
different user sectors and across different regions, and we envision broader and ongoing
contributions to this effort. We also identify a need for categorization of users, decision factors,
services sought and providers tailoring products for specific mobilities. This will highlight the
complexity and interconnections between users, providers and decisionmaking contexts across
the Polar Regions.

The Polar Regions are undergoing dramatic environmental changes while seeing a general
growth and diversification of human activity. These changes imply that WWIC services not only
need to respond to rapidly transforming environmental parameters, but ought to be salient in
the diverse contexts in which users engage with them. While it is still largely unknown how
WWIC information services are currently being used, and to what extent they influence
decisionmaking and planning, improved access to, and quality of, WWIC information is
considered as significant for reducing the risks related to human activities in dynamic polar
environments.
CHAPTER 1. INTRODUCTION                                           1

1.              INTRODUCTION

The Arctic and the Antarctic Peninsula have been warming at a higher rate than any other
region in the world (see e.g. Graversen et al., 2008; Vaughan et al., 2003) resulting in
profound socio-economic consequences (Emmerson and Lahn, 2012). The prospects of
warming regimes causing continued decline of sea ice are propelling expectations of growth in
marine mobile activities, such as shipping, tourism and fisheries. For example, it is expected
that the Arctic will attract economic investments in excess of $100bn in the coming decade
(Emmerson and Lahn, 2012). It is claimed that we are transitioning from experimental
shipping activities (Brigham, 2010) to a more routine use of polar marine environments
(Hillmer-Pegram and Robards, 2015).

At the same time, there is growing concern about the risks involved in increased human
activities in the Polar Regions (see Table 1.1). Various reports of maritime incidents in both the
Arctic and the Antarctic region are calling for stricter regulations (e.g. the Polar Code) and
stronger capabilities with regard to maritime safety and search and rescue (SAR) (Liggett et
al., 2011; Dawson et al., 2014; 2016; Marchenko, 2014; Jabor 2014). The effects of climate
change in the Polar Regions are wide-ranging and include coupled physical events of relevance
to polar maritime sectors, such as fast-ice formation and breakup with the potential of episodic
iceberg calving events in the coastal zone, ice-shelf collapse, extreme weather events
combined with icing, and the opening and closure of coastal leads under anomalous
atmospheric conditions. In addition, the marine insurance industry – whose collaboration is
essential to the commercial viability of polar maritime activities – holds a host of safety and
navigational concerns (Marsh, 2014; Ghosh and Rubly, 2015; Jóhannsdóttir and Cook, 2015).

 Table 1.1. Examples of environmental changes and risks for human activities in the
                                  Polar Regions

Environmental change       Examples of safety risks
Changing sea ice           Changing patterns of freeze up and break up, lengthening of the open water
conditions                 season, and increased accessibility
Seasonality                Changing weather and ice conditions can affect seasonality, opportunities
                           for marine operations and local transportation, and also influence the timing
                           of safe transportation and resupply to both Arctic communities and Antarctic
                           research stations.
Extreme weather events     Increasing likelihood of more severe impacts from extreme weather events
                           (e.g. stronger storms and precipitation events) due to the disappearing ice
                           cover, resulting in higher waves, coastal erosion and icing that affects
                           marine operators and communities
Low visibility and other   Risk of damage for equipment and human life near airfields and during start
environmental factors      and landing due to fog, or while travelling on snow or ice
Thawing permafrost         Damage to (mobility related) infrastructure, increasing risk of avalanche
                           and landslides

It is widely recognized that, to realize the prospects and expectations of polar marine sectors
in safe ways, there is a great need for user-specified weather, water, ice and climate (WWIC)
information services in the Arctic (Eicken, 2013; Knapp and Trainor, 2013; 2015; WMO WWRP
PPP, 2013; EC-PHORS, 2015; WMO/WCP, 2015). The Arctic Council’s Arctic Marine Shipping
Assessment (AMSA) (Arctic Council, 2009) advised countries to facilitate the planning for and
operation of safe shipping activities by improving their investment in collecting and
maintaining high-quality hydrographic, meteorological, and oceanographic data, which would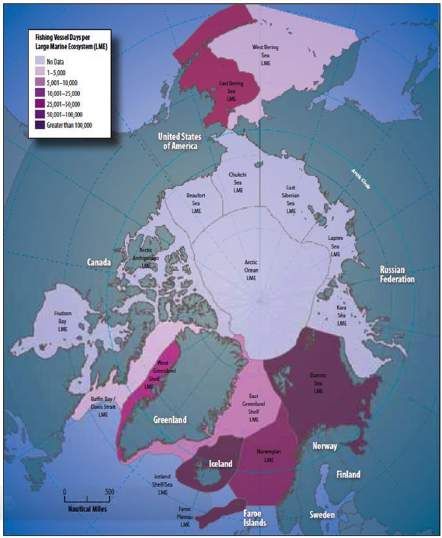
2 NAVIGATING WEATHER, WATER, ICE AND CLIMATE INFORMATION
FOR SAFE POLAR MOBILITIES
also be imperative for safe navigation (Brigham, 2010). However, it remains unclear what
WWIC services are needed to facilitate the expected increases in marine activities in polar
waters due to climate change and other socio-economic factors. It is also unclear what
information needs to exist and how WWIC services may differ among the wide variety of actors
operating in different polar contexts, how existing information services are used, and how the
utility of such services can be enhanced.
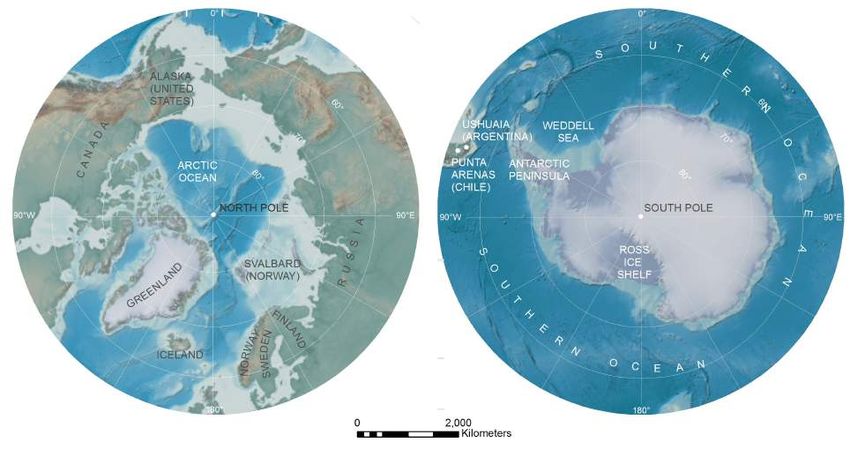
Polar Regions
The Polar Regions are defined in different ways, for different purposes. A common definition
includes the areas poleward of 66.6 degrees latitude (i.e. Arctic and Antarctic Circles) (see
Figure 1.1), where the sun continuously remains visible above the horizon on the summer
solstice and below the horizon during winter solstice. However, institutionally, the Antarctic
Treaty System, the group of states that collectively manage human activities in the Antarctic,
defines its land and ocean territory as south of 60 degrees southern latitude. Both Polar
Regions can also be defined by their unique bioclimatic thresholds, such as the tree line and
the zone of continuous or discontinuous ground permafrost in the northern hemisphere; the
equatorward extent of sea ice in both the Antarctic and Arctic; or the Antarctic convergence in
the south.
Figure 1.1. Map of the Arctic and Antarctic Regions
The Polar Prediction Project (PPP)
The Polar Prediction Project (PPP) was conceived and initiated by the World Meteorological
Organization (WMO) in 2012 through its World Weather Research Programme (WWRP) in
response to certain trends observed in the Antarctic and Arctic regions and related concerns
about human or environmental safety. Observed trends include:CHAPTER 1. INTRODUCTION 3
• Growth in resource development, transportation, tourism, other industries and research
activities in the Polar Regions such that more people, economic activities, and
infrastructure are becoming exposed to conditions that affect safety, health, mobility,
and productivity.
• Changes in the global climate system that may affect future weather patterns and, in
some situations, already have compromised the reliability of traditional and experiential
knowledge used by members of Indigenous societies and polar communities to deal
with WWIC related hazards.
• A limited ability to observe and predict polar weather, sea ice, waves, and related
physical environmental phenomena in the Polar Regions relative to other parts of the
world.
• Improvements in the ability to predict and forecast weather in many mid-latitude
regions will be limited until we better understand polar weather and climate.
The primary goal of the PPP is to advance scientific knowledge such that society, both within
and outside of Polar Regions, may benefit through applications of better WWIC information and
improved services. Although realizing this goal depends upon achieving an improved
understanding, characterization and modelling of atmospheric, oceanic, and land surface
processes in Polar Regions, the PPP acknowledges in the first of its eight objectives the parallel
need and challenge to translate scientific success into societal value (WMO Science Plan, 2013;
WMO WWRP PPP 2016). In this context, and for the purpose of this report, societal value is
defined as enhancing opportunities while reducing human risk.
1.1 Polar Prediction Project – Societal and Economic Research and Applications
(PPP-SERA) Working Group
Meeting the challenge to ensure societal value from scientific efforts demands the application
of social and interdisciplinary science to better understand WWIC-related decisionmaking and
communication processes that underpin scientific actions. It also requires improved methods to
evaluate impact and to measure social and economic value across a wide spectrum of potential
users across a range of cultural, social, political, economic and geographic contexts. Towards
these ends, the PPP established a special committee of social and interdisciplinary researchers
and service practitioners in 2015. This initiative led to the official establishment of the Polar
Prediction Project’s Societal and Economic Research and Applications (PPP-SERA) working
group.
The working group held an inaugural meeting in Ottawa, Canada in 2015 (WMO, 2015), a
second meeting in Christchurch, New Zealand in 2016 (WMO, 2016; Thoman et al., 2017), and
a third meeting in Fairbanks, Alaska in 2017. The task of the PPP-SERA involves defining,
developing and promoting a collaborative research programme to complement meteorological
and oceanic science activities in PPP (such as modelling and forecasting), much of which will be
undertaken around its Year of Polar Prediction (YOPP), a concentrated period of intensive
observation and modelling activities from 2017-2019 followed by an extended period of
analysis and research through to 2022.
The main interest of the PPP-SERA is in understanding human behaviours and decisionmaking
processes to identify the need for and utilization of WWIC prediction services. This document
represents a foundational contribution of the PPP-SERA working group.4 NAVIGATING WEATHER, WATER, ICE AND CLIMATE INFORMATION
FOR SAFE POLAR MOBILITIES
1.2 Purpose and Framing of the Report
The purpose of this report is twofold:
1) Scoping how WWIC information is currently being used and produced for the Polar
Regions, by whom, and for what reasons.
2) Identifying, framing and articulating important areas of research related to the use and
provision of environmental prediction services that could be prioritized and further
developed given available capacity, resources, and interest during, and beyond, the
YOPP.
The report is framed with the assumption that improving environmental prediction services will
not automatically lead to the enhancement of societal value. That is, the utility of an
environmental prediction product only has value if it is understood and actually used. For
example, it is plausible that the development of some of the most sophisticated, innovative,
and precise prediction tools may never lead to any enhancement in societal value if they are
too complicated for users to interpret, if they are too expensive to justify local purchase, or if
their resolution is too high for electronic transmission across the Polar Regions – an area with
limited communications infrastructure.
Thus, this report is purposefully focused on the complexities that exist among the social,
economic, political, and cultural relationships and ties among people, communities, institutions
and enterprises. This includes scientists observing and modelling the cryosphere, the climate,
and the atmosphere; the institutions and operators involved in data interpretation and the
development of environmental predication products; the several million Indigenous and non-
Indigenous inhabitants of the Arctic; and those temporarily working in or visiting either Polar
Region; but it also extends to people, places and organizations situated well beyond the Arctic
and Antarctic that influence activities and have interests there, or are affected by polar
activities and conditions.
To conceptualize the complex interaction among stakeholders involved in the production and
use of environmental prediction information, and to frame this document, we rely on two
foundational concepts: value chain and mobilities.
The concepts of value chain and mobilities are explained in the following section and are used
throughout the document to:
1) Explore patterns and characteristics of WWIC-related risks that affect physical
movement of people, goods and services between places.
2) Examine the demand for, and production and mobilization of, WWIC knowledge and
information (scientific, traditional, experiential) that can inform user decisions, for
example when to safely travel, conduct particular activities and take precautionary or
protective actions.
This approach aims to enable a better understanding of user needs and how WWIC information
can be enhanced through the application of improved observation and prediction, which in
turn, we hope will translate into improved outcomes and societal benefit.CHAPTER 1. INTRODUCTION 5 1.3 Defining Value Chain A value chain is defined here as the process by which organizations (whether governmental or commercial sector) add value to a product (in this case WWIC information). The WWIC information value chain recognizes the value of activities required in the production and use of information. It represents the cycle of a common information product, with the activities undertaken by different actors and organizations in the chain. These activities can be both primary value activities, related to aspects of the chain that are the core information product (e.g. data creation, information generation and knowledge application) and supporting value activities, related to aspects of the chain that assist the core information product (e.g. storage, processing and distribution). A value chain perspective to WWIC is useful as it provides a context to understanding the complex array of information provision in which individual actors seldom operate independently. In fact, most WWIC information providers function as one piece of a larger network of information producers, providers and users. Thus, there is a need to better appreciate some of the complex interactions and interlinkages such entities have among each other and ultimately with the users they serve. Figure 1.2 defines several specific functions, sources and flows of information that are typically undertaken or delivered by one or more organizations in the operation of formal WWIC services, from the environmental phenomenon at stake, to various forms of observed or modelled data, to interpretation, to information uptake, and finally to decisionmaking. Figure 1.2 Components of the value chain (after WMO, 2015:15; Dawson, 2016) 1.4 Defining Mobilities Polar environmental prediction services are essential for individuals living or working in Arctic communities or in Antarctic research stations, largely because they facilitate the safe and efficient movement of people, goods and services between places. We draw on the concept of mobilities following Sheller and Urry (2006) who define mobilities broadly as the movement or flow of people or information and/or knowledge.
6                 NAVIGATING WEATHER, WATER, ICE AND CLIMATE INFORMATION
                               FOR SAFE POLAR MOBILITIES

Mobility is a naturally integrating and organizing concept, whether used in everyday
conversation or in academia. Taken literally, it is most frequently used in reference to the
ability to physically move between two points. The objects in motion could be people, animals
and plants, raw materials, manufactured goods or a host of other things including ice, water
and atmospheric phenomena (e.g. storms). When viewed more as a metaphorical social
construct, mobility captures a broader range of transfer, including virtual travel, movements of
capital, changes in social status or class, or exchanges of technology, images, ideas, opinions,
knowledge and information.

Sheller and Urry (2006) describe what they call the mobility paradigm, or mobility turn, which
emerged and coalesced in the 1990s and early 2000s from academic contributions in
anthropology, cultural studies, geography, migration studies, science and technology studies,
tourism and transport studies and sociology. The mobility paradigm offers the distinct way of
viewing the world where mobilities become the primary objects of interdisciplinary research
and investigation, countering prevailing notions of mobility as a secondary or generic and
static process, quality or characteristic (Faulconbridge and Hui, 2016; Sheller and Urry, 2006).

In the Polar Regions mobility is a fundamental concept both from the perspective of individuals
such as residents and visiting scientists and from the perspective of relevant industries such as
tourism, fisheries, resource development, and maritime trade and transport. Local residents in
the Arctic regularly travel between and around communities to visit friends and relatives and
to access country and subsistence food sources, with the latter applying particularly to
Indigenous residents. Researchers engage in field studies traveling from various points to
others and engaging in weather-dependent field operations. In addition to their own necessary
mobilities, individuals living in communities across the Arctic or scientists living more
temporarily in the Arctic and Antarctic also rely on the mobility of goods and services from
other areas to the poles in order to survive. Maritime transport in both Polar Regions for re-
supply is now an essential service. Resource exploration and development in the Arctic and
fisheries and marine tourism in both poles are also examples of the various forms of mobility
occurring across the Polar Regions today. The availability and utility of accurate and relevant
WWIC prediction services to local residents, researchers and industry stakeholders are
fundamental for local and regional mobility and in many instances can mean the difference
between life and death.

1.5        Navigating this Report

The report provides discussion of: WWIC-information providers for the Polar Regions (Chapter
2); human use and activities trends in the Polar Regions, including a discussion of the types of
WWIC information key sectors use and why (Chapter 3); and the identification of knowledge
gaps and research needs that are focused on improving the societal value of WWIC prediction
products and services (Chapter 4).
CHAPTER 2. WEATHER, WATER, ICE AND CLIMATE INFORMATION PROVIDERS 7
2. WEATHER, WATER, ICE AND CLIMATE INFORMATION
PROVIDERS
2.1 Introduction
Throughout the report, we define information providers as individuals, groups, organizations
or enterprises that develop, hold, share, sell or exchange data, information and knowledge
with the intention of influencing a belief, decision or behaviour, or otherwise satisfying a real or
perceived need of a given user. We define users as individuals engaging in polar mobilities
that receive (or are targeted to receive) WWIC information via providers.
In order to identify the providers of WWIC information in the Polar Regions a selection of
available peer-reviewed literature, reports, inventories and surveys of WWIC service providers
in Polar Regions were compiled and reviewed, including recent assessments by the EC-PHORS
Services Task Team (2015) and Duske et al. (2016).
2.2 Overview of Information Providers
At first glance, it seems a rather uncomplicated task to identify and characterize the providers
of WWIC information in Polar Regions. However, these providers are distinguished by their
varying mandates or purpose, size and scope, activity, geographic coverage or focus and
longevity. For simplicity, in Table 2.1 we distinguish four general types of formal WWIC
information and knowledge providers: Government agencies, private sector enterprises,
academic or scientific institutions, and non-profit or community-based organizations (See
Annex 1 for a more extensive list of providers).
Table 2.1. Examples of WWIC information and knowledge providers
Arctic-focus Antarctic-focus Transpolar-focus
1) Government • Environment and • Antarctic Mesoscale • Arctic and Antarctic
agencies Climate Change Prediction Project Research Institute
Canada (ECCC) (AMPS) (AARI)
• Finnish • British Antarctic • National Oceanic and
Meteorological Survey (BAS) Atmospheric
Institute (FMI) Administration (NOAA)
• National Center for
Atmospheric Research
(NCAR)
2) Private • Ice Advisors None identified • PolarView
sector • Seaice.dk • GlobalWeatherLogistics
enterprises • IceBreakerNet • AccuWeather
• Martech Polar • The Weather Company
• UGRIB.US8 NAVIGATING WEATHER, WATER, ICE AND CLIMATE INFORMATION
FOR SAFE POLAR MOBILITIES
3) Academic or • Arctic Portal • Southern Ocean • SeaIcePortal.de
scientific • Northern Sea Route Observation System • IICWG International
institutions Information Office (SOOS) Ice Chart Working
• Nansen • Scientific Committee Group
Environmental and on Oceanic Research • International Council
Remote Sensing (SCOR) for Science (ICSU)
Center (NERSC) • Global Cryosphere • Sea Ice Prediction
• Arctic Research Watch (GCW) Network (SIPN)
Consortium of the • Antarctic • Climate and
United States Meteorological Cryosphere (CliC)
(ARCUS) Research Centre • Climate Data Operators
• International Arctic (AMRC) (CDO)
Buoy Programme • Byrd Polar and • National Snow and Ice
(IPAB) Climate Research Data Center (NSIDC)
Center
• The SCAR READER
Project
4) Non-profit • Sea Ice for Walrus None identified None identified
or community- Outlook
based • Local Environmental
organizations Observer Network
(LEO Network)
2.2.1 Government agencies
National Meteorological and Hydrometeorological Services (NMHSs) and National Ice Services
(NISs) have historically formed the backbone of WWIC research, development and service
provision in both the Arctic and Antarctic. These are large government organizations (dozens
to thousands of staffa) mainly funded through public taxation with several having
organizational origins dating back to the late 1800s. Their primary mandate is public safety
and the protection of important infrastructure and assets. The home countries of these
agencies control territory in the Arctic (Arctic Council members: Canada, Denmark, Finland,
Norway, Russia, Sweden, the United States), hold territorial claims in the Antarctic (Argentina,
Australia, Chile, France, United Kingdom, New Zealand, Norway), or operate bases in either
Polar Region. In recent decades, transnational programmes such as the European Union’s
Copernicus effort provide services and information delivery. Coordination is achieved through
international agencies, such as the WMO and the International Maritime Organization (IMO),
through which certain agencies take on the responsibility of providing basic information
services for particular regions (e.g. METAREAS (GMDSS, 2017)), or via less formal but no less
effective working partnerships, such as the International Ice Chart Working Group (IICWG). In
addition to their coordination function, organizations within some international agencies may
also act as service providers (e.g. the WMO’s Global Cyrosphere Watch).
a
Though not all work to produce knowledge and services strictly for Polar Regions.CHAPTER 2. WEATHER, WATER, ICE AND CLIMATE INFORMATION PROVIDERS 9 2.2.2 Private sector enterprises Private sector providers form another important group. More heterogeneous than government agencies, for-profit enterprises operate under a commercial mandate within a competitive market to serve particular sets of clients with tailored and often proprietary data, information, knowledge and advice. A few companies that offer global weather services (e.g. AccuWeather (2017a), the Weather Company (2017)) are as large as NMHSs but most are small to moderate in size (
10 NAVIGATING WEATHER, WATER, ICE AND CLIMATE INFORMATION
FOR SAFE POLAR MOBILITIES
information in support of a range of government-sponsored forecasting services. Examples
include the Byrd Polar and Climate Research Center’s Polar Meteorological Group, which
developed the Polar Weather Research and Forecasting Model that now feeds into the Antarctic
Mesoscale Prediction Model (AMPS) and provides weather and sea ice information with a focus
on the Ross Sea region; the Antarctic Meteorological Research Center at the University of
Wisconsin-Madison, which maintains a comprehensive observational network of Automatic
Weather Stations across the Antarctic continent (see Figure 2.1); and the National Center for
Atmospheric Research (NCAR), which is federally funding by the US National Science
Foundation (NSF) and is primarily based in Boulder, Colorado.
Automatic Weather Stations Halvfarryggen
( !
(
Antarctica - 2016 Soerasen !
( Troll
!
Camp Maudheimvida
Joinville Is !
( (
! Molodeznaya
Nordenskiold Utsteinen (
!
(
! Gerlache Strait
( Kohnen Base
!
Neko Harbor
AWS 17 * Mizuho
#
Cierva Cove AWS 14 Larsen Ice Shelf (
! JASE2007#
.
!
Amsler Island #
!
( Halley V *
Arelis
Bonaparte Pt ##
**
. !
*
! ( ! AWS 18 Windy * Relay Station
#
(
Inset Map A Hugo Is #
* ! ( AWS 1 Dome Fuji (JPN)
Bisco Island
(
! .
! Butler Is #
*
(
!
Dome Fuji
(
!
Whitlock
# Dismal Is #
*
* (
! ! Site 8
( Filchner
* Baldrick
#
(
!
Fossil Bluff Limbert (
!
Druznaja-4 Whoop
(
! Korff Ice Rise PANDA-North Whoop
China Lucia Sky-Blu !
( (
!
Manuela (
! (
!
Dome A Eagle !
(
Virginia #
*
(
! PANDA-South #
Eneide Union Glacier *(
! Mt Brown
(
!
(
!( Maria
! /
" (
!
Rita (
! Austin#
* Thiel Mountains #
* Henry
Jang Bogo Zoraida /
" #
* Nico AGO-4
!
( #
*
Penguin (
! (
! Kathie #
* Kominko-
Thurston Island Slade (WAIS)
Lola
#
* #
* *Theresa
#
Evans Knoll
(
! #
* Harry * #
# * Erin
Lindsey Island
Alessandra Byrd #
* #
* Sabrina
(
! Bear Peninsula #
* Elizabeth #
*#
* Emma Concordia Haupt Snyder
Nunatak Rocks
Janet #
* Siple Dome #
* Lettau # #
* Elaine Dome C II
(
!
* Skinner Saddle Dome C
Casey
Silvia Schwerdtfeger ( Marilyn
! #
*
(
!
(
! DC N
( Dome C (FRA)
! (
!
(!
!( Skiway
(
! Darwin Gl (
!
(!
!
0 50 km 0 500 km Margaret #
* Gill #
* # *#*! ( Central Valley Law Dome (
Summit/A Cape
Vito #
*##
* Poinsett
Russkaya !
(
*#
# *##*
*1
#
*
1
$(
!
1
$
#
*1!
(
!
$( .!
!
*$
* 1
$
1
$
#
*1
$1
$1
$.
!.
! ( Giulia Wilkins Runway
*#
1
$ *.
!
.
!
1
$
(
!
(((
! !
# # (
!
(
! West 4m / East ICAO
#
* Alexander Inset Map B See Inset Map B #
* D-85
#
*
Tall Tower #
*!
(
!( Modesta
(!
(!
! Sofia-B
(!(!
( Irene
Minna Bluff See Inset Map A (
! (
! (
!
#
*
(
!
(
! Paola D-47
#
* D-0
Minna Bluff Cape Hallett #
Linda **
# *#
*#
# *
(
!
D-10
D-3
D-17
Herbie Alley N Possession Is
Emilia #
*
White Is
Miers Valley
(
! Port Martin
! Garwood Valley
( Leningradskaya
#
* .
! Cp Denison
Lorne Cp Spencer (
!
#
* 1
$ * 1
# $ ( Bratina Island
!
Pegasus N
White Is S .!
.
elf White Out 1 #
$ * 1 Jules
$ .!
! LTER AWS (21)
United States AWS International AWS
Sh
1#
$*Willie Field 1 !
$ .!
.!
.!.
. #
*
Ice Biesiada Crevasse $
1 1
$ .
! .
!! !
. Mt Fleming Univ. of Wisconsin (UW) ! Australia
( !
( Netherlands
ss Ford
1 $
$ Rock
Pt !
. (
! #
*
Ro Ferrell N Crevasse
#
* 1 Tent Is Butter -
.
! Bull Pass
UW / Australia ( Belgium/Netherlands
! (
! New Zealand
#
* Ferrar .
! (
! #
* UW / China ( Brazil
! (
!
1
$ #
*
(
! 1 !
$ ( Victoria Valley Norway
1
$ Cp Royds (
! #
* UW / France ( China
! (
! Russia
Windless Cones Marble Pt II Victoria Lower Gl #
* UW / Japan ( China/Australia
! (
! South Korea
Bight Marble Pt #
* UW / New Zealand (
! United Kingdom
Laurie II Granite Harbour ( Finland
!
#
* #
* (
! #
* UW / United Kingdom ( France
! Other AWS
Cp Bird +
$ AGO ( Germany
! / Commercial
"
0 100 km Evans Piedmont Gl 1
$ SPAWAR ( Italy
!
!!
Arelis ( ( . Other US
! ( Japan
!
Coastline: ADD v4.1, 2003; Cartography: Oct 2016 Sam Batzli, SSEC, University of Wisconsin-Madison; Funding: National Science Foundation ANT-0944018
Figure 2.1. The location of Automatic Weather Stations (AWS)
in Antarctica (AMRC, 2017)
While individual projects may involve only a few scientists, focus on narrowly defined
problems, and be undertaken at very localised observation or research sites, they are
sometimes conceived within or absorbed into larger programmes, such as the International
Polar Year (IPY) or the Year of Polar Prediction (YOPP). In best-case scenarios, there is a
successful transfer of knowledge from shorter term (often < 5 years) research conducted by
these institutions into operational applications and services that lead to the sustainability of
observation and prediction systems that can be relied upon by decision-makers. Increasingly,CHAPTER 2. WEATHER, WATER, ICE AND CLIMATE INFORMATION PROVIDERS 11
the success of research funding proposals is at least partially predicated on demonstrating that
designs inform socially relevant questions, benefit and involve local populations or
stakeholders, have potential commercialization or operationalization prospects, and adopt open
data frameworks
2.2.4 Non-profit or community-based organizations
Providers are not restricted to those housed within government agencies, commercial
ventures, or academic institutions. Fewer in number and often smaller in size, non-profit or
community-based monitoring networks and organizations also develop and deliver important
information to those affected by WWIC conditions (Johnson et al., 2015; Kouril et al., 2016).
Many are initiated, supported or maintained through academic and government-funded
partnerships that serve both scientific and pragmatic needs, employing a range of locally
autonomous, collaborative, or eternally driven approaches (Kouril et al., 2016). Examples
include the Sea Ice for Walrus Outlook (Arctic Portal, 2017) in Alaska (see Box 2.2), the Arctic
Eider Society’s Community-Driven Research Network (AES, 2017), the Local Environmental
Observer Network (LEO, 2017), SmartICE (2017), and other locally run programmes such as
the Clyde River Weather Network (CRWN, 2017).
Box 2.2. Case of the ‘Sea Ice for Walrus Outlook’ in Alaska
The Sea Ice for Walrus Outlook (SIWO) (Arctic Portal, 2017) is a product designed specifically to assist
Alaskan walrus hunters and communities in the northern Bering and southern Chukchi Sea regions
during the spring hunting season. Walrus (Odobenus rosmarus) are a primary food source and culturally
critical to the Yupik and Inupiat communities of the region. The Outlook provides detailed information on
present sea-ice conditions and expected changes and a generalized weather forecast for the upcoming
week. The outlook was developed in 2010 in a collaborative effort between the National Oceanic and
Atmospheric Administration (NOAA), the University of Alaska and the Arctic Research Consortium of the
U.S. (ARCUS) in conjunction with Alaska Native sea ice experts and the Eskimo Walrus Commission.
Following the first season’s outlooks, feedback from the communities was critical to refining the outlooks.
Hunters emphasized the value of high resolution satellite imagery in their planning, and as a result
annotated graphics are now included as a routine part of the outlook. The community review also noted
the importance of social media in information dissemination and in limitations in Internet
communications due to low reliability and low bandwidth constraints. In 2013, the Alaska Sea Ice
Program within the National Weather Service Alaska Region assumed operational production of the
SIWO. The outlook is produced weekly starting in April and continues until sea ice clears the southern
Chukchi Sea region, typically sometime in June. Sea ice analysts and meteorologists provide ten-day sea
ice and weather forecasts, with an emphasis on winds and sea-ice conditions and expected changes.
Feedback and input throughout the season are provided by western Alaska walrus hunters. The outlook
is promoted through a Sea Ice for Walrus Facebook page and hosted online by the Study for
Environmental Arctic Change (SEARCH) and includes both text and graphics. A low bandwidth option for
accessing the outlooks and automatic email delivery are also available.12 NAVIGATING WEATHER, WATER, ICE AND CLIMATE INFORMATION
FOR SAFE POLAR MOBILITIES
Some data providers, such as the Polar Data Catalogue (PDC, 2017) (see Box 2.3) and the
Arctic Portal (2017), offer a service that integrates data and information provided by many
disparate sources. Since funding, voluntary contributions and partnerships are usually not
fixed or permanent, the services enabled through non-profit or community-based organizations
are subject to the same issues of long-term stability and viability as academic institutions.
Box 2.3. Polar Data Catalogue (https://www.polardata.ca/)
The Polar Data Catalogue (PDC) is a searchable database of metadata and data that describes and
provides access to data and information produced by Arctic and Antarctic researchers. Launched
online in 2007, the PDC contains thousands of datasets, satellite images, and links to other polar
data archives for use by scientists, decisionmakers, and the public (for a recent review see Church
et al., 2016). The PDC metadata records follow ISO 19115 (North American Profile) and Canadian
Federal Geographic Data Committee (FGDC) standard formats to facilitate discovery and exchange
with other data centres. Data and metadata contributors to the PDC are required to follow best
practices guidelines as described by Friddell et al. (2014).
The scope of the research in PDC covers a range of disciplines, from natural sciences to policy to
health and social sciences, the latter facilitated in part through partnership with the ArcticNet
Network of Centres of Excellence and access to its research holdings. The PDC collection contains
over 2,500 metadata entries (as of March 2017) and 2.8 million data files. While there is a definite
emphasis on Canadian and Arctic information, PDC holdings describing research from other
countries and Antarctica are increasing in number as links become established with international
portals (e.g. Circumpolar Biodiversity Monitoring Program, Conservation of Arctic Flora and Fauna;
Arctic Data Centre, Norwegian Meteorological Institute; National Institute of Polar Research, Japan;
British Antarctic Survey; National Snow and Ice Data Center, United States; Alaska Ocean Observing
System; Global Cryosphere Watch portal; Australian Antarctic Data Centre and others).
Recent PDC activities include extension of interactive data visualization capacity for specific ocean
and ice datasets, and careful consideration of how to acknowledge, archive, and protect
contributions from Indigenous Knowledge (IK) systems and sources. Continuous engagement and
participation of Indigenous people, for instance through dialogue at the 2015 Polar Data Forum
(http://www.polar-data-forum.org/) and other meetings, will be essential to ensuring proper
treatment and inclusion of IK into the PDC.
PDC offers at least a few possible opportunities for the World Meteorological Organization’s Polar
Prediction Project (PPP) and Year of Polar Prediction (YOPP) that may enhance the visibility,
relevance and legacy of the programme. A review of existing PDC holdings will provide an
immediate inventory of potential collaborators and users of research produced through PPP and
YOPP. The many monitoring, modelling and social science-related datasets expected to result from
PPP and YOPP activities would be welcome additions to the PDC, though storage constraints may
limit submissions to metadata descriptions. Finally, and perhaps most relevant to the PPP-SERA
component of the programme, PDC could be an interesting case study and partner in new social
science research that examines the use of data catalogues/portals and the societal value of data,
information, and knowledge contained therein to support decisionmaking.CHAPTER 2. WEATHER, WATER, ICE AND CLIMATE INFORMATION PROVIDERS 13 2.2.5 The role of Indigenous and local knowledge The majority of WWIC providers offer formal services defined by the presence of an overt mandate (i.e. legislated, officially sanctioned, institutionalized or commercialized), an organized structure and source of resources, and technologically-enabled means of disseminating science-based information to a targeted user base. While these are very important sources of WWIC information, they co-exist with another critical source of understanding weather, water, and ice that is not generally accessible through publications, data portals, or formalised WWIC services-Indigenous and local knowledge. Indigenous and local knowledge is accrued through long-term observation and lived experience, in other words by ‘doing’. This knowledge is typically held and shared by those with considerable experience with a given occupation, practice, lifestyle or activity. Over the past decade, Indigenous knowledge of safe ice and weather conditions has received considerable academic attention (Aporta, 2002; Nichols et al., 2004; Rees et al., 2008; Laidler, et al., 2009; Bartsch et al., 2010; Krupnik et al., 2010; Maynard et al., 2010; Gearheard et al., 2013). Such knowledge is shared both orally and through joint participation in activities. It is very rich and specific to a given location, time of year, and activity, and is often accumulated through many generations of practice and knowledge sharing. Such in-depth local knowledge, however, is not restricted to members of Indigenous societies. It is also prevalent among individuals engaging regularly in activities sensitive to WWIC conditions, such as ice road haulers, base managers, deep field scientists, tourism itinerary planners, expedition guides and ship captains. While this type of knowledge is informal, it is often vital and sometimes lifesaving relative to science-based sources in local decisionmaking (see the “ Community activites” section in Chapter 2). 2.3 Information Provision via the Value Chain The provider landscape has been presented above categorically but, in reality, individual information providers seldom operate independently or linearly. Rather, they operate within the value chain framework outlined in Chapter 1 (Figure 1.2). Thus, there is a need to better appreciate some of the complex interactions and interlinkages such entities have among each other and ultimately with the users they serve. The service production component of the value chain defines several specific functions, sources and diverse flows of information that are typically undertaken or delivered in the operation of formal WWIC services. In some cases, such as with NMHSs, most of the main functions identified in the information value chain outlined in Figure 1.2 are represented, or contained, within one single organization. For example, observations are processed, analysed and used in global and regional atmospheric, ocean and coupled models to predict future states, which are then shared within a given NMHS or NIS to produce textual, graphic, and audio forecasts and services for dissemination to end users. Even where these functions are centralized within a single organization, there is great reliance on information from other sources-in effect even a primary WWIC provider, such as an NMHS, is also a large user of upstream data and information. For example, weather and ice analyses and forecasts depend heavily on high-quality satellite observations which are typically managed by and acquired from space agencies (e.g. European Space Agency) or their commercial arms, affiliates, and partners (e.g. MDA (2017), access to Radarsat data from the
14 NAVIGATING WEATHER, WATER, ICE AND CLIMATE INFORMATION
FOR SAFE POLAR MOBILITIES
Canadian Space Agency). In many cases, users, for example in aviation and shipping, are also
providers of observations. Aircraft measurements (AMDAR (2017)) and ship-based ice and
weather reports are shared via the WMO Global Telecommunication system and make
significant contributions to a relatively poorly observed polar environment.
Further across the value chain, for instance when NMHSs produce forecasts of future weather
and climate conditions, outputs from multiple modelling systems can be combined (e.g.
probabilistic forecasts produced by the North American Ensemble Prediction System (NAEFS)
(Candille, 2009) or the North American Multi-Model Ensemble (NMME) (Kirtman et al., 2014).
Outputs from the European Centre for Medium-range Weather Forecasting (ECMWF, 2017)
global model are used by many NMHSs and private sector providers to develop specialized
products and services or to complement and interpret outputs from their own systems. As well,
the advancement of observation, modelling, and data processing systems depends in large
part on linkages to academic, government and commercial research institutions which may
design, test and develop components for the next generation of WWIC forecasts, products and
services.
Finally, the entire value chain is supported by a host of essential non-WWIC services. For
example, media and broadcast services help WWIC providers reach communities and public
audiences. Secondary disseminators then help individual providers to extend their reach to
larger or underserved user audiences (e.g. observations and forecasts carried globally through
the WMO World Weather Watch (WWW, 2017)). Increasingly, social media services are an
important source of WWIC. In theory, this link in the value chain should permit the translation
of scientific or technical information into actionable knowledge in communications prepared in
official and local languages and dialects, however, a cursory review of NMHS activities
suggests that this is rarely sustained in practice. Information and Communication Technologies
(ICT) allow WWIC information providers to both receive upstream data and disseminate their
information products to downstream providers and end-users. While important to all WWIC
prediction systems, they are particularly relevant in Polar Regions where satellite coverage and
communication bandwidths are limited.
2.4 Examples of Current WWIC Products and Services
Mobility-related decisions among residents, workers and visitors to the Polar Regions primarily
concern movements within or between communities to facilitate employment, social, cultural
and recreational pursuits, and in the case of the Arctic also between residences and the
locations of various subsistence activities, including hunting, fishing, and berry gathering.
Travel might be taken on foot, snowmachine, dogsled, boat, truck or automobile and will
involve accessing or crossing roads, paths/trails, open or frozen river, lake and ocean waters.
These factors affect decisions with respect to route choice, trip duration, stopping points along
the way, and a variety of protective measures (e.g. cancel or defer trip, take GPS, pack extra
provisions, etc.). Observations and near to short-term (hours to a few days) forecasts or
warnings of weather, water and ice conditions (e.g. storms, visibility, wind, temperature,
precipitation, water levels, waves, ice coverage, thickness/quality, movement) would seem to
be most relevant, based on the WWIC products disseminated by NMHSs and other providers
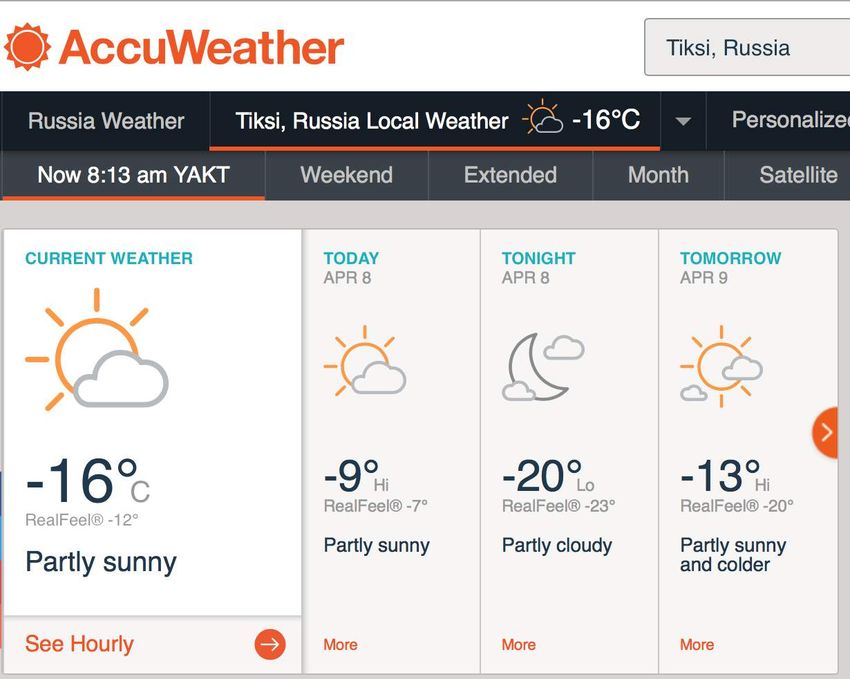
serving this user group. For example, standard public forecast products are available for
remote Arctic locations, such as Tiksi, Russia, from Roshydromet, the official NMHS of Russia,
BarentsWatch for Norway, and from AccuWeather – a large private-sector provider –, are
shown in Figure 2.2, Figure 2.3 and Figure 2.4. Longer-term forecasts might be useful in
planning activities, for instance when and where certain species might be present for hunting
or gathering.You can also read