Data provided by - National Venture Capital Association

Page created by Deborah Gutierrez
 
CONTINUE READING
Data provided by - National Venture Capital Association
YE ARBOOK
   Data provided by
Data provided by - National Venture Capital Association
Credits & Contact
National Venture Capital Association                 NVCA Board of Directors 2018-2019
(NVCA)
                                                     EXECUTIVE COMMITTEE
Washington, DC | San Francisco, CA | Palo Alto, CA

nvca.org | nvca@nvca.org | 202-864-5920              ALEXIS BORISY Third Rock Ventures, Chair
                                                     JAN GARFINKLE Arboretum Ventures, Chair-Elect
                                                     DENISE MARKS SV Health Investors, Treasurer
BOBBY FRANKLIN President and CEO
                                                     BRIAN RICH Catalyst Ventures, Secretary
JEFF FARRAH General Counsel
                                                     RICH WONG Accel Partners, At-Large
JUSTIN FIELD Senior Vice President of Government     MAHA IBRAHIM Canaan Partners, At-Large
Affairs                                              BARRY EGGERS Lightspeed Venture Partners, At-
MARYAM HAQUE Senior Vice President of Industry       Large
Advancement
STEPHANIE VOLK Vice President of Development         AT-LARGE
ALLYSON CHAPPELL Director of Conferences and
Events                                               BRUCE BOOTH Atlas Venture
CASSIE ANN HODGES Director of Communications         MICHAEL BROWN Battery Ventures
HANNAH MUNIZZA Director of Business                  MIKE CARUSI Lightstone Ventures
Development and Marketing                            CHRISTY CHIN Draper Richards Kaplan Foundation
CHARLOTTE SAVERCOOL Director of Government           JEFF CLAVIER Uncork Capital
Affairs                                              MICHAEL DIXON Sequoia Capital
MICHELE SOLOMON Director of Administration           STEVE FREDRICK Grotech Ventures
DEVIN MILLER Manager of Communications and           CHRIS GIRGENTI Pritzker Group Venture Capital
Digital Strategy                                     JOE HOROWITZ Icon Ventures
CLAIRE POZEK Manager of Public Policy                GEORGE HOYEM In-Q-Tel
                                                     MARK KVAMME Drive Capital

PitchBook Data, Inc.                                 LISA LAMBERT National Grid Ventures
                                                     MARY MEEKER Kleiner Perkins
pitchbook.com
                                                     EMILY MELTON Threshold Ventures
RESEARCH
reports@pitchbook.com                                PATRICIA NAKACHE Trinity Ventures
                                                     DEEPA PAKIANATHAN Delphi Ventures
EDITORIAL
                                                     VIC PARKER Spectrum Equity
editorial@pitchbook.com
SALES                                                WILL PRICE Next Frontier Capital
sales@pitchbook.com                                  GLENN RIEGER NewSpring Capital
                                                     CARMICHAEL ROBERTS Material Impact
JOHN GABBERT Founder, CEO                            PHIL SANDERSON SFVC
                                                     ANDY SCHWAB 5AM Ventures
ADLEY BOWDEN Vice President,
Market Development & Analysis                        JOHN SOMORJAI Salesforce Ventures
                                                     JENNIFER TEGAN Cayuga Venture Fund
                                                     NICOLE WALKER Baird Capital
DATA AND DESIGN
                                                     ALBERTO YEPEZ ForgePoint Capital
HENRY APFEL Data Analyst II
                                                     DAVID YORK Top Tier Capital Partners
HALEY BURSON Junior Graphic Designer

                                                     This publication has been created for the National Venture Capital
                                                     Association by PitchBook Data, Inc. COPYRIGHT © 2019 by
                                                     PitchBook Data, Inc. All rights reserved. No part of this publication
                                                     may be reproduced in any form or by any means—graphic,
                                                     electronic, or mechanical, including photocopying, recording,
                                                     taping, and information storage and retrieval systems—without
                                                     the express written permission of PitchBook Data, Inc. and the
                                                     National Venture Capital Association. Contents are based on
                                                     information from sources believed to be reliable, but accuracy and
                                                     completeness cannot be guaranteed. Nothing herein should be
                                                     construed as any past, current or future recommendation to buy
                                                     or sell any security or an offer to sell, or a solicitation of an offer to
                                                     buy any security. This material does not purport to contain all of
                                                     the information that a prospective investor may wish to consider
                                                     and is not to be relied upon as such or used in substitution for the
                                                     exercise of independent judgment.
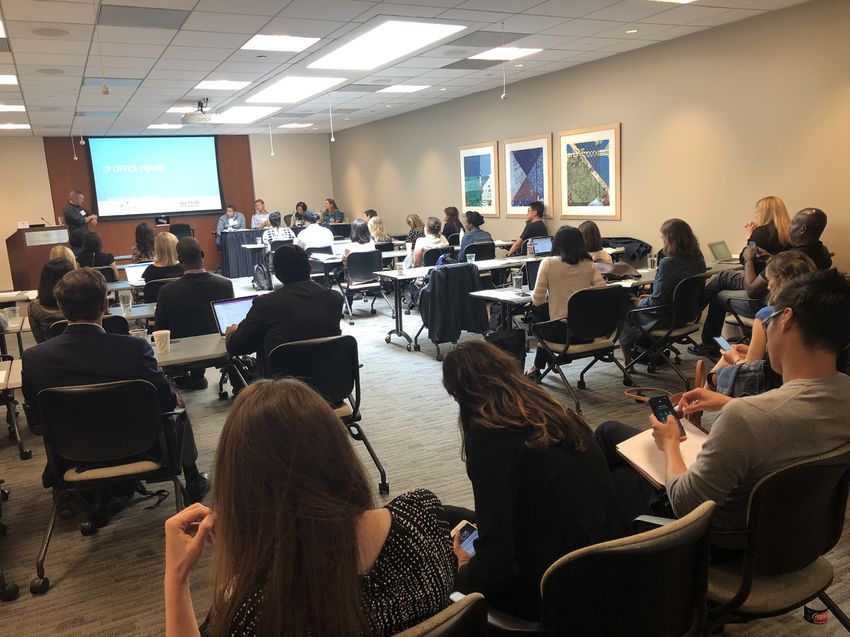
Data provided by - National Venture Capital Association
Data provided by

Contents
Dear Readers                                            04
Executive Summary                                       05
Venture Capital 101                                     07
The US Venture Industry At-A-Glance                     11
Capital Commitments: Venture Fundraising                19
Capital Deployed: Investment into Venture-
                                                        23
backed Companies
Exit Landscape: Venture-Backed IPOs & M&As              33
NVCA 2018 Year in Review                                37
Looking Ahead: NVCA’s 9 for 2019                        39
NVCA 2019 Events Calendar                               43
2019 NVCA Public Policy Initiatives                     44
Our Vibrant Member Community                            46
Glossary                                                48
Data Methodology                                        60
Geographic Definitions                                  61
Industry Code Definitions                               62

                                           3
                                 NVC A 2019 YE ARBOOK
Data provided by - National Venture Capital Association
Data provided by

Dear Readers
March 2019

Dear Readers:

NVCA’s 22nd annual Yearbook shines             for the industry in recent months. And if        big thank you to the NVCA member firms
a spotlight on the historic year the U.S.      creating the next big thing and navigating       who continue to support us for the greater
venture capital industry had in 2018.          economic volatility aren’t enough of             good of advancing the venture industry.
Record capital flows across the venture        a concern for the venture ecosystem,             Our work would not be possible without
cycle led headlines in 2018, as limited        regulatory uncertainty continues to reign.       you!
partners (i.e., investors into venture
                                               As the voice of the venture capital              And we once again thank our partner
funds) committed $54 billion to 257 U.S.
                                               community, NVCA was hard at work in              PitchBook, NVCA’s official data provider,
venture funds closed last year; nearly
                                               2018, continuing to advocate on behalf           for providing the data (unless otherwise
8,500 venture-backed companies raised
                                               of startups and venture firms on capital         noted) in this publication. The Yearbook and
more than $130 billion in funding; and 864
                                               markets reform, foreign investment               its supporting data may be accessed three
venture-backed exits surpassed a combined
                                               legislation, immigration policy, and tax         ways: 1) this PDF report; 2) the PDF data
value of $122 billion.
                                               proposals affecting the ecosystem, and           pack, which is available to the public; and 3)
However, beneath those large pools             more. While global venture investment            the XLS data pack, which is available only to
of capital has been an industry                dollars continue to grow, U.S.-based             NVCA members.

metamorphosis, with fewer funds raising        companies are attracting a smaller share
                                                                                                Excitingly, we continue to hear—from
capital, fewer companies receiving             (51% in 2018 and well below the 84% U.S.
                                                                                                venture capital investors, entrepreneurs,
investment, and fewer venture-backed exits     share in 2004). Policies that make the
                                                                                                industry advisors, academics, limited
taking place. At the same time, more types     U.S. the most attractive country to start
                                                                                                partners, policymakers, and others across
of investors are actively investing in the     and grow a business continue to drive our
                                                                                                the country—that the NVCA Yearbook is
startup ecosystem. The venture industry        advocacy efforts in Washington.
                                                                                                an important resource, supplementary to
today looks much differently than it did 10-
                                               2018 also brought new faces to the               the quarterly PitchBook-NVCA Venture
20 years ago, including shifting investment    NVCA team; educational initiatives;              Monitor. We hope you find this year’s
stages and large deals for later-stage         diversity and inclusion programs through         edition of the Yearbook helpful. Please
companies reaching new heights.                VentureForward; and events to engage with        share your feedback with us via our contact
                                               the industry on topics that matter to you. A     details below.
What are the latest venture capital data
trends for fundraising, investment, and exit
activity? How do these compare to previous
years? And what do they mean for 2019
and beyond? We unpack these trends in
more detail in this publication, as well as
dive into sector, geographic, and firm/fund
size analyses.

Public market volatility at the end of
                                               Bobby Franklin                   Maryam Haque
2018 and the start of 2019 gave pause to
                                               President and CEO                Senior Vice President of
the global financial world, and potential      Washington, DC                   Industry Advancement
corrections and the trickle-down effect on     bfranklin@nvca.org               San Francisco, CA
the venture market have been top of mind                                        mhaque@nvca.org

                                                                    4
                                                          NVC A 2019 YE ARBOOK
Data provided by - National Venture Capital Association
Data provided by

Executive Summary
The U.S. venture capital (VC) industry had a historic year in 2018, capping a five-year flurry of activity where $70 billion+ was deployed
into 8,000+ high-growth startups each year since 2014. Over that time period, nearly 49,000 venture investments attracted an aggregate
of $445 billion to start, build, and fuel innovative companies across the country.

At the end of 2018, 1,047 venture firms were in existence, managing 1,884 active venture funds and translating to approximately $403
billion in U.S. venture capital assets under management. All three metrics represent continued growth of the industry. However, while
capital flows have reached record heights, that capital is increasingly concentrated in the hands of fewer players.

In the past five to six years, the industry has trended towards bigger funds, bigger investments, bigger valuations, and bigger exits. At
the same time, there has been a peak and then decline in the number of funds, investments, and exits. Nonetheless, the past year (and
decade for that matter) has brought a new crop of transformative American venture-backed companies. These companies have disrupted
traditional industries and created new ones, and capital and guidance from venture investors have fueled their growth.

The changing dynamic of the industry has partly come from shifts in early stage investing; the composition of capital supply, i.e., the
diversity of the investor base, new types of investors, and new funds; and increased capital availability/investment at the later stages and
via mega deals. The question remains of whether the venture industry has reached a new normal or a peak ahead of a cooling off period.
While the answer to that question remains to be seen, there is no question that the venture industry of today is quite different than a
decade ago.

A record year for capital flows in the venture ecosystem coincided with a busy year of public policies impacting investors and
entrepreneurs in 2018. NVCA was at the forefront of these issues in Washington, advocating on behalf of the industry (see page 39). In
addition to advocacy, NVCA continued to serve the ecosystem with education, programming, research, and resources. NVCA’s 2018 “Year
in Review” starting on page 37 showcases the highlights, and be sure to check out what’s ahead in 2019 and how to get involved.

Highlights of the U.S. venture ecosystem in 2018:
CAPITAL COMMITMENTS TO VENTURE FUNDS (More details starting on page 19)

• Venture capital investors raised $54 billion across 257 funds to deploy into promising startups, marking the fifth consecutive year of
  $35 billion or more raised.

• 52 first-time funds raised $5.3 billion in commitments last year, with both metrics reaching a 15-year high.

• Sequoia Capital’s Global Growth Fund held an $8 billion final close in September 2018, making it the largest VC fund closed to date.

• VC funds based in 28 states held final closes on venture funds in 2018, with Indiana, Kansas, Montana, Alabama, Kentucky, and Rhode
  Island all seeing funds raised in 2018 after no disclosed venture funds raised capital in those states in 2017.

• The overall U.S. median VC fund size in 2018 was $75 million, a ten-year high and more than 50% larger compared to 2017.

• Outside of California, Massachusetts, and New York, median VC fund size reached $25 million in 2018, a steady increase since 2014 but
  still relatively small compared to the dominant venture hubs – the median for California, Massachusetts, and New York, collectively, was
  $100 million.

                                                                     5
                                                           NVC A 2019 YE ARBOOK
Data provided by - National Venture Capital Association
Data provided by

CAPITAL DEPLOYED TO STARTUPS (More details starting on page 23)

• More than 8,380 venture-backed companies received $131 billion in funding in 2018, eclipsing the $100 billion watermark set at the
  height of the dot-com boom in 2000.

• Mega deals (i.e., investments of $100 million+ into venture-backed companies) accounted for nearly half (47%) of total capital invested in 2018.

• Unicorns (i.e., venture-backed companies valued at $1 billion+), many of which raised mega deals, attracted $46 billion, or 35% of total
  capital invested, but less than 2% of the total deals completed in 2018.

• The number of angel/seed VC investments returned to pre-2013 levels, with 3,760 deals completed representing 42% of total deals in
  2018, the lowest absolute and relative figures since 2012.

• The number of both early stage and later stage VC investments increased for the second consecutive year in 2018, after what appeared
  to be a deceleration in 2016. However, on a quarterly basis, early stage and later stage deal count fell in 4Q 2018, suggesting a year-end
  deceleration with potential to spill over to 2019.

• Though the number of first-time financings (i.e., first round of equity funding in a startup by an institutional venture investor) continued
  to decline in 2018, the 2,040 companies raising first-time funding attracted a 15-year high of $10.1 billion.

• The software sector continued to attract the lion’s share of VC activity. But the life sciences sector saw significant growth, with more
  than $23 billion invested across 1,230+ companies in 2018, a record high for both metrics. The sector accounted for 18% of total capital
  invested and 15% of all companies receiving venture funding in 2018.

• For the sixth straight year, more than 1,000 venture investments involved corporate venture capital (CVC) participation. In 2018, 16% of
  all VC deals involved CVC, the highest share since 2006.

• Growth equity* investment in 2018 spiked after strong years from 2014 to 2017. Investors deployed $66 billion across 1,057 growth
  equity investments last year, with both metrics reaching 15-year highs.

• Venture funding reached startups in all 50 states and the District of Columbia, 222 Metropolitan Statistical Areas (MSAs), and 393
  Congressional Districts. Charleston, SC, Richmond, VA, and Indianapolis, IN saw the biggest growth rate** for annual number of VC
  investments over the past five years (for those MSAs with at least 15 in 2018). Indianapolis, IN, Columbus, OH, and New Haven, CT saw
  the largest annual growth for VC investment dollars over the past five years (for those MSAs with at least $10 million VC investment in
  2013 and 2018).

• Globally, $254 billion was invested across nearly 15,300 deals in 2018. The U.S. represented 51% and 58% of the global total,
  respectively.

EXIT LANDSCAPE (More details starting on page 33)

• In 2018, 85 venture-backed IPOs raised $63.6 billion, the highest aggregate annual total for capital raised since the dot-com boom
  except for 2012 when Facebook went public.

• Venture-backed companies accounted for 40% of all U.S. IPOs in 2018, a 15-year high.

• The number of disclosed mergers and acquisitions (M&As) have continued their dip since 2014, with 779 M&As in 2018 and far from the peak
  of 953 in 2014. However, last year’s 199 M&As with disclosed values represented a total of $58.4 billion in disclosed exit value, the highest
  since 2014.

• 33 unicorns held exits in 2018, the highest annual total on record, for an aggregate deal value of $76 billion.

*Growth equity is not included as a subset of overall VC data in this publication, but is rather its own unique dataset. More details on the methodology are on page [XX].

** Calculated as compound annual growth rate.

Note to readers: Figures for prior years throughout this edition of the Yearbook may be different from last year’s edition due to new and updated information.

                                                                                 6
                                                                       NVC A 2019 YE ARBOOK
Data provided by - National Venture Capital Association
Data provided by

Venture Capital 101
Venture capital has enabled the United                     financed with traditional bank financing; 2)                 is acquired or goes public, there is little
States to support its entrepreneurial talent               threaten established products and services                   actual value. Venture capital is a long-term
by turning ideas and basic research into                   in a corporation or industry; and 3) typically               investment.
products and services have transformed                     require five to eight years (or longer!) to
the world. Venture capital funds build                     reach maturity.
companies from the simplest form—perhaps
                                                                                                                        Venture Investors Partner
just the entrepreneur and an idea expressed                Venture capital is quite unique as an
                                                           institutional investor asset class. Venture
                                                                                                                        with Entrepreneurs
as a business plan—to freestanding, mature
                                                           capital funds make equity investments in a                   The U.S. venture industry provides
organizations.
                                                           company whose stock is essentially illiquid                  the capital to create some of the most
                                                           and worthless until a company matures                        innovative and successful companies.
Risk Capital for High-                                     five to eight years down the road. Follow-                   However, venture capital is more than

Growth Businesses                                          on investment provides additional funding
                                                           as the company grows. These “rounds,”
                                                                                                                        money. A venture capital professional’s
                                                                                                                        most precious asset is time. According to
Venture capital firms are professional,                    typically occurring every year or two, are                   a 2016 study, How to Venture Capitalists
institutional managers of risk capital that                also based on equity in the company, with                    Make Decisions?1, for every company in
enable and support the most innovative                     the shares allocated among the investors                     which a venture firm eventually invests,
and promising companies. Venture capital                   and management team based on an agreed                       the firm considers roughly 100 potential
supports new ideas that 1) could not be                    “valuation.” However, unless a company                       opportunities. The same study, which

Venture Capital Plays a Vital Role in a Startup’s Growth
    Company
Development                          Idea/Start up                               Development                       Growth                  Maturity
  Investment
                                      Seed. Angel                                Early Stage VC                Late Stage VC                  Exit
      Stages

               Concept,                  Product                  Operational,        Growth          Expansion
               business                development                  rollout
               planning

         Time

       Cash flow

                   Sources of funding: VCs, angel investors, incubators, accelerators, strategic investors (corporate groups),
                   growth equity investors, private equity firms, debt investors

1
Gompers, Paul A. and Gornall, Will and Kaplan, Steven N. and Strebulaev, Ilya A., How Do Venture Capitalists Make Decisions? (August 1, 2016). Stanford University Graduate
School of Business Research Paper No. 16-33; European Corporate Governance Institute (ECGI) - Finance Working Paper No. 477/2016. Available at SSRN: https://ssrn.com/
abstract=2801385

                                                                                   7
                                                                         NVC A 2019 YE ARBOOK
Data provided by - National Venture Capital Association
Data provided by

included results from a survey of 889           providing strategic and operational
                                                                                                  Common Structure —
venture capital professionals at 681 firms,     guidance, connecting entrepreneurs with
showed that the median venture firm             investors and customers, taking a board           Unique Results
closes about four deals per year. Team,         seat at the company, and hiring employees.        While the legal and economic structures
business model, product, market, valuation,     With a startup, daily interaction with the        used to create a venture capital fund are
fit, ability to add value, and industry are     management team is common. This active            similar to those used by other alternative
all important factors venture investors         engagement with a fledgling startup is            investment asset classes, venture capital
consider when evaluating investments            critical to the company’s success and often       itself is unique. Typically, a venture capital
into startups. Venture capital investors are    limits the number of startups into which          firm will create a Limited Partnership with
seeking entrepreneurs who are addressing        any single fund can invest. Many one- and         the investors as LPs and the firm itself
global markets, have superb scalability,        two-person companies have received                as the General Partner. Examples of LPs
demonstrate success within a reasonable         funding, but no one- or two-person                include public pension funds, corporate
timeframe, and truly innovative.                company has ever gone public! Along the           pension funds, insurance companies, family
                                                way, the company must recruit talent and          offices, endowments, and foundations.
A venture capitalist’s competitive              scale up. Any venture capitalist who has          Each “fund,” or portfolio, is a separate
advantage is the expertise and guidance         had an ultra-successful investment will tell      partnership.
they provide to the entrepreneurs in their      you that the companies capable of breaking
portfolio. Once the investment into a           through were able to evolve the original          A new fund is established when the venture
company has been made, venture capital          business plan concept due to careful input        capital firm obtains necessary commitments
partners actively engage with a company,        from an experienced hand.                         from its investors, say $100 million. The

The VC Fund Structure

   Venture Capital Firm                                                       Limited Partners
 (General Partners or GPs)                                                     (LPs, Investors)
                                                                                                                   Examples: public pension funds, corporate
                                                                                                                   pension funds, insurance companies, high
           VC                                                      LP          LP          LP            LP        net-worth individuals, family offices,
                                                                                                                   endowments, foundations, fund-of-funds,
                                                                                                                   sovereign wealth funds

     Fund manager                         Ownership of the fund

                                             Venture Capital Fund
                                             (Limited Partnership)

                                      Fund ownership of portfolio companies

     Investment              Investment            Investment             Investment               Investment
         into                    into                  into                   into                     into
      company                 company               company                company                  company

                                                                    8
                                                          NVC A 2019 YE ARBOOK
Data provided by - National Venture Capital Association
Data provided by

money is taken from Limited Partners
                                                              Economic Alignment of                                   their stock options. The venture capital
as the investments are made through                                                                                   fund and its investors split the capital gains
what are referred to as “capital calls.”                      All Stakeholders — An                                   per a pre-agreed formula. Many college
Typically, an initial funding of a company                    American Success Story                                  endowments, pension funds, charities,
will cause the venture fund to reserve                                                                                individuals, and corporations have benefited
                                                              Venture capital is rare among asset
three or four times that first investment                                                                             far beyond the risk-adjusted returns of the
                                                              classes in that success is truly shared. It
for follow-on financing. Over the next                                                                                public markets.
                                                              is not driven by quick returns, financial
three to eight years, the venture firm
                                                              engineering, debt, or transaction fees.
works with the founding entrepreneur to                                                                               At the same time, the risk capital that
                                                              Economic success occurs when the stock
grow the company. The payoff comes after                                                                              funds startups can bring benefits to local
                                                              price increases above the purchase price.
the company is acquired or goes public.                                                                               economies in the form of company growth,
                                                              When a company is successful and has a
Although the investor has high hopes for                      strong public stock offering, or is acquired,           competitiveness, and job creation. In fact,
any company getting funded, the 2016                          the stock price of the company reflects its             recent studies have found that high-growth
study How Do Venture Capitalists Make                         success. The entrepreneur benefits from                 startups account for as many as 50% of
Decisions? found that, on average, 15% of                     appreciated stock and stock options. The                gross jobs created, and an average of 2.9
a venture firm’s portfolio exits are through                  rank and file employees throughout the                  million net jobs created annually between
IPOs while about half are through an M&A.                     organization historically also do well with             1980 and 2010.²

How Venture Capital Works

          Fundraising               Investment                 Company Growth          Exit                       Returns                    Re-investment
          VCs raise capital for     VCs typically invest in    VCs provide active      After about 5–10           In addition to             The fund ends when
          funds from LPs.           young, high-growth         management and          years of creating a        companies benefitting,      all investments have
                                    companies in need of       act as advisors &       high-growth company,       VCs and LPs make           been exited and
                                    capital to scale.          mentors, taking         the VC exits its stake     a profit on their           proceeds have beem
                                                               board seats,            via an acquisition or      investment.                distributed to LPs.
                                                               providing strategic     IPO. IPOs have more        High-quality jobs are      LPs can then reinvest
                                                               advice, facilitating    advantages: greater        created, more              earnings in a new
                                                               introductions.          capital raised, higher     capital is available for   crop of funds.
                                                                                       returns, local job         university research,
                                                                                       creation.                  retirees have more
                                                                                                                  for retirement,
                                                                                                                  foundations have
                                                                                                                  more resources to
                                                                                                                  fund their work.

2
    Kauffman Foundation, The Economic Impact of High-Growth Startups (January 7, 2016). https://www.kauffman.org/-/media/kauffman_org/resources/2016/entrepreneurship-
policy-digest/pd_highgrowth060716.pdf and Decker, Ryan, John Haltiwanger, Ron Jarmin, and Javier Miranda. 2014. “The Role of Entrepreneurship in US Job Creation and
Economic Dynamism.” Journal of Economic Perspectives, 28 (3): 3-24. https://www.aeaweb.org/articles?id=10.1257/jep.28.3.3

                                                                                    9
                                                                          NVC A 2019 YE ARBOOK
Data provided by - National Venture Capital Association
Data provided by

The Impact of Venture-                                           A 2015 study, The Economic Impact of
                                                                 Venture Capital: Evidence from Public
                                                                                                                               capitalization: Microsoft ($780B), Apple
                                                                                                                               ($746B), Amazon ($737B), Alphabet ($727B),
backed Companies Beyond                                          Companies³, analyzed the impact venture-                      and Facebook ($374B).⁴
Financial Returns                                                backed companies, as a subset of all U.S.
                                                                 public companies founded after 1974, have
While venture investing has generated                            had on the economy. The study found
                                                                                                                               What’s Ahead
billions of dollars for investors and their                      that of the 1,339 U.S. companies that                         Much of venture capital’s success has come
institutions and created millions of jobs                        went public between 1974 and 2015, 556                        from the vibrant entrepreneurial spirit in the
over the years, the economic impact of                           (or 42%) are venture-backed. These 556                        U.S., financial recognition of success, access
venture-backed companies has been even                           companies represent 63% of the market                         to good science, a pipeline of talent, and fair
more far-reaching. Many venture-backed                           capitalization and 85% of total research and                  and open capital markets. It is dependent
companies have scaled, gone public, and                          development of those 1,339 companies.                         upon investment in scientific research,
become household names, and at the same
                                                                                                                               motivated entrepreneurs, protection of
time have generated high-skilled jobs and                        At the end of 2018, venture-backed
                                                                                                                               intellectual property, a skilled workforce,
trillions of dollars of benefit for the U.S.                     companies accounted for five of the six
                                                                                                                               and public policies that encourage
economy.                                                         largest publicly traded companies by market
                                                                                                                               new company formation. The nascent
                                                                                                                               deployment of venture capital in some
                                                                                                                               countries is gated by a country’s or region’s
                                                                                                                               cultural fit, tolerance for failure, services
                                                                                                                               infrastructure that supports developing
                                                                                                                               companies, intellectual property protection,
                                                                                                                               efficient capital markets, and the willingness
                                                                                                                               of big business to purchase from small
                                                                                                                               companies.

                                                                                                                               However, the rest of the world is catching
                                                                                                                               on to the power of venture capital
                                                                                                                               and entrepreneurship. Global venture
                                                                                                                               investment has been growing, as it has in the
                                                                                                                               U.S., but the U.S. has lost its dominance. In
                                                                                                                               the 1990s, startups in the U.S. accounted
                                                                                                                               for more than 90% of global venture capital
                                                                                                                               dollars invested. In 2018, the U.S. accounted
                                                                                                                               for 51% of global VC investment.

           New and aspiring venture investors receive guidance from experienced venture investors and LPs at LP Office Hours

3
    Gornall, Will and Strebulaev, Ilya A., The Economic Impact of Venture Capital: Evidence from Public Companies (November 1, 2015). Stanford University Graduate School of
Business Research Paper No. 15-55. Available at SSRN: https://ssrn.com/abstract=2681841 or http://dx.doi.org/10.2139/ssrn.2681841

4
    Source: YCharts data as of December 31, 2018. Berkshire Hathaway ranked fifth with a market cap of $500B.

                                                                                        10
                                                                               NVC A 2019 YE ARBOOK
Data provided by

At-A-Glance: The U.S.
Venture Industry
The size of the U.S. venture industry has
steadily increased over the past decade. At
                                                  VC AUM Summary Statistics
                                                                                                                   2006                2012             2018
the end of 2018, 1,047 venture firms were
in existence, defined as a rolling count of       # of VC Firms in Existance                                       876                 765              1,047
firms that have raised a fund in the last eight
years. These 1,047 firms managed 1,884            # of VC Funds in Existance                                       1,233               1,187            1,884

venture funds and had approximately $403          # of First Time VC Funds Raised                                  47                  31               52
billion in U.S. venture capital assets under
management (AUM) and $100 billion in dry          # of VC Funds Raising Money this Year                            191                 203              257

powder at the end of 2018.                        VC Capital Raised this Year ($B)                                 33.4                24.4             53.8

Thanks to a strong VC fundraising year in         VC AUM ($B)                                                      204.5               253.7            403.5

2018, VC AUM increased 14% year-over-             Avg VC AUM per Firm ($M)                                         200.9               201.3            242.4
year from 2017 to 2018, and brought
capital raised by venture funds in the past       Avg VC Fund Size to Date ($M)                                    139.3               242.6            234.7

five years to $200 billion. This has helped       Avg VC Fund Size Raised this Year ($M)                           200.0               130.0            218.8
the industry’s annual AUM grow at a rate of
6.44%* since 2004.                                Median VC AUM per Firm ($M)                                      57.7                38.5             38.6

                                                  Median VC Fund Size to Date ($M)                                 50.0                50.0             45.4
VC assets remain geographically
concentrated in three states—the dominant         Median VC Fund Size Raised this Year ($M)                        68.9                22.0             75.0

hubs for venture activity—California,             Largest VC Fund Raised to Date ($M)                              2,560.0             3,000.0          8,000.0
Massachusetts, and New York. These three
                                                                                                              Source: NVCA 2019 Yearbook, Data Provided by PitchBook
states together made up more than 85% of
                                                  * Number of firms in existence is based on a rolling count of firms that raised a fund in the last 8 vintage years
total U.S. VC AUM in 2018, representing a         * Number of VC funds in existence is based on a rolling count of funds that have closed in the last 8 vintage years
ten-year steady rise since 2008 when they         * AUM is calculated by adding together a firm’s total remaining value and their total dry powder.

accounted for 73% of the country’s AUM.
California, Massachusetts, and New York           US Venture Capital AUM by Year
saw year-over-year AUM increases of 16%,
14%, and 21%, respectively.                       500

                                                                            Total AUM ($B)
Kansas, Indiana, Montana, New Hampshire,
                                                  400
and Alabama were among the states
with the highest year-over-year VC AUM
increases. In fact, 34 states witnessed           300
increases in their VC assets under
management from 2017 to 2018, and 31
states had more than $100 million in AUM          200
at the end of 2018. However, as we always
note, VC assets by a firm’s headquarter
                                                  100
state oftentimes is not the most telling
                                                          $158

                                                                  $174

                                                                         $204

                                                                                 $226

                                                                                        $231

                                                                                                $233

                                                                                                       $241

                                                                                                                $259

                                                                                                                         $254

                                                                                                                                $260

                                                                                                                                        $291

                                                                                                                                               $321

                                                                                                                                                      $335

                                                                                                                                                              $354

                                                                                                                                                                     $403

figure since firms frequently invest in
companies outside their state, as noted on          0
the charts on page 27.                                  2004 2005 2006 2007 2008 2009 2010 2011 2012 2013 2014 2015 2016 2017 2018
                                                                                                              Source: NVCA 2019 Yearbook, Data Provided by PitchBook
*Calculated as compound annual growth rate.

                                                                          11
                                                                 NVC A 2019 YE ARBOOK
Data provided by

The trend of larger firms getting larger, and          investment, and $308 billion in exit value             precipitously over the past 15 years. The U.S.
an influx of newer, smaller funds continues            for venture-backed companies in 2018. The              accounted for 40% of total capital exited in
to unfold. The median venture firm size* was           U.S. share of global fundraising has remained          2018, dipping below 50% for the first time.
$39 million in 2018. Most firms (744 firms or          strong and last year accounted for two-                Similarly, the U.S. share of global venture
57% of firms) managed less than $100 million           thirds of total funds raised. However, the             investment has teetered close to 50% the
at the end of 2018, and 86 firms managed $1
                                                       global shares of capital invested and exited           past three years (reaching 51% in 2018), well
billion+, an uptick from 2017. Firms managing
                                                       attributed to U.S. companies have dropped              below the 84% global share in 2004.
$100 to $250 million comprised 22% of all
active U.S. VC firms last year.
                                                      Distribution of Firms by AUM in 2018
Last year, 7,303 active investors (all types
                                                       300                                                          284
and headquartered globally) made one or
more investment in U.S. companies, the third
                                                       250
consecutive year of decline after peaking                         223
in 2015. Active U.S.-based VC investors
also dropped slightly to 2,113 in 2018 after           200                                             185
                                                                              174
peaking in 2017. Similarly, U.S. VC investors                                              162

making first round investments also declined           150
                                                                                                                                    126
to 908, while U.S. active life science VC
investors rose to 604 (a 15-year high).                100                                                                                                       86
                                                                                                                                                  60
A banner year of investment in the U.S.                    50
buoyed global venture record highs of
$80 billion in fundraising, $254 billion in
                                                           0
                                                                $0-$10M     $10-$25M    $25-$50M     $50-$100M $100-$250M $250-$500M         $500-$1B           $1B+
Fund and Firm Analysis                                                                                        Source: NVCA 2019 Yearbook, Data Provided by PitchBook

              Total           Total                                            Firms that Raised                            Avg Firm      Median         Median
                                            Total Cumulative     Existing                            AUM        Avg Fund
              Cumulative       Cumulative                                      Funds in the Last 8                          Size*         Fund Size      Firm
                                            Capital ($B)         Funds                               ($B)       Size ($M)
              Funds            Firms                                          Vintage Years                                 ($M)          ($M)           Size* ($M)

 2004         1356             866          262.78               1128          814                   158.21      112.45     173.64        43.50          59.37

 2005         1490             912          285.83               1174          846                   173.75      139.66     175.96        50.00          56.35

 2006         1658             943          319.24               1233          876                   204.50      174.91     200.94        68.90          57.70

 2007         1815             937          354.13               1205          870                   226.09      190.66     213.31        100.00         58.02

 2008         1976             831          385.59               1094         765                    231.29      167.38     221.93        64.50          54.68

 2009         2082            778           397.50               1016         726                    232.67      100.06     208.86        33.00          49.37

 2010         2216            787           417.43               1055         720                    241.30      132.88     205.07        42.50          45.08

 2011         2359             822          443.75               1125         746                    258.91      169.79     212.36        40.00          43.56

 2012         2543             852          468.19               1187         765                    253.75      120.38     201.25        22.00          38.50

 2013         2745             899          488.78               1255         794                    260.45      95.36      206.97        30.50          41.04

 2014         3019             949          524.06               1361          818                   290.56      123.34     213.88        25.25          35.46

 2015         3295             988          560.07               1480          866                   320.66      124.61     221.02        30.00          35.62

 2016         3593            1033          601.17               1617         906                    335.12      132.57     218.67        45.50          34.50

 2017         3844            1104          635.52               1762         982                    354.19      134.69     217.62        50.00          34.22

 2018         4100            1167          689.34               1884         1047                   403.47      209.43     242.35        75.00          38.64

                                                                                                              Source: NVCA 2019 Yearbook, Data Provided by PitchBook
*Defined as Commitments + Net Asset Value
                                                                           12
                                                                  NVC A 2019 YE ARBOOK
Data provided by

Number of Active Investors (#)

                         # of           # of                            # of        # of                     # of          # of                            #Active        #Active
          # of           Active         Active           # of           Active      Active      # of         Active        Active           #Active        US             US VC
          Active         1st            Life             Active VC      VC 1st      VC Life     Active US    US 1st        US Life          US VC          VC 1st         Life
          Investors      Round          Science          Investors      Round       Science     Investors    Round         Science          Investors      Round          Science
                         Investors      Investors                       Investors   Investors                Investors     Investors                       Investors      Investors

 2004     2396           907            789              1291           565         463         1729         734           567             1006            476            368

 2005     2528           1007           803              1289           567         466         1849         801           566             1038            492            365

 2006     2768           1242           832              1376           684         500         2018         958           632             1087            558            404

 2007     3344           1464           990              1560           740         559         2404         1122          731             1246            629            453

 2008     3520           1456           969              1626           728         558         2533         1124          758             1289            600            453

 2009     2995           1252           852              1424           579         494         2184         978           658             1114            497            404

 2010     3499           1625           833              1570           697         488         2542         1246          655             1244            586            415

 2011     4494           2344           882              1794           891         511         3046         1653          713             1401            748            438

 2012     5644           2924           996              2042           1022        534         3545         1939          772             1584            835            447

 2013     7081           3318           1123             2278           1038        593         3956         1963          839             1705            843            487

 2014     9181           3738           1376             2632           1168        634         4515         2045          938             1950            950            505

 2015     9924           3700           1543             2822           1211        703         4654         1937          1010             2074           976            567

 2016     8142           2652           1199             2926           1172        650         4201         1552          840              2092           954            517

 2017     7692           2436           1369             3034           1253        743         4043         1481          911              2182           1015           571

 2018     7303           2130           1523             3115           1180        821         3849         1326          999              2113           908            604

*VC investors include entities with primary investor type as: Venture Capital, Corporate                              Source: NVCA 2019 Yearbook, Data Provided by PitchBook
Venture Capital, or Not-for-profit Venture Capital
*VC investors are headquartered globally, but only counted if they invested in a US company

U.S. as a % of Global VC Deal Flow by Year
                                  2006         2007             2008      2009       2010       2011        2012      2013           2014          2015          2016       2017      2018

 Global Deal Value ($B)           36.60          45.60          49.56      36.40     46.53      65.32       61.11        72.35       112.62        150.70        158.91      174.61   254.25

 US Deal Value ($B)               29.23          36.01          36.94      27.17     31.27      44.75       41.51        47.54       71.03         82.97         77.23       82.95    130.93

 Global Deal Value (#)            4,915          6,411          7,087      6,823     8,679      11,078      13,181       16,128      19,024        20,172        18,036      17,314   15,299

 US Deal Value (#)                3,344          4,319          4,727      4,487     5,409      6,759       7,882        9,301       10,573        10,740        9,200       9,489    8,948

 US as % of Global ($)            80%          79%              75%       75%        67%        69%         68%       66%            63%           55%           49%        48%       51%

 US as % of Global (#)            68%          67%              67%       66%        62%        61%         60%       58%            56%           53%           51%        55%       58%

                                                                                                                                     Source: NVCA 2019 Yearbook, Data Provided by PitchBook

                                                                                             13
                                                                                    NVC A 2019 YE ARBOOK
Data provided by

Active Investor count in 2018 deals by HQ state

         98                                      2                           5

                                                                                               28
                                                                                                                                                                                           2
                                                                             -                                    17
        35                                                                                                                                                                      -
                              2                      1                                                                                32                               461         3
                                                                                                     5                                                                           248
                                                                                 2                                                                                               8
                                                                                                                                                                63
                                                                                                                  84             30          30                                       5
                         17           19                                                                                                                                        28
                                                           60                        1                                                                                          26
                                                                                                         24                                            -
        1384                                                                                                                      12                       47                   37
                                                                                         4                                    19                           32
                                      21                   3                                             1
                                                                                                                                                       2
                                                                                                                   -         5             38
                                                                                 100
                                                                                                         3
                     -
                                                                                                                                                  42

                                                                 -
                                                                                                                                      Source: NVCA 2019 Yearbook, Data Provided by PitchBook.

U.S. as a % of Global VC Exits by Year
                              2006         2007          2008        2009        2010        2011         2012         2013           2014         2015         2016          2017        2018

Global Exit Value ($B)        48.03        85.57         25.84       31.84       64.03       94.14        135.11       104.61         229.95       117.33        106.59       145.66      308.63

US Exit Value ($B)            31.89        57.97         18.00       22.26       39.74       67.05        125.37       72.75          116.79       72.19         70.98        91.96       122.01

Global Exit Value (#)         873          1,065         820         784         1,187       1,238        1,409        1,528          1,919        1,895         1,697        1,694       1,444

US Exit Value (#)             533          623           487         480         704         738          875          900            1,078        1,020         888          885         864

US as % of Global ($)         66%          68%           70%         70%         62%         71%          93%          70%            51%          62%          67%           63%         40%

US as % of Global (#)         61%          58%           59%         61%         59%         60%          62%          59%            56%          54%          52%           52%         60%

                                                                                                                                      Source: NVCA 2019 Yearbook, Data Provided by PitchBook

                                                                                      14
                                                                             NVC A 2019 YE ARBOOK
Data provided by

Active Investor count in 2018 deals by Investor HQ State

          49                                        2                           3                   17
                                                                                                                                                                                         5
                                                                                                                                                                                    1
                                                                                                                                                                                              4
                                                                                -                                     21
         11
                                 1                      1                                                                                   35
                                                                                                                                                                         322                 137
                                                                                                         5
                                                                                    4                                                                                                        4
                                                                                                                                                  27                34
                                                                                                                      87                                                            23
                        9                20                                                                                        24                                               20
                                                              42                                                                                                                    8
                                                                                         8                   23                                         -
                                                                                                                                        6                                           29
              868                                                                                                                                             30
                                                                                                                                                                               18
                                                                                             1                                    22                           24
                                                                                                             2
                                         13                   2
                                                                                                                                                        3
                                                                                                                      -           2              26
                                                                                        75
                                                                                                              3
                    -                                                                                                                                   35

                                                                    1

                                                                                                                                    Source: NVCA 2019 Yearbook, Data Provided by PitchBook
                        Note: This map breaks out the 2,113 active VC investors by their HQ state. Note that active VC investors headquartered outside of the U.S. are not included in this map.

U.S. as a % of Global VC Fundraising by Year
                                2006        2007        2008            2009        2010         2011        2012          2013         2014           2015         2016        2017         2018

Global Capital Raised ($B)      47.63         55.07         53.18       22.69       38.85        47.68        39.25        34.07            51.49      76.45        71.01       57.33        80.05

US Capital Raised ($B)          30.70         29.04         28.63       10.48       18.46        25.19        23.35        19.68            35.02      35.88        40.51       34.17        53.82

Global Capital Raised (#)       401           411           444         337         385          434          433          405              485        498          540         478          450

US Capital Raised (#)           191           183           188         119         150          155          208          221              292        298          333         285          296

US as % of Global ($)           64%         53%         54%             46%         48%          53%         59%           58%          68%            47%          57%         60%          67%

US as % of Global (#)           48%         45%         42%             35%         39%          36%         48%           55%          60%            60%          62%         60%          66%

                                                                                                                                        Source: NVCA 2019 Yearbook, Data Provided by PitchBook

                                                                                         15
                                                                                NVC A 2019 YE ARBOOK
Data provided by

AUM by State 2018 ($M)

           6,405.44                        67.32                      72.82           918.13
                                                                                                                                                    96.24
                                                                                                                                                 47.96
                                                                                                                                                        202.09
                                                                      47.19                    1,089.01
           131.74
                               82.06               -                                                        2,449.38
                                                                                                                                     55,998.58           59,495.5
                                                                                        6.58
                                                                       84.68                                                                              -
                                                                                                                   1,490.99      3,542.12
                                                                                               6,889.44                                            5,111.74
                      127.09      2,799.65                                                             170.24                                       3,610.8
                                                       2,233.46                                                                                     69.25
                                                                          46.48          1,540.79                           -
                                                                                                           156.46                                 1,127.19
            228,185.22                                                                                                        2,992.07
                                                                                                                                              5,086.55
                                                                               8.48                     1,235.15              1,304.56
                                                                                          121.79
                                   599.17              29.14
                                                                                                                     12.16
                                                                                                    -   70.58 1,340.64
                                                                        4,185.9
                                                                                           259.67
                       -                                                                                                      1,923.23

                                                               1.79

                                                                                                                    Source: NVCA 2019 Yearbook, Data Provided by PitchBook

Top 5 States by AUM in
2018 ($B)
                                       AUM

California                             228.19

Massachusetts                          59.50

New York                               56.00

Illinois                               6.89

Washington                             6.41

Total                                  356.97

Source: NVCA 2019 Yearbook, Data Provided by PitchBook

                                                                                 16
                                                                        NVC A 2019 YE ARBOOK
Data provided by

AUM by As of Year by State ($M)
                        2004        2005        2006            2007          2008          2009              2010              2011

 Alabama                149.09      166.42      183.22          174.96        176.88         168.50           166.57             151.91

 Arizona                96.07       90.64       89.95           80.03         71.31          65.74            51.81              93.83

 Arkansas               -           -           -               -             -              -                -                  -

 California             73,452.53   81,792.14   96,984.68       104,372.02    111,139.84     113,180.54       118,938.43         127,496.25

 Colorado               1,461.00    1,280.05    1,190.60        1,748.00      1,665.34       1,557.91         1,946.44           1,907.10

 Connecticut            6,306.07    7,287.30    10,160.91       10,580.67     9,504.82       9,573.97         9,897.09           9,485.17

 Delaware               8.50        6.07        24.11           17.46         12.66          11.44            11.83              11.75

 District of Columbia   1,525.37    1,472.29    1,606.19        2,486.00      2,515.83       2,328.34         2,135.61           2,629.51

 Florida                1,002.77    1,292.62    1,260.91        1,515.82      1,571.55       1,548.03         1,531.42           1,480.28

 Georgia                865.19      896.36      1,204.87        1,308.52      1,210.95       1,296.65         1,524.51           1,551.14

 Hawaii                 7.62        6.80        7.03            6.88          7.20           6.99             6.29               5.72

 Idaho                  23.71       22.01       21.91           94.11         81.71          78.88            94.82              95.80

 Illinois               3,311.23    3,288.42    3,948.46        4,389.52      4,514.67       4,410.87         4,783.77           5,594.44

 Indiana                345.34      318.79      308.16          289.51        240.96         221.20           207.58             182.32

 Iowa                   30.93       28.71       28.58           26.54         21.34          18.20            16.43              14.37

 Kansas                 4.25        3.04        5.57            2.30          -              -                -                  2.66

 Kentucky               138.77      147.77      353.94          342.54        316.40         292.31           282.76             305.30

 Louisiana              501.55      521.84      605.47          602.49        577.75         617.92           669.88             607.23

 Maine                  259.66      246.55      241.12          290.66        257.90         246.26           251.63             260.73

 Maryland               1,871.10    1,844.96    2,146.36        2,440.75      2,110.22       1,965.65         1,752.44           1,551.42

 Massachusetts          27,697.74   30,136.30   33,401.91       38,755.68     37,365.58      37,869.54        39,110.10          41,675.81

 Michigan               424.81      395.45      387.34          438.25        1,324.47       1,454.30         1,708.03           1,910.94

 Minnesota              859.62      1,196.23    1,581.22        2,064.32      2,115.72       1,920.58         1,815.05           1,716.35

 Missouri               1,268.98    1,206.67    1,229.15        1,451.81      1,308.34       1,175.36         1,146.50           1,202.92

 Montana                -           -           1.75            1.73          1.70           1.54             1.59               1.58

 Nebraska               26.67       25.49       22.58           21.11         16.53          15.11            15.95              51.80

 Nevada                 52.12       48.55       44.25           43.01         81.83          78.53            74.88              70.89

 New Hampshire          14.76       14.22       63.36           62.27         59.91          52.95            51.98              51.93

 New Jersey             3,653.46    4,619.47    5,918.39        6,616.52      5,815.00       5,955.05         5,967.82           5,800.09

 New Mexico             46.38       88.07       110.55          94.35         85.84          87.70            99.06              83.77

 New York               16,286.01   16,917.91   21,258.83       23,394.37     21,219.27      20,914.62        22,062.10          27,668.71

 North Carolina         910.82      1,099.11    1,443.16        1,388.04      1,364.55       1,264.24         1,220.18           1,035.92

 North Dakota           -           -           -               -             10.58          10.39            10.73              10.92

 Ohio                   1,207.50    1,147.43    1,185.86        1,133.65      1,112.43       1,079.38         1,054.11           1,000.22

 Oklahoma               53.06       46.37       69.53           66.41         51.33          47.68            41.01              27.19

 Oregon                 102.08      95.94       87.99           81.68         66.28          62.08            72.49              69.00

 Pennsylvania           2,857.87    2,915.72    3,243.28        3,476.77      3,598.11       3,877.97         4,072.53           3,999.73

 South Carolina         -           -           -               -             -              -                -                  -

 South Dakota           -           10.08       9.85            9.16          40.55          39.89            57.45              58.58

 Tennessee              618.07      634.84      658.36          683.80        634.33         601.88           618.07             558.10

 Texas                  5,568.48    6,005.25    6,063.04        5,880.86      6,092.95       5,748.56         5,549.89           6,169.35

 Utah                   441.11      415.23      543.66          861.94        953.52         1,106.66         1,098.36           1,302.32

 Vermont                13.74       12.76       12.70           11.80         22.95          21.31            25.76              25.01

 Virginia               1,759.77    2,261.63    2,646.25        2,881.06      3,552.82       3,509.28         3,413.20           3,638.92

 Washington             2,904.71    3,660.54    3,891.50        5,654.31      8,117.73       7,925.23         7,290.53           6,864.44

 Wisconsin              64.24       70.94       235.73          234.40        272.39         251.53           445.63             480.46

 Wyoming                16.91       16.16       14.32           13.39         10.48          9.58             8.53               7.09

                                                                                           Source: NVCA 2019 Yearbook, Data Provided by PitchBook
                                                                17
                                                       NVC A 2019 YE ARBOOK
Data provided by

                       2012         2013         2014          2015         2016                  2017                2018

Alabama                137.88       117.65       122.42        117.12       88.83                  58.10               70.58

Arizona                129.05       248.12       420.15        448.72       482.03                 552.49              599.17

Arkansas               -            -            9.91          9.78         104.31                 115.01              121.79

California             126,269.96   129,089.83   151,794.86    169,760.43   185,683.36             197,292.83          228,185.22

Colorado               1,709.71     2,053.43     2,091.71      3,113.71     2,304.71               2,207.35            2,233.46

Connecticut            9,444.27     8,925.44     8,763.41      6,941.82     5,960.51               5,332.06            5,111.74

Delaware               15.46        16.17        41.93         44.56        56.84                  67.53               69.25

District of Columbia   2,514.61     2,742.11     2,588.96      2,497.75     2,788.28               4,955.91            5,086.55

Florida                1,606.32     1,550.58     2,012.79      2,020.39     1,984.05               2,009.22            1,923.23

Georgia                1,388.17     1,407.76     1,498.24      1,590.07     1,416.98               1,412.75            1,340.64

Hawaii                 3.78         3.74         4.26          3.85         3.18                   1.59                1.79

Idaho                  91.75        102.75       85.78         73.70        83.81                  119.37              82.06

Illinois               5,328.65     5,359.37     6,013.11      6,099.81     5,757.79               6,582.54            6,889.44

Indiana                174.33       152.83       114.61        110.66       80.13                  40.07               170.24

Iowa                   16.26        18.10        5.06          5.93         5.53                   6.45                6.58

Kansas                 2.52         2.70         2.96          3.08         3.62                   3.32                46.48

Kentucky               277.63       282.02       225.65        238.05       187.61                 159.89              156.46

Louisiana              549.09       561.63       598.93        569.95       453.26                 290.22              259.67

Maine                  228.22       238.77       210.93        332.33       293.51                 199.81              202.09

Maryland               1,489.95     1,531.68     1,429.92      1,375.04     1,099.68               979.05              1,127.19

Massachusetts          40,117.51    42,249.83    41,997.24     46,476.23    49,217.45              52,345.49           59,495.50

Michigan               1,761.89     1,988.56     2,133.07      2,249.06     2,379.79               2,284.56            2,449.38

Minnesota              1,821.07     1,783.97     1,891.06      1,526.71     1,123.48               1,052.23            918.13

Missouri               1,001.83     1,218.33     953.29        1,035.07     1,123.06               1,317.10            1,540.79

Montana                1.47         1.51         1.47          4.20         25.62                  27.41               67.32

Nebraska               40.21        41.46        45.84         48.24        85.17                  82.25               84.68

Nevada                 108.17       97.63        114.75        115.06       97.04                  120.53              127.09

New Hampshire          47.38        49.21        47.72         49.00        39.49                  40.61               96.24

New Jersey             5,599.65     5,468.81     5,421.15      5,440.42     4,791.18               4,277.82            3,610.80

New Mexico             58.33        60.40        58.68         106.09       51.72                  46.93               29.14

New York               28,296.01    29,402.14    36,120.51     43,427.57    43,080.25              46,241.32           55,998.58

North Carolina         1,076.31     1,162.26     1,075.77      1,084.05     1,190.67               1,404.13            1,304.56

North Dakota           10.62        54.32        62.44         66.97        67.84                  69.29               72.82

Ohio                   934.62       1,121.12     1,188.30      1,175.29     1,425.91               1,405.36            1,490.99

Oklahoma               13.72        12.97        12.57         12.07        9.26                   8.92                8.48

Oregon                 68.84        63.66        84.17         95.15        97.45                  114.28              131.74

Pennsylvania           3,675.79     3,644.13     3,936.15      4,110.33     3,470.70               3,278.05            3,542.12

South Carolina         -            5.85         9.46          10.31        10.72                  11.75               12.16

South Dakota           56.62        58.55        68.16         63.04        55.35                  50.41               47.19

Tennessee              620.37       764.94       800.25        796.98       1,099.05               1,208.12            1,235.15

Texas                  5,429.58     5,051.18     4,455.72      4,244.24     4,022.94               3,654.58            4,185.90

Utah                   1,259.37     1,709.49     1,974.28      2,458.19     2,626.02               2,578.97            2,799.65

Vermont                24.38        24.46        35.41         32.66        41.74                  45.31               47.96

Virginia               3,370.09     2,907.98     3,550.03      3,370.87     2,871.49               2,827.34            2,992.07

Washington             6,401.11     6,510.62     5,620.74      6,420.65     6,428.20               6,353.75            6,405.44

Wisconsin              571.44       590.79       870.91        882.44       854.64                 956.78              1,089.01

Wyoming                5.80         -            -             -            -                      -                   -

                                                                                    Source: NVCA 2019 Yearbook, Data Provided by PitchBook
                                                          18
                                                 NVC A 2019 YE ARBOOK
Data provided by

Capital Commitments:
Venture Fundraising
In 2018, 257 U.S. venture capital
funds closed on $54 billion in capital
                                                U.S. VC Fundraising by Year
commitments. Last year’s capital raised                                                                   Capital Raised ($B)                               310
is the highest figure on record, and 2018                                                                                                 286
                                                                                                          # of Funds Closed
marked the fifth consecutive year of $35                                                                                                           289
                                                                                                                                                                             257
billion+ in fundraising. Venture fund sizes
                                                                                                                                                                     255
reached a decade high with a median
and average size of $59 million and $185                                                                                203
                                                                  191               188                                          216
million, respectively. Factoring into this
trend was Sequoia Capital’s Global Growth                                  183
                                                         165                                          150
Fund closing on $8 billion, earning the         155                                                            155
title of largest venture fund on record.
                                                                                             119
Furthermore, 10 funds closed on $1 billion+
in 2018 and accounted for 41.86% of total
capital raised, compared to 3 funds of that
                                                $17.4

                                                         $23.0

                                                                  $33.4

                                                                           $34.9

                                                                                    $31.5

                                                                                             $11.9

                                                                                                      $19.9

                                                                                                               $26.3

                                                                                                                        $24.4

                                                                                                                                 $20.6

                                                                                                                                          $35.3

                                                                                                                                                   $39.0

                                                                                                                                                            $41.1

                                                                                                                                                                     $34.3

                                                                                                                                                                             $53.8
size closing in 2017 and accounting for
20.76% of capital that year.
                                                2004 2005 2006 2007 2008 2009 2010 2011 2012 2013 2014 2015 2016 2017 2018
The trend of larger funds has coincided with                                                                    Source: NVCA 2019 Yearbook, Data Provided by PitchBook
the growth of first-time funds. In 2018, 52
first-time funds raised $5.3 billion, marking
the second consecutive year of 35+ first-
                                                U.S. VC First-time Fundraising by Year
time funds closing. Whether these funds
have spun out of established firms or are                                                                     Capital Raised ($B)
created by new managers, first-time funds                                                                                                                                      52
                                                            50
have been on the rise in recent years. Since                         47                                       # of Funds Closed
2014, 193 first-time funds have raised more
                                                                                                                                            43                         39
than $15 billion. The prevalence of first-
time funds, many of which are smaller in
size, has made an impact on the number of                                                                33
players and capital availability at the seed       35                                                                     31
                                                                                       29                                                                     27
and earlier stages of the venture investment                                                                                                         32
cycle.                                                                        28
                                                                                                24                                 23
VC funds based in 28 states held final                                                                           20
closes on venture funds in 2018, with
Indiana, Kansas, Montana, Alabama,
Kentucky, and Rhode Island all seeing funds
raised in 2018 after no disclosed venture
                                                  $1.9

                                                           $3.4

                                                                    $3.0

                                                                             $2.8

                                                                                      $2.9

                                                                                               $1.1

                                                                                                        $1.0

                                                                                                                 $2.0

                                                                                                                          $1.6

                                                                                                                                   $1.5

                                                                                                                                            $1.9

                                                                                                                                                     $2.3

                                                                                                                                                              $2.5

                                                                                                                                                                      $3.4

                                                                                                                                                                              $5.3

funds raised capital in those states in 2017.
Funds based in California, New York, and         2004 2005 2006 2007 2008 2009 2010 2011 2012 2013 2014 2015 2016 2017 2018
                                                                                                                 Source: NVCA 2019 Yearbook, Data Provided by PitchBook

                                                                 19
                                                        NVC A 2019 YE ARBOOK
Data provided by

Massachusetts accounted for 62%, 17%,                  to investment figures in this report is not
and 13%, respectively, of total capital raised         apples-to-apples. Why? 1) Firms generally
in the U.S. in 2018. The 92% collective                do not deploy all of their capital into
fundraising share of these three states last           startups in one year or in the year they
year represented a 15-year high, buoyed by             close their fund; 2) The VC fundraising
the 10 largest funds closed in 2018 coming             statistics only capture U.S. funds, whereas
from those states.                                     VC funds outside the U.S. frequently
                                                       invest in U.S. startups. The VC investment
Outside of California, Massachusetts, and              statistics are inclusive of investors
New York, median VC fund size reached                  headquartered outside the U.S.; and 3)
$25 million, a continued increase since                There are increasingly more types of
2014, mirroring the overall increase in                investors becoming active in the venture
U.S. VC fund sizes. Funds in those states,             ecosystem. Most of these investors do not                2018 Top States by VC
however, still remain relatively small
compared to the dominant venture fund
                                                       invest in companies via venture funds, e.g.,
                                                       corporate venture groups, hedge funds,
                                                                                                                Capital Raised
hubs – the median fund size for California,                                                                                            # of         Capital Raised
                                                       mutual funds, sovereign wealth funds, and                                       Funds        ($M)
Massachusetts, and New York collectively               family offices. An important takeaway from
was $100 million in 2018.                              this section is that U.S. venture funds have             California             135           33,611.18

                                                       raised more than $200 billion since 2014 to              New York               53            9,539.37
A note on the VC fundraising data before
                                                       put to work at startups across the country.
moving on to the VC investment data in
                                                                                                                Massachusetts          23            7,233.86
the next section: comparing fundraising
                                                                                                                Texas                  11            797.43

                                                                                                                Washington             5             712.36

                                                                                                                Connecticut            4             487.10
10 Largest U.S. VC Funds in 2018                                                                                Illinois               7             457.60

                                                                                                                Pennsylvania           3             403.96
                      Sequoia Capital
 Sequoia Capital                            8,000.00            9/6/18                 California
                      Global Growth                                                                             Virginia               4             351.59

Tiger Global          Tiger Global                                                                              Utah                   4             187.05
                                            3,750.00            10/15/18               New York
 Management           Private Investment
                                                                                                                Missouri               1             184.40
 Bessemer Venture     Bessemer Venture
                                            1,850.00            10/25/18               Massachusetts
 Partners             Partners X                                                                                Indiana                4             132.65

                                                                                                                Wisconsin              5             126.28
 Norwest Venture      Norwest Venture
                                            1,500.00            2/14/18                California
 Partners             Partners XIV                                                                              Maryland               3             69.88

                                                                                                                District of            1             67.72
 General Catalyst     General Catalyst      1,375.00            3/26/18                Massachusetts
                                                                                                                New Hampshire          3             56.13

 GGV Capital          GGV Capital VII       1,360.00            10/16/18               California
                                                                                                                Colorado               4             45.20

                      NewView Capital                                                                           Kansas                 2             42.70
 Newview Capital                            1,350.00            12/3/18                California
                      Fund I
                                                                                                                Oregon                 2             40.35

 Lightspeed Venture   Lightspeed Venture                                                                        Arizona                1             39.00
                                            1,050.00            7/10/18                California
 Partners             Partners Select III
                                                                                                                Montana                1             38.00

                                                                                                                Florida                3             30.58
                      Thrive Capital
Thrive Capital                              1,000.00            10/23/18               New York
                      Partners VI                                                                               Michigan               2             26.70

                                                                                                                New Jersey             1             25.00
 Index Ventures       Index Ventures
                                            1,000.00            7/9/18                 California
 (UK)                 Growth V                                                                                  Alabama                1             25.00

                                                       Source: NVCA 2019 Yearbook, Data Provided by PitchBook   Source: NVCA 2019 Yearbook, Data Provided by PitchBook

                                                                            20
                                                                   NVC A 2019 YE ARBOOK
Data provided by

VC Fundraising by State by Year ($M)
                        2004       2005        2006            2007          2008                 2009                2010                2011

 Alabama                56.60      23.00       21.90           -              25.70               -                    -                   -

 Arizona                -          -           -               -              20.00               -                    -                   38.20

 Arkansas               -          -           -               -              -                   -                    -                   -

 California             7,665.96   12,173.02   15,472.80       14,716.11      16,819.53           4,951.73             10,797.56           14,908.13

 Colorado               80.00      25.00       22.33           420.80         111.94              -                    328.00              -

 Connecticut            1,946.00   795.01      3,605.00        45.00          650.00              25.00                1,200.70            15.00

 Delaware               -          -           13.00           -              -                   -                    15.00               -

 District of Columbia   475.10     -           200.00          828.00         380.00              -                    -                   450.00

 Florida                4.08       345.00      -               348.50         164.13              145.60               94.00               97.62

 Georgia                54.70      3.50        215.00          255.10         138.00              155.00               293.21              -

 Hawaii                 3.00       -           -               -              1.78                -                    -                   -

 Idaho                  -          -           -               75.00          -                   -                    -                   -

 Illinois               149.00     150.00      370.52          818.19         877.91              273.39               479.62              717.02

 Indiana                80.00      6.00        26.26           -              -                   10.00                90.00               -

 Iowa                   -          -           -               -              -                   -                    -                   -

 Kansas                 -          -           -               -              -                   -                    -                   2.60

 Kentucky               -          20.10       36.44           -              175.00              -                    -                   -

 Louisiana              175.52     50.00       70.00           28.00          60.00               70.00                56.00               -

 Maine                  160.00     -           -               65.00          -                   -                    -                   -

 Maryland               200.00     25.00       327.00          575.00         63.30               21.00                -                   -

 Massachusetts          2,704.28   3,886.08    4,957.75        6,835.06       3,232.66            3,159.81             2,747.03            4,084.75

 Michigan               84.70      -           20.00           65.00          910.00              254.30               41.40               182.65

 Minnesota              49.80      275.00      398.00          331.00         475.10              30.00                -                   -

 Missouri               43.00      66.00       -               210.20         128.90              10.00                2.00                -

 Montana                -          -           1.75            -              -                   -                    -                   -

 Nebraska               -          -           -               -              -                   -                    2.60                37.30

 Nevada                 -          -           -               -              50.00               -                    -                   -

 New Hampshire          -          -           50.00           -              -                   -                    -                   -

 New Jersey             212.90     1,176.80    1,063.00        895.22         9.00                516.00               250.00              500.00

 New Mexico             -          47.50       5.20            -              -                   -                    15.50               10.00

 New York               808.59     1,839.37    3,403.59        5,047.21       1,374.55            759.40               2,318.44            4,486.14

 North Carolina         38.30      232.00      340.00          40.25          83.00               102.00               -                   -

 North Dakota           -          -           -               -              11.00               -                    -                   -

 Ohio                   266.30     18.92       100.00          15.50          126.12              23.70                66.00               24.61

 Oklahoma               -          -           15.00           -              -                   -                    -                   -

 Oregon                 -          -           -               0.90           2.55                3.00                 20.35               3.35

 Pennsylvania           423.60     228.80      407.20          192.49         739.61              940.51               129.86              100.00

 Rhode Island           -          -           -               -              -                   -                    -                   -

 South Carolina         -          -           -               -              -                   -                    -                   -

 South Dakota           -          10.00       -               -              32.48               -                    16.00               -

 Tennessee              50.00      83.30       54.00           40.00          89.70               14.00                74.24               22.00

 Texas                  768.70     268.15      892.08          103.30         1,221.75            5.10                 175.54              455.10

 Utah                   97.10      -           129.20          352.00         186.60              160.00               66.35               33.00

 Vermont                -          -           -               -              14.00               -                    5.00                -

 Virginia               123.70     564.05      478.00          297.00         331.84              274.58               441.00              110.00

 Washington             708.90     722.17      540.45          2,291.00       2,902.89            2.50                 5.00                -

 Wisconsin              -          10.73       171.50          -              57.78               -                    201.51              40.00

                                                               21                               Source: NVCA 2019 Yearbook, Data Provided by PitchBook
                                                      NVC A 2019 YE ARBOOK   *For this table we give precedent to the fund location, but if unvailable, we use
                                                                                                                                 the HQ location of the firm
Data provided by

                       2012        2013       2014          2015                   2016                   2017                   2018

Alabama                5.00        -          -              -                      -                      -                      25.00

Arizona                56.63       129.50     156.90         6.19                   28.64                  6.30                   -

Arkansas               -           -          10.00          -                      91.53                  -                      -

California             13,815.81   9,572.14   21,532.02      20,590.66              25,935.22              20,763.10              33,174.18

Colorado               60.70       230.54     193.83         640.84                 60.72                  20.02                  10.20

Connecticut            617.50      193.10     500.00         1.00                   263.71                 600.00                 387.10

Delaware               4.90        -          26.00          2.38                   -                      -                      -

District of Columbia   70.50       200.00     8.00           14.50                  805.61                 2,320.00               67.72

Florida                268.00      -          352.94         184.00                 56.36                  42.20                  28.48

Georgia                50.00       114.70     40.31          262.00                 48.00                  111.00                 -

Hawaii                 -           -          -              -                      -                      -                      -

Idaho                  -           -          -              -                      -                      -                      -

Illinois               240.00      268.55     500.58         574.02                 943.03                 457.85                 435.91

Indiana                18.95       -          1.74           -                      -                      -                      132.65

Iowa                   3.00        1.80       -              -                      -                      -                      -

Kansas                 -           -          -              -                      0.19                   -                      42.70

Kentucky               10.70       -          -              5.55                   -                      -                      19.88

Louisiana              6.00        14.20      10.39          -                      -                      -                      -

Maine                  10.14       -          -              123.00                 -                      10.95                  -

Maryland               145.00      213.04     82.18          81.15                  0.81                   56.00                  69.88

Massachusetts          2,257.16    4,924.10   2,844.91       5,118.74               6,208.11               5,943.28               7,233.86

Michigan               45.16       73.01      26.31          306.30                 407.50                 50.50                  26.70

Minnesota              150.00      107.36     -              5.50                   -                      36.15                  -

Missouri               20.00       370.00     1.50           116.65                 399.00                 108.10                 184.40

Montana                -           -          -              2.75                   21.13                  -                      38.00

Nebraska               18.21       -          -              0.60                   -                      31.00                  -

Nevada                 50.00       -          -              -                      -                      5.00                   -

New Hampshire          4.50        -          1.00           7.67                   -                      1.73                   56.13

New Jersey             349.00      10.00      18.60          -                      552.47                 52.00                  25.00

New Mexico             -           -          -              -                      -                      -                      -

New York               4,920.45    1,682.74   7,278.51       6,048.85               2,898.88               2,321.40               9,375.87

North Carolina         2.50        215.00     35.60          32.10                  205.20                 273.00                 21.15

North Dakota           -           45.00      3.50           -                      -                      -                      -

Ohio                   63.95       72.32      330.33         -                      420.27                 68.98                  -

Oklahoma               -           -          -              -                      -                      -                      -

Oregon                 7.76        5.80       7.68           17.51                  8.50                   16.15                  28.05

Pennsylvania           298.00      171.59     212.71         235.00                 59.00                  111.20                 303.96

Rhode Island           -           -          -              -                      -                      -                      1.30

South Carolina         -           6.00       3.42           -                      -                      -                      -

South Dakota           -           -          -              -                      -                      -                      -

Tennessee              180.00      103.00     2.50           -                      380.00                 126.01                 8.00

Texas                  31.18       523.85     469.01         166.94                 87.45                  90.80                  777.43

Utah                   131.88      570.88     151.86         245.20                 397.55                 53.00                  187.05

Vermont                -           -          12.00          -                      -                      11.30                  -

Virginia               80.15       225.00     53.50          531.60                 181.55                 156.12                 351.59

Washington             328.20      549.20     190.75         692.04                 606.08                 420.75                 684.60

Wisconsin              116.43      5.10       217.68         0.62                   29.70                  83.10                  125.48

                                                                                          Source: NVCA 2019 Yearbook, Data Provided by PitchBook
                                                       22                *For this table we give precedent to the fund location, but if unavailable, we
                                              NVC A 2019 YE ARBOOK                                                    use the HQ location of the firm
Data provided by

Capital Deployed:
Investment into
Companies
A historic 2018 for the U.S. venture
ecosystem was most notably marked by
                                                         U.S. VC Deal Flow
the record amount of capital invested into                                                                                                   10,740
                                                                                                                                        10,575
companies. More than 8,380 venture-                                                                                                                     9,200
                                                                                           Capital Invested ($B)                                                9,489
backed companies received $131 billion in                                                                                        9,301
                                                                                                                                                                        8,948
funding last year, eclipsing the $100 billion                                              # of Deals Closed
                                                                                                                         7,882
watermark set at the height of the dot-com                                                 Company Count
boom in 2000.                                                                                                    6,759

Much of the capital influx was driven                                                                    5,409
                                                                                           4,727 4,487
by mega deals (i.e., investments of $100                                           4,319
million+ into venture-backed companies),                                   3,344
which accounted for nearly half (47%) of                           2,965
                                                           2,633
total capital invested in 2018. Unicorns (i.e.,
venture-backed companies valued at $1

                                                                                                                                                                         $131
billion+), many of which raised mega deals,
                                                            $22

                                                                    $24

                                                                            $29

                                                                                    $36

                                                                                            $37

                                                                                                   $27

                                                                                                          $31

                                                                                                                  $45

                                                                                                                          $42

                                                                                                                                  $48

                                                                                                                                          $71

                                                                                                                                                  $83

                                                                                                                                                        $77

                                                                                                                                                                 $83
attracted $46 billion, or 35% of total capital
invested, but less than 2% of the total deals               2004 2005 2006 2007 2008 2009 2010 2011 2012 2013 2014 2015 2016 2017 2018
completed in 2018.                                                                                              Source: NVCA 2019 Yearbook, Data Provided by PitchBook

U.S. VC Deal Flow by Stage (#)

                2006      2007       2008         2009    2010       2011           2012          2013          2014        2015           2016         2017            2018

Angel/Seed      458       787        918          1226    1723       2600           3532          4639          5472        5716          4585          4521            3760

 Early VC       1750      2117       2260         1830    2101       2426           2584          2780          3067        3061           2849         3119            3156

 Later VC       1136      1415       1549         1431    1585       1733           1766          1882          2034        1963          1766          1849            2032

                                                                                                                    Source: NVCA 2019 Yearbook, Data Provided by PitchBook

                                                                          23
                                                                 NVC A 2019 YE ARBOOK
Data provided by

Beneath the surface of large companies
                                                 2018 U.S. VC Deals by Stage ($B)
raising (and bringing the year to) record
venture funding was the continued trend of
fewer companies receiving capital – 2018
reached a six-year low. The dip was most                                                    7.5
pronounced in angel/seed fundings and
first-time fundings though 2018 levels were
on par with pre-2014/2015 when company
count peaked.
                                                                                                                41
The expansion of types of capital and pools                         82.42
of capital in the venture ecosystem have
been major factors in a changing investment
landscape. As discussed in previous sections,
the ecosystem has seen large venture funds
raise larger follow-on funds; there has been
a rise of new (i.e., first-time) funds to the
market; and the majority of funds are small                           Angel/Seed         Early VC        Later VC
(i.e., less than $100 million). The latter two                                           Source: NVCA 2019 Yearbook, Data Provided by PitchBook
have shifted the early stage investment
landscape. Furthermore, non-traditional
newer investors like SoftBank’s Vision Fund
and sovereign wealth funds have poured
capital into later stage companies and made
their mark on the ecosystem. This section
also uncovers the impact corporate venture
investors and growth equity investors have       U.S. VC Unicorn Deal Activity by Year
had on venture investment activity.
                                                                                                        182

Sectors                                                            Deal Value ($B)
                                                                                                146
                                                                                                                 163

The software sector continued to attract                           # of Deals Closed
                                                                                                                                         139
the lion’s share of VC activity, comprising
                                                                               125                                               118
36% of capital invested and 42% of deal
                                                                                        126
count in 2018. But in recent years, the life
                                                                                                                         112
sciences sector has seen significant growth,
with more than $23 billion invested across
                                                                          91
1,230+ companies in 2018, a record high                       66
                                                                    73
for both metrics. The sector accounted for              53
18% of total capital invested and 15% of
all companies receiving venture funding in
2018. What’s more, pharmaceuticals and             31
                                                                                                        $19.0

                                                                                                                 $22.0

                                                                                                                         $22.2

                                                                                                                                 $18.9

                                                                                                                                         $46.4
                                                                               $8.9

                                                                                        $5.0

                                                                                                $6.8

biotechnology, healthcare services and
systems, and healthcare devices and supplies
were the only three major sectors to see          2006 2007 2008 2009 2010 2011 2012 2013 2014 2015 2016 2017 2018
                                                                                      Source: NVCA 2019 Yearbook, Data Provided by PitchBook
year-over-year increases in capital invested,
in addition to software.

                                                            24
                                                   NVC A 2019 YE ARBOOK
You can also read